Embed Size (px)
Citation preview
Molecules 2019, 24, 1889; doi:10.3390/molecules24101889 www.mdpi.com/journal/molecules
Article
Rapid Detection of Adulterants in Whey Protein
Supplement by Raman Spectroscopy Combined with
Multivariate Analysis
Xianzhi Jiao 1, Yaoyong Meng 1,*, Kangkang Wang 1, Wei Huang 1, Nan Li 1
and Timon Cheng–Yi Liu 2
1 MOE Key Laboratory of Laser Life Science & Laboratory of Photonic Chinese Medicine, College of
Biophotonics, South China Normal University, Guangdong 510631, China; [email protected] (X.J.);
[email protected] (K.W.); [email protected] (W.H.); [email protected] (N.L.) 2 Laboratory of Laser Sports Medicine, South China Normal University, Guangdong 510631, China;
* Correspondence: [email protected]; Tel.: +86‐20‐393‐10266; Fax: +86‐20‐393‐10315
Received: 23 March 2019; Accepted: 14 May 2019; Published: 16 May 2019
Abstract: The growing demand for whey protein supplements has made them the target of
adulteration with cheap substances. Therefore, Raman spectroscopy in tandem with chemometrics
was proposed to simultaneously detect and quantify three common adulterants (creatine, L‐
glutamine and taurine) in whey protein concentrate (WPC) powder. Soft independent modeling
class analogy (SIMCA) and partial least squares discriminant analysis (PLS‐DA) models were built
based on two spectral regions (400–1800 cm−1 and 500–1100 cm−1) to classify different types of
adulterated samples. The most effective was the SIMCA model in 500–1100 cm−1 with an accuracy
of 96.9% and an error rate of 5%. Partial least squares regression (PLSR) models for each adulterant
were developed using two different Raman spectral ranges (400–1800 cm−1 and selected specific
region) and data pretreatment methods. The determination coefficients (R2) of all models were
higher than 0.96. PLSR models based on typical Raman regions (500–1100 cm−1 for creatine and
taurine, the combination of range 800–1000 cm−1 and 1300–1500 cm−1 for glutamine) were superior
to models in the full spectrum. The lowest root mean squared error of prediction (RMSEP) was
0.21%, 0.33%, 0.42% for creatine, taurine and glutamine, and the corresponding limit of detection
(LOD) values for them were 0.53%, 0.71% and 1.13%, respectively. This proves that Raman
spectroscopy with the help of multivariate approaches is a powerful method to detect adulterants
in WPC.
Keywords: whey protein supplement; Raman spectroscopy; chemometrics; rapid adulteration
analysis; creatine; L‐glutamine; taurine
1. Introduction
The quality and safety of products have always been the focus of attention in the food field.
Whether the ingredients of the food are consistent with the label and whether harmful substances are
added to the food is just as important for consumers, distributors and producers. Food fraud can
cause serious economic losses and even threaten the health of consumers. In 2007, wheat gluten and
rice protein concentrate containing large amounts of melamine and cyanuric acid were used in pet
foods, causing a number of pet death [1]. The melamine incident in China sickened hundreds of
thousands of infants [2]. Many of the finished foods were recalled in the past few years due to
intentional adulteration [3]. In order to protect the health and economy of their citizens, some
Molecules 2019, 24, 1889 2 of 12
countries have adopted trade restrictions to prevent similar tragedies. Therefore, detecting the quality
of food to avoid food adulteration is very significant for both the government and consumers.
Recently, increasing consumer awareness regarding health and fitness has been leading to a
remarkable increase in the consumption of sports supplements. Whey protein sports supplements
are favored by athletes and fitness enthusiasts for its ability to replenish proteins needed for human
exercise and contribute to improvement in athletic performance [4]. Whey protein concentrate (WPC)
powder, which contains 50–85% of protein on a dry basis [5], is one of the most common sports
supplements.
Protein content is one of the main quality index of protein‐based products [4,6] and an important
message to communicate with consumers. It is commonly measured by the traditional Kjeldahl and
Dumas methods, which determine the protein content of a sample by directly measuring the total
nitrogen content in it [7,8]. These methods do not have the ability to distinguish the protein nitrogen
from the non‐protein nitrogen [9]. Therefore, the defects of these measurement methods provide the
possibility for potential adulteration. Some unscrupulous producers have been motivated by
commercial interests to maliciously add cheap soy protein powder or nitrogen rich substances (urea,
melamine) to whey protein powder in order to cover up the adulteration and obtain fake high protein
test results [10–12]. At present, adding inexpensive amino acids and amino acid derivatives to protein
powder products to modify protein content has become a common adulteration method. Creatine,
taurine and L‐glutamine are common amino acids and amino acid derivative adulterated in whey
protein‐based sports supplements because they are not only cheaper than whey protein and rich in
nitrogen, but they are also presented as improving athletes’ athletic ability and facilitating recovery
after exercise.
Committed to detecting and quantifying a certain individual nitrogen‐based adulterant within
the complex mixture of dairy products was already accomplished. Methods such as fluorescence
spectra [13,14], microfluidic immunosensor [15], ultraviolet visible spectra [16,17], molecularly
imprinted electrochemical sensors [18], high‐performance liquid chromatography/compact mass
spectrometry [10,19] have been widely used to characterize the adulterants in dairy food. However,
these methods have many disadvantages, such as time consumption, the need for well‐trained
manpower and the high cost of experiments. Therefore, faster, low‐cost and more accurate methods
for detecting adulterants are urgently needed. Raman spectroscopy is a powerful analytical tool for
rapid, nondestructive detection of solid or liquid samples, and has been successfully used to detect
adulteration in a variety of complex foods [20,21]. In previous studies, Jianwei Qin proved that
Raman chemical imaging with the help of a proper mixture of analysis algorithms could effectively
detect multiple adulterated substances in food powder [21]. Raman spectroscopy was also
successfully applied to the rapid quantitative detection of adulterated urea in liquid milk and
resulted an accuracy of over 90% [12]. Based on the above, the detection of adulterants in whey
protein powder by Raman spectroscopy has a great possibility of success.
The combination of Raman spectroscopy with multivariate analyses, for example, principal
component analysis (PCA), partial least squares discriminant analysis (PLS‐DA), soft independent
modeling class analogy (SIMCA) and partial least squares regression (PLSR) can yield strong
analytical results and have been widely used in various fields. Principal component analysis (PCA)
is an unsupervised analytical method that can reduce the dimensionality of data into irrelevant
principal components (PCs) and visualize the relationships between samples [22]. PLS‐DA and
SIMCA are supervised statistical methods, which are widely used in pattern recognition. The
difference between the two methods is that PLS‐DA relies on the partial least squares (PLS) regression
algorithm, which establishes a PLSR model for all classes from the given data set. While SIMCA is
based on PCA, which establishes PCA models for each class in the suggested data set [23]. The output
of the PLS‐DA model results consists of three steps. The first step, also known as the calibration step,
is to optimize the parameters by performing the algorithm. The second step of the algorithm is called
the validation step and it uses the regressors obtained in the calibration step to predict the class of
samples that do not participate in the calibration step. The final step of the algorithm is to compare
the predicted class of the sample with its actual class, and calculate several relevant error parameters.
Molecules 2019, 24, 1889 3 of 12
Output steps for the results of the SIMCA model are similar. PLS‐DA or SIMCA calibration data sets
contain an X matrix of size I*J (I refers to the number of spectra, J is the number of spectral variables),
which were established using Raman spectra of the tested samples, and a Y matrix containing
predefined classification information of each calibration sample.
Therefore, the present work aimed to explore the applicability of Raman spectroscopy coupled
with chemometrics to detect and quantify multiple adulterants in WPC. The two main objectives
were to develop the classification model (PLS‐DA and SIMCA) to distinguish different types of
adulteration and construct a PLSR model using Raman data to quickly determine the adulteration
level in WPC.
2. Results and Discussion
2.1. Raman Spectra
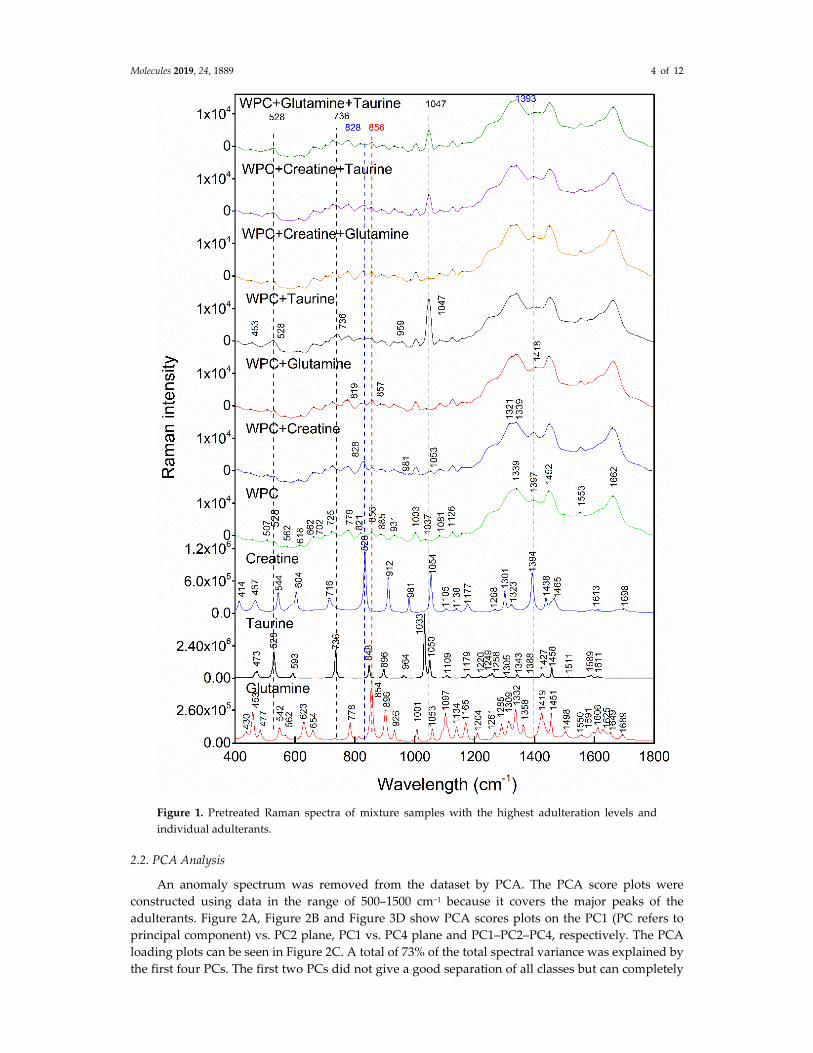
Figure 1 represents the Raman spectra collected from pure WPC, creatine, taurine and
glutamine, as well as the processed (baseline correction and smooth) Raman spectra of mixtures with
the highest adulteration levels, respectively. There are numerous Raman scattering peaks in the range
of 400–1800 cm−1 for each substance. The absorption peaks on the spectra were marked with black
dots and the main peaks were specially highlighted by a colored vertical line. In this paper, W(WPC
), WG (WPC + glutamine), WC (WPC + creatine), WT (WPC + taurine), WCG (WPC + creatine
+ glutamine), WCT (WPC + creatine + taurine)and WGT (WPC + glutamine + taurine)were used
as symbols to indicate real information of each sample. W, C, G and T refer to whey protein
concentrate, creatine, glutamine and taurine, respectively. Typical peaks of taurine appeared at 528
cm−1, 736 cm−1 and 1033 cm−1, which was in accordance with the result of Moreira’s study. They
correspond to the δs (SO3), ν (CS) and ν (CN), respectively [24]. Peaks at 528 cm‐1 and 736 cm‐1 were
visible not only in samples containing taurine (WT, WCT, WTG) but also on the loading plots. The
peak at 1033 cm−1 did not appear in the mixture sample, but there was a distinct peak at 1047 cm‐1 in
samples containing taurine. This peak was also observed in the loading plots. In the case of creatine,
a peak at 828 cm−1 arising due to N–C = N scissoring [25] was observable in samples containing
creatine. It can also be seen in the loading plots. The peak at 1394 cm−1 assigned to deformation and
bending modes of CH2 and CH3 [25] had the same situation. The strong peak of glutamine was at 856
cm−1 [26], and it was more prominent in samples containing glutamine.
Molecules 2019, 24, 1889 4 of 12
Figure 1. Pretreated Raman spectra of mixture samples with the highest adulteration levels and
individual adulterants.
2.2. PCA Analysis
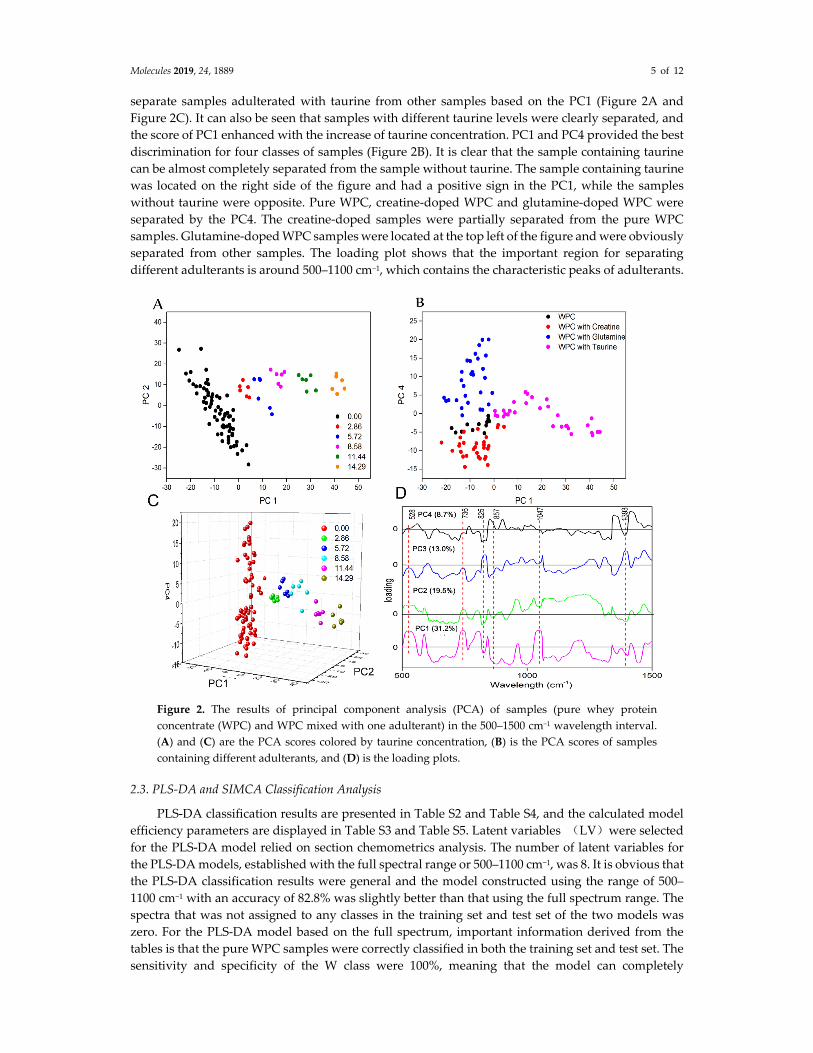
An anomaly spectrum was removed from the dataset by PCA. The PCA score plots were
constructed using data in the range of 500–1500 cm−1 because it covers the major peaks of the
adulterants. Figure 2A, Figure 2B and Figure 3D show PCA scores plots on the PC1 (PC refers to
principal component) vs. PC2 plane, PC1 vs. PC4 plane and PC1–PC2–PC4, respectively. The PCA
loading plots can be seen in Figure 2C. A total of 73% of the total spectral variance was explained by
the first four PCs. The first two PCs did not give a good separation of all classes but can completely
Molecules 2019, 24, 1889 5 of 12
separate samples adulterated with taurine from other samples based on the PC1 (Figure 2A and
Figure 2C). It can also be seen that samples with different taurine levels were clearly separated, and
the score of PC1 enhanced with the increase of taurine concentration. PC1 and PC4 provided the best
discrimination for four classes of samples (Figure 2B). It is clear that the sample containing taurine
can be almost completely separated from the sample without taurine. The sample containing taurine
was located on the right side of the figure and had a positive sign in the PC1, while the samples
without taurine were opposite. Pure WPC, creatine‐doped WPC and glutamine‐doped WPC were
separated by the PC4. The creatine‐doped samples were partially separated from the pure WPC
samples. Glutamine‐doped WPC samples were located at the top left of the figure and were obviously
separated from other samples. The loading plot shows that the important region for separating
different adulterants is around 500–1100 cm−1, which contains the characteristic peaks of adulterants.
Figure 2. The results of principal component analysis (PCA) of samples (pure whey protein
concentrate (WPC) and WPC mixed with one adulterant) in the 500–1500 cm−1 wavelength interval.
(A) and (C) are the PCA scores colored by taurine concentration, (B) is the PCA scores of samples
containing different adulterants, and (D) is the loading plots.
2.3. PLS‐DA and SIMCA Classification Analysis
PLS‐DA classification results are presented in Table S2 and Table S4, and the calculated model
efficiency parameters are displayed in Table S3 and Table S5. Latent variables (LV)were selected
for the PLS‐DA model relied on section chemometrics analysis. The number of latent variables for
the PLS‐DA models, established with the full spectral range or 500–1100 cm−1, was 8. It is obvious that
the PLS‐DA classification results were general and the model constructed using the range of 500–
1100 cm−1 with an accuracy of 82.8% was slightly better than that using the full spectrum range. The
spectra that was not assigned to any classes in the training set and test set of the two models was
zero. For the PLS‐DA model based on the full spectrum, important information derived from the
tables is that the pure WPC samples were correctly classified in both the training set and test set. The
sensitivity and specificity of the W class were 100%, meaning that the model can completely
Molecules 2019, 24, 1889 6 of 12
distinguish pure WPC from adulterated samples. The ability of the model to correctly classify WC,
WG and WT samples was also satisfactory, but the classification ability for WCG and WCT samples
was weak, with a sensitivity in the training set of 65% and 50%, respectively. The model in the range
of 500–1100 cm−1 can also perfectly separate pure WPC samples from adulterated samples. The
sensitivity of the W class was 100% and the specificity was 98.3%. However, this model performed
miserably for WCT and WTG classes. The sensitivity of WCT and WTG classes was75% and 65% in
training set.
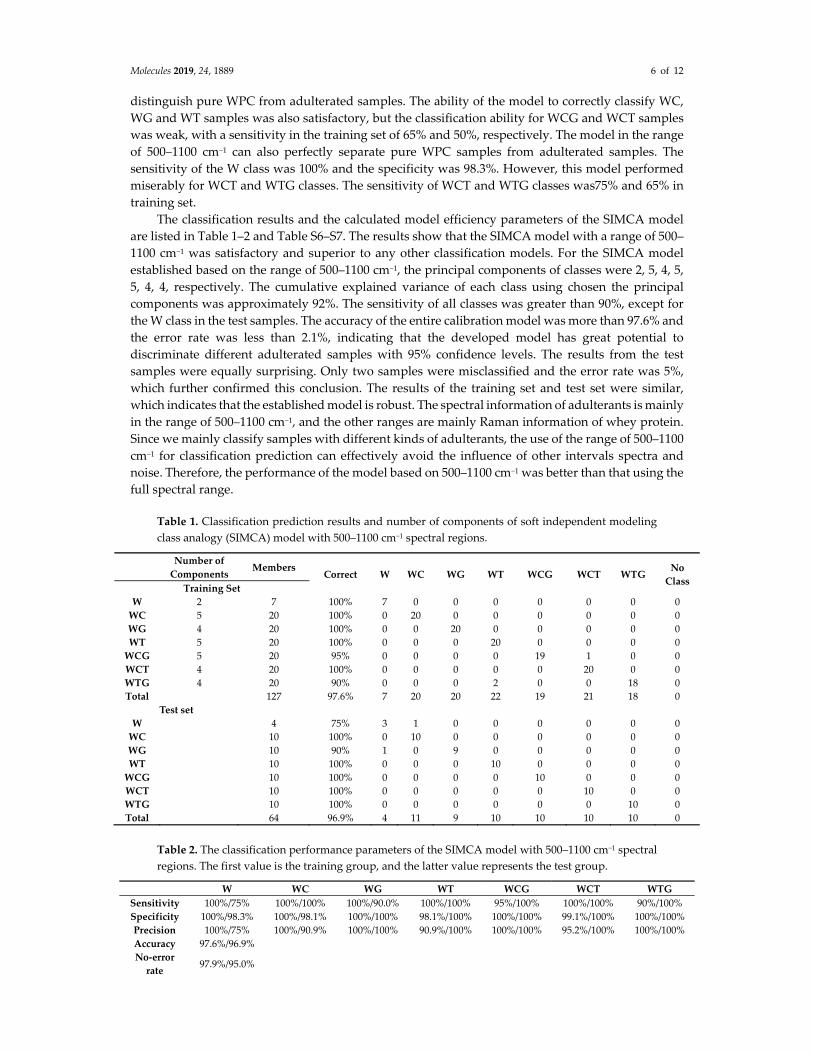
The classification results and the calculated model efficiency parameters of the SIMCA model
are listed in Table 1–2 and Table S6–S7. The results show that the SIMCA model with a range of 500–
1100 cm−1 was satisfactory and superior to any other classification models. For the SIMCA model
established based on the range of 500–1100 cm−1, the principal components of classes were 2, 5, 4, 5,
5, 4, 4, respectively. The cumulative explained variance of each class using chosen the principal
components was approximately 92%. The sensitivity of all classes was greater than 90%, except for
the W class in the test samples. The accuracy of the entire calibration model was more than 97.6% and
the error rate was less than 2.1%, indicating that the developed model has great potential to
discriminate different adulterated samples with 95% confidence levels. The results from the test
samples were equally surprising. Only two samples were misclassified and the error rate was 5%,
which further confirmed this conclusion. The results of the training set and test set were similar,
which indicates that the established model is robust. The spectral information of adulterants is mainly
in the range of 500–1100 cm−1, and the other ranges are mainly Raman information of whey protein.
Since we mainly classify samples with different kinds of adulterants, the use of the range of 500–1100
cm−1 for classification prediction can effectively avoid the influence of other intervals spectra and
noise. Therefore, the performance of the model based on 500–1100 cm−1 was better than that using the
full spectral range.
Table 1. Classification prediction results and number of components of soft independent modeling
class analogy (SIMCA) model with 500–1100 cm−1 spectral regions.
Number of
Components Members
Correct W WC WG WT WCG WCT WTG No
Class Training Set
W 2 7 100% 7 0 0 0 0 0 0 0
WC 5 20 100% 0 20 0 0 0 0 0 0
WG 4 20 100% 0 0 20 0 0 0 0 0
WT 5 20 100% 0 0 0 20 0 0 0 0
WCG 5 20 95% 0 0 0 0 19 1 0 0
WCT 4 20 100% 0 0 0 0 0 20 0 0
WTG 4 20 90% 0 0 0 2 0 0 18 0
Total 127 97.6% 7 20 20 22 19 21 18 0
Test set
W 4 75% 3 1 0 0 0 0 0 0
WC 10 100% 0 10 0 0 0 0 0 0
WG 10 90% 1 0 9 0 0 0 0 0
WT 10 100% 0 0 0 10 0 0 0 0
WCG 10 100% 0 0 0 0 10 0 0 0
WCT 10 100% 0 0 0 0 0 10 0 0
WTG 10 100% 0 0 0 0 0 0 10 0
Total 64 96.9% 4 11 9 10 10 10 10 0
Table 2. The classification performance parameters of the SIMCA model with 500–1100 cm−1 spectral
regions. The first value is the training group, and the latter value represents the test group.
W WC WG WT WCG WCT WTG
Sensitivity 100%/75% 100%/100% 100%/90.0% 100%/100% 95%/100% 100%/100% 90%/100%
Specificity 100%/98.3% 100%/98.1% 100%/100% 98.1%/100% 100%/100% 99.1%/100% 100%/100%
Precision 100%/75% 100%/90.9% 100%/100% 90.9%/100% 100%/100% 95.2%/100% 100%/100%
Accuracy 97.6%/96.9%
No‐error
rate 97.9%/95.0%
Molecules 2019, 24, 1889 7 of 12
Error rate 2.1%/5.0%
Younden’s
index 100%/73.3% 100%/98.1% 100%/90.0% 98.1%/100% 95%/100% 99.1%/100% 90%/100%
AUC
(training
set)
1.00 0.99 1.00 0.99 1.00 0.98 0.98
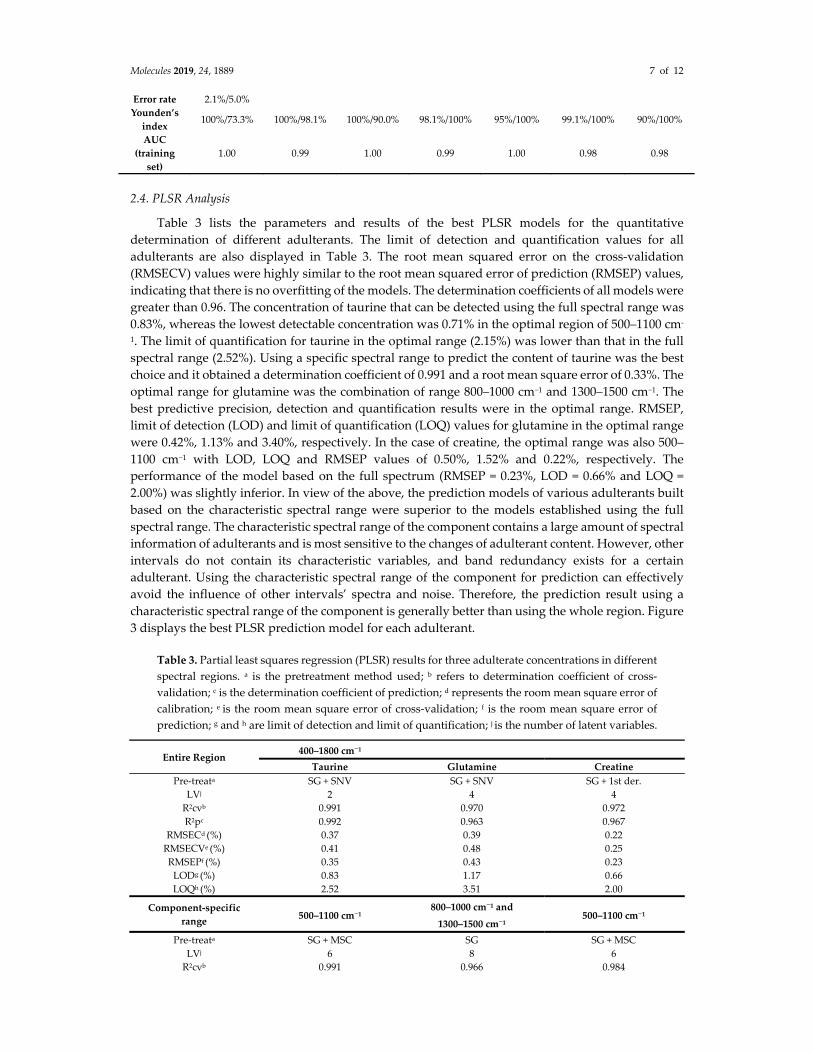
2.4. PLSR Analysis
Table 3 lists the parameters and results of the best PLSR models for the quantitative
determination of different adulterants. The limit of detection and quantification values for all
adulterants are also displayed in Table 3. The root mean squared error on the cross‐validation
(RMSECV) values were highly similar to the root mean squared error of prediction (RMSEP) values,
indicating that there is no overfitting of the models. The determination coefficients of all models were
greater than 0.96. The concentration of taurine that can be detected using the full spectral range was
0.83%, whereas the lowest detectable concentration was 0.71% in the optimal region of 500–1100 cm‐
1. The limit of quantification for taurine in the optimal range (2.15%) was lower than that in the full
spectral range (2.52%). Using a specific spectral range to predict the content of taurine was the best
choice and it obtained a determination coefficient of 0.991 and a root mean square error of 0.33%. The
optimal range for glutamine was the combination of range 800–1000 cm−1 and 1300–1500 cm−1. The
best predictive precision, detection and quantification results were in the optimal range. RMSEP,
limit of detection (LOD) and limit of quantification (LOQ) values for glutamine in the optimal range
were 0.42%, 1.13% and 3.40%, respectively. In the case of creatine, the optimal range was also 500–
1100 cm−1 with LOD, LOQ and RMSEP values of 0.50%, 1.52% and 0.22%, respectively. The
performance of the model based on the full spectrum (RMSEP = 0.23%, LOD = 0.66% and LOQ =
2.00%) was slightly inferior. In view of the above, the prediction models of various adulterants built
based on the characteristic spectral range were superior to the models established using the full
spectral range. The characteristic spectral range of the component contains a large amount of spectral
information of adulterants and is most sensitive to the changes of adulterant content. However, other
intervals do not contain its characteristic variables, and band redundancy exists for a certain
adulterant. Using the characteristic spectral range of the component for prediction can effectively
avoid the influence of other intervals’ spectra and noise. Therefore, the prediction result using a
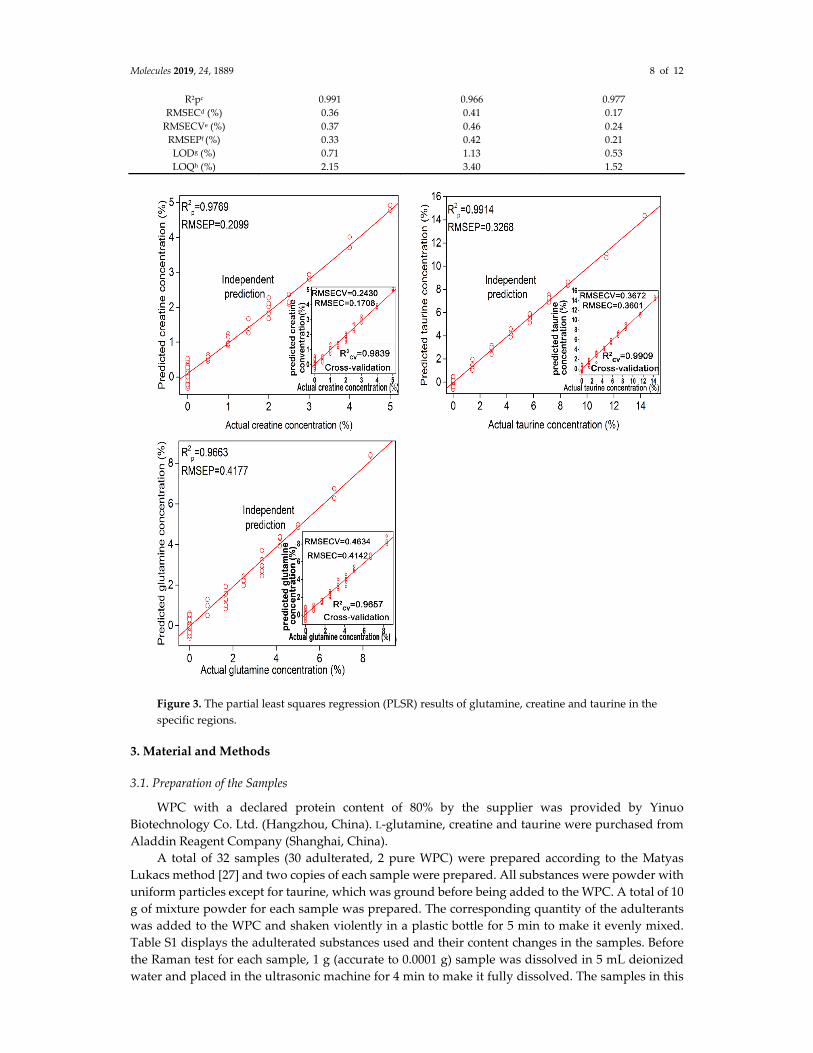
characteristic spectral range of the component is generally better than using the whole region. Figure
3 displays the best PLSR prediction model for each adulterant.
Table 3. Partial least squares regression (PLSR) results for three adulterate concentrations in different
spectral regions. a is the pretreatment method used; b refers to determination coefficient of cross‐
validation; c is the determination coefficient of prediction; d represents the room mean square error of
calibration; e is the room mean square error of cross‐validation; f is the room mean square error of
prediction; g and h are limit of detection and limit of quantification; j is the number of latent variables.
Entire Region 400–1800 cm−1
Taurine Glutamine Creatine
Pre‐treata SG + SNV SG + SNV SG + 1st der.
LVj 2 4 4
R2cvb 0.991 0.970 0.972
R2pc 0.992 0.963 0.967
RMSECd (%) 0.37 0.39 0.22
RMSECVe (%) 0.41 0.48 0.25
RMSEPf (%) 0.35 0.43 0.23
LODg (%) 0.83 1.17 0.66
LOQh (%) 2.52 3.51 2.00
Component‐specific
range 500–1100 cm−1
800–1000 cm−1 and
1300–1500 cm−1 500–1100 cm−1
Pre‐treata SG + MSC SG SG + MSC
LVj 6 8 6
R2cvb 0.991 0.966 0.984
Molecules 2019, 24, 1889 8 of 12
R2pc 0.991 0.966 0.977
RMSECd (%) 0.36 0.41 0.17
RMSECVe (%) 0.37 0.46 0.24
RMSEPf (%) 0.33 0.42 0.21
LODg (%) 0.71 1.13 0.53
LOQh (%) 2.15 3.40 1.52
Figure 3. The partial least squares regression (PLSR) results of glutamine, creatine and taurine in the
specific regions.
3. Material and Methods
3.1. Preparation of the Samples
WPC with a declared protein content of 80% by the supplier was provided by Yinuo
Biotechnology Co. Ltd. (Hangzhou, China). L‐glutamine, creatine and taurine were purchased from
Aladdin Reagent Company (Shanghai, China).
A total of 32 samples (30 adulterated, 2 pure WPC) were prepared according to the Matyas
Lukacs method [27] and two copies of each sample were prepared. All substances were powder with
uniform particles except for taurine, which was ground before being added to the WPC. A total of 10
g of mixture powder for each sample was prepared. The corresponding quantity of the adulterants
was added to the WPC and shaken violently in a plastic bottle for 5 min to make it evenly mixed.
Table S1 displays the adulterated substances used and their content changes in the samples. Before
the Raman test for each sample, 1 g (accurate to 0.0001 g) sample was dissolved in 5 mL deionized
water and placed in the ultrasonic machine for 4 min to make it fully dissolved. The samples in this
Molecules 2019, 24, 1889 9 of 12
experiment were prepared by the dry‐blended method and the particle size of the whey protein
powder and adulterants was larger than the size of confocal Raman laser spot (about 3 μm). Solid L‐
glutamine, creatine and taurine were directly measured.
3.2. Raman Spectroscopy
A Renishaw InVia confocal Raman spectrometer (Renishaw Plc. Gloucestershire, UK), equipped
with a charge‐coupled device (CCD) camera operated at −75 °C, and a semiconductor laser emitting
a wavelength of 785 nm was employed to acquire the Raman spectra. Biological samples emit
fluorescence by themselves under the irradiation of light. Laser excitation of these samples by 488 nm
or 532 nm will produce strong fluorescence signals. The intensity of these fluorescence signals is
much stronger than that of Raman signals, which will mask the Raman signals. The use of a 785‐nm
laser reduces the interference of fluorescence on the Raman signal, so we chose to use a laser with an
excitation wavelength of 785 nm in this experiment. Exposure time, accumulation time and laser
power were explored in the preliminary Raman measurements to obtain good signal noise ratio and
minimal fluorescence interference. The choice of these parameters also ensures that the sample is not
knocked and damaged during the experiment. The optimized conditions of the test were 250 scans,
0.2 s exposure time and 140 mW laser power. Spectra were obtained in the fingerprint region from
400 to 1800 cm–1 with a spectral resolution of approximately 1 cm–1, in which 20× objective was applied
to focus the laser on samples. The Raman system was calibrated using silicon wafers prior to the
experiment to reduce the variation caused by instrument components.
The dissolved sample was directly dropped on a glass slide with a 3‐mm deep groove and
immediately placed on the Raman device for spectral scanning. Each sample was measured at three
different positions, leading to a total of 192 spectra. All Raman experiments were carried out in a dark
room at 26 °C to eliminate the interference of natural light on the experiment.
To observe the characteristic absorption peaks of the sample, the obtained spectrum which
contains fluorescent noise needs to be pretreated. All spectra were first manually removed by cosmic
rays, and then subjected to a baseline correction using a first‐order polynomial fitting. Subsequently,
Sawiztky–Golay (SG) filtering was utilized to smooth the spectrum, and the parameters were second‐
order polynomial with 25 smoothing points.
3.3. Chemometric Analysis
In this study, the outliers were discovered and deleted with the aid of robust PCA [28]. The PCA
model was built using additional normalized data in the range of 500–1500 cm−1 for 102 Raman
spectra (pure WPC, WPC adulterated with creatine, WPC adulterated with glutamine, WPC
adulterated with taurine) to observe whether the samples have natural grouping.
For classifying different adulterated samples, the multivariate classification methods PLS‐DA
and SIMCA were used. In order to obtain the best prediction model, the full spectral range and 500–
1100 cm−1 range [29] were respectively used to construct the classification model. The validation
procedure adopted k‐fold cross‐validation where K is equal to 7. The latent variables with the
smallest cross‐validation error in classification were selected for PLS‐DA. A smaller number of
potential variables is preferred to avoid model overfitting when RMSECV values are not significantly
different. The number of principal components with less error rate in the classification were chosen
for SIMCA [30]. All data were split into two sets called the training set and test set by the Kennard–
Stone (KS) algorithm. A total of 66% of the data was assigned to the training set and 34% of the data
was divided into the test set.
For evaluating the classification performance of the developed model, sensitivity, specificity
(also known as selectivity), precision, Younden’s index, accuracy, error rate and no‐error rate were
calculated [30–33]. Sensitivity represents the ability that the method correctly identifies a positive
sample as positive. Specificity refers to the probability of correct classification of negative samples.
Precision (also called false positive rate) is the probability that a negative sample is wrongly identified
as a positive sample by the model. The ratio of all correctly identified samples to total samples
represents accuracy. The global performance of different classification methods was compared using
Molecules 2019, 24, 1889 10 of 12
the area under the curve (AUC), where the value is 1 when model has the strongest classification
ability. These parameters were calculated as follows:
𝑆𝑒𝑛𝑠𝑖𝑡𝑖𝑣𝑖𝑡𝑦𝑇𝑃
𝑇𝑃 𝐹𝑁
𝑆𝑝𝑒𝑐𝑖𝑓𝑖𝑐𝑖𝑡𝑦𝑇𝑁
𝐹𝑃 𝑇𝑁
𝑝𝑟𝑒𝑐𝑖𝑠𝑖𝑜𝑛𝑇𝑃
𝑇𝑃 𝐹𝑃
𝑦𝑜𝑢𝑛𝑑𝑒𝑛’𝑠 𝑖𝑛𝑑𝑒𝑥 𝑆𝑒𝑛𝑠𝑖𝑡𝑖𝑣𝑖𝑡𝑦 𝑆𝑒𝑙𝑒𝑐𝑡𝑖𝑣𝑖𝑡𝑦 1
𝐴𝑐𝑐𝑢𝑟𝑎𝑐𝑦𝑇𝑃 𝑇𝑁
𝑇𝑃 𝐹𝑁 𝐹𝑃 𝑇𝑁
𝑁𝑜𝑛 𝑒𝑟𝑟𝑜𝑟 𝑟𝑎𝑡𝑒∑ 𝑆𝑒𝑛𝑒𝑖𝑡𝑖𝑣𝑖𝑡𝑦
𝑛
𝐸𝑟𝑟𝑜𝑟 𝑟𝑎𝑡𝑒 1 𝑛𝑜𝑛 𝑒𝑟𝑟𝑜𝑟 𝑟𝑎𝑡𝑒 Where (true positive) TP, true negative (TN), false positive (FP) and false negative (FN) represent
the number of samples observed.
Partial least squares regression (PLSR) is a multivariate analysis method diffusely applied with
Raman spectroscopy. It was used to predict the concentration of adulterants in this paper, and the
calibration model which was built based on the Raman spectrum and actual values using a 7‐fold
cross‐validation mode to test. The number of latent variables was determined by the minimum root
mean squared error on the cross‐validation set (RMSECV) [22]. The determination coefficients (R2)
and root mean square errors (RMSE) of both training and test data sets were applied to evaluate the
performance of the PLSR model. The model has the best performance when the RMSE value is the
smallest and the R2 value is close to 1. The robustness of the models was tested by test set data that
was not involved in the model establishment. R2, RMSE values were calculated as follows:
RMSE∑ 𝑦 𝑦
𝑛
𝑅 1∑ 𝑦 𝑦∑ 𝑦 𝑦
Here, n represents the number of samples in the training set or test set, 𝑦 is the reference value, 𝑦 is the predicted value by the PLSR model and 𝑦 equals the average value of all reference values.
The dataset of 191 spectra was also divided into training set (127 spectra) and test set (64 spectra)
as section PLS‐DA. The training set was used for calibration and the test set was used to test the
predictive ability of the model. In order to obtain better prediction models for different adulterants,
the full spectrum (400–1800cm−1) and the characteristic spectral range of different adulterants were
used to predict the adulteration concentration. Additional data pretreatment methods including
standard normal variation (SNV), normalization, first derivative, second derivative and multiple
scattering calibration (MSC) were selected as the most proper for different adulterants. The limit of
detection (LOD) and limit of quantification (LOQ), that represent the minimum detectable
concentration or quantitative concentration based on the established PLSR models, were calculated
according to the method described by Banu Sezer, using the following equations [34]:
𝐿𝑂𝐷 3.3 𝑆𝐷𝑆
𝐿𝑂𝑄 10 𝑆𝐷𝑆
Where SD represents the standard deviation of the predicted concentration for unadulterated
samples and S is the slop of the calibration curve.
Multivariate data analysis PCA, PLSR, PLS‐DA and SIMCA were performed in SIMCA‐P14.1.
4. Conclusions
This paper proved that Raman spectroscopy combined with multivariate analysis can quickly
detect three common adulterants (creatine, taurine and glutamine) in whey protein powder. The PCA
Molecules 2019, 24, 1889 11 of 12
analysis highlight that pure WPC samples and three types of samples containing only one adulterant
can be clearly separated from each other. Raman spectroscopy was applied jointly with PLS‐DA and
SIMCA to discriminate the samples with different adulterants. The SIMCA model, which was built
based on 500–1100 cm‐1, was the most effective model with an accuracy of 96.9% and an error rate of
5%. The combination of Raman spectroscopy and PLSR analysis can sensitively detect the adulterate
content, and different pretreatment methods and spectral intervals were used to model for each
adulterant content. The PLSR model based on typical Raman regions (500–1100 cm−1 for creatine and
taurine, the combination of range 800–1000 cm−1 and 1300–1500 cm−1 for glutamine) for adulterants
had high R2 and low RMSEP values, and had better performance than that based on the full spectral
region. RMSEP was 0.21%, 0.33%, 0.42% for creatine, taurine and glutamine. The limit of detection
was below 1.13%. This method is fast, simple and accurate compared with other methods. The sample
only needs simple dissolution pretreatment and is very suitable for adulteration analysis of WPC in
industry or daily life.
Supplementary Materials: The following are available online at www.mdpi.com/xxx/s1, Table S1–
S7.
Author Contributions: Y.M. oversaw the study and co‐ wrote the manuscript; X.J. performed the experiment
and wrote the manuscript; K.W., N.L. and W.H. analyzed the data. T.C.–Y.L. provided financial support.
Funding: This work was supported by the National Science Foundation of China (61575065).
Conflicts of Interest: Xianzhi Jiao, Kangkang Wang, Nan Li, Yaoyong Meng, Timon Cheng–Yi Liu and Wei
Huang declare that they have no conflicts of interest.
References
1. Braekevelt, E.; Lau, B.P.Y.; Feng, S.; Ménard, C.; Tittlemier, S.A. Determination of melamine, ammeline,
ammelide and cyanuric acid in infant formula purchased in Canada by liquid chromatography‐tandem
mass spectrometry. Food Addit. Contam. Part A 2011, 28, 698–704.
2. Gossner, C.M.; Schlundt, J.; Embarek, P.B.; Hird, S.; Lo‐Fo‐Wong, D.; Jose, J.O.B.; Teoh, K.N.; Tritscher, A.
The melamine incident: Implications for international food and feed safety. Environ. Health Perspect. 2009,
117, 1803–1808.
3. Champagne, A.B.; Emmel, K.V. Rapid screening test for adulteration in raw materials of dietary
supplements. Vib. Spectrosc. 2011, 55, 216–223.
4. Andrade, J.; Pereira, C.G.; Almeida, J.C.D., Jr.; Viana, C.C.R.; Neves, L.N.D.O.; Silva, P.H.F.D.; Bell, M.J.V.;
Anjos, V.D.C.D. FTIR‐ATR determination of protein content to evaluate whey protein concentrate
adulteration. LWT 2019, 99, 166–172.
5. Wang, T.; Tan, S.Y.; Mutilangi, W.; Aykas, D.P.; Rodriguez‐Saona, L.E. Authentication of whey protein
powders by portable mid‐infrared spectrometers combined with pattern recognition analysis. J. Food Sci.
2015, 80, C2111–C2116.
6. Ingle, P.D.; Christian, R.; Purohit, P.; Zarraga, V.; Handley, E.; Freel, K.; Abdo, S. Determination of protein
content by NIR spectroscopy in protein powder mix products. J. AOAC Int. 2016, 99, 360–363.
7. Moore, J.C.; DeVries, J.W.; Lipp, M.; Griffiths, J.C.; Abernethy, D.R. Total protein methods and their
potential utility to reduce the risk of food protein adulteration. Compr. Rev. Food Sci. Food Saf. 2010, 9, 330–
357.
8. Hall, N.G.; Schönfeldt, H.C. Total nitrogen vs. amino‐acid profile as indicator of protein content of beef.
Food. Chem. 2013, 140, 608–612.
9. Shen, G.; Fan, X.; Yang, Z.; Han, L. A feasibility study of non‐targeted adulterant screening based on NIRM
spectral library of soybean meal to guarantee quality: The example of non‐protein nitrogen. Food. Chem.
2016, 210, 35–42.
10. Draher, J.; Ehling, S.; Cellar, N.; Reddy, T.; Henion, J.; Sousou, N. Determination of emerging nitrogenous
economic adulterants in milk proteins by high‐performance liquid chromatography/compact mass
spectrometry. Rapid Commun. Mass Spectrom. 2016, 30, 1265–1272.
11. Garrido, B.C.; Souza, G.H.M.F.; Lourenço, D.C.; Fasciotti, M. Proteomics in quality control: Whey protein‐
based supplements. J. Proteom. 2016, 147, 48–55.
12. Khan, K.M.; Krishna, H.; Majumder, S.K.; Gupta, P.K. Detection of urea adulteration in milk using near‐
infrared raman spectroscopy. Food Anal. Method 2015, 8, 93–102.
Molecules 2019, 24, 1889 12 of 12
13. Nascimento, C.F.; Rocha, D.L.; Rocha, F.R.P. A fast and environmental friendly analytical procedure for
determination of melamine in milk exploiting fluorescence quenching. Food. Chem. 2015, 169, 314–319.
14. Pereira, C.G.; Andrade, J.; Ranquine, T.; de Moura, I.N.; Da Rocha, R.A.; Furtado, M.A.M.; Bell, M.J.V.;
Anjos, V. Characterization and detection of adulterated whey protein supplements using stationary and
time‐resolved fluorescence spectroscopy. LWT 2018, 97, 180–186.
15. Choi, J.; Min, K.; Hengoju, S.; Kim, G.; Chang, S.; DeMello, A.J.; Choo, J.; Kim, H.Y. A droplet‐based
microfluidic immunosensor for high efficiency melamine analysis. Biosens. Bioelectron. 2016, 80, 182–186.
16. Gao, N.; Huang, P.; Wu, F. Colorimetric detection of melamine in milk based on Triton X‐100 modified
gold nanoparticles and its paper‐based application. Spectrochim. Acta Part A: Mol. Biomol. Spectrosc. 2018,
192, 174–180.
17. Kumar, N.; Kumar, H.; Mann, B.; Seth, R. Colorimetric determination of melamine in milk using
unmodified silver nanoparticles. Spectrochim. Acta Part A Mol. Biomol. Spectrosc. 2016, 156, 89–97.
18. Li, J.; Chen, Z.; Li, Y. A strategy for constructing sensitive and renewable molecularly imprinted
electrochemical sensors for melamine detection. Anal. Chim. Acta 2011, 706, 255–260.
19. Clément, Y.; Gaubert, A.; Bonhommé, A.; Marote, P.; Mungroo, A.; Paillard, M.; Lantéri, P.; Morell, C.
Raman spectroscopy combined with advanced chemometric methods: A new approach for detergent
deformulation. Talanta 2019, 195, 441–446.
20. Mazurek, S.; Szostak, R.; Czaja, T.; Zachwieja, A. Analysis of milk by FT‐Raman spectroscopy. Talanta 2015,
138, 285–289.
21. Qin, J.; Kim, M.S.; Chao, K.; Gonzalez, M.; Cho, B. Quantitative detection of benzoyl peroxide in wheat
flour using line‐scan macroscale raman chemical imaging. Appl. Spectrosc. 2017, 71, 2469–2476.
22. Richardson, P.I.C.; Muhamadali, H.; Ellis, D.I.; Goodacre, R. Rapid quantification of the adulteration of
fresh coconut water by dilution and sugars using Raman spectroscopy and chemometrics. Food. Chem. 2019,
272, 157–164.
23. Rodríguez, S.D.; Rolandelli, G.; Buera, M.P. Detection of quinoa flour adulteration by means of FT‐MIR
spectroscopy combined with chemometric methods. Food. Chem. 2019, 274, 392–401.
24. Moreira, R.L.; Lobo, R.P.S.M.; Dias, A. Infrared dispersion analysis and Raman scattering spectra of taurine
single crystals. Spectrochim. Acta Part A Mol. Biomol. Spectrosc. 2018, 188, 276–284.
25. Gangopadhyay, D.; Sharma, P.; Singh, R.K. Temperature dependent Raman and DFT study of creatine.
Spectrochim. Acta Part A Mol. Biomol. Spectrosc. 2015, 150, 9–14.
26. Holanda, R.O.; Silva, C.B.; Silva Filho, J.G.; Lima, C.L.; Lima, J.A.; Freire, P.T.C. Raman spectroscopy under
high pressures and DFT calculations of the amino acid l‐glutamine. Vib. Spectrosc. 2018, 98, 69–76.
27. Lukacs, M.; Bazar, G.; Pollner, B.; Henn, R.; Kirchler, C.G.; Huck, C.W.; Kovacs, Z. Near infrared
spectroscopy as an alternative quick method for simultaneous detection of multiple adulterants in whey
protein‐based sports supplement. Food Control 2018, 94, 331–340.
28. Saha, P.; Roy, N.; Mukherjee, D.; Sarkar, A.K. Application of principal component analysis for outlier
detection in heterogeneous traffic data. Procedia Comput. Sci. 2016, 83, 107–114.
29. Gallart‐Mateu, D.; Largo‐Arango, C.D.; Larkman, T.; Garrigues, S.; de la Guardia, M. Fast authentication
of tea tree oil through spectroscopy. Talanta 2018, 189, 404–410.
30. de Oliveira Mendes, T.; Porto, B.L.S.; Almeida, M.R.; Fantini, C.; Sena, M.M. Discrimination between
conventional and omega‐3 fatty acids enriched eggs by FT‐Raman spectroscopy and chemometric tools.
Food Chem. 2019, 273, 144–150.
31. Botelho, B.G.; Reis, N.; Oliveira, L.S.; Sena, M.M. Development and analytical validation of a screening
method for simultaneous detection of five adulterants in raw milk using mid‐infrared spectroscopy and
PLS‐DA. Food Chem. 2015, 181, 31–37.
32. Ballabio, D.; Grisoni, F.; Todeschini, R. Multivariate comparison of classification performance measures.
Chemometr. Intell. Lab. 2018, 174, 33–44.
33. Miaw, C.S.W.; Sena, M.M.; Souza, S.V.C.D.; Ruisanchez, I.; Callao, M.P. Variable selection for multivariate
classification aiming to detect individual adulterants and their blends in grape nectars. Talanta 2018, 190,
55–61.
34. Sezer, B.; Bilge, G.; Berkkan, A.; Tamer, U.; Hakki Boyaci, I. A rapid tool for determination of titanium
dioxide content in white chickpea samples. Food Chem. 2018, 240, 84–89.
Sample Availability: Samples of the compounds are available from the authors.
© 2019 by the authors. Licensee MDPI, Basel, Switzerland. This article is an open access
article distributed under the terms and conditions of the Creative Commons Attribution
(CC BY) license (http://creativecommons.org/licenses/by/4.0/).