Embed Size (px)
Citation preview

Rapid Bacterial Diagnostics and Their Effect on
Patient Treatment and Outcome

isbn: 978-90-8559-605-9

Rapid Bacterial Diagnostics and Their Effect on
Patient Treatment and Outcome
Sneldiagnostiek van bacteriële infecties en haar effect
op behandeling en uitkomst
Proefschrift
ter verkrijging van de graad van doctor aan de
Erasmus Universiteit Rotterdam
op gezag van de
rector magnificus
Prof.dr. H.G. schmidt
en volgens besluit van het College voor Promoties.
De openbare verdediging zal plaatsvinden op
Woensdag 9 december 2009 om 09:30 uur
door
Kerremans, Josephus Johannes
geboren te nijmegen

PromotiecommiSSie
Promotor
Prof.dr. H.A. Verbrugh
Overige leden
Prof.dr. A. van belkum
Prof.dr. H.P. Endtz
Prof.dr. J. bakker
Copromotor
Dr. M.C. Vos

contentS
Chapter 1 introduction
Chapter 2.1 Accuracy of identification and susceptibility results by direct inoculation
of Vitek 2 cards from positive bACTEC cultures
Chapter 2.2 Rapid identification of staphyloccocus aureus in positive blood cultures
by slidex staph Plus ® agglutination test
Chapter 3 Detection of Methicillin-Resistant staphylococcus aureus in a low–preva-
lence setting by PCR with a selective enrichment broth
Chapter 4 Rapid identification and antimicrobial susceptibility testing reduce
antibiotic use and accelerate pathogen directed antibiotic use.
Chapter 5 The cost of rapid bacterial identification and susceptibility testing
Chapter 6 The effect of infectious disease consultancy and microbiological results on
microbiologically correct antibiotic therapy.
Chapter 7 needle to incubator time: factors influencing transport times of blood
culture specimens
Chapter 8 Direct incubation of blood cultures outside routine opening hours
accelerates antibiotic switch
Chapter 9 summary and concluding remarks
Samenvatting en conclusie
Dankwoord
Curriculum Vitae
Publicaties
7
25
39
45
57
73
85
97
107
119
127
131
133
135

Chapter 1
introduction

introduction 9
introduction
The aim of this thesis is to validate new rapid diagnostic tests and to investigate if improving
microbiological diagnostics influences patient outcome and management. Therefore a short
introduction in the underlying clinical syndrome is warranted. sepsis is a major complication
of infection with a high morbidity and mortality. Table 1 shows the diagnostic criteria of sepsis
and severe sepsis (20). in their review Angus and Wax (3) cited several studies that reported
mortality rates varying from 20 to 52%. From a point prevalence survey of Van Gestel et al. (66)
it was calculated that the annual number of admissions for severe sepsis in Dutch iCUs was
8643 ± 929 cases/year, which represents 0.054% of the Dutch population, 0.61% of hospital
admissions and 11% of iCU admissions.
in 2008 surviving sepsis Campaign published international guidelines for management of
severe sepsis and septic shock (20). They used the Grades of Recommendation, Assessment,
Development and Evaluation (GRADE) system for assessment of quality of evidence from high
(A) to very low (D) and to determine the strength of recommendations.
Their key recommendations, relevant for microbiologists and clinicians alike were among
others:
obtain blood cultures before starting antibiotic therapy (1C);
administer broad-spectrum antibiotic therapy within 1 h of diagnosis of severe sepsis with or
without septic shock (1b,1D) ;
reassess antibiotic therapy with microbiology and clinical data to narrow coverage, when
appropriate (1C).
cha
pter
1
10
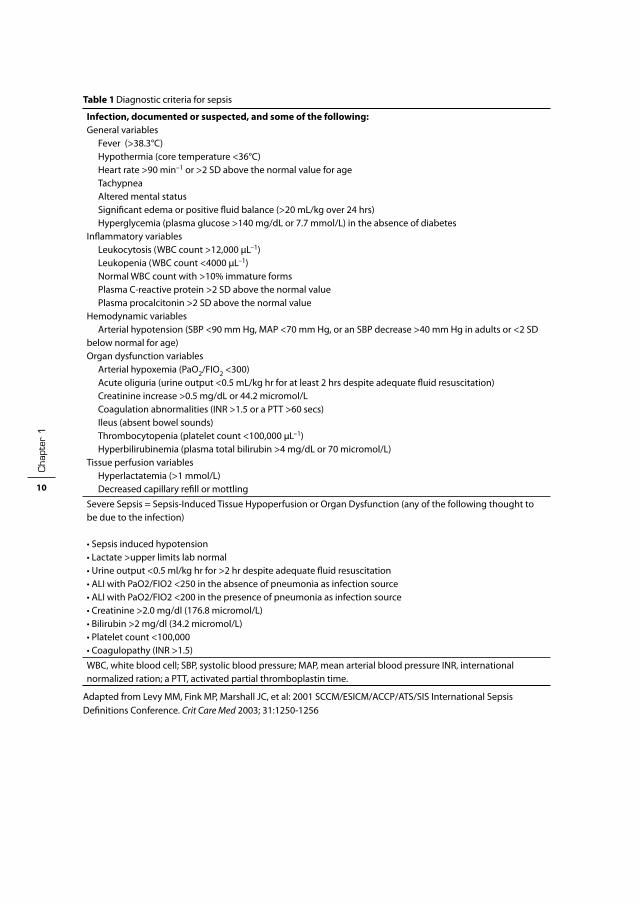
Table 1 Diagnostic criteria for sepsis
Infection, documented or suspected, and some of the following:General variables Fever (>38.3°C) Hypothermia (core temperature <36°C) Heart rate >90 min–1 or >2 SD above the normal value for age Tachypnea Altered mental status significant edema or positive fluid balance (>20 mL/kg over 24 hrs) Hyperglycemia (plasma glucose >140 mg/dL or 7.7 mmol/L) in the absence of diabetesinflammatory variables Leukocytosis (WbC count >12,000 µL–1) Leukopenia (WbC count <4000 µL–1) normal WbC count with >10% immature forms Plasma C-reactive protein >2 sD above the normal value Plasma procalcitonin >2 SD above the normal valueHemodynamic variables Arterial hypotension (sbP <90 mm Hg, MAP <70 mm Hg, or an sbP decrease >40 mm Hg in adults or <2 SD below normal for age)Organ dysfunction variables Arterial hypoxemia (PaO2/FiO2 <300) Acute oliguria (urine output <0.5 mL/kg hr for at least 2 hrs despite adequate fluid resuscitation) Creatinine increase >0.5 mg/dL or 44.2 micromol/L Coagulation abnormalities (inR >1.5 or a PTT >60 secs) ileus (absent bowel sounds) Thrombocytopenia (platelet count <100,000 µL–1) Hyperbilirubinemia (plasma total bilirubin >4 mg/dL or 70 micromol/L)Tissue perfusion variables Hyperlactatemia (>1 mmol/L) Decreased capillary refill or mottling
severe sepsis = sepsis-induced Tissue Hypoperfusion or Organ Dysfunction (any of the following thought to be due to the infection)
• sepsis induced hypotension• Lactate >upper limits lab normal• Urine output <0.5 ml/kg hr for >2 hr despite adequate fluid resuscitation• ALi with PaO2/FiO2 <250 in the absence of pneumonia as infection source• ALi with PaO2/FiO2 <200 in the presence of pneumonia as infection source• Creatinine >2.0 mg/dl (176.8 micromol/L)• bilirubin >2 mg/dl (34.2 micromol/L)• Platelet count <100,000• Coagulopathy (inR >1.5)
WbC, white blood cell; sbP, systolic blood pressure; MAP, mean arterial blood pressure inR, international normalized ration; a PTT, activated partial thromboplastin time.
Adapted from Levy MM, Fink MP, Marshall JC, et al: 2001 sCCM/EsiCM/ACCP/ATs/sis international sepsis Definitions Conference. Crit Care Med 2003; 31:1250-1256
introduction 11
microbiological diagnosis of infection
Cohen et al. stated in their 2004 review that obtaining an adequate specimen for microbiologi-
cal diagnosis before starting antibiotic therapy is, when possible, of paramount importance for
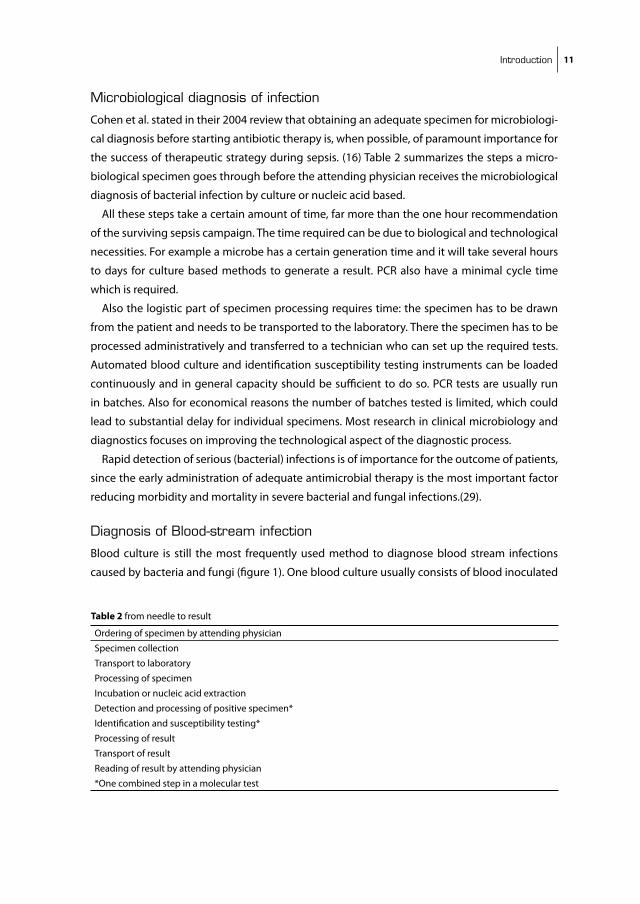
the success of therapeutic strategy during sepsis. (16) Table 2 summarizes the steps a micro-
biological specimen goes through before the attending physician receives the microbiological
diagnosis of bacterial infection by culture or nucleic acid based.
All these steps take a certain amount of time, far more than the one hour recommendation
of the surviving sepsis campaign. The time required can be due to biological and technological
necessities. For example a microbe has a certain generation time and it will take several hours
to days for culture based methods to generate a result. PCR also have a minimal cycle time
which is required.
Also the logistic part of specimen processing requires time: the specimen has to be drawn
from the patient and needs to be transported to the laboratory. There the specimen has to be
processed administratively and transferred to a technician who can set up the required tests.
Automated blood culture and identification susceptibility testing instruments can be loaded
continuously and in general capacity should be sufficient to do so. PCR tests are usually run
in batches. Also for economical reasons the number of batches tested is limited, which could
lead to substantial delay for individual specimens. Most research in clinical microbiology and
diagnostics focuses on improving the technological aspect of the diagnostic process.
Rapid detection of serious (bacterial) infections is of importance for the outcome of patients,
since the early administration of adequate antimicrobial therapy is the most important factor
reducing morbidity and mortality in severe bacterial and fungal infections.(29).
diagnosis of Blood-stream infection
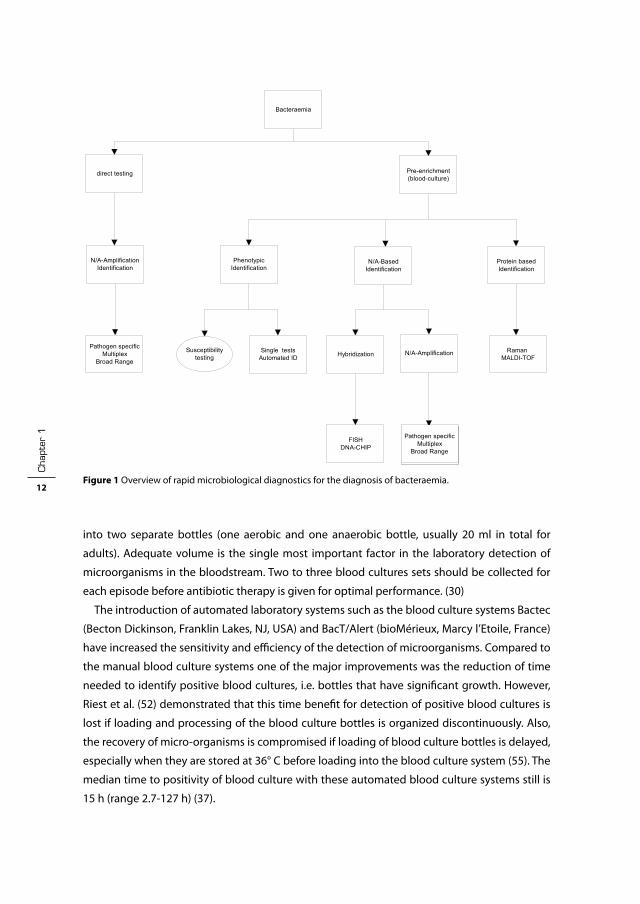
blood culture is still the most frequently used method to diagnose blood stream infections
caused by bacteria and fungi (figure 1). One blood culture usually consists of blood inoculated
Table 2 from needle to result
Ordering of specimen by attending physician
specimen collection
Transport to laboratory
Processing of specimen
incubation or nucleic acid extraction
Detection and processing of positive specimen*
identification and susceptibility testing*
Processing of result
Transport of result
Reading of result by attending physician
*One combined step in a molecular test
cha
pter
1
12
into two separate bottles (one aerobic and one anaerobic bottle, usually 20 ml in total for
adults). Adequate volume is the single most important factor in the laboratory detection of
microorganisms in the bloodstream. Two to three blood cultures sets should be collected for
each episode before antibiotic therapy is given for optimal performance. (30)
The introduction of automated laboratory systems such as the blood culture systems bactec
(becton Dickinson, Franklin Lakes, nJ, UsA) and bacT/Alert (bioMérieux, Marcy l’Etoile, France)
have increased the sensitivity and efficiency of the detection of microorganisms. Compared to
the manual blood culture systems one of the major improvements was the reduction of time
needed to identify positive blood cultures, i.e. bottles that have significant growth. However,
Riest et al. (52) demonstrated that this time benefit for detection of positive blood cultures is
lost if loading and processing of the blood culture bottles is organized discontinuously. Also,
the recovery of micro-organisms is compromised if loading of blood culture bottles is delayed,
especially when they are stored at 36° C before loading into the blood culture system (55). The
median time to positivity of blood culture with these automated blood culture systems still is
15 h (range 2.7-127 h) (37).
Hoofdstuk 1 fig 1
Bacteraemia
direct testing Pre-enrichment (blood-culture)
N/A-Amplification Identification
Phenotypic Identification
N/A-Based Identification
Protein based Identification
Single tests Automated ID Hybridization N/A-Amplification Raman
MALDI-TOF
FISH DNA-CHIP
Pathogen specific Multiplex
Broad Range
Susceptibility testing
Pathogen specific Multiplex
Broad Range
Figure 1 Overview of rapid microbiological diagnostics for the diagnosis of bacteraemia.
introduction 13
After positivity is detected by the continuously monitoring blood culture system a Gram
stain is prepared after the technician has removed the bottle from the machine. This Gram stain
is usually the first notification of positive blood cultures and is highly accurate (61). notification
of Gram stain results could have the most impact on antimicrobial management of all the blood
culture results (44).
Culture-based identification and susceptibility is based on the phenotypic characteristics of a
microorganism. However, these criteria can be influenced by the testing conditions. Molecular
techniques use genotypic characteristics (68). However presence of a gene does not equal
expression of that gene; if a target is not chosen correctly a pathogen can evade detection
altogether (e.g. swedish variant of Chlamydia thrachomatis (67)) . Table 3 summarizes a number
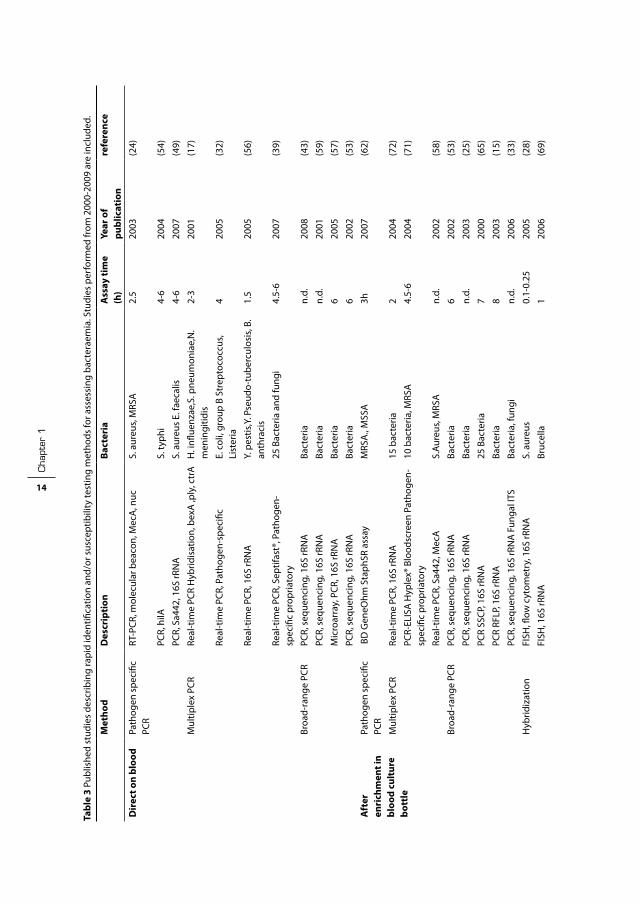
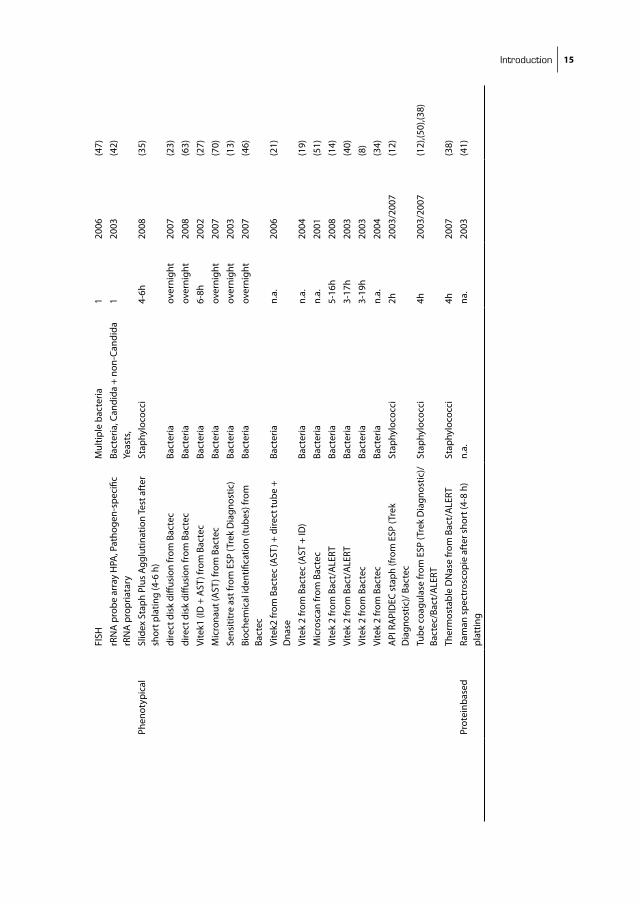
of fast bacteraemia detection methods (published after 2000) with assay time.
identification and susceptibility testing after enrichment by culture
Phenotypic
A limited number of single tests have been evaluated for direct identification of S.aureus (table
3). For other organisms systems as the ViTEK (bioMérieux), PHOEniX (becton Dickinson), or
Microscan WalkAway (siemens Healthcare Diagnostics, Munich, Germany) are available for
automated identification and antimicrobial drug-susceptibility testing. All these systems are
based on miniaturization of conventional methods, using biochemical properties for identi-
fication and microdilution for susceptibility testing. These systems can be used for same day
testing and can generate results either from single colonies subculture (9, 10, 45, 60) or directly
from blood culture broth (table 3). General assay time ranges from 3 tot 19 hours.
Nucleid acid based identification
Hybridization. identification of microorganisms can also be performed by direct hybridization
assays using labeled oligonucleotide probes. Direct hybridization assays for bacterial identi-
fication require a large number of target cells, resulting in a certain lack of sensitivity. Probe
hybridization is especially useful to identify slow-growing organisms after isolation in culture
using either liquid or solid media (e.g. mycobacteria), but has also been used for rapid identifi-
cation of S.aureus and Pneumococci from bloodculture (table 3). Fluorescent in situ hybridiza-
tion (FisH) can be used for direct identification from positive blood cultures as hybridization
is performed on smears with fluorescent-labeled probes that target rRnA, using fluorescence
microscopy for detection (table 3). Another method under development is the DnA microarray
by which multiple probes are spotted on a glass or silicon slide making it possible to detect
multiple targets with one test. (2)
Amplification. The most widely used amplification method is the polymerase chain reaction
(PCR): either pathogen specific, 16 s based or multiplex targeting a collection of pathogens
cha
pter
1
14
Tabl
e 3
Publ
ishe
d st
udie
s de
scrib
ing
rapi
d id
entifi
catio
n an
d/or
sus
cept
ibili
ty te
stin
g m
etho
ds fo
r ass
essi
ng b
acte
raem
ia. s
tudi
es p
erfo
rmed
from
200
0-20
09 a
re in
clud
ed.
Met
hod
Des
crip
tion
Bact
eria
A
ssay
tim
e (h
)Ye
ar o
f pu
blic
atio
nre
fere
nce
Dir
ect o
n bl
ood
Path
ogen
spe
cific
PC
RRT
-PCR
, mol
ecul
ar b
eaco
n, M
ecA
, nuc
s. a
ureu
s, M
RsA
2.5
2003
(24)
PCR,
hilA
s. ty
phi
4-6
2004
(54)
PCR,
sa4
42, 1
6s rR
nA
s. a
ureu
s E.
faec
alis
4-6
2007
(49)
Mul
tiple
x PC
RRe
al-t
ime
PCR
Hyb
ridis
atio
n, b
exA
,ply
, ctr
AH
. infl
uenz
ae,s
. pne
umon
iae,
n.
men
ingi
tidis
2-3
2001
(17)
Real
-tim
e PC
R, P
atho
gen-
spec
ific
E. c
oli,
grou
p b
stre
ptoc
occu
s, Li
ster
ia4
2005
(32)
Real
-tim
e PC
R, 1
6s rR
nA
Y. p
estis
,Y. P
seud
o-tu
berc
ulos
is, b
. an
thra
cis
1.5
2005
(56)
Real
-tim
e PC
R, s
eptif
ast®
, Pat
hoge
n-sp
ecifi
c pr
opria
tory
25 b
acte
ria a
nd fu
ngi
4.5-
620
07(3
9)
broa
d-ra
nge
PCR
PCR,
seq
uenc
ing,
16s
rRn
Aba
cter
ian.
d.20
08(4
3)
PCR,
seq
uenc
ing,
16s
rRn
Aba
cter
ian.
d.20
01(5
9)
Mic
roar
ray,
PCR
, 16s
rRn
Aba
cter
ia6
2005
(57)
PCR,
seq
uenc
ing,
16s
rRn
Aba
cter
ia6
2002
(53)
Aft
er
enri
chm
ent i
n bl
ood
cult
ure
bott
le
Path
ogen
spe
cific
PC
R b
D G
eneO
hm s
taph
sR a
ssay
MRs
A.,
Mss
A3h
2007
(62)
Mul
tiple
x PC
RRe
al-t
ime
PCR,
16s
rRn
A15
bac
teria
2
2004
(72)
PCR-
ELis
A H
yple
x® b
lood
scre
en P
atho
gen-
spec
ific
prop
riato
ry10
bac
teria
, MRs
A4.
5-6
2004
(71)
Real
-tim
e PC
R, s
a442
, Mec
As.
Aure
us, M
RsA
n.d.
2002
(58)
broa
d-ra
nge
PCR
PCR,
seq
uenc
ing,
16s
rRn
Aba
cter
ia6
2002
(53)
PCR,
seq
uenc
ing,
16s
rRn
Aba
cter
ian.
d.20
03(2
5)
PCR
ssCP
, 16s
rRn
A25
bac
teria
720
00(6
5)
PCR
RFLP
, 16s
rRn
Aba
cter
ia8
2003
(15)
PCR,
seq
uenc
ing,
16s
rRn
A F
unga
l iTs
bact
eria
, fun
gin.
d.20
06(3
3)
Hyb
ridiz
atio
n Fi
sH, fl
ow c
ytom
etry
, 16s
rRn
As.
aur
eus
0.1-
0.25
2005
(28)
FisH
, 16s
rRn
Abr
ucel
la1
2006
(69)
introduction 15
FisH
Mul
tiple
bac
teria
120
06(4
7)
rRn
A p
robe
arr
ay H
PA, P
atho
gen-
spec
ific
rRn
A p
ropr
iata
ryba
cter
ia, C
andi
da +
non
-Can
dida
Ye
asts
, 1
2003
(42)
Phen
otyp
ical
slid
ex s
taph
Plu
s Ag
glut
inat
ion
Test
aft
er
shor
t pla
ting
(4-6
h)
stap
hylo
cocc
i4-
6h20
08(3
5)
dire
ct d
isk
diffu
sion
from
bac
tec
bact
eria
over
nigh
t20
07(2
3)
dire
ct d
isk
diffu
sion
from
bac
tec
bact
eria
over
nigh
t20
08(6
3)
Vite
k1 (i
D +
AsT
) fro
m b
acte
cba
cter
ia6-
8h20
02(2
7)
Mic
rona
ut (A
sT) f
rom
bac
tec
bact
eria
over
nigh
t20
07(7
0)
sens
ititr
e as
t fro
m E
sP (T
rek
Dia
gnos
tic)
bact
eria
over
nigh
t20
03(1
3)
bioc
hem
ical
iden
tifica
tion
(tub
es) f
rom
ba
ctec
bact
eria
over
nigh
t20
07(4
6)
Vite
k2 fr
om b
acte
c (A
sT) +
dire
ct tu
be +
D
nase
bact
eria
n.a.
2006
(21)
Vite
k 2
from
bac
tec
(AsT
+ iD
)ba
cter
ian.
a.20
04(1
9)
Mic
rosc
an fr
om b
acte
cba
cter
ian.
a.20
01(5
1)
Vite
k 2
from
bac
t/A
LERT
bact
eria
5-16
h20
08(1
4)
Vite
k 2
from
bac
t/A
LERT
bact
eria
3-17
h20
03(4
0)
Vite
k 2
from
bac
tec
bact
eria
3-19
h20
03(8
)
Vite
k 2
from
bac
tec
bact
eria
n.a.
2004
(34)
APi
RA
PiD
EC s
taph
(fro
m E
sP (T
rek
Dia
gnos
tic)/
bac
tec
stap
hylo
cocc
i2h
2003
/200
7(1
2)
Tube
coa
gula
se fr
om E
sP (T
rek
Dia
gnos
tic)/
bact
ec/b
act/
ALE
RTst
aphy
loco
cci
4h20
03/2
007
(12)
,(50)
,(38)
Ther
mos
tabl
e D
nas
e fr
om b
act/
ALE
RTst
aphy
loco
cci
4h20
07(3
8)
Prot
einb
ased
Ram
an s
pect
rosc
opie
aft
er s
hort
(4-8
h)
plat
ting
n.a.
na.
2003
(41)
cha
pter
1
16
in one assay (table 3). Other methods used are ligase chain reaction, transcription mediated
amplification and nucleic acid sequence based amplification (nAsbA). (table 3)
Protein based
Raman spectroscopy can be used for identification after microbial growth is detected with
a short subculture (6 to 8 h). (41) Matrix-assisted laser desorption ionization-time of flight
(MALDi-TOF) could also be used for rapid identification (36, 68).
Direct Identification without preenrichment by culture
Due to the low copy numbers present in bacteraemia an amplification method is needed. Two
approaches have been tested. The first by using universal primers targeting conserved regions
in the genome of bacteria; for example 16 s PCR followed by either sequencing or selective
hybridization after amplification. The second approach is by multiplex PCR targeting the most
common pathogens recovered from blood cultures. (table 3)
One problem with direct detection is the relatively small volume (0.2 to 1 ml) for nucleic acid
extraction compared to the large sampling volume (40-60ml) that is used for blood cultures.
This low volume combined with an analytic sensitivity of 5-100 CFU/ml means that present
blood culture methods are likely to be more sensitive than PCR for viable microorganisms (37).
However, the sensitivity of blood cultures for slow-growing or fastidious organisms, and after
antibiotic therapy has been given, is low. (48) .
Another potential problem is that PCR (especially broad-range) detects all bacterial DnA
present in blood; not only of viable bacteria, but also of dead and degraded bacteria. Moreover,
it is very prone for contamination during sample collection and laboratory workup. Clinical
interpretation of results can therefore be difficult and more prospective studies should be
conducted to address this problem. (48)
Also susceptibility testing by molecular methods is at the moment limited to single/limited-
gene coded resistances such as MRsA and VRE. As numerous mutations have been described
in the literature providing susceptibility testing results for other organism-antibiotic combina-
tions wil provide a challenge. (37) Therefore, for the timing being, optimizing blood culture
performance by optimizing work flow is the most efficient method to improve patient care.
Appropriateness of antimicrobial therapy
inappropriate antimicrobial treatment (defined as use of an antimicrobial agent to which a
microorganism is resistant) or a delay in starting appropriate treatment are both associated with
increased morbidity and mortality. Also, the outcome in patients switched from inappropriate
to appropriate therapy is better than for patients who remained on inappropriate therapy, but
the effect is less than for patients started on appropriate therapy initially (18).
Patient management can be positively influenced by the timely reported results of positive
blood cultures and by infectious disease consultations. in a cohort study, byl et al. found that

introduction 17
empirical therapy for bacteraemia was appropriate in 78 % of episodes treated by iD specialists
compared with 54% for the other non iD-episodes (P < .001). After availability of blood culture
results, the proportion of appropriate treatments increased to 97% for patients treated by iD-
specialists and 89% for other patients (P: 0.008). Munson et al. (44) concluded that antimicrobial
susceptibility data had the least impact on antimicrobial management compared with inter-
ventions at the time of phlebotomy and after notification of Gram stain results by telephone.
From a trial of the impact of different methods in reporting of positive blood culture results,
bouza et al. (5) concluded that clinical advice complementing written and oral microbiological
reports lead to 92.1 and 91.1% appropriate therapy days, respectively, compared with 66.3%
appropriate therapy days in cases without unsolicited advice.
impact of rapid diagnostics on antibiotic use and outcome
bouza et al. (6) showed that rapid direct susceptibility testing of respiratory specimens of
patients with ventilator associated pneumonia led to a reduction of antibiotic use with 10
Defined Daily doses (DDD’s). Trenholme et al. (64) showed that rapid identification and sus-
ceptibility testing of blood culture isolates lead to a significant reduction of antibiotic use.
They reported that treatment recommendations made by an iD-specialist based upon a rapid
susceptibility test result were more likely to be followed compared to the control group. They
attributed this to the reluctance of physicians to change therapy after 2 or 3 days in patients
with improving health status.
Three studies have been published addressing the effect of rapid diagnostics on mortality (4,
7, 22). in these studies all types of clinical specimens were included of which 10 to 15 % were
bloodstream infections. Doern et al. demonstrated in his randomized trial a significant decrease
in mortality by using rapid diagnosis. barenfanger et al. found no effect on mortality, but did
show a significant cost reduction.
bruins et al. conducted a randomized trial including patients with positive cultires from all
types of specimens. They could not demonstrate a reduction in mortality and they did not find
a difference in antibiotic use between both groups. in this study empirical antibiotic therapy
in both groups was mostly adequate and of short duration. Allaouchice (1) studied the clinical
impact of rapid, PCR based oxacillin susceptibility testing in health care associated Staphylococ
cus aureus bacteraemia in a French hospital, but he could not demonstrate a major impact on
the care and outcome of patients.
Carver et al. found in a UsA setting that providing clinicians with rapid results of tests for
mecA before complete susceptibility testing didn’t result in streamlining of vancomycin to a
β-lactam antibiotic. However, an additional intervention by infectious disease clinical pharma-
cists did lead to a 25.4-h reduction in the time to optimal antimicrobial therapy (11).
Halin et al. evaluated the clinical usefulness of a PCR assay that discriminates Staphylococcus
aureus from coagulase-negative staphylococci and detects methicillin resistance on blood cul-
cha
pter
1
18
tures by measuring changes in antimicrobial therapy. The assay reduced turnaround time with
39 h. in 7 of 28 patients (25%) antibiotic therapy was modified based on the PCR results (26).
Jeyaratnam et al. (31) found that rapid screening tests of methicillin resistant Staphylococcus
aureus had an impact on bed usage. However, there was no evidence of a significant reduction
in MRsA acquisition and they concluded that it is unlikely that the increased costs of rapid tests
can be justified in their setting (London).
Aim and outline
The general aim of this thesis is to validate a number of rapid diagnostic tests and to assess their
impact on patient outcome. We studied the impact of blood culture results on patient manage-
ment and how improving the logistics can shorten the time to adequate patient management.
The main research objectives were:
1. Validation and assessment of new rapid methods for detection, identification and suscepti-
bility tesing of bacterial pathogens.
2. Assessment of the impact of rapid tests on patient outcome
3. Assement of the impact of various other interventions on patient management, including
antimicrobial therapy and costs.
Chapter 2.1 describes an evaluation of direct identification and susceptibility testing by using
Vitek 2. The isolates were obtained from sterile body fluids, including blood. Conventional test-
ing with the Vitek 2 is used as the reference method with alternative testing used for isolates
with discrepant result.
Chapter 2.2 sepsis caused by S.aureus can be rapidly fatal, if inadequate therapy is given;
therefore we present in this chapter an evaluation of a direct test, slidex staph Plus, for the
rapid identification of Staphylococcus aureus from bACTEC blood culture bottles.
Chapter 3 in the netherlands patients suspected of being a MRsA carrier are isolated until the
results of MRsA testing is negative. isolation makes patient care even more costly and delays
the diagnostic process . Therefore we describe in this chapter a molecular test which is validated
for rapid detection of MRsA carriage compared with culture results from selective phenol-red
mannitol broth subcultured after 48h.
Chapter 4 describes the results of a randomized controlled clinical trial performed over a
2-year period in which we assessed the impact of rapid identification and susceptibility results
of organisms causing severe bacterial infections on antibiotic use and patient outcome. inpa-
tients were selected on the basis of a positive culture from normally sterile body fluids and
randomly assigned to either a rapid intervention arm or the control arm.

introduction 19
Chapter 5 describes the cost-effectiveness of rapid bacterial diagnostics calculated from mea-
sured costs and tariffs collected during the study as described in chapter 4.
Chapter 6 describes which part of the culture results was most influential on patient man-
agement; i.e how many infectious diseases were treated with correct empirical therapy and
whether advice of infectious disease (iD) consultants was followed by the treating physician.
Chapter 7 describes time from drawing of blood culture specimen to the start of incubation of
blood cultures and identifies logistic factors influencing this transport time.
Chapter 8 describes the impact of an out-of-hours ‘self-service’ blood culture incubation facil-
ity on the time to growth detection, time to change in antibiotic regimen, length of stay and
mortality.
Chapter 9 summarizes and discusses the main findings of the studies in this thesis.

cha
pter
1
20
referenceS
1. Allaouchiche, b., H. Jaumain, G. Zambardi, D. Chassard, and J. Freney. 1999. Clinical impact of rapid oxacillin susceptibility testing using a PCR assay in staphylococcus aureus bactaeremia. J infect 39:198-204.
2. Andrade, s. s., P. J. bispo, and A. C. Gales. 2008. Advances in the microbiological diagnosis of sepsis. shock 30 suppl 1:41-6.
3. Angus, D. C., and R. s. Wax. 2001. Epidemiology of sepsis: an update. Crit Care Med 29:s109-16. 4. barenfanger, J., C. Drake, and G. Kacich. 1999. Clinical and financial benefits of rapid bacterial identifi-
cation and antimicrobial susceptibility testing. J Clin Microbiol 37:1415-8. 5. bouza, E., D. sousa, P. Munoz, M. Rodriguez-Creixems, C. Fron, and J. G. Lechuz. 2004. bloodstream
infections: a trial of the impact of different methods of reporting positive blood culture results. Clin infect Dis 39:1161-9.
6. bouza, E., M. V. Torres, C. Radice, E. Cercenado, R. de Diego, C. sanchez-Carrillo, and P. Munoz. 2007. Direct E-test (Ab biodisk) of respiratory samples improves antimicrobial use in ventilator-associated pneumonia. Clin infect Dis 44:382-7.
7. bruins, M., H. Oord, P. bloembergen, M. Wolfhagen, A. Casparie, J. Degener, and G. Ruijs. 2005. Lack of effect of shorter turnaround time of microbiological procedures on clinical outcomes: a randomised controlled trial among hospitalised patients in the netherlands. Eur J Clin Microbiol infect Dis 24:305-13.
8. bruins, M. J., P. bloembergen, G. J. Ruijs, and M. J. Wolfhagen. 2004. identification and susceptibility testing of Enterobacteriaceae and Pseudomonas aeruginosa by direct inoculation from positive bACTEC blood culture bottles into Vitek 2. J Clin Microbiol 42:7-11.
9. Carroll, K. C., A. P. borek, C. burger, b. Glanz, H. bhally, s. Henciak, and D. C. Flayhart. 2006. Evaluation of the bD Phoenix automated microbiology system for identification and antimicrobial susceptibility testing of staphylococci and enterococci. J Clin Microbiol 44:2072-7.
10. Carroll, K. C., b. D. Glanz, A. P. borek, C. burger, H. s. bhally, s. Henciak, and D. Flayhart. 2006. Evaluation of the bD Phoenix automated microbiology system for identification and antimicrobial susceptibility testing of Enterobacteriaceae. J Clin Microbiol 44:3506-9.
11. Carver, P. L., s. W. Lin, D. D. DePestel, and D. W. newton. 2008. impact of mecA gene testing and intervention by infectious disease clinical pharmacists on time to optimal antimicrobial therapy for staphylococcus aureus bacteremia at a University Hospital. J Clin Microbiol 46:2381-3.
12. Chapin, K., and M. Musgnug. 2003. Evaluation of three rapid methods for the direct identification of staphylococcus aureus from positive blood cultures. J Clin Microbiol 41:4324-7.
13. Chapin, K. C., and M. C. Musgnug. 2003. Direct susceptibility testing of positive blood cultures by using sensititre broth microdilution plates. J Clin Microbiol 41:4751-4.
14. Chen, J. R., s. Y. Lee, b. H. Yang, and J. J. Lu. 2008. Rapid identification and susceptibility testing using the ViTEK 2 system using culture fluids from positive bacT/ALERT blood cultures. J Microbiol immunol infect 41:259-64.
15. Christensen, J. E., J. A. stencil, and K. D. Reed. 2003. Rapid identification of bacteria from positive blood cultures by terminal restriction fragment length polymorphism profile analysis of the 16s rRnA gene. J Clin Microbiol 41:3790-800.
16. Cohen, J., C. brun-buisson, A. Torres, and J. Jorgensen. 2004. Diagnosis of infection in sepsis: an evidence-based review. Crit Care Med 32:s466-94.
17. Corless, C. E., M. Guiver, R. borrow, V. Edwards-Jones, A. J. Fox, and E. b. Kaczmarski. 2001. simultane-ous detection of neisseria meningitidis, Haemophilus influenzae, and streptococcus pneumoniae in suspected cases of meningitis and septicemia using real-time PCR. J Clin Microbiol 39:1553-8.
18. Davey, P. G., and C. Marwick. 2008. Appropriate vs. inappropriate antimicrobial therapy. Clin Microbiol infect 14 suppl 3:15-21.
introduction 21
19. de Cueto, M., E. Ceballos, L. Martinez-Martinez, E. J. Perea, and A. Pascual. 2004. Use of positive blood cultures for direct identification and susceptibility testing with the vitek 2 system. J Clin Microbiol 42:3734-8.
20. Dellinger, R. P., M. M. Levy, J. M. Carlet, J. bion, M. M. Parker, R. Jaeschke, K. Reinhart, D. C. Angus, C. brun-buisson, R. beale, T. Calandra, J. F. Dhainaut, H. Gerlach, M. Harvey, J. J. Marini, J. Marshall, M. Ranieri, G. Ramsay, J. sevransky, b. T. Thompson, s. Townsend, J. s. Vender, J. L. Zimmerman, and J. L. Vincent. 2008. surviving sepsis Campaign: international guidelines for management of severe sepsis and septic shock: 2008. Crit Care Med 36:296-327.
21. Diederen, b. M., M. Zieltjens, H. Wetten, and A. G. buiting. 2006. identification and susceptibility test-ing of staphylococcus aureus by direct inoculation from positive bACTEC blood culture bottles. Clin Microbiol infect 12:84-6.
22. Doern, G. V., R. Vautour, M. Gaudet, and b. Levy. 1994. Clinical impact of rapid in vitro susceptibility testing and bacterial identification. J Clin Microbiol 32:1757-62.
23. Edelmann, A., T. Pietzcker, and n. Wellinghausen. 2007. Comparison of direct disk diffusion and standard microtitre broth dilution susceptibility testing of blood culture isolates. J Med Microbiol 56:202-7.
24. Elsayed, s., b. L. Chow, n. L. Hamilton, D. b. Gregson, J. D. Pitout, and D. L. Church. 2003. Development and validation of a molecular beacon probe-based real-time polymerase chain reaction assay for rapid detection of methicillin resistance in staphylococcus aureus. Arch Pathol Lab Med 127:845-9.
25. Gauduchon, V., L. Chalabreysse, J. Etienne, M. Celard, Y. benito, H. Lepidi, F. Thivolet-bejui, and F. Vandenesch. 2003. Molecular diagnosis of infective endocarditis by PCR amplification and direct sequencing of DnA from valve tissue. J Clin Microbiol 41:763-6.
26. Hallin, M., n. Maes, b. byl, F. Jacobs, Y. De Gheldre, and M. J. struelens. 2003. Clinical impact of a PCR assay for identification of staphylococcus aureus and determination of methicillin resistance directly from blood cultures. J Clin Microbiol 41:3942-4.
27. Hansen, D. s., A. G. Jensen, n. norskov-Lauritsen, R. skov, and b. bruun. 2002. Direct identification and susceptibility testing of enteric bacilli from positive blood cultures using ViTEK (Gni+/Gns-GA). Clin Microbiol infect 8:38-44.
28. Hartmann, H., H. stender, A. schafer, i. b. Autenrieth, and V. A. Kempf. 2005. Rapid identification of staphylococcus aureus in blood cultures by a combination of fluorescence in situ hybridization using peptide nucleic acid probes and flow cytometry. J Clin Microbiol 43:4855-7.
29. ibrahim, E. H., G. sherman, s. Ward, V. J. Fraser, and M. H. Kollef. 2000. The influence of inadequate antimicrobial treatment of bloodstream infections on patient outcomes in the iCU setting. Chest 118:146-55.
30. isenberg. 2007. 31. Jeyaratnam, D., C. J. Whitty, K. Phillips, D. Liu, C. Orezzi, U. Ajoku, and G. L. French. 2008. impact of
rapid screening tests on acquisition of meticillin resistant staphylococcus aureus: cluster randomised crossover trial. bMJ 336:927-30.
32. Jordan, J. A., A. R. butchko, and M. b. Durso. 2005. Use of pyrosequencing of 16s rRnA fragments to differentiate between bacteria responsible for neonatal sepsis. J Mol Diagn 7:105-10.
33. Karahan, Z. C., i. Mumcuoglu, H. Guriz, D. Tamer, n. balaban, D. Aysev, and n. Akar. 2006. PCR evalua-tion of false-positive signals from two automated blood-culture systems. J Med Microbiol 55:53-7.
34. Kerremans, J. J., W. H. Goessens, H. A. Verbrugh, and M. C. Vos. 2004. Accuracy of identification and susceptibility results by direct inoculation of Vitek 2 cards from positive bACTEC cultures. Eur J Clin Microbiol infect Dis 23:892-8.
35. Kerremans, J. J., W. H. Goessens, H. A. Verbrugh, and M. C. Vos. 2008. Rapid identification of staphy-loccocus aureus in positive-testing blood cultures by slidex staph Plus agglutination test. J Clin Microbiol 46:395.

cha
pter
1
22
36. Keys, C. J., D. J. Dare, H. sutton, G. Wells, M. Lunt, T. McKenna, M. McDowall, and H. n. shah. 2004. Compilation of a MALDi-TOF mass spectral database for the rapid screening and characterisation of bacteria implicated in human infectious diseases. infect Genet Evol 4:221-42.
37. Klouche, M., and U. schroder. 2008. Rapid methods for diagnosis of bloodstream infections. Clin Chem Lab Med 46:888-908.
38. Lagace-Wiens, P. R., M. J. Alfa, K. Manickam, and J. A. Karlowsky. 2007. Thermostable Dnase is superior to Tube Coagulase for the Direct Detection of staphylococcus aureus in Positive blood Cultures. J Clin Microbiol.
39. Lehmann, L. E., K. P. Hunfeld, T. Emrich, G. Haberhausen, H. Wissing, A. Hoeft, and F. stuber. 2008. A multiplex real-time PCR assay for rapid detection and differentiation of 25 bacterial and fungal pathogens from whole blood samples. Med Microbiol immunol 197:313-24.
40. Ling, T. K., Z. K. Liu, and A. F. Cheng. 2003. Evaluation of the ViTEK 2 system for rapid direct identifica-tion and susceptibility testing of gram-negative bacilli from positive blood cultures. J Clin Microbiol 41:4705-7.
41. Maquelin, K., C. Kirschner, L. P. Choo-smith, n. A. ngo-Thi, T. van Vreeswijk, M. stammler, H. P. Endtz, H. A. bruining, D. naumann, and G. J. Puppels. 2003. Prospective study of the performance of vibrational spectroscopies for rapid identification of bacterial and fungal pathogens recovered from blood cultures. J Clin Microbiol 41:324-9.
42. Marlowe, E. M., J. J. Hogan, J. F. Hindler, i. Andruszkiewicz, P. Gordon, and D. A. bruckner. 2003. Applica-tion of an rRnA probe matrix for rapid identification of bacteria and fungi from routine blood cultures. J Clin Microbiol 41:5127-33.
43. Millar, M. R., G. Johnson, M. Wilks, R. skinner, s. stoneham, b. Pizer, s. Hemsworth, A. Fogarty, C. stew-ard, R. Gilbert, and E. M. Hennessy. 2008. Molecular diagnosis of vascular access device-associated infection in children being treated for cancer or leukaemia. Clin Microbiol infect 14:213-20.
44. Munson, E. L., D. J. Diekema, s. E. beekmann, K. C. Chapin, and G. V. Doern. 2003. Detection and treat-ment of bloodstream infection: laboratory reporting and antimicrobial management. J Clin Microbiol 41:495-7.
45. nakasone, i., T. Kinjo, n. Yamane, K. Kisanuki, and C. M. shiohira. 2007. Laboratory-based evaluation of the colorimetric ViTEK-2 Compact system for species identification and of the Advanced Expert system for detection of antimicrobial resistances: ViTEK-2 Compact system identification and antimi-crobial susceptibility testing. Diagn Microbiol infect Dis 58:191-8.
46. ng, s. Y., L. L. Kwang, and T. Y. Tan. 2007. identification of Gram-negative bacilli directly from positive blood culture vials. J Med Microbiol 56:475-9.
47. Peters, R. P., P. H. savelkoul, A. M. simoons-smit, s. A. Danner, C. M. Vandenbroucke-Grauls, and M. A. van Agtmael. 2006. Faster identification of pathogens in positive blood cultures by fluorescence in situ hybridization in routine practice. J Clin Microbiol 44:119-23.
48. Peters, R. P., M. A. van Agtmael, s. A. Danner, P. H. savelkoul, and C. M. Vandenbroucke-Grauls. 2004. new developments in the diagnosis of bloodstream infections. Lancet infect Dis 4:751-60.
49. Peters, R. P., M. A. van Agtmael, s. Gierveld, s. A. Danner, A. b. Groeneveld, C. M. Vandenbroucke-Grauls, and P. H. savelkoul. 2007. Quantitative detection of staphylococcus aureus and Enterococcus faecalis DnA in blood to diagnose bacteremia in patients in the intensive care unit. J Clin Microbiol 45:3641-6.
50. Qian, Q., K. Eichelberger, and J. E. Kirby. 2007. Rapid identification of staphylococcus aureus in blood cultures by use of the direct tube coagulase test. J Clin Microbiol 45:2267-9.
51. Rich, M., R. M. bannatyne, P. Topham, and Z. Memish. 2001. The use of direct susceptibility tests from bACTEC 9240 to Microscan Walkaway. J Chemother 13 suppl 1:62-4.
52. Riest, G., H. J. Linde, and P. M. shah. 1997. Comparison of bacT/Alert and bACTEC nR 860 blood culture systems in a laboratory not continuously staffed. Clin Microbiol infect 3:345-351.
53. Rothman, R. E., M. D. Majmudar, G. D. Kelen, G. Madico, C. A. Gaydos, T. Walker, and T. C. Quinn. 2002. Detection of bacteremia in emergency department patients at risk for infective endocarditis
introduction 23
using universal 16s rRnA primers in a decontaminated polymerase chain reaction assay. J infect Dis 186:1677-81.
54. sanchez-Jimenez, M. M., and n. Cardona-Castro. 2004. Validation of a PCR for diagnosis of typhoid fever and salmonellosis by amplification of the hilA gene in clinical samples from Colombian patients. J Med Microbiol 53:875-8.
55. sautter, R. L., A. R. bills, D. L. Lang, G. Ruschell, b. J. Heiter, and P. P. bourbeau. 2006. Effects of delayed-entry conditions on the recovery and detection of microorganisms from bacT/ALERT and bACTEC blood culture bottles. J Clin Microbiol 44:1245-9.
56. selvapandiyan, A., K. stabler, n. A. Ansari, s. Kerby, J. Riemenschneider, P. salotra, R. Duncan, and H. L. nakhasi. 2005. A novel semiquantitative fluorescence-based multiplex polymerase chain reaction assay for rapid simultaneous detection of bacterial and parasitic pathogens from blood. J Mol Diagn 7:268-75.
57. shang, s., G. Chen, Y. Wu, L. Du, and Z. Zhao. 2005. Rapid diagnosis of bacterial sepsis with PCR ampli-fication and microarray hybridization in 16s rRnA gene. Pediatr Res 58:143-8.
58. shrestha, n. K., M. J. Tuohy, G. s. Hall, C. M. isada, and G. W. Procop. 2002. Rapid identification of staphylococcus aureus and the mecA gene from bacT/ALERT blood culture bottles by using the LightCycler system. J Clin Microbiol 40:2659-61.
59. sleigh, J., R. Cursons, and M. La Pine. 2001. Detection of bacteraemia in critically ill patients using 16s rDnA polymerase chain reaction and DnA sequencing. intensive Care Med 27:1269-73.
60. snyder, J. W., G. K. Munier, and C. L. Johnson. 2008. Direct comparison of the bD phoenix system with the Microscan WalkAway system for identification and antimicrobial susceptibility testing of Enterobacteriaceae and nonfermentative gram-negative organisms. J Clin Microbiol 46:2327-33.
61. sogaard, M., M. norgaard, and H. C. schonheyder. 2007. First notification of positive blood cultures and the high accuracy of the gram stain report. J Clin Microbiol 45:1113-7.
62. stamper, P. D., M. Cai, T. Howard, s. speser, and K. C. Carroll. 2007. Clinical validation of the molecular bD GeneOhm staphsR assay for direct detection of staphylococcus aureus and methicillin-resistant staphylococcus aureus in positive blood cultures. J Clin Microbiol 45:2191-6.
63. Tan, T. Y., L. s. ng, and L. L. Kwang. 2008. Evaluation of disc susceptibility tests performed directly from positive blood cultures. J Clin Pathol 61:343-6.
64. Trenholme, G. M., R. L. Kaplan, P. H. Karakusis, T. stine, J. Fuhrer, W. Landau, and s. Levin. 1989. Clini-cal impact of rapid identification and susceptibility testing of bacterial blood culture isolates. J Clin Microbiol 27:1342-5.
65. Turenne, C. Y., E. Witwicki, D. J. Hoban, J. A. Karlowsky, and A. M. Kabani. 2000. Rapid identification of bacteria from positive blood cultures by fluorescence-based PCR-single-strand conformation polymorphism analysis of the 16s rRnA gene. J Clin Microbiol 38:513-20.
66. van Gestel, A., J. bakker, C. P. Veraart, and b. A. van Hout. 2004. Prevalence and incidence of severe sepsis in Dutch intensive care units. Crit Care 8:R153-62.
67. Velicko, i., s. Kuhlmann-berenzon, and A. blaxhult. 2007. Reasons for the sharp increase of genital chlamydia infections reported in the first months of 2007 in sweden. Euro surveill 12:E5-6.
68. Weile, J., and C. Knabbe. 2009. Current applications and future trends of molecular diagnostics in clinical bacteriology. Anal bioanal Chem 394:731-42.
69. Wellinghausen, n., K. nockler, A. sigge, M. bartel, A. Essig, and s. Poppert. 2006. Rapid detection of brucella spp. in blood cultures by fluorescence in situ hybridization. J Clin Microbiol 44:1828-30.
70. Wellinghausen, n., T. Pietzcker, s. Poppert, s. belak, n. Fieser, M. bartel, and A. Essig. 2007. Evaluation of the Merlin MiCROnAUT system for rapid direct susceptibility testing of gram-positive cocci and gram-negative bacilli from positive blood cultures. J Clin Microbiol 45:789-95.
71. Wellinghausen, n., b. Wirths, A. Essig, and L. Wassill. 2004. Evaluation of the Hyplex bloodscreen Multiplex PCR-Enzyme-linked immunosorbent assay system for direct identification of gram-positive cocci and gram-negative bacilli from positive blood cultures. J Clin Microbiol 42:3147-52.

cha
pter
1
24
72. Wellinghausen, n., b. Wirths, A. R. Franz, L. Karolyi, R. Marre, and U. Reischl. 2004. Algorithm for the identification of bacterial pathogens in positive blood cultures by real-time LightCycler polymerase chain reaction (PCR) with sequence-specific probes. Diagn Microbiol infect Dis 48:229-41.

Chapter 2.1
Accuracy of identification and susceptibility results by direct inoculation of Vitek 2 cards from positive BActec cultures
J.J. Kerremans*, W.H.f. Goessens*, H.A. Verbrugh*,
m.c. Vos*
* Department of Medical Microbiology & Infectious Diseases, Erasmus University
Medical Center Rotterdam, The Netherlands
European Journal of Clinical Microbiology and Infectious Diseases
2004 23:892-8

cha
pter
2.1
26
ABStrAct
Rapid identification of bacteria and prompt acquisition of susceptibility results are valuable
for patient care. The objective of the present study was to determine the accuracy of direct
inoculation of Vitek 2 cards from positive bACTEC cultures compared to inoculation of the cards
from subculture plates. Positive bACTEC cultures sampled between March 2001 and June 2002
were included. The results of direct inoculation were compared with the results of inoculation
of Vitek 2 cards from subcultures. Of 161 gram-negative bacilli, 129 (80%) were correctly identi-
fied by direct inoculation compared to 145 of 161 (90%) by subculture. susceptibility testing
was performed on 2,862 antibiotic-isolate combinations. The essential agreement was 98.7%.
The number of very major, major, and minor errors was 1 (0.2% of resistant strains), 1 (0.04%
of susceptible strains), and 68, respectively. Direct identification of Staphylococcus spp. was
not performed, but antimicrobial susceptibility was tested using 6,042 antibiotic-isolate com-
binations. The essential agreement was 95.2 %. The number of very major, major, and minor
errors was 73 (4.5% of resistant strains), 32 (0.8% of susceptible strains), and 106, respectively.
Eighty-four percent of the very major errors occurred with trimethoprim-sulfamethoxazole. The
results show that direct inoculation of Vitek cards is valuable as a rapid routine method for
gram-negative bacilli. For Staphylococcus spp., the susceptibility results obtained after direct
inoculation of Vitek 2 cards are also acceptable except for those obtained with trimethoprim-
sulfamethoxazole. susceptibility results for this antibiotic, if obtained using direct inoculation,
should not be reported to the clinician.
direct identification and susceptibility testing 27
introduction
The introduction of new techniques in diagnostic microbiology laboratories along with changes
in workflow has led to a reduction in the turnaround time required to obtain identification and
antimicrobial susceptibility results. several authors have shown that a reduction in turnaround
time is beneficial for patient care (1, 3, 16).
The Vitek 2 system is a newly introduced system that provides rapid identification and sus-
ceptibility results (4, 7, 8, 10, 12). identification of gram-negative bacilli and positive cocci is
obtained after 3 h and 2 h of incubation, respectively. The Vitek 2 is designed and validated to be
used with an inoculum from colonies grown on solid subculture plates. by using bacterial sus-
pensions obtained directly from positive blood cultures, however, the final results of identifica-
tion and susceptibility testing can, theoretically, be reported on the same day the blood culture
becomes positive. Rapid identification and susceptibility testing by means of direct inoculation
from positive blood cultures has been reported earlier (5, 6, 9, 13, 14, 17, 18). Results in these
studies differ in the number of (very) major errors and, consequently, in the appreciation of such
techniques. Only one study used the Vitek 2 instrument in combination with the bACTEC 9240
system (becton Dickinson, sparks, MD, UsA) (2). in the present study, we evaluated the accuracy
of identification and susceptibility testing by the Vitek 2 instrument by using inocula obtained
directly from positive bACTEC-cultures in comparison with inocula obtained after subculture.
materials and methods
Study design. Cultures grown in bACTEC bottles were selected between March 2001 and June
2002 in the central location of the Erasmus University Medical Center, a 1200-bed tertiary-care
hospital in Rotterdam, the netherlands. Positive specimens from blood, cerebrospinal fluid,
ascites, and pleural fluid, which contained either Staphylococcus spp. or aerobic nonfastidious
gram-negative bacilli, were selected for evaluation. From each patient, only one positive culture
specimen obtained in an interval of 48 h was included for evaluation. Only Gram-stain-pure
cultures were included in the test. if, after incubation, growth on the subculture plate showed a
mixed culture, the specimen was excluded from further analysis.
Blood culture instruments. The bACTEC 9240 system (becton Dickinson) with bACTEC Plus
Aerobic/F and Anaerobic/F bottles and PEDs Plus bottles was used. A blood-culture set con-
sisted of one aerobic bottle and one anaerobic bottle. PEDs bottles were used for body fluids
other than blood, i.e. ascites, cerebrospinal fluid, and (pleural) aspirates.
Vitek 2 instrument and panels. The Vitek 2 instrument (bioMérieux, Marcy-l’Étoile, France) with
proprietary data management software (version VT2-R02.03) and the Advanced Expert system
(AEs) (version AEs.R02.00n) was used for all reading and interpretation of results. iD-Gnb and AsT-
n010/020 cards were used for identification and susceptibility testing of gram-negative isolates.
AsT-P515/523 cards were used for Staphylococcus spp.. We also used remote accessing software
(X-win32) (starnet, sunnyvale, UsA) to collect the results in the evening hours when necessary.
cha
pter
2.1
28
Quality control. The iD-Gnb card was tested with Pseudomonas aeruginosa strain ATCC 27583
and Serratia odorifera strain ATCC 33077. The AsT-n010/020 card was tested with Escherichia
coli strain ATCC 35218 and Escherichia coli strain ATCC 25922. The AsT-P515/523 card was tested
with Staphylococcus aureus strain ATCC 29213. All cards were tested weekly.
Inoculation of cards. in the direct inoculation method, 6 ml of fluid from positive bACTEC
bottles was added to a serum separator tube (becton Dickinson Vacutainer, Rutherford, nJ, UsA)
and centrifuged at 2,000xg for 10 min. After removal of the supernatant, the bacteria containing
the cell layer were removed, using a swab, from the top of the separator layer and suspended
to a 0.6 McFarland density in 0.45% saline. Gram-negative bacilli (Gnb) were inoculated onto
AsT-n010/020 cards for susceptibility testing and onto iD-Gnb cards for identification.Only
aerobic nonfastidious gram-negative bacilli were evaluated; other Gnb were excluded. Gram-
positive cocci in clusters were inoculated onto susceptibility cards (AsT-p515/523). in a pilot
study, direct inoculation of the Vitek 2 system with bACTEC cultures containing staphylococci
resulted in many reports of unidentified species. Therefore, Staphylococcus spp. were presented
to the Vitek 2 system as either coagulase positive or coagulase negative. Coagulase production
was tested by slidex staph Plus (bioMérieux).inocula for the slidex assay were obtained from
subculture plates at the end of the day or the following day.
if the Vitek 2 identification algorithm required off-line ancillary tests, the results of these tests
were used for final identification. These ancillary tests were oxidase, indole, motility, pigment,
and hemolysis. Positive bACTEC bottles were also subcultured on Columbia blood agar, Mac-
Conkey agar, chocolate agar, and brucella blood agar.
For validation of the results obtained by direct inoculation, a suspension was made from a
subculture plate. This suspension was inoculated onto Vitek 2 cards according to the manufac-
turer’s recommendations. if the identification results obtained by the reference method (Vitek
2) were doubtful in relation to other cultures of the same patient or if the organism could not
be identified at all, the APi 20(n)E was used as a backup method. staphylococci were identified
with the Vitek 1 GPi card and, if needed, the APi iD 32 staph (bioMérieux).
Interpretation of results. MiCs were assessed using the direct and the reference methods.
isolates were classified as susceptible (s), intermediate (i), or resistant (R), according to the
breakpoints recommended by the national Committee for Clinical Laboratory standards
(nCCLs) (15). First, the difference in dilution steps was assessed. second, the number and type
of errors against susceptibility categories (s, i, R) were assessed. interpretive category errors
were defined as follows: a very major error was scored if the result of the direct method was sus-
ceptible and the result of the reference method was resistant; a major error was the opposite.
All other errors were considered minor.
Amoxicillin-clavulanic acid, ampicillin, cefotaxime, cefoxitin, cefuroxime, cephalothin and
cefpo doxime were not tested against nonfermentative bacilli. in addition, tri metho prim-
sulfamethoxazole was excluded from testing against Pseudo monas aerugi nosa. For Steno
tropho monas malto philia, trimethoprim-sulfamethoxazole was the only antibiotic analyzed.
direct identification and susceptibility testing 29
Statistics. identification outcomes were evaluated using the Mcnemar test (a nonparametric
test for two related dichotomous variables that tests for changes in responses using the chi-
squared distribution) to analyze differences in the results. To evaluate the MiCs, paired-sample
t tests were performed on the MiC-values (after log-conversion) for each antibiotic and on
the sum of all MiC values (after log conversion) for each card. P values <0.05 were considered
significant.
Discrepancy analysis. A discrepancy analysis was performed afterwards on the very major
and major errors. As it was not feasible to repeat the direct method, a third method was per-
formed to resolve the differences. The final error rates were calculated on the basis of the results
obtained after resolving errors by discrepancy analysis.
Discrepancies for oxacillin were resolved by detection of the PbP 2’ antigen (latex agglutina-
tion assay [MRsA-screen; Denka-seiken, Tokyo, Japan]) and by agar dilution; other discrepan-
cies in MiCs were resolved by determining agar dilution MiCs according to nCCLs guidelines.
MiCs were determined for ampicillin, amoxicillin-clavulanic acid, ceftazidime, cefuroxime,
meropenem, teicoplanin, tobramycin, trimethoprim-sulfamethoxazole, and vancomycin. For
discrepancies with clindamycin, cefepime, erythromycin, gentamicin, norfloxacin, tetracycline,
and nitrofurantoin, the E test (Ab biodisk, solna, sweden) was performed as the alternative
reference method.
results
During the 15-month study period, 1,023 positive specimens were screened. After the exclu-
sion of mixed cultures (n= 55), cultures containing organisms other than Gnb or staphylococci
(n= 123), cultures disqualified by technical errors (n= 56) and duplicate positive cultures from
the same patient (n= 273), 516 specimens remained for evaluation.
Gram-negative bacilli
One hundred-sixty-seven specimens grew a member of the family Enterobacteriaceae or
nonfermentative Gnb. One hundred-sixty-one specimens from 130 patients were eligible for
analysis of identification results (6 specimens were missing data). One hundred-fifty-three
specimens (124 patients) were eligible for analysis of susceptibility results (5 isolates failed
to grow after direct inoculation; 2 failed to grow after both direct inoculation and subculture;
1 wa missing data). Direct inoculation of positive cultures in Vitek 2 resulted in a correct
identification of 129 out of 161 (80%)organisms to the species level. The results are shown in
Table 1. sixteen of 27 unidentified organisms belonged to Klebsiella pneumoniae or Escherichia
coli species. in fact, only one specimen was incorrectly identified as various nonfermenting
rod instead of Proteus mirabilis. The other nonfermenting bacilli were identified as “various
nonfermentative bacilli”.
The method of reference, i.e. Vitek2, identified 145 of 161 (90%) isolates to the species
level. Remarkably, 8 of 14 unidentified organisms belonged to either Klebsiella pneumoniae

cha
pter
2.1
30
or Escherichia coli species. The difference of 10% more correct identifications by the reference
method is statistically significant (P value : 0.007).
Table 2 shows the number of isolates for which MiCs differed by one, two, or more than two
dilution steps from the reference MiCs. There was no difference between the combined MiCs of
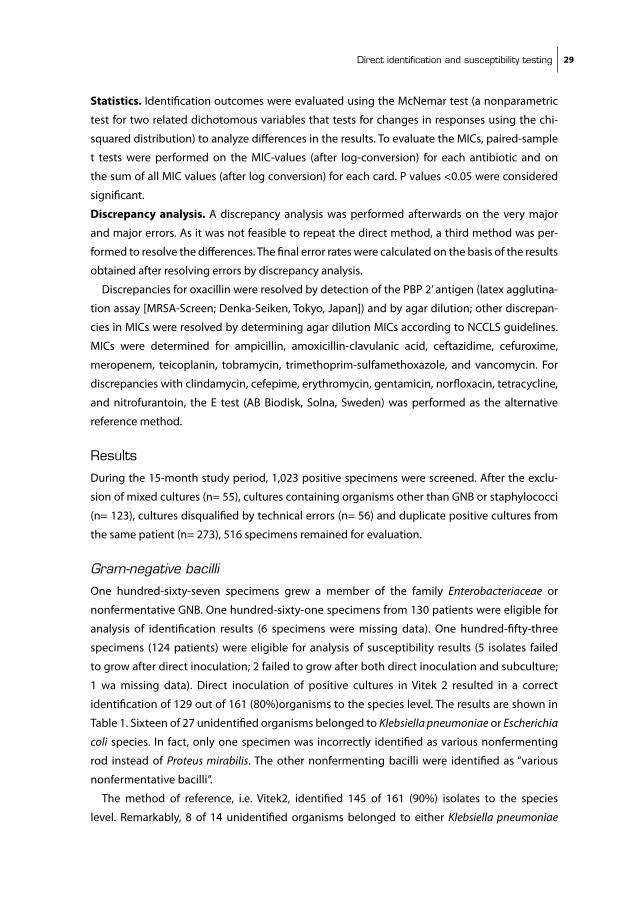
the direct and of the standard method (difference, –0.25 dilution step per card [P value: 0.22]).
before the discrepancy analysis, five very major errors were obtained for amoxicillin-clavulanic
acid, ampicillin, cefepime, ceftazidime and nitrofurantoin. Three major errors occurred for
cefepime, cefuroxime and meropenem. These eight discrepancies were generated by six iso-
lates. The total number of minor errors was 68. The category agreement was 97%. in Table 3 the
number and type of errors encountered with the direct method are shown per antibiotic after
the discrepancy analysis.
Table 1 identification of gram-negative bacilli by direct inoculation of Vitek 2 in comparison with inoculation of Vitek 2 from subculture plate (reference method)
OrganismDirect inoculation of Vitek 2
Reference Vitek 2
Correct Unidentified Misidentified Correct Unidentifieda Misidentifieda b
C.diversus 3 3
C.freundii 2 2
E.aerogenes 4 1 4 1
E.amnigenus 1 1
E.cloacae 13 1 13 1c
E.coli 56 8 61 3
K.oxytoca 9 1 10
K.pneumoniae 14 8 16 5 1d
M.morganii 1 1
P.mirabilis 2 1e 2 1
Salmonella spp. 4 4
S.liquefaciens 1 1
S.marcescens 9 4 12 1
S.odorifera 1 1
F.meningosepticum 1 1
Pasteurella spp. 1f 1g
P.aeruginosa 10 1 1e 12
S.maltophilia 1 2e 3
Total 129 27 5 145 14 2a identified by APi b no concordance with other identification results c misidentified as a E. amnigenus d misidentified as a E.aerogenese misidentified as ‘various non-fermentative rod’f misidentified as F.meningosepticum g also unidentified by APi; genus identification based on morphology and penicillin susceptibility
direct identification and susceptibility testing 31
Staphylococcus species
Of the 349 specimens containing Staphylococcus spp., 318 (169 patients) were eligible for the
analysis of susceptibility results (7 isolates failed to grow after direct inoculation; 3 failed to
grow after both direct inoculation and subculture; 21 had missing data). seventy-five isolates
were identified as Staphylococcus aureus (1 as MRsA), 164 as Staphylococcus epidermidis, and
19 as Staphylococcus haemolyticus. The remaining 60 isolates were other species of coagulase-
negative staphylococci (Cns). The total number of antibiotic-isolate combinations compared
between the two methods was 6,042. in Table 4, differences in MiCs are shown as differences of
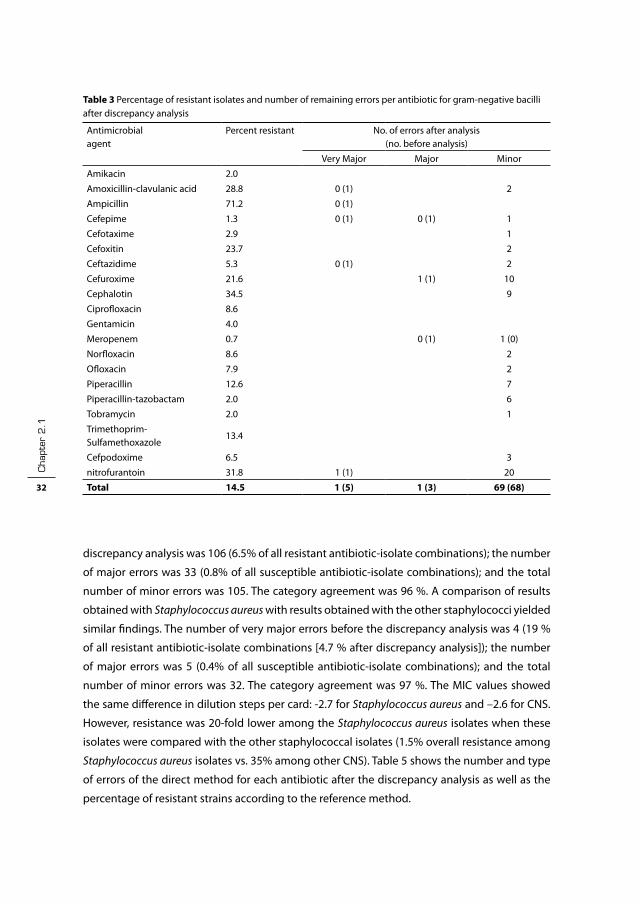
one, two or more than two dilution steps from the MiCs as obtained by the reference method.
Overall, an essential agreement of 95.3% was obtained. The essential agreement between
the methods for teicoplanin and trimethoprim-sulfamethoxazole was low in comparison to
that for the other antibiotics. The direct method resulted in, on average, a lower MiC value:
-2.6 dilution steps per card (P value <0.0005). The number of very major errors before the
Table 2 Difference in log2MiCs (direct inoculation versus reference method) for gram-negative bacilli
Antimicrobial agent
no. of direct MiCs that differed by zero, one, two or more dilution steps from the reference MiC
Percent agreementa
D >-2 -2 -1 same +1 +2 >+2
Amikacin 1 146 4 100
Amoxicillin-clavulanic acid
1 7 122 8 99.3
Ampicillin 6 131 1 100
Cefepime 2 3 143 1 1 1 97.4
Cefotaxime 2 2 131 3 98.6
Cefoxitin 3 134 1 100.0
Ceftazidime 1 3 144 2 1 98.7
Cefuroxime 1 15 111 9 1 1 97.8
Cephalotin 3 12 120 12 2 96.7
Ciprofloxacin 1 146 4 100
Gentamicinb 2 5 143 1 98.7
Meropenem 3 145 2 1 99.3
norfloxacin 1 148 1 1 99.3
Ofloxacin 3 141 6 1 99.3
Piperacillin 2 2 10 127 3 6 1 92.7
Piperacillin-tazobactam
2 8 138 2 1 98.0
Tobramycin 5 143 3 100
Trimethoprim-sulfamethoxazole
142 100
Cefpodoxime 18 113 6 1 99.3
nitrofurantoin 1 1 16 119 13 1 98.0
total 4 16 122 2687 82 15 5 98.6a Percentage includes all concordant isolates and all isolates differing one dilution step from the reference MiC.b Difference is statistically significant (P = 0.03)
cha
pter
2.1
32
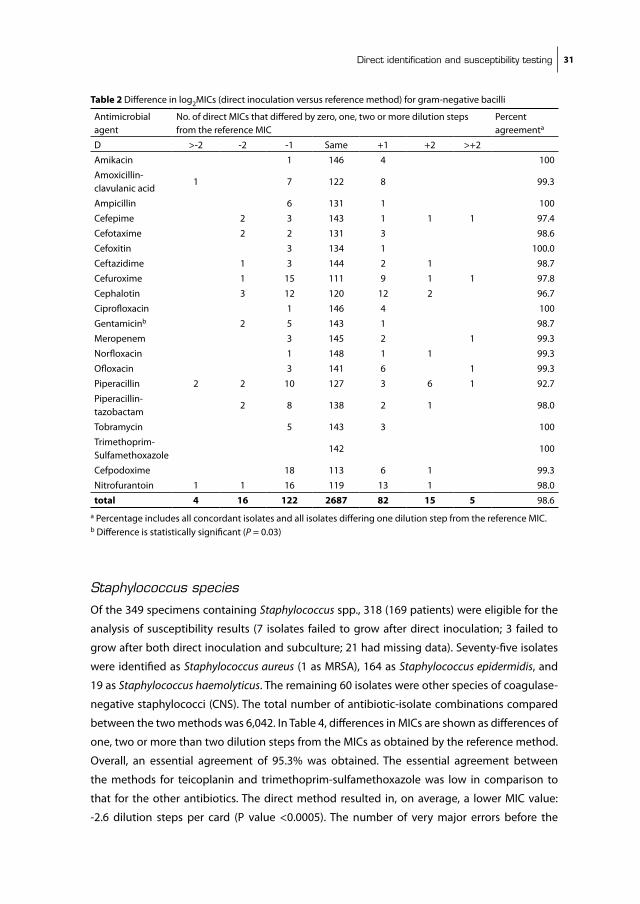
discrepancy analysis was 106 (6.5% of all resistant antibiotic-isolate combinations); the number
of major errors was 33 (0.8% of all susceptible antibiotic-isolate combinations); and the total
number of minor errors was 105. The category agreement was 96 %. A comparison of results
obtained with Staphylococcus aureus with results obtained with the other staphylococci yielded
similar findings. The number of very major errors before the discrepancy analysis was 4 (19 %
of all resistant antibiotic-isolate combinations [4.7 % after discrepancy analysis]); the number
of major errors was 5 (0.4% of all susceptible antibiotic-isolate combinations); and the total
number of minor errors was 32. The category agreement was 97 %. The MiC values showed
the same difference in dilution steps per card: -2.7 for Staphylococcus aureus and –2.6 for Cns.
However, resistance was 20-fold lower among the Staphylococcus aureus isolates when these
isolates were compared with the other staphylococcal isolates (1.5% overall resistance among
Staphylococcus aureus isolates vs. 35% among other Cns). Table 5 shows the number and type
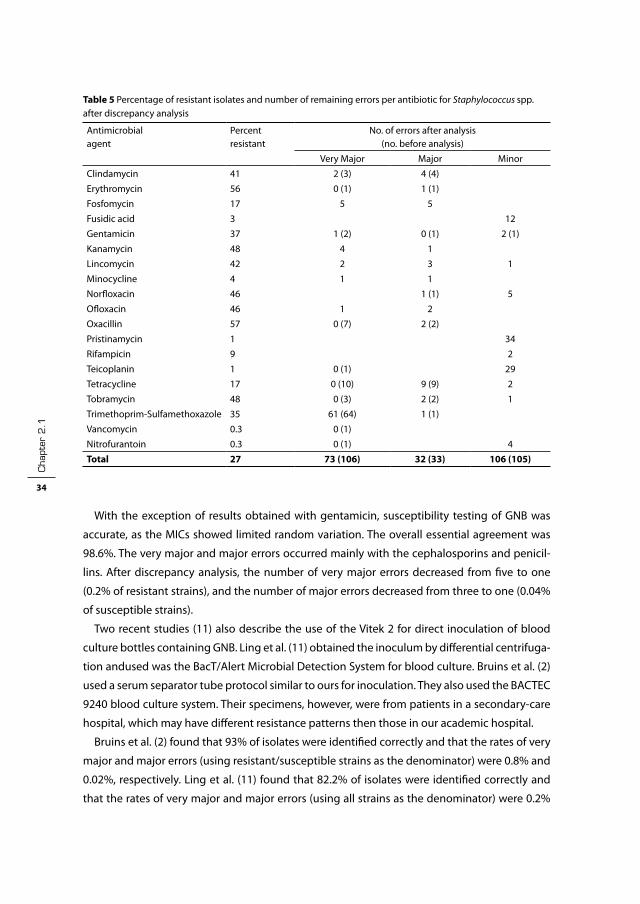
of errors of the direct method for each antibiotic after the discrepancy analysis as well as the
percentage of resistant strains according to the reference method.
Table 3 Percentage of resistant isolates and number of remaining errors per antibiotic for gram-negative bacilli after discrepancy analysis
Antimicrobialagent
Percent resistant no. of errors after analysis (no. before analysis)
Very Major Major Minor
Amikacin 2.0
Amoxicillin-clavulanic acid 28.8 0 (1) 2
Ampicillin 71.2 0 (1)
Cefepime 1.3 0 (1) 0 (1) 1
Cefotaxime 2.9 1
Cefoxitin 23.7 2
Ceftazidime 5.3 0 (1) 2
Cefuroxime 21.6 1 (1) 10
Cephalotin 34.5 9
Ciprofloxacin 8.6
Gentamicin 4.0
Meropenem 0.7 0 (1) 1 (0)
norfloxacin 8.6 2
Ofloxacin 7.9 2
Piperacillin 12.6 7
Piperacillin-tazobactam 2.0 6
Tobramycin 2.0 1
Trimethoprim-sulfamethoxazole
13.4
Cefpodoxime 6.5 3
nitrofurantoin 31.8 1 (1) 20
Total 14.5 1 (5) 1 (3) 69 (68)

direct identification and susceptibility testing 33
discussion
in this study we found that direct inoculation of nonfastidious Gnb resulted in a correct
identification rate of 80%. This is lower than 90%, which has been suggested as the minimal
rate of overall agreement for selecting a system for identification (2). However, in only one
case did a true misidentification occur. in the other cases, the instrument reported that the
specimen could not be identified. susceptibility testing of Gnb by direct inoculation showed,
after discrepancy analysis, a very major error rate of only 0.2%, a major error rate of 0.04% and
a category agreement of 97%. in contrast, susceptibility testing of staphylococci by direct
inoculation yielded a very major error rate of 4.5%, a major error rate of 0.8% and a category
agreement of 96%. When evaluating susceptibility testing methods, very major errors should
occur in <1.5% of all tests, and the overall agreement should be >95% (18). Results obtained in
our study were generated in a routine setting, i.e. all technicians were trained in the use of the
instrument before the start of this evaluation and handled the specimens during the study as
part of their regular duties.
Table 4 Difference in log2MiCs (direct inoculation versus reference method) for staphylococcus spp.
Antimicrobial agent
no. of direct MiCs that differed zero, one, two or more dilution steps from the reference MiC
Percent agreementa
D >-2 -2 -1 same +1 +2 >+2
Clindamycin 1 3 310 1 3 97.5
Erythromycin 1 11 298 7 1 99.4
Fosfomycin 1 26 281 7 3 98.7
Fusidic acidb 1 26 281 7 3 98.7
Gentamicinb 1 2 15 298 2 99.1
Kanamycinb 6 2 309 1 98.1
Lincomycin 1 1 1 313 1 1 98.7
Minocyclineb 1 2 302 2 2 9 95.6
norfloxacinb 30 67 213 7 1 90.3
Ofloxacin 4 311 1 2 99.4
Oxacillinb 5 2 35 262 12 2 97.2
Pristinamycinb 14 36 243 21 4 94.3
Rifampicin 3 314 1 100.0
Teicoplaninb 26 47 64 160 21 77.0
Tetracyclineb 2 7 33 260 13 1 2 96.2
Tobramycinb 4 10 301 3 98.7
Trimethoprim-sulfamethoxazoleb
31 50 27 205 3 2 73.9
Vancomycinb 1 50 262 5 99.7
nitrofurantoinb 5 78 215 19 1 98.1
Totalb 72 173 488 5138 132 14 25 95.3a Percentage includes all concordant isolates and all isolates differing one dilution step from the reference MiC. b differences are statistically significant (p= 0.02 or smaller)
cha
pter
2.1
34
With the exception of results obtained with gentamicin, susceptibility testing of Gnb was
accurate, as the MiCs showed limited random variation. The overall essential agreement was
98.6%. The very major and major errors occurred mainly with the cephalosporins and penicil-
lins. After discrepancy analysis, the number of very major errors decreased from five to one
(0.2% of resistant strains), and the number of major errors decreased from three to one (0.04%
of susceptible strains).
Two recent studies (11) also describe the use of the Vitek 2 for direct inoculation of blood
culture bottles containing Gnb. Ling et al. (11) obtained the inoculum by differential centrifuga-
tion andused was the bacT/Alert Microbial Detection system for blood culture. bruins et al. (2)
used a serum separator tube protocol similar to ours for inoculation. They also used the bACTEC
9240 blood culture system. Their specimens, however, were from patients in a secondary-care
hospital, which may have different resistance patterns then those in our academic hospital.
bruins et al. (2) found that 93% of isolates were identified correctly and that the rates of very
major and major errors (using resistant/susceptible strains as the denominator) were 0.8% and
0.02%, respectively. Ling et al. (11) found that 82.2% of isolates were identified correctly and
that the rates of very major and major errors (using all strains as the denominator) were 0.2%
Table 5 Percentage of resistant isolates and number of remaining errors per antibiotic for Staphylococcus spp. after discrepancy analysis
Antimicrobialagent
Percent resistant
no. of errors after analysis (no. before analysis)
Very Major Major Minor
Clindamycin 41 2 (3) 4 (4)
Erythromycin 56 0 (1) 1 (1)
Fosfomycin 17 5 5
Fusidic acid 3 12
Gentamicin 37 1 (2) 0 (1) 2 (1)
Kanamycin 48 4 1
Lincomycin 42 2 3 1
Minocycline 4 1 1
norfloxacin 46 1 (1) 5
Ofloxacin 46 1 2
Oxacillin 57 0 (7) 2 (2)
Pristinamycin 1 34
Rifampicin 9 2
Teicoplanin 1 0 (1) 29
Tetracycline 17 0 (10) 9 (9) 2
Tobramycin 48 0 (3) 2 (2) 1
Trimethoprim-sulfamethoxazole 35 61 (64) 1 (1)
Vancomycin 0.3 0 (1)
nitrofurantoin 0.3 0 (1) 4
Total 27 73 (106) 32 (33) 106 (105)
direct identification and susceptibility testing 35
and 0.4%, respectively. These results are comparable or slightly better than the results we found
for Gnb.
susceptibility testing of Staphylococcus spp. directly from blood culture bottles was less accu-
rate, with an overall essential agreement of 95.3%. The variation in MiC differences obtained by
direct inoculation in comparison to the method of reference was not random; for most antibiot-
ics, the direct method resulted in lower MiCs. The rate of major errors after the discrepancy
analysis was 0.8% for the susceptible strains. The rate of very major errors after the discrepancy
analysis was 4.5% for the resistant strains. The software of the Vitek 2 calculates MiCs by compar-
ing the kinetics of the positive control with the kinetics of the antibiotic-containing wells. When
testing staphylococci, however, some very major and major discrepancies occurred despite this
intelligent software, and the MiCs were also significantly lower with the direct method. Eighty
percent of the very major errors that remained after discrepancy analysis were due to errors
obtained with trimethoprim-sulfamethoxazole. if we correct for the high error rate obtained
with trimethoprim-sulfamethoxazole by removing this antibiotic from the direct panel, the
very major error rate would decrease to 0.7% (using resistant strains as the denominator) after
discrepancy analysis, and the category agreement would be 97.4%.
seven very major errors existed for oxacillin before discrepancy analysis. These errors
occurred with one Staphylococcus aureus isolate, one Staphylococcus epidermidis isolate, three
Staphylococcus hominis isolates, one Staphylococcus warneri isolate, and one Staphylococcus sp.
isolate. by agar dilution, the corresponding MiCs ranged from 0.25 to 2 µg/ml. These findings
were confirmed by the results of thelatex agglutination assay, which did not detect PbP 2’ in
any of these isolates.
Of the 1,023 specimens screened, 55 contained mixed cultures; of these, 43 (4.2%) appeared
monomicrobial in the Gram stain. This is comparable to the 5.1% mixed cultures found by
bruins et al. (2) and the 6.3% found by Waites et al. (18).The Vitek 2 uses a kinetic method to
calculate MiCs. Therefore, the MiC reported will be based on the most abundant or fastest-
growing organism. This could lead to the reporting of overly sensitive susceptibility results.
Rapid identification and susceptibility testing are suggested to result in a better outcome for
the patient, a reduction in the use of broad-spectrum antibiotics, and lower total patient costs
(1, 3, 16). With regard to these benefits, the method of direct inoculation we evaluated in this
study could make a valuable contribution to patient care.
Direct susceptibility testing of staphylococci looks promising, especially when trimethoprim-
sulfamethoxazole is removed from the direct panel. However, due to the limited resistance of
Staphylococcus aureus isolates in the netherlands, another study in an area with high resistance
among Staphylococcus aureus isolates seems warranted before direct susceptibility testing can
be advocated in those regions. Findings from other studies showing similar good results for
Gnb suggest that this method of direct inoculation of these bacilli in the Vitek 2 instrument can
be applied on a wider scale. Repeat testing seems necessary only when identification results
are inconclusive or when susceptibility results are inconsistent; all other results can be reported

cha
pter
2.1
36
directly. in our hospital we now use direct inoculation of Gnb on a routine basis, while direct
inoculation of staphylococci is performed only upon special request.
Acknowledgements
We thank n.A. Lemmens and H.J.A. van Vliet for technical assistance. This study was supported
by a grant from bioMérieux.
direct identification and susceptibility testing 37
referenceS
1. barenfanger, J., C. Drake, and G. Kacich. 1999. Clinical and financial benefits of rapid bacterial identifi-cation and antimicrobial susceptibility testing. J Clin Microbiol 37:1415-8.
2. bruins, M. J., P. bloembergen, G. J. Ruijs, and M. J. Wolfhagen. 2004. identification and susceptibility testing of Enterobacteriaceae and Pseudomonas aeruginosa by direct inoculation from positive bACTEC blood culture bottles into Vitek 2. J Clin Microbiol 42:7-11.
3. Doern, G. V., R. Vautour, M. Gaudet, and b. Levy. 1994. Clinical impact of rapid in vitro susceptibility testing and bacterial identification. J Clin Microbiol 32:1757-62.
4. Goessens, W. H., n. Lemmens-den Toom, J. Hageman, P. W. Hermans, M. sluijter, R. de Groot, and H. A. Verbrugh. 2000. Evaluation of the Vitek 2 system for susceptibility testing of streptococcus pneu-moniae isolates. Eur J Clin Microbiol infect Dis 19:618-22.
5. Hansen, D. s., A. G. Jensen, n. norskov-Lauritsen, R. skov, and b. bruun. 2002. Direct identification and susceptibility testing of enteric bacilli from positive blood cultures using ViTEK (Gni+/Gns-GA). Clin Microbiol infect 8:38-44.
6. Howard, W. J., b. J. buschelman, M. J. bale, M. A. Pfaller, F. P. Koontz, and R. n. Jones. 1996. Vitek GPs card susceptibility testing accuracy using direct inoculation from bACTEC 9240 blood culture bottles. Diagn Microbiol infect Dis 24:109-12.
7. Jossart, M. F., and R. J. Courcol. 1999. Evaluation of an automated system for identification of Entero-bacteriaceae and nonfermenting bacilli. Eur J Clin Microbiol infect Dis 18:902-7.
8. Joyanes, P., M. del Carmen Conejo, L. Martinez-Martinez, and E. J. Perea. 2001. Evaluation of the ViTEK 2 system for the identification and susceptibility testing of three species of nonfermenting gram-negative rods frequently isolated from clinical samples. J Clin Microbiol 39:3247-53.
9. Kempf, V. A., K. Trebesius, and i. b. Autenrieth. 2000. Fluorescent in situ hybridization allows rapid identification of microorganisms in blood cultures. J Clin Microbiol 38:830-8.
10. Ligozzi, M., C. bernini, M. G. bonora, M. De Fatima, J. Zuliani, and R. Fontana. 2002. Evaluation of the ViTEK 2 system for identification and antimicrobial susceptibility testing of medically relevant gram-positive cocci. J Clin Microbiol 40:1681-6.
11. Ling, T. K., Z. K. Liu, and A. F. Cheng. 2003. Evaluation of the ViTEK 2 system for rapid direct identifica-tion and susceptibility testing of gram-negative bacilli from positive blood cultures. J Clin Microbiol 41:4705-7.
12. Ling, T. K., P. C. Tam, Z. K. Liu, and A. F. Cheng. 2001. Evaluation of ViTEK 2 rapid identification and susceptibility testing system against gram-negative clinical isolates. J Clin Microbiol 39:2964-6.
13. Maquelin, K., C. Kirschner, L. P. Choo-smith, n. A. ngo-Thi, T. van Vreeswijk, M. stammler, H. P. Endtz, H. A. bruining, D. naumann, and G. J. Puppels. 2003. Prospective study of the performance of vibrational spectroscopies for rapid identification of bacterial and fungal pathogens recovered from blood cultures. J Clin Microbiol 41:324-9.
14. Putnam, L. R., W. J. Howard, M. A. Pfaller, F. P. Koontz, and R. n. Jones. 1997. Accuracy of the Vitek system for antimicrobial susceptibility testing Enterobacteriaceae bloodstream infection isolates: use of “direct” inoculation from bactec 9240 blood culture bottles. Diagn Microbiol infect Dis 28:101-4.
15. standards., n. C. f. C. L. 2002. Performance standards for antimicrobial susceptibility testing, 12th informational supplement. Approved standard M100-s12, Wayne, Pa.
16. Trenholme, G. M., R. L. Kaplan, P. H. Karakusis, T. stine, J. Fuhrer, W. Landau, and s. Levin. 1989. Clini-cal impact of rapid identification and susceptibility testing of bacterial blood culture isolates. J Clin Microbiol 27:1342-5.
17. Waites, K. b., E. s. brookings, s. A. Moser, and b. L. Zimmer. 1998. Direct bacterial identification from positive bacT/Alert blood cultures using Microscan overnight and rapid panels. Diagn Microbiol infect Dis 32:21-6.
18. Waites, K. b., E. s. brookings, s. A. Moser, and b. L. Zimmer. 1998. Direct susceptibility testing with positive bacT/Alert blood cultures by using Microscan overnight and rapid panels. J Clin Microbiol 36:2052-6.

Chapter 2.2
rapid identification of Staphyloccocus aureus in positive blood cultures by Slidex Staph Plus® agglutination test
J.J. Kerremans*, W.H.f. Goessens*, H.A. Verbrugh*,
m.c. Vos*
*Department of Medical Microbiology & Infectious Diseases, Erasmus MC,
University Medical Center, Rotterdam, the Netherlands
Journal of Clinical Microbiology 2008 46:395.


direct identification of S.aureus 41
in two recent editions of the Journal, Qian et al. (4) and Lagace-Wiens et al. (2) describe a direct
coagulase and a thermostable Dnase test, respectively, for direct identification of Staphylococ
cus aureus from positive blood culture bottles.
in a prospective study from April 2003 until February 2004, we investigated the accuracy of
the slidex staph Plus® agglutination test (bioMérieux, Marcy-l’Étoile, France) on positive blood
cultures containing Gram-positieve cocci in clusters resembling staphylococci. This agglu-
tination test utilizes latex particles sensitized with human fibrinogen and S. aureus-specific
monoclonal antibodies. These monoclonal antibodies detect protein A by the Fc fragment of
immunoglobulin G as well as different polysaccharide antigens on the bacterial cell surface.
Parallel to the routine subculture on blood agar plates (Columbia iii blood agar base with 5%
sheep red blood cells, becton Dickinson), 6 ml from each positive bactec (becton Dickinson,
sparks, MD, UsA) bottle was injected in a serum separator tube (becton Dickinson). This tube
was centrifuged at 2,000×g for 10 min. subsequently, the supernatant was removed and a
sample from the top of the separator layer containing the bacteria was taken with a sterile swab
and subcultured on a blood agar plate. After incubation for a minimum of 4 h and a maximum
of 6 h at 35 °C with 5% CO2, growth from this blood agar plate was tested with the slidex staph
Plus® test. The following day, the same agglutination test was performed on colonies from
blood agar plates routinely subcultured and incubated overnight. All agglutination-positive
isolates were confirmed to be S. aureus with a probe-hybridization assay (Accuprobe, Gen-
Probe, san Diego,UsA).
A total of 249 positive blood cultures containing staphylococci were evaluated. Growth from
a 4-6-h subculture on blood agar was compared with growth from an overnight subculture.
Four blood cultures yielding coagulase negative staphylococci were excluded from the analysis
due to insufficient growth in the direct assay. The results of the remaining 245 blood cultures
are summarized in Table 1. There were 56 agglutination test positive overnight cultures of which
one was negative in the probe hybridization. The sensitivity, specificity, and positive and nega-
tive predictive values for the agglutination test on short incubated culture (4-6 h) compared
Table 1 slidex® staph Plus agglutination test for identifying staphylococci directly from positive blood culture bottles. Growth from a 4-6 h subculture on blood agar was compared with growth from an overnight subculture.
agglutination after 4-6 h culture agglutination after overnight culture
Positive negative
Positive 54* 1**
negative 2*** 188
* One agglutination test positive Staphylococcus was negative in the probe hybridization. ** One blood culture was slidex positive in 4-6 h test but after overnight culture it showed auto agglutination. The 4-6 h culture was, erroneously, not tested for auto agglutination. The isolate was probe hybridization negative. *** Probe hybridization positive

cha
pter
2.2
42
with the test agglutination test on overnight culture as reference method were 96% (95% Ci:
87-99%), 99%(95% Ci: 97- 99.9%), 98% (95% Ci: 89-99.9%) and 99% (95% Ci: 96-99.8%)
This direct slidex staph Plus® test method is easy to perform and provides reliable same day
identification results in comparison with the reference method. The sensitivity of this agglutina-
tion method after a short period of subculture incubation is higher than that reported for direct
testing by staphaurex Plus on the bacterial pellet (23%)(5), and is also higher than the tube
coagulase test (65 to 85%) (1, 4), and comparable to the sensitivity of FisH (98%) (1, 3) and
thermostable Dnase test (100%) (2). Although this technique utilized the slidex staph Plus,
which is considered a reliable agglutination test (6), other agglutination tests will probably
have comparable results, but differences in sensitivity and specificity can occur. These posi-
bilities should be evaluated. The additional costs of this test are low. no specific equipment is
needed except for a serum separator tube and the procedure requires limited hands on time.
Therefore, we recommend our method for direct testing of bactec blood culture bottles grow-
ing staphylococci.
direct identification of S.aureus 43
referenceS
1. Chapin, K., and M. Musgnug. 2003. Evaluation of three rapid methods for the direct identification of staphylococcus aureus from positive blood cultures. J Clin Microbiol 41:4324-7.
2. Lagace-Wiens, P. R., M. J. Alfa, K. Manickam, and J. A. Karlowsky. 2007. Thermostable Dnase is superior to Tube Coagulase for the Direct Detection of staphylococcus aureus in Positive blood Cultures. J Clin Microbiol 45:3478-9
3. Peters, R. P., P. H. savelkoul, A. M. simoons-smit, s. A. Danner, C. M. Vandenbroucke-Grauls, and M. A. van Agtmael. 2006. Faster identification of pathogens in positive blood cultures by fluorescence in situ hybridization in routine practice. J Clin Microbiol 44:119-23.
4. Qian, Q., K. Eichelberger, and J. E. Kirby. 2007. Rapid identification of staphylococcus aureus in blood cultures by use of the direct tube coagulase test. J Clin Microbiol 45:2267-9.
5. speers, D. J., T. R. Olma, and G. L. Gilbert. 1998. Evaluation of four methods for rapid identification of staphylococcus aureus from blood cultures. J Clin Microbiol 36:1032-4.
6. van Griethuysen, A., M. bes, J. Etienne, R. Zbinden, and J. Kluytmans. 2001. international multicenter evaluation of latex agglutination tests for identification of staphylococcus aureus. J Clin Microbiol 39:86-9.


Chapter 3
detection of methicillin-resistant Staphylococcus aureus in a low–prevalence setting by Pcr with a selective enrichment broth
J.J. Kerremans, J. maaskant, H.A. Verbrugh, W.B. van
Leeuwen, m.c. Vos
dept. of medical microbiology & infectious diseases, erasmus
mc–university medical center, rotterdam, the netherlands
Diagnostic Microbiology and Infectious Disease 2008,61, 396–401

cha
pter
3
46
ABStrAct
The objective of this study was to evaluate the test characteristics of a modified bD GeneOhm
methicillin-resistant Staphylococcus aureus (MRsA) assay on individual and pooled samples in
a setting of low MRsA prevalence. The results of the polymerase chain reaction (PCR) assay
were compared with culture results from a selective phenol red mannitol broth subcultured
after 48 h. sensitivity, specificity, and positive and negative predictive values (PPV and nPV,
respectively) were calculated. For individual testing, 581 samples from 201 persons were
collected; 18 (3.2%) were MRsA culture positive. Five hundred ten broths from 174 persons
were combined in 106 pools after overnight incubation; 8 pools (7.5%) contained 1 or more
MRsA culture-positive specimens. There were no inhibited PCR tests. The combined sensitiv-
ity of individual and pooled specimens was 92% (95% confidence interval [Ci], 73–99%), the
specificity was 98% (95% Ci, 96–99%), and the PPVand nPV were 63% and 99.7%, respectively.
Our modified procedure gives satisfactory results, and the pooling of broths may reduce costs.
mrSA-Pcr after enrichment 47
introduction
Rapid detection of Methicillin Resistant Staphylococcus aureus (MRsA) carriage can improve
patient care and, by accelerating implementation of infection control measures, decrease the
risk of MRsA transmission. Furthermore, rapid identification of persons free from MRsA can
significantly decrease the number of isolation days. This is especially important when using a
“search and Destroy” strategy, as in this latter case patients at risk for MRsA colonization are iso-
lated until proven negative. Furthermore, the rapid identification of carriers during an outbreak
facilitates outbreak management and will stop further transmission in an earlier phase. Due
to low prevalence (<1%)(12), MRsA coverage is not included in standard empirical antibiotic
therapy regimens in the netherlands. Therefore, in this country early identification of MRsA
carriers is also important for optimizing therapeutic decisions.
The bD-GeneOhm MRsA Assay, formerly known as the iDi MRsA assay, has been primarily used
in high prevalence settings. Most studies describe direct application of iDi assay on swabs(1-4,
8, 9, 11, 15, 17, 18). The PCR assay performed directly on swabs demonstrated relatively high
rates of initial inhibition, ranging from 0.3 to 8.8% of specimens, which would compromise its
usefulness in daily practice. We hypothesized that the introduction of a pre-incubation step
in a selective broth would circumvent inhibition and increase the sensitivity and specificity of
the assay. We also exchanged the standard DnA-isolation kit for a sigma Extract-n-Amp plant
Reagent Kit because this latter kit is easier to use and automate.
The present study aimed to compare the performance of a modified bD-GeneOhm MRsA
PCR assay on individual and pooled samples, with selective broth cultures as a screenings-tool
in areas with low MRsA prevalence.
materials and methods
Setting. The study was performed in the Erasmus University Medical Center, a 1200-bed
tertiary-care university teaching hospital, in Rotterdam, the netherlands. specimens were
collected prospectively, in April and May 2006 and from October 2006 through January 2007.
Specimen collection. screening of patients and healthcare workers, at risk for MRsA
colonization was performed according to the Dutch national guidelines [http: //www.wip.
nl]. nasal, throat and rectal specimens and, when indicated, swabs from other sites including
tracheostoma, wounds and catheter exit sites were obtained from at-risk patients. From at-risk
healthcare workers only nasal and throat specimens were collected. specimens were submit-
ted to our diagnostic medical microbiology laboratory in Amies transport medium (Transystem
Amies, Copan, brescia, italy). swabs were inoculated on blood agar plates and incubated at 35°
C with ambient air. After overnight incubation, plates were screened for growth. When bacterial
growth was less than 15 colony-forming units, new specimens were requested and the broth
was discarded.
cha
pter
3
48
Culture method. Collected swabs were individually cultured in 6 ml of phenol-red mannitol
broth (PHMb) (becton Dickinson, Le Pont de Claix, France) supplemented with 75 µg/ml of
aztreonam (bristol-Myers squibb) and 5 µg/ml of ceftizoxime (Yamanouchi, Leiderdorp, the
netherlands) (16). The PHMb was incubated under static conditions, at 35° C in ambient air, and
subcultured after 48h onto 5% sheep blood agar (becton Dickinson). Colonies suspected to be
S. aureus were tested by slidex ® staph Plus (bioMérieux, Marcy-l’Étoile, France) for presumptive
identification. All S. aureus isolates recovered from broths were tested by disk diffusion with
30-µg cefoxitin disks (Oxoid, badhoevedorp, the netherlands), according to Clinical and Labora-
tory standards institute recommendations (5). in case of a zone diameter less than 21 mm, the
presence of the modified penicillin binding protein (PbP 2a) was tested by latex agglutination
(MRsA-screen, Denka seiken, Tokyo, Japan). if there was a disconcordance between cefoxitin
zone diameter and latex agglutination, an in-house mecA PCR (6) was performed. The Accu-
probe (Gen-Pobe, san Diego, UsA) was used to confirm the identity of all S. aureus that were
MRsA latex screen test and mecA PCR positive. All strains were sent to the national reference
laboratory (RiVM, bilthoven, the netherlands) for confirmation.
MRSA PCR testing from broth
Principle of the test: This test is based on real time PCR detection of the 3’end-ssCmec and
adjacent s. aureus-specific DnA (orfX). The probes are developed to target the direct-repeat/
inverted-repeat sequence at the transition of sCCmec and sA genome. There is no info supplied
by bD concerning the internal control.
Individual specimens. We modified the bD-Gene Ohm MRsA assay procedure by overnight
(16-24h) pre-incubation of swabs in a selective enrichment broth. Furthermore, we changed
the DnA-isolation kit provided, and used a different PCR processor. DnA for the MRsA PCR
assay was extracted using the sigma Extract-n-Amp plant Reagent Kit (sigma, saint Louis, UsA).
Previously, we had compared (data not shown) the provided bD lysis Kit and the performance
of both tests was concordant. We noticed that with the bD lysis protocol, some of the nasal
swabs inhibited the PCR amplification. This was not the case with sigma extraction kit. A 50-µl
aliquot of the broth, also used for the 48h culture, incubated overnight was transferred into 100
µl extraction solution and incubated for 10 min at 95°C. subsequently, 100 µl dilution buffer
was added. Diluted lysate (2.8 µl) was mixed with 25 µl of Mastermix bD-Gene Ohm MRsA (bD
diagnostics, Rene Levesque O, ste-foy, Qc, Canada) prepared according to the manufacturer’s
guidelines. The PCR was performed on the Mini-Opticon thermalprocessor (biorad, Veenendaal,
the netherlands). The PCR protocol was adjusted for the bioRad Miniopticon by bD. The PCR
program ran for 15 min at 95°C followed by 45 cycles of 5 s at 95°C; 15 s at 59°C; and 20 s at 72°C.
The negative threshold level of the assay is defined as two times the s.D. above the cumulative
average of all negative PCR results.
Pooled Specimens. Apart from the samples mentioned above, other specimens were pooled
to assess sensitivity, specificity, positive (PPV) and negative predictive values (nPV). Five
mrSA-Pcr after enrichment 49
specimens were pooled together by transferring 50-µl of each overnight broth into one reagent
tube (1.5 ml Eppendorf ) and after vortexing, a 50-µl aliquot was transferred into the extraction
solution buffer. DnA isolation and PCR tests of pooled and individual samples were performed
identically. Culture methods were as described above. Pooled samples were statistically consid-
ered to be a single test entity; this means that if one of the pooled samples was culture positive,
the pool was considered to be culture positive.
Statistical analysis. The sensitivity, specificity, PPV and nPV for the PCR assay were calculated
by comparing the PCR results to those obtained with the conventional broth culture as refer-
ence standard (gold standard). The respective 95% confidence intervals (Ci) were calculated
using the Vassarstats web site [http://faculty.vassar.edu/ lowry/Vassarstats.html]
Analysis of discrepant results. PCR negative/culture positive results were always considered
to represent true PCR false negatives. PCR positive/culture negative (PCR+/cult-) results
were analyzed by checking the laboratory information system and patient records. A PCR+/
cult- specimen from patients who had MRsA-positive cultures two weeks before or after this
specimen was considered to be a true positive. The same applied to specimens from patients
receiving decolonisation treatment. Other PCR+/cult- specimens were considered false posi-
tives. The CT values of the false positives were compared with the CT values of the culture posi-
tive together with the discrepancy analysis true positives.
Review. We conducted a Medline search of the literature with the following search terms: “iDi
MRsA” or “bD Gene Ohm MRsA”, limited to humans. All studies in the English language that
compared the iDi/bD gene Ohm assay with any culture method as reference standard were
included. Results before discrepancy analysis were extracted and tabulated. However, from
studies that used selective broth as discrepancy analysis for PCR+ /cult- results and not for all
cultures, the interpretation after this discrepancy analysis was used. The raw data was extracted,
if available. With this data, an additive contingency table was constructed by, separately adding
PCR+/ cult+, PCR+/cult-, PCR-/cult-, and PCR-/cult + together. Overall sensitivity, specificity, PPV
and nPV for the PCR assay were calculated from this contingency table.
reSuLtS
Individual specimens. A total of 581 samples from 201 persons were taken. Eighteen of the
581 (3.2%) were MRsA culture positive and 563 were culture negative. There were no inhibited
or otherwise unresolved PCR results. Table 1 summarizes the results.
Pooled specimens. After overnight incubation 510 swabs from 174 persons were combined
in 106 pools (4.8 swabs per pool). Of the pooled broths, 8 (7.5%) contained one or more MRsA
culture positive specimens and 98 were MRsA culture negative. There were no inhibited or
otherwise unresolved PCR results. Table 1 summarizes the results.
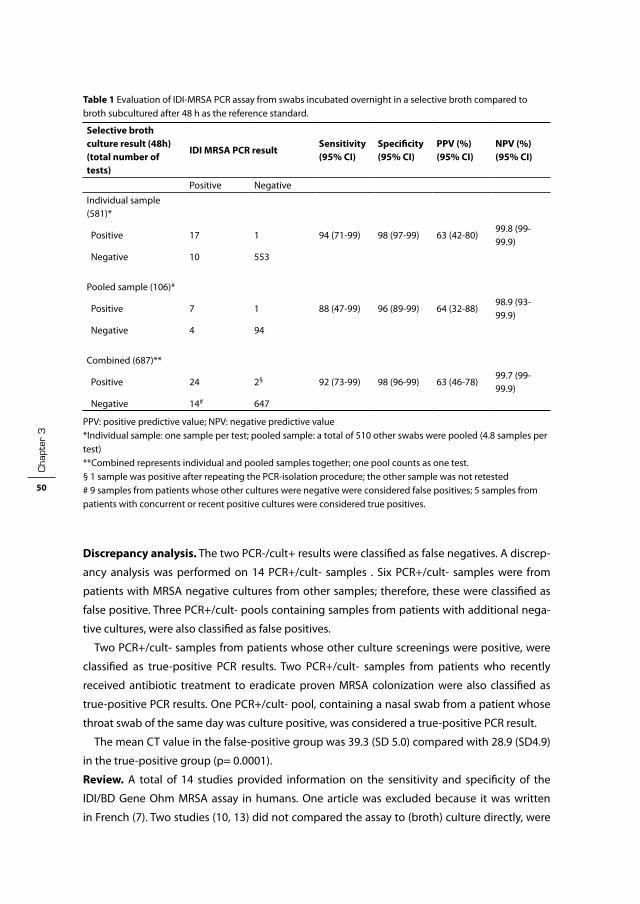
cha
pter
3
50
Discrepancy analysis. The two PCR-/cult+ results were classified as false negatives. A discrep-
ancy analysis was performed on 14 PCR+/cult- samples . six PCR+/cult- samples were from
patients with MRsA negative cultures from other samples; therefore, these were classified as
false positive. Three PCR+/cult- pools containing samples from patients with additional nega-
tive cultures, were also classified as false positives.
Two PCR+/cult- samples from patients whose other culture screenings were positive, were
classified as true-positive PCR results. Two PCR+/cult- samples from patients who recently
received antibiotic treatment to eradicate proven MRsA colonization were also classified as
true-positive PCR results. One PCR+/cult- pool, containing a nasal swab from a patient whose
throat swab of the same day was culture positive, was considered a true-positive PCR result.
The mean CT value in the false-positive group was 39.3 (sD 5.0) compared with 28.9 (sD4.9)
in the true-positive group (p= 0.0001).
Review. A total of 14 studies provided information on the sensitivity and specificity of the
iDi/bD Gene Ohm MRsA assay in humans. One article was excluded because it was written
in French (7). Two studies (10, 13) did not compared the assay to (broth) culture directly, were
Table 1 Evaluation of iDi-MRsA PCR assay from swabs incubated overnight in a selective broth compared to broth subcultured after 48 h as the reference standard.
Selective broth culture result (48h)(total number of tests)
IDI MRSA PCR resultSensitivity(95% CI)
Specificity(95% CI)
PPV (%)(95% CI)
NPV (%)(95% CI)
Positive negative
individual sample (581)*
Positive 17 1 94 (71-99) 98 (97-99) 63 (42-80)99.8 (99-99.9)
negative 10 553
Pooled sample (106)*
Positive 7 1 88 (47-99) 96 (89-99) 64 (32-88)98.9 (93-99.9)
negative 4 94
Combined (687)**
Positive 24 2§ 92 (73-99) 98 (96-99) 63 (46-78)99.7 (99-99.9)
negative 14# 647
PPV: positive predictive value; nPV: negative predictive value*individual sample: one sample per test; pooled sample: a total of 510 other swabs were pooled (4.8 samples per test)**Combined represents individual and pooled samples together; one pool counts as one test.§ 1 sample was positive after repeating the PCR-isolation procedure; the other sample was not retested# 9 samples from patients whose other cultures were negative were considered false positives; 5 samples from patients with concurrent or recent positive cultures were considered true positives.
mrSA-Pcr after enrichment 51
therefore also excluded. The outcomes of the remaining 11 publications are summarized in
Table 2. The calculated overall sensitivity, specificity, PPV and nPV were 91% (95% Ci:89-93),
96% (95% Ci 96-97), 75% (95 Ci 71-78) and 99% (95% Ci 99-99%), respectively.
diScuSSion
in this study, we found a sensitivity (92%) and specificity (98%) which is comparable to that
found in the literature. Also, the assay had an excellent nPV (99%), but a low PPV(63%). There-
fore, negative PCR results can be relied on, but positive PCR results need to be confirmed by
culture. The pre-incubation step also eliminated the problem of initial inhibition of the direct
PCR assay, which ranged from 0.3 to 8.8% in other studies. Pooling of samples did not signifi-
cantly reduce the sensitivity and specificity of the assay but did reduce costs.
The sensitivity of our modified assay was not significantly improved as compared to other
studies, due to the large confidence interval. This is due to the small number of MRsA-positive
specimens in our study. Of the two PCR false-negative broths (PCR-/cult+), one was positive
after repeating the DnA isolation from the broth. it was not possible to retest the other broth,
but the MRsA strain was identified correctly by the PCR in another specimen from the same
patient. Therefore, this failure could be explained by either a lower detection limit of the PCR
assay compared to broth culture or to a technical error, but the strain could be identified by
the PCR assay and was not due to an unknown ssC mec type. Unknown ssC mec types are a
potential threat to sensitivity, as it will take some time before these new types are incorporated
in the assay.
The 14 PCR+/cult- specimens could be divided into two groups. Five specimens were from
patients who were either culture positive at another site or received treatment for their proven
MRsA carriage. nine PCR+/cult- specimens were from persons who never had been MRsA
positive. in the samples from the known MRsA patients, MRsA-DnA was very likely present.
Whether, this DnA represented viable bacteria is unknown, as the detection limit of the PCR
assay for DnA could be lower than the detection limit for viable organisms of the broth culture.
From the samples from persons who never were MRsA positive either Methecilline sensitive
S. aureus (MssA) or coagulase negative staphylococci (Cons) were isolated. These false-positive
specimens had significantly higher CT values. The probes used in the bD GeneOhm MRsA
assay hybridize to the direct repeat and inverted region in the 3’ border region of ssC mec.
This region is also present in methicillin-resistant Cons and MssA strains. Through “biological
amplification” in the enrichment phase, it is likely that probes will hybridize in time resulting
in a false-positive signal displaying high CT values. if we recalculate our evaluation using < 40
cycles, this increases the PPV to 90%with no significant effect on sensitivity, specificity and nPV.
There was no significant difference in performance of the PCR assay between individual
and pooled samples. bishop et al. (1) compared pooled nasal and rectal swabs from the same

cha
pter
3
52
Tabl
e 2
Ove
rvie
w o
f pub
licat
ions
whi
ch c
ompa
re iD
i-MRs
A w
ith a
cul
ture
.
Firs
t Aut
hor
Year
of
publ
icat
ion
spec
imen
type
Refe
renc
e m
etho
d%
Init
ial
Inhi
biti
onN
umbe
r of
sa
mpl
es
N (%
) cul
ture
M
RSA
pos
itiv
eSe
nsit
ivit
y(%
)Sp
ecifi
city
(%)
PPV
(%
)N
PV
(%)
Des
jard
ins#
2006
nas
al a
nd re
ctal
brot
h cu
lture
<1%
285
74(2
6%)
9696
9098
bish
op20
06n
asal
Dire
ct p
latin
g an
d (s
elec
tive)
bro
th5.
2%*
192
26(1
4%)
8995
7298
Gro
inD
irect
pla
ting
and
(sel
ectiv
e) b
roth
5.2%
*19
222
(11%
)82
9256
98
nas
al/g
roin
co
mbi
ned§
Dire
ct p
latin
g an
d (s
elec
tive)
bro
th5.
2%*
192
31(1
6%)
8794
7597
Obe
rdor
fer
2006
nas
alD
irect
pla
ting
and
(sel
ectiv
e) b
roth
**
8.8%
304
12(4
%)
100
9975
100
Ross
ney
2007
nas
al, g
roin
, thr
oat
Dire
ct p
latin
g an
d (s
elec
tive)
bro
th1.
8%60
311
9 (2
0%)
8296
8296
De
san
2007
Vario
usD
irect
pla
ting
and
(sel
ectiv
e) b
roth
0.3%
997
99
(10%
)81
9775
98
War
ren
2004
nas
alD
irect
pla
ting
and
(sel
ectiv
e) b
roth
0.7%
288
72
(25%
)92
9483
97
Dre
ws
2006
Vario
us
Dire
ct p
latin
g 6%
307
99(3
2%)
9693
8698
Paul
e20
07n
asal
Dire
ct p
latin
g##
1%39
949
(12%
)98
9677
99.7
Wre
n20
06n
asal
Dire
ct p
latin
g##
n.A
.12
1180
(7%
)95
9984
99.6
Zhan
g20
07Va
rious
Dire
ct p
latin
g##
6.7%
2127
111
(5%
)95
9553
99.7
Gilp
in~
2007
nas
al (o
ld iD
i) §
Dire
ct p
latin
gn
.A.
720
24
(3%
)88
9872
99
nas
al (
upda
ted
iDi)
§D
irect
pla
ting
n.A
.17
317
(10%
) 10
095
7110
0
Ove
rall
N.A
.69
0576
4(1
3%)
9196
7599
n.A
.: no
t ava
ilabl
e #:
use
d po
oled
spe
cim
en in
cuba
ted
over
nigh
t in
a se
lect
ive
brot
h *
Dat
a on
inhi
bitio
n w
ere
not s
peci
fied
to s
ubgr
oups
**Au
thor
s co
mpa
red
PCR
from
nas
al s
wab
s w
ith c
ultu
re fr
om n
asal
sw
abs
only
and
with
cul
ture
resu
lts fr
om a
ll bo
dy s
ites.
nas
al c
ultu
re re
sults
are
use
d he
re.
## b
roth
cul
ture
for d
iscr
epan
cies
. ~:
Raw
dat
a no
t ava
ilabl
e §
not i
nclu
ded
in c
alcu
latio
n of
ove
rall
sens
itivi
ty ,
spec
ifici
ty, P
PV a
nd n
PV

mrSA-Pcr after enrichment 53
patient with the individual swabs; they also found that there was no difference in performance
between the individual and the pooled specimens. Pooling of broths instead of swabs has the
advantage that, when a pool is positive, its samples can be retested individually on the same
day in the next run. We pooled samples from different patients together in a single pool leading
to an efficient and highly organized procedure that can easily be automated by instructing a
robot to pipit aliquots of five consecutive broths together. such an automated procedure, using
another PCT test, has been used to resolve a large outbreak in the netherlands in 2005.(14)
in a setting of low prevalence, pooling would be an effective measure to reduce assay cost,
as only a small percentage of pools would have to be individually retested. in our setting with
pools of 5 specimens and 3.2 % MRsA prevalence in the screening population, a maximum of
36 tests per 100 specimens would be needed. if MRsA prevalence would be higher than 16%,
pooling in sets of 5 specimens would no longer be cost effective. However, a smaller pool size
could still reduce costs (E.g. all specimens of a single patient).
The more sensitive the reference method, the better the true test characteristics can be
estimated. To assess the influence of the reference method on the calculated performance of
the PCR assay, we compared the studies initially using selective broth and direct plating with
those initially using direct plating, including the studies that used a selective broth for PCR+/
cult- discrepancies. The overall sensitivity, specificity, PPV and nPV of studies using selective
broth initially were 87% (95% Ci:83-90%), 96% (95% Ci 95-97%), 79% and 98%, respectively.
The overall sensitivity, specificity, PPV and nPV of studies using direct plating initially were 96%
(95% Ci: 93-98%), 96% (95% Ci 96-97%), 70% and 99.6%, respectively. Therefore, studies using
direct plating overestimate the sensitivity of the PCR assay by approximately 9%.
Compared to the studies using a selective broth as reference category our results show
a increased sensitivity, probably due to the pre-incubation step. However, this difference in
sensitivity was not significant, due to the low MRsA carriage rate in our population. The disad-
vantage of the pre-incubation step is, of course, the overnight delay before results are available.
Therefore, we recommend further evaluation of the pre-incubation step in a setting of high
endemicity. However, in a setting of low MRsA-prevalence the excellent nPV of 99.7 (95% Ci
99-99.9) can rule out colonization effectively.
Conclusion. The bD GeneOhm MRsA assay on specimens incubated overnight in a selective
broth has shown to be a reliable screening test with a sensitivity of 92%, specificity of 98%, and
positive and negative predictive values of 63% and 99% respectively. negative sample results
are reliable so that MRsA colonization can be ruled out. it is possible to pool specimens to
reduce costs without reducing sensitivity
cha
pter
3
54
referenceS
1. bishop, E. J., E. A. Grabsch, s. A. ballard, b. Mayall, s. Xie, R. Martin, and M. L. Grayson. 2006. Concurrent analysis of nose and groin swab specimens by the iDi-MRsA PCR assay is comparable to analysis by individual-specimen PCR and routine culture assays for detection of colonization by methicillin-resistant staphylococcus aureus. J Clin Microbiol 44:2904-8.
2. de san, n., O. Denis, M. F. Gasasira, R. De Mendonca, C. nonhoff, and M. J. struelens. 2007. Controlled evaluation of the iDi-MRsA assay for detection of colonization by methicillin-resistant staphylococ-cus aureus in diverse mucocutaneous specimens. J Clin Microbiol 45:1098-101.
3. Drews, s. J., b. M. Willey, n. Kreiswirth, M. Wang, T. ianes, J. Mitchell, M. Latchford, A. J. McGeer, and K. C. Katz. 2006. Verification of the iDi-MRsA assay for detecting methicillin-resistant staphylococcus aureus in diverse specimen types in a core clinical laboratory setting. J Clin Microbiol 44:3794-6.
4. Gilpin, D. F., M. M. Tunney, C. Funston, K. savage, A. Gardiner, and M. P. Kearney. 2007. Rapid detection of MRsA in a routine diagnostic laboratory using a real-time PCR assay. J Hosp infect 67:97-9.
5. Clinical and Laboratory standards institute 2006. Performance standars for Antimicrobial suscep-tibility Testing; sixteenth infomational supplement, M100-s16. Clinical and Laboratory standards institute, Wayne, Pa.
6. Murakami, K., W. Minamide, K. Wada, E. nakamura, H. Teraoka, and s. Watanabe. 1991. identification of methicillin-resistant strains of staphylococci by polymerase chain reaction. J Clin Microbiol 29:2240-4.
7. nguyen Van, J. C., M. D. Kitzis, A. Ly, A. Chalfine, J. Carlet, A. ben Ali, and F. Goldstein. 2006. [Detection of nasal colonization methicillin-resistant staphylococcus aureus: a prospective study comparing real-time genic amplification assay vs selective chromogenic media]. Pathol biol (Paris) 54:285-92.
8. Oberdorfer, K., s. Pohl, M. Frey, K. Heeg, and C. Wendt. 2006. Evaluation of a single-locus real-time polymerase chain reaction as a screening test for specific detection of methicillin-resistant staphylo-coccus aureus in iCU patients. Eur J Clin Microbiol infect Dis 25:657-63.
9. Paule, s. M., D. M. Hacek, b. Kufner, K. Truchon, R. b. Thomson, Jr., K. L. Kaul, A. Robicsek, and L. R. Peterson. 2007. Performance of the bD GeneOhm Methicillin-Resistant staphylococcus aureus Test before and during High-Volume Clinical Use. J Clin Microbiol 45:2993-8.
10. Rajan, L., E. smyth, and H. Humphreys. 2007. screening for MRsA in iCU patients. How does PCR compare with culture? J infect.
11. Rossney, A. s., C. M. Herra, M. M. Fitzgibbon, P. M. Morgan, M. J. Lawrence, and b. O’Connell. 2007. Evaluation of the iDi-MRsA assay on the smartCycler real-time PCR platform for rapid detection of MRsA from screening specimens. Eur J Clin Microbiol infect Dis 26:459-66.
12. Tiemersma, E. W., s. L. bronzwaer, O. Lyytikainen, J. E. Degener, P. schrijnemakers, n. bruinsma, J. Monen, W. Witte, and H. Grundman. 2004. Methicillin-resistant staphylococcus aureus in Europe, 1999-2002. Emerg infect Dis 10:1627-34.
13. van Hal, s. J., D. stark, b. Lockwood, D. Marriott, and J. Harkness. 2007. Methicillin-Resistant staphy-lococcus aureus (MRsA) Detection: Comparison of Two Molecular Methods (iDi-MRsA PCR Assay and GenoType MRsA Direct PCR Assay) with Three selective MRsA Agars (MRsA iD, MRsAselect, and CHROMagar MRsA) for Use with infection-Control swabs. J Clin Microbiol 45:2486-90.
14. van Trijp, M. J., D. C. Melles, W. D. Hendriks, G. A. Parlevliet, M. Gommans, and A. Ott. 2007. successful control of widespread methicillin-resistant staphylococcus aureus colonization and infection in a large teaching hospital in the netherlands. infect Control Hosp Epidemiol 28:970-5.
15. Warren, D. K., R. s. Liao, L. R. Merz, M. Eveland, and W. M. Dunne, Jr. 2004. Detection of methicillin-resistant staphylococcus aureus directly from nasal swab specimens by a real-time PCR assay. J Clin Microbiol 42:5578-81.
16. Wertheim, H., H. A. Verbrugh, C. van Pelt, P. de Man, A. van belkum, and M. C. Vos. 2001. improved detection of methicillin-resistant staphylococcus aureus using phenyl mannitol broth containing aztreonam and ceftizoxime. J Clin Microbiol 39:2660-2.

mrSA-Pcr after enrichment 55
17. Wren, M. W., C. Carder, P. G. Coen, V. Gant, and A. P. Wilson. 2006. Rapid molecular detection of methicillin-resistant staphylococcus aureus. J Clin Microbiol 44:1604-5.
18. Zhang, s. X., s. J. Drews, J. Tomassi, and K. C. Katz. 2007. Comparison of two versions of the iDi-MRsA assay using charcoal swabs for prospective nasal and nonnasal surveillance samples. J Clin Microbiol 45:2278-80.

Chapter 4
rapid identification and antimicrobial susceptibility testing reduce antibiotic use and accelerate pathogen-directed antibiotic use
J.J. Kerremans1, P. Verboom2, t. Stijnen3, L. Hakkaart–van
roijen2, W. Goessens1, H.A. Verbrugh1 and m.c. Vos1
1 Dept. of Medical Microbiology & Infectious Diseases, Erasmus University Medical
Centre, Rotterdam, The Netherlands;
2 Institute for Medical Technology Assessment, Erasmus University Medical Centre,
Rotterdam, The Netherlands;
3 Department of Epidemiology and Biostatistics, Erasmus University Medical
Centre, Rotterdam, The Netherlands
Journal of Antimicrobial Chemotherapy 2008 61:428-35

cha
pter
4
58
ABStrAct
Introduction: Rapid bacterial identification and susceptibility tests can lead to earlier micro-
biological diagnosis and pathogen-directed, appropriate therapy. We studied whether acceler-
ated diagnostics affected antibiotic use and patient outcomes.
Patients and methods: A prospective randomized clinical trial was performed over a 2-year
period. inpatients were selected on the basis of a positive culture from normally sterile body
fluids and randomly assigned to either a rapid intervention arm or the control arm. The interven-
tion arm used the Vitek 2 automated identification and susceptibility testing device, combined
with direct inoculation of blood cultures. in the control arm, the Vitek 1 system inoculated from
subcultures was used. Follow-up was 4 weeks after randomisation.
Results: A total of 1498 patients were randomized: 746 in the intervention arm and 752 in the
control arm. For susceptibility testing, the rapid arm was 22 h faster than the control arm and for
identification it was 13 h faster (P < 0.0001). in the rapid arm, antibiotic use was 6 defined daily
doses lower per patient than in the control arm (P = 0.001). Whereas antibiotics were switched
more in the rapid group on the day of randomization (P = 0.006), in the control group they were
switched more on day two (P = 0.02). Mortality rates did not differ significantly between the
two groups (17.6% versus 15.2%).
Conclusions: While rapid bacterial identification and susceptibility testing led to earlier
changes and a significant reduction in antibiotic use, they did not reduce mortality.

impact of rapid diagnostics 59
introduction
initially, most infections are treated empirically until the causative agents and their suscepti-
bility profile are known. As soon as results of determination and susceptibility tests become
available, the antibiotic regimen can be streamlined. since administration of appropriate
antimicrobial agents is correlated with a decrease in mortality (8, 12) shortening the period in
which empirical therapy is given may result in a better outcome for the patient. Hospitalized
individuals, as well as those in the community, may benefit from the prudent use of antibiotics.
(5, 11, 14-16)
Determination and susceptibility testing of microorganisms usually takes 24-48 h after initial
growth in a routine laboratory setting. With the newest diagnostic methods, however, identi-
fication and susceptibility testing can now be performed within one working day. it is to be
expected that modification of antibiotic therapy to narrow spectrum antibiotics or to adequate
antibiotics can be made earlier using these rapid techniques, and that these techniques will
contribute to improved patient management. Only a few studies have addressed the impact of
these rapid techniques on patient outcomes. (1, 3, 6, 20)
Our hypothesis was that rapid diagnostics could improve patient outcomes and reduce
antibiotics use. Therefore, the aim of the present randomized controlled clinical trial was to
assess the impact of rapid identification and susceptibility results of organisms causing severe
bacterial infections, on antibiotic use and patient outcome.
Patients and methods
Setting. The Erasmus MC is a 1200-bed tertiary-care university medical centre, located in Rot-
terdam, the netherlands. The Department of Medical Microbiology and infectious Diseases has
an integrated laboratory and an active consultation service by medical microbiologists and
infectious diseases specialists. in addition to consultations on request, this consultation service
actively generates consultations after growth from a blood, or CsF culture or other clinical
specimens suggesting a severe infection.
The consultation service operates 24 h every day. The laboratory is open on weekdays from
07:30 am until 5 pm and on saturdays and sundays from 8:30 am until 1 pm. During the week-
end days, all blood and CsF specimens are processed as well as samples deemed important
by the consultation service. During the evening and night shift, a technician is on call for
emergency purposes.
Inclusion criteria. included were patients hospitalized or seen at the emergency department,
older than 18 years, and who had a specimen from a usually sterile bodily fluid (excluding urine)
that showed bacterial or fungal growth in blood culture bottles or on agar plates. Otherwise,
no patient was excluded. Patients were followed-up for 28 days. The inclusion period was from
February 2001 until March 2003.

cha
pter
4
60
Power calculation. it was calculated that 1500 patients were needed to demonstrate a 6%
absolute reduction in mortality (power of 80% and a two-sided α of 0.05) from 25% in the
control group to 18% in the rapid group (sample Power, sPss, Chicago, UsA). The study was
approved by the Medical Ethics Committee of the Erasmus MC and no informed consent was
required.
Hoofdstuk 4 fig 1
Figure 1 Flow chart of the randomized patients
Analyzed cost (n=746 ) 4-week Mortality: 739 “gedetaileerd”: 497*
Randomization by technician (n=1593)§
Not-eligble (n=38 ) -Deceased before randomization
(n=11) - administrative errors (n=27) (<18y,wrong specimen type, false positives)
Available: 497
Available: 739 Lost to follow-up:7**
Allocated to Rapid arm (n= 746)
correct protocol (n= 647 ) (partial) protocol failure*(n= 99)
Available: 738 Lost to follow-up:14**
Allocated to control arm (n=752)
correct protocol(n= 715) (partial) protocol failure*(n= 37)
Available:503
Allocation
Secondary outcome Sub-cohort#
Primary outcome Mortality
Not eligible (n=57) -Deceased before randomization
(n=21) -administrative errors (n=36) (<18y,wrong specimen type, false positives)
Eligibility
Figure 1: Patients were randomized by a technician when a culture became positive; clinical data were not available at the time of opening the envelope.* (Partial) protocol failure: culture not handled according to assigned protocol. For example, the technician used wrong instrument; the patient was not put on the remote access list; if the first identification failed and not promptely repeated in rapid arm.**Patients not registered in a Dutch municipal population register: foreign nationals or unregistered homeless people.# The subcohort consisted of the first 1000 consecutive patients. Outcomes and demographic data collected were: (severity of ) underlying diseases, the use of immunosuppressive drugs, antibiotic use, and infections during the hospital stay.

impact of rapid diagnostics 61
Randomization. The randomization was carried out in computer generated, permuted blocks
of variable size stratified on the department where the specimen was collected. Personnel of
the biostatistics department, who had no direct contact with the study investigators, prepared
opaque, sealed envelopes. Patients were randomized by the laboratory technician handling
the cultures. Randomization was carried out before patients’ medical data were obtained. Final
eligibility was assessed by the study investigator who checked if the patients were alive at the
time of randomization and met the predefined inclusion criteria. Only these patients were
included in the intention-to-treat analyses. All clinical wards and the emergency department of
the hospital participated in this study. Patients were included only once. subsequent cultures
of an already randomized patient were processed by the same method as the index culture.
Concealing turn-around-time (TAT) is impossible, therefore no formal blinding was attempted.
However, the treating physician was not informed that the patient was included in the trial.
Intervention. Patients randomized to the rapid (intervention) arm had their positive culture
specimens processed using rapid methods during the follow-up period of 4 weeks. Patients
randomized to the control group had their positive culture specimens processed in the conven-
tional manner during the follow-up period.
Rapid testing was achieved by combining three methods. First, the Vitek 2 system (bioMéri-
eux, Marcy-l’Étoile, France) was used for identification (2–3 h) and antibiotic susceptibility
testing (6-12 h). secondly, positive blood cultures were tested directly, without subculturing,
with the Vitek 2 (10) and, thirdly, the use of remote access to the Vitek 2 system in the evening
hours by the study investigator and reporting the results to the infectious disease consultation
service by telephone immediately. specimens from the control group were analyzed by the
overnight (21 h) Vitek 1 system (bioMérieux). Organisms not suitable to be analyzed by either
the Vitek 1 or 2 system (e.g. Corynebacterium sp. and Haemophilus influenzae) were handled by
conventional methods in both arms.
The TAT of the specimen used to randomize the patient (= index specimen) was determined.
specimen collection, transport and culture methods were identical in both arms. The time
period in which laboratory results were reported by the laboratory technician to the infectious
disease consultation service was from 10:30 am to 5.00 pm for the conventional arm. For the
rapid arm, this period was from 10:30 am to 11 pm.
Outcomes and data collection. The primary outcome was mortality during the follow-up
period. secondary outcome parameters were antibiotic use and changes in antibiotic therapy,
total duration of hospital stay and number of intensive care unit (iCU) days. Of all included
patients, microbiological culture data, age, sex, duration and department of stay and mortal-
ity data were collected from the hospital information system. Mortality after discharge was
assessed by contacting the Dutch municipal population register for all patients with unknown
status of life/death at the end of the follow-up period.
Due to the labour-intensive data collection from patient (paper) medical files, the following
data were collected in a sub-cohort consisting of the first consecutive 1000 patients included

cha
pter
4
62
(March 2001-Juli 2002): (severity of ) underlying diseases, the use of immunosuppressive drugs,
antibiotic use and infections during the hospital stay. The severity of underlying diseases was
classified according to a modified McCabe score (6) by a medical microbiologist (M. C. V.), who
was unaware of the patient’s assigned trial arm. The collection of the other objective clinical
data was not blinded.
start and stop dates and dosage regimens of all systemic antibacterial and antifungal
agents were collected manually from the patients’ medical files. Antibiotics used for surgical
prophylaxis were not included. Days of antibiotic use were calculated including both the day
on which therapy was started and the day on which it was stopped. Defined daily doses (DDDs)
were calculated according to the WHO 2006 definitions (17) with the exception of the DDD for
intravenous amoxicillin and flucloxacillin; these were changed from 1000 and 2000 mg to 4000
and 6000 mg, respectively. As DDDs of the lipid formulations of amphotericin b are not defined,
5 times the DDD of the deoxycholate formulation was used. Antibiotic switch was defined as
a change to a different antibiotic agent. The date of the first dose of the new antibiotic was
defined as the switch date. Changes in the route of administration of the same antibiotic and
the addition of an antibiotic were not scored as switches. Antibiotics given for prophylactic
indications were disregarded in counting switches.
infections were classified using the CDC definitions of nosocomial infections. (5)
Cultures were defined as contaminated if they did not meet the criteria for infection (e.g.
coagulase-negative staphylococci in a single blood culture) or were considered not clinically
relevant (e.g. skin flora from cerebral spinal fluid from a patient suspected of community-
acquired meningitis). nosocomial infections were defined as infections acquired two or more
days after admission, or those infections linked to a medical procedure or admission. (9)
Statistical analysis. All patients randomized who met the eligibility criteria were analyzed
on their assigned trial arm (intention-to-treat). Patient characteristics, culture isolates and
infections at baseline were analyzed by χ2 tests and t-tests. Differences in TAT were analyzed
using t-tests. A χ2 test was used to compare switches of antibiotic therapy with total number
of switches per day as counter and with total number of subjects as denominator. Differences
in DDDs of antibiotics were analyzed with the Mann Whitney test. A P value of <0.05 was con-
sidered statistically significant. Planned interim analyses were carried out after observing the
outcomes of 40%, 60% and 80% of the included number of patients; no significant differences
in mortality were observed.
results
in total, 1498 patients were enrolled, 746 in the rapid arm and 752 in the control arm (figure 1).
in the rapid arm, 7 patients were lost to follow-up, in the control arm, 14 were lost. in the rapid
arm, 130 of 739 patients (17.6%) died within the 4-week follow-up period; in the control arm,
112 out of 738 patients (15.2%) died (P = 0.21). The 95% confidence interval (Ci) for this 2.4%
difference in mortality is –1.6% to 6.1%.
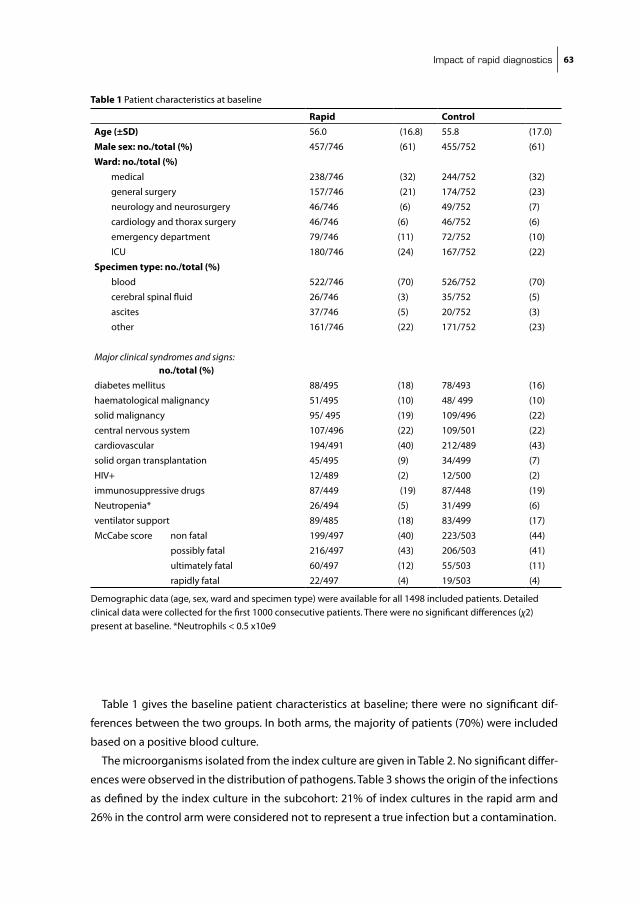
impact of rapid diagnostics 63
Table 1 gives the baseline patient characteristics at baseline; there were no significant dif-
ferences between the two groups. in both arms, the majority of patients (70%) were included
based on a positive blood culture.
The microorganisms isolated from the index culture are given in Table 2. no significant differ-
ences were observed in the distribution of pathogens. Table 3 shows the origin of the infections
as defined by the index culture in the subcohort: 21% of index cultures in the rapid arm and
26% in the control arm were considered not to represent a true infection but a contamination.
Table 1 Patient characteristics at baseline
Rapid ControlAge (±SD) 56.0 (16.8) 55.8 (17.0)
Male sex: no./total (%) 457/746 (61) 455/752 (61)
Ward: no./total (%) medical 238/746 (32) 244/752 (32)
general surgery 157/746 (21) 174/752 (23)
neurology and neurosurgery 46/746 (6) 49/752 (7)
cardiology and thorax surgery 46/746 (6) 46/752 (6)
emergency department 79/746 (11) 72/752 (10)
iCU 180/746 (24) 167/752 (22)
Specimen type: no./total (%) blood 522/746 (70) 526/752 (70)
cerebral spinal fluid 26/746 (3) 35/752 (5)
ascites 37/746 (5) 20/752 (3)
other 161/746 (22) 171/752 (23)
Major clinical syndromes and signs: no./total (%)diabetes mellitus 88/495 (18) 78/493 (16)
haematological malignancy 51/495 (10) 48/ 499 (10)
solid malignancy 95/ 495 (19) 109/496 (22)
central nervous system 107/496 (22) 109/501 (22)
cardiovascular 194/491 (40) 212/489 (43)
solid organ transplantation 45/495 (9) 34/499 (7)
HiV+ 12/489 (2) 12/500 (2)
immunosuppressive drugs 87/449 (19) 87/448 (19)
neutropenia* 26/494 (5) 31/499 (6)
ventilator support 89/485 (18) 83/499 (17)
McCabe score non fatal 199/497 (40) 223/503 (44)
possibly fatal 216/497 (43) 206/503 (41)
ultimately fatal 60/497 (12) 55/503 (11)
rapidly fatal 22/497 (4) 19/503 (4)
Demographic data (age, sex, ward and specimen type) were available for all 1498 included patients. Detailed clinical data were collected for the first 1000 consecutive patients. There were no significant differences (χ2) present at baseline. *neutrophils < 0.5 x10e9
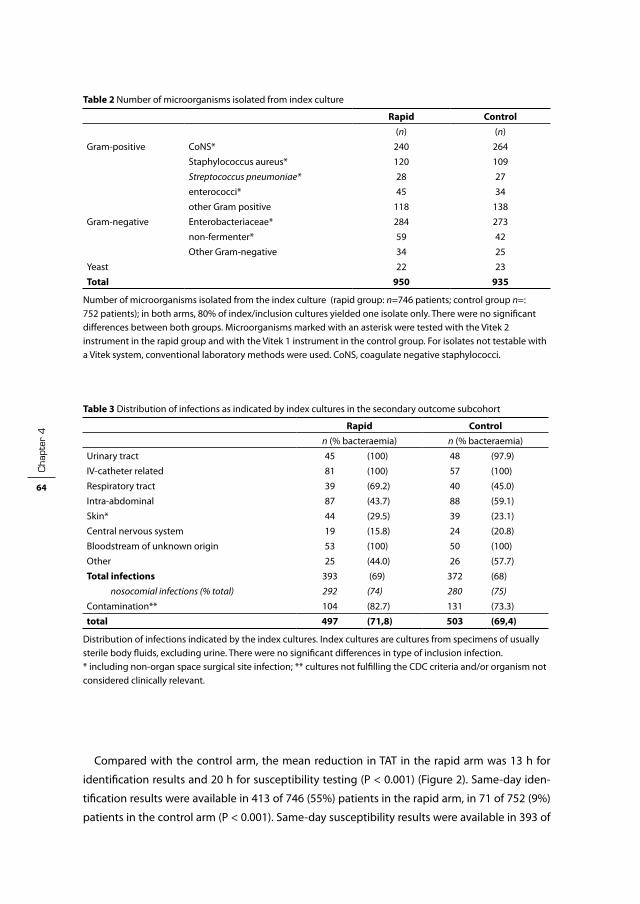
cha
pter
4
64
Compared with the control arm, the mean reduction in TAT in the rapid arm was 13 h for
identification results and 20 h for susceptibility testing (P < 0.001) (Figure 2). same-day iden-
tification results were available in 413 of 746 (55%) patients in the rapid arm, in 71 of 752 (9%)
patients in the control arm (P < 0.001). same-day susceptibility results were available in 393 of
Table 2 number of microorganisms isolated from index culture
Rapid Control(n) (n)
Gram-positive Cons* 240 264
staphylococcus aureus* 120 109
Streptococcus pneumoniae* 28 27
enterococci* 45 34
other Gram positive 118 138
Gram-negative Enterobacteriaceae* 284 273
non-fermenter* 59 42
Other Gram-negative 34 25
Yeast 22 23
Total 950 935
number of microorganisms isolated from the index culture (rapid group: n=746 patients; control group n=: 752 patients); in both arms, 80% of index/inclusion cultures yielded one isolate only. There were no significant differences between both groups. Microorganisms marked with an asterisk were tested with the Vitek 2 instrument in the rapid group and with the Vitek 1 instrument in the control group. For isolates not testable with a Vitek system, conventional laboratory methods were used. Cons, coagulate negative staphylococci.
Table 3 Distribution of infections as indicated by index cultures in the secondary outcome subcohort
Rapid Controln (% bacteraemia) n (% bacteraemia)
Urinary tract 45 (100) 48 (97.9)
iV-catheter related 81 (100) 57 (100)
Respiratory tract 39 (69.2) 40 (45.0)
intra-abdominal 87 (43.7) 88 (59.1)
skin* 44 (29.5) 39 (23.1)
Central nervous system 19 (15.8) 24 (20.8)
bloodstream of unknown origin 53 (100) 50 (100)
Other 25 (44.0) 26 (57.7)
Total infections 393 (69) 372 (68)
nosocomial infections (% total) 292 (74) 280 (75)
Contamination** 104 (82.7) 131 (73.3)
total 497 (71,8) 503 (69,4)
Distribution of infections indicated by the index cultures. index cultures are cultures from specimens of usually sterile body fluids, excluding urine. There were no significant differences in type of inclusion infection. * including non-organ space surgical site infection; ** cultures not fulfilling the CDC criteria and/or organism not considered clinically relevant.

impact of rapid diagnostics 65
Hoofdstuk 4 fig 2
12
24
36
48
60
72
84
Specimen taken T:0
Administrated at laboratory
T: 10,4h
detected positive T:39,6h
RAPID
ID: 58,5h** AST: 59h**
ID: 63,1h** AST: 66,8h**
ID: 73h** AST: 79,4h**
ID: 73,8h** AST: 88,1h**
Bactec cultures* Other cultures
Start of incubation
T: 11h
CONTROL
SST-tube# Vitek 2
afternoon & evning reading of results
Bactec cultures* Other cultures
(subculture) Vitek 2
afternoon & evening reading of results
subculture Vitek 1 (o.n.)
Next day reading of results
(subculture) Vitek 1 (o.n.)
Next day reading of results
Figure 2 Flow chart showing the turn-around-time in the study. Laboratory flow before randomization in the rapid and control arms was identical. Randomization was carried out by a technician after a culture was detected positive. Time points before randomization were only available from bactec cultures.*bactec cultures, cultures grown in bactec bottles, e.g. blood, ascites and cerebrospinal fluid. # ssT, serum separator tube (ssT, becton-Dickinson Vacutainer, UsA)** iD, identification of microorganism, AsT, antimicrobial susceptibility testing, P < 0.0001 for the difference between rapid arm and control arm for bactec ® cultures. Difference between rapid and control arm for other cultures: identification: P = 0.043; susceptibility: P <0.0001.

cha
pter
4
66
746 (53%) patients in the rapid arm and in 2 of 752 (<1%) in the control arm (P < 0.001). Limiting
the TAT calculation to index cultures of patients with isolates testable by either Vitek 1 or 2,
the TAT reduction increased to 14.8 h for identification and 22.3 h for susceptibility (P < 0.001).
There was no significant difference in admission period to the iCU or general ward between
both arms.
Figure 3 shows data on antibiotic switches in the subcohort. There were significantly more
changes on the day of randomization in the rapid group (P = 0.006) and significantly more
changes on day two after randomization in the control group (P = 0.02). On the day of ran-
domization, the number of antibiotic switches in the rapid arm, compared with the control
arm, increased by 50% (from 60 to 90). On that day, in 267 out of 497 patients of the rapid arm,
susceptibility results were available compared to 1 out of 503 patients in the control arm. There
were no significant differences between both arms in total numbers of starting, stopping or
adding antibiotics during the follow-up period.
Hoofdstuk 4 fig 3
Figure 3 Total Antibiotic switches per group in the secondary outcome sub-cohort.* On the day of randomization (R) and on day two after randomization the differences between the two arms are statistically significant. (P = 0.006 and P = 0.019, respectively)

impact of rapid diagnostics 67
Table 4 presents the total antibiotic use in both arms in the subcohort. Total antibiotic use
was reduced with 4 DDDs (95% Ci: 1.2-6.9) in the rapid arm (P = 0.020). Furthermore, there was
a significant difference of 2 DDDs (95% C.i.: 0.5-3.9) in the use of antifungal drugs (P = 0.050).
discussion
This study has shown that it is possible to significantly reduce the TAT of both identification
and susceptibility testing of bacteria. in the rapid arm, the mean TAT of susceptibility testing
was reduced by 20 h and same-day susceptibility results were available in 53% of patients.
This reduction in TAT led to an earlier switch of antibiotics and a reduction in total DDDs of
antibiotics used; however, the reduction in TAT did not lead to a lower mortality rate. switches
were correlated with the timing of laboratory results used by our active infection diseases
service line to streamline and change antibiotic therapy. The reduction in antibiotic use could
not be attributed to a single (class of ) antibiotic(s). Possible explanations for this reduction
are that antibiotic therapy was stopped when a contaminant organism was identified, or that
Table 4 Antibiotic use in average DDDs per patient in the secondary outcome subcohort
DDDs (sD)
Antibiotic group Rapid (497) Control (503) p-value*
Penicillins1 5.7 (13.0) 6.6 (14.7) 0.27
Penicillin & betalactamase inhibitor2 4.5 (8.7) 5.0 (10.7) 0.32
Cephalosporins3 1.9 (4.6) 1.9 (5.2) 0.83
Carbapenems+monobactam4 1.1 (5.2) 1.3 (5.2) 0.053
Aminoglycosids5 1.2 (4.2) 1.1 (3.4) 0.85
Macrolides/lincosamides6 1.4 (5.5) 2.3 (8.1) 0.373
Quinolones7 5.7 (10.3) 6.1 (11.2) 0.67
Glycopeptides8 0.9 (3.6) 1.2 (4.4) 0.26
Other9 1.7 (5.6) 2.6 (7.9) 0.022
Total antibacterials 23.9 (21.5) 27.9 (24.7) 0.020Antifungals10 2.7 (9.9) 4.9 (16.5) 0.050
Total antibacterials + antifungals 26.6 (24.5) 32.9 (31.9) 0.012
DDDs, defined daily doses. Antibiotic usage over 4 weeks after randomization excluding surgical prophylaxis. t-tests were used for statistical analysis. Only patients included in the secondary analysis were available for analysis.1: penicillin, amoxicillin, piperacillin, flucloxacillin; 2: amoxicillin-clavulanic acid, piperacillin-tazobactam; 3: cefazolin, cefuroxime, ceftriaxone, ceftazidime, cefotaxime; 4: imipenem-cilastitin, meropenem, aztreonam; 5: amikacin, gentamicin, tobramycin; 6: erythromycin, clarytromycin, azitromycin, clindamycin; 7:ciprofloxacin, norfloxacin, levofloxacin; 8: vancomycin, teicoplanin; 9: doxycycline, trimethoprim/sulfamethoxazole, rifampicin; 10: fluconazole, amphotericin b (deoxyholate, lipid complex and liposomal), itraconazole. *Mann Whitney P < 0.05 considered significant.
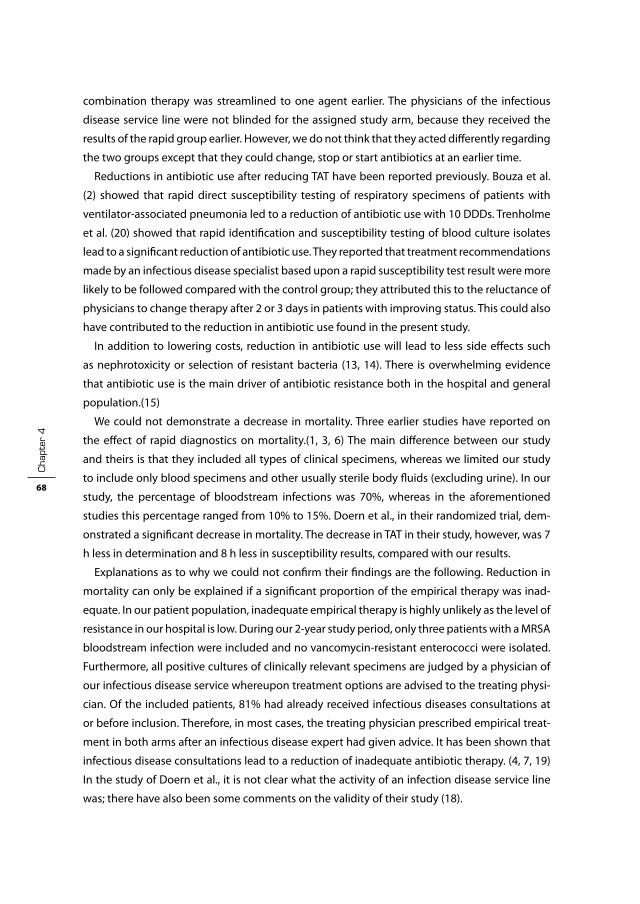
cha
pter
4
68
combination therapy was streamlined to one agent earlier. The physicians of the infectious
disease service line were not blinded for the assigned study arm, because they received the
results of the rapid group earlier. However, we do not think that they acted differently regarding
the two groups except that they could change, stop or start antibiotics at an earlier time.
Reductions in antibiotic use after reducing TAT have been reported previously. bouza et al.
(2) showed that rapid direct susceptibility testing of respiratory specimens of patients with
ventilator-associated pneumonia led to a reduction of antibiotic use with 10 DDDs. Trenholme
et al. (20) showed that rapid identification and susceptibility testing of blood culture isolates
lead to a significant reduction of antibiotic use. They reported that treatment recommendations
made by an infectious disease specialist based upon a rapid susceptibility test result were more
likely to be followed compared with the control group; they attributed this to the reluctance of
physicians to change therapy after 2 or 3 days in patients with improving status. This could also
have contributed to the reduction in antibiotic use found in the present study.
in addition to lowering costs, reduction in antibiotic use will lead to less side effects such
as nephrotoxicity or selection of resistant bacteria (13, 14). There is overwhelming evidence
that antibiotic use is the main driver of antibiotic resistance both in the hospital and general
population.(15)
We could not demonstrate a decrease in mortality. Three earlier studies have reported on
the effect of rapid diagnostics on mortality.(1, 3, 6) The main difference between our study
and theirs is that they included all types of clinical specimens, whereas we limited our study
to include only blood specimens and other usually sterile body fluids (excluding urine). in our
study, the percentage of bloodstream infections was 70%, whereas in the aforementioned
studies this percentage ranged from 10% to 15%. Doern et al., in their randomized trial, dem-
onstrated a significant decrease in mortality. The decrease in TAT in their study, however, was 7
h less in determination and 8 h less in susceptibility results, compared with our results.
Explanations as to why we could not confirm their findings are the following. Reduction in
mortality can only be explained if a significant proportion of the empirical therapy was inad-
equate. in our patient population, inadequate empirical therapy is highly unlikely as the level of
resistance in our hospital is low. During our 2-year study period, only three patients with a MRsA
bloodstream infection were included and no vancomycin-resistant enterococci were isolated.
Furthermore, all positive cultures of clinically relevant specimens are judged by a physician of
our infectious disease service whereupon treatment options are advised to the treating physi-
cian. Of the included patients, 81% had already received infectious diseases consultations at
or before inclusion. Therefore, in most cases, the treating physician prescribed empirical treat-
ment in both arms after an infectious disease expert had given advice. it has been shown that
infectious disease consultations lead to a reduction of inadequate antibiotic therapy. (4, 7, 19)
in the study of Doern et al., it is not clear what the activity of an infection disease service line
was; there have also been some comments on the validity of their study (18).

impact of rapid diagnostics 69
bruins et al. conducted a randomized trial including patients growing bacteria in all types of
specimens. They also failed to demonstrate a reduction in mortality and found no difference in
antibiotic use between their two groups. in 40% of their patients, lower urinary tract infections
were diagnosed. in this group, empirical antibiotic therapy is mostly adequate and of short
duration.
in conclusion, we have shown that rapid identification and susceptibility testing results
in significantly earlier switches in antibiotic therapy and thus to a change in the narrowest
spectrum providing adequate coverage and a reduction in total antibiotic consumption. Rapid
bacterial diagnostics are therefore recommended to be implemented in the clinical laboratory.
However, in a setting where infectious disease consultations are involved early in the process
of the infectious disease, together with a low level of antibiotic resistance, this does not lead to
a reduction in mortality.
Acknowledgements
Part of this work was presented (orally) at the ECCMiD meeting, nice, France, 2006 (abstract
number O211). We thank the technicians for their help in remote access of the Vitek 2 system.
funding
This project was mainly funded by a grant from the Dutch Association of University Hospitals
(‘VAZ-Doelmatigheidproject’ no. 99207). bioMerieux provided additional funding through an
unrestricted grant.
transparency declarations
none to declare.
cha
pter
4
70
referenceS
1. barenfanger, J., C. Drake, and G. Kacich. 1999. Clinical and financial benefits of rapid bacterial identifi-cation and antimicrobial susceptibility testing. J Clin Microbiol 37:1415-8.
2. bouza, E., M. V. Torres, C. Radice, E. Cercenado, R. de Diego, C. sanchez-Carrillo, and P. Munoz. 2007. Direct E-test (Ab biodisk) of respiratory samples improves antimicrobial use in ventilator-associated pneumonia. Clin infect Dis 44:382-7.
3. bruins, M., H. Oord, P. bloembergen, M. Wolfhagen, A. Casparie, J. Degener, and G. Ruijs. 2005. Lack of effect of shorter turnaround time of microbiological procedures on clinical outcomes: a randomised controlled trial among hospitalised patients in the netherlands. Eur J Clin Microbiol infect Dis 24:305-13.
4. byl, b., P. Clevenbergh, F. Jacobs, M. J. struelens, F. Zech, A. Kentos, and J. P. Thys. 1999. impact of infec-tious diseases specialists and microbiological data on the appropriateness of antimicrobial therapy for bacteremia. Clin infect Dis 29:60-6; discussion 67-8.
5. Centers for Disease Control and Prevention. Antibiotic/ antimicrobial resistance. Atlanta, G., UsA. http://www.cdc.gov/ drugresistance (accessed march, 2007).
6. Doern, G. V., R. Vautour, M. Gaudet, and b. Levy. 1994. Clinical impact of rapid in vitro susceptibility testing and bacterial identification. J Clin Microbiol 32:1757-62.
7. Fowler, V. G., Jr., L. L. sanders, D. J. sexton, L. Kong, K. A. Marr, A. K. Gopal, G. Gottlieb, R. s. McClelland, and G. R. Corey. 1998. Outcome of staphylococcus aureus bacteremia according to compliance with recommendations of infectious diseases specialists: experience with 244 patients. Clin infect Dis 27:478-86.
8. ibrahim, E. H., G. sherman, s. Ward, V. J. Fraser, and M. H. Kollef. 2000. The influence of inadequate antimicrobial treatment of bloodstream infections on patient outcomes in the iCU setting. Chest 118:146-55.
9. Jarvis, W. R., and b. Robles. 1996. nosocomial infections in pediatric patients. Adv Pediatr infect Dis 12:243-95.
10. Kerremans, J. J., W. H. Goessens, H. A. Verbrugh, and M. C. Vos. 2004. Accuracy of identification and susceptibility results by direct inoculation of Vitek 2 cards from positive bACTEC cultures. Eur J Clin Microbiol infect Dis 23:892-8.
11. Kollef, M. H. 2003. Treatment of ventilator-associated pneumonia: get it right from the start. Crit Care Med 31:969-70.
12. Kollef, M. H., s. Ward, G. sherman, D. Prentice, R. schaiff, W. Huey, and V. J. Fraser. 2000. inadequate treatment of nosocomial infections is associated with certain empiric antibiotic choices. Crit Care Med 28:3456-64.
13. Lepelletier, D., n. Caroff, A. Reynaud, and H. Richet. 1999. Escherichia coli: epidemiology and analysis of risk factors for infections caused by resistant strains. Clin infect Dis 29:548-52.
14. Lepelletier, D., n. Caroff, D. Riochet, P. bizouarn, A. bourdeau, F. Le Gallou, E. Espaze, A. Reynaud, and H. Richet. 2006. Risk-factors for gastrointestinal colonisation with resistant Enterobacteriaceae among hospitalised patients: a prospective study. Clin Microbiol infect 12:974-9.
15. Livermore, D. M. 2005. Minimising antibiotic resistance. Lancet infect Dis 5:450-9. 16. nouwen, J. L. 2006. Controlling antibiotic use and resistance. Clin infect Dis 42:776-7. 17. W.H.O. 2006. Guidelines for ATC classification and DDD Assignment. Collaborating Centre for Drug
statistics Methodology, norwegian institute of Public Health. 18. Renders, n. H., J. A. Kluytmans, and H. A. Verbrugh. 1995. Clinical impact of rapid in vitro susceptibility
testing and bacterial identification. J Clin Microbiol 33:508. 19. Takakura, s., n. Fujihara, T. saito, T. Kimoto, Y. ito, Y. iinuma, and s. ichiyama. 2006. improved clinical
outcome of patients with Candida bloodstream infections through direct consultation by infectious diseases physicians in a Japanese university hospital. infect Control Hosp Epidemiol 27:964-8.

impact of rapid diagnostics 71
20. Trenholme, G. M., R. L. Kaplan, P. H. Karakusis, T. stine, J. Fuhrer, W. Landau, and s. Levin. 1989. Clini-cal impact of rapid identification and susceptibility testing of bacterial blood culture isolates. J Clin Microbiol 27:1342-5.


Chapter 5
the cost of rapid bacterial identification and susceptibility testing
J.J. Kerremans1, H.A. Verbrugh1, m.c. Vos1, L. Hakkaart–van
roijen2
1 Dept. of Medical Microbiology & Infectious Diseases,
2 Institute for Medical Technology Assessment,
Erasmus University Medical Center, Rotterdam, The Netherlands
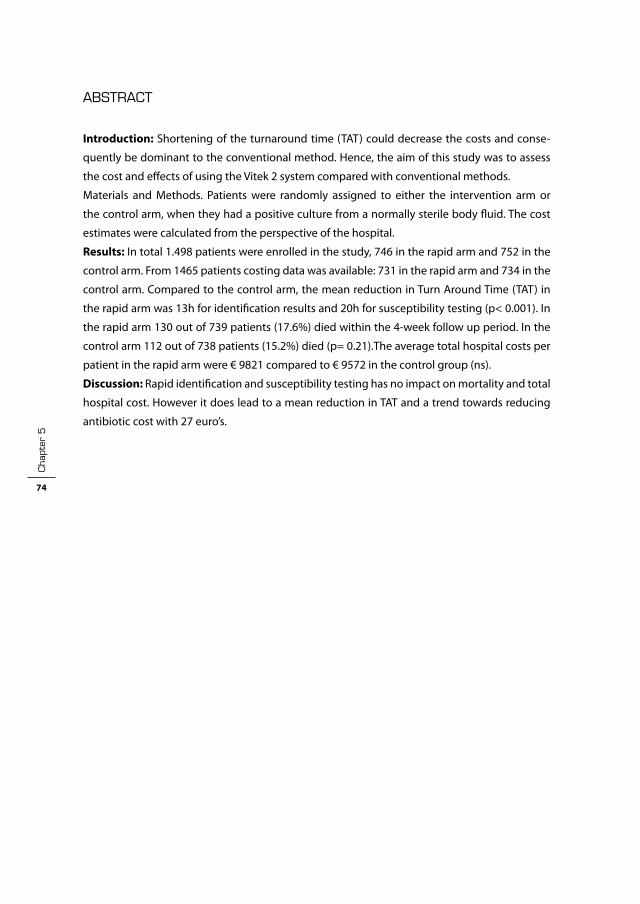
cha
pter
5
74
ABStrAct
Introduction: shortening of the turnaround time (TAT) could decrease the costs and conse-
quently be dominant to the conventional method. Hence, the aim of this study was to assess
the cost and effects of using the Vitek 2 system compared with conventional methods.
Materials and Methods. Patients were randomly assigned to either the intervention arm or
the control arm, when they had a positive culture from a normally sterile body fluid. The cost
estimates were calculated from the perspective of the hospital.
Results: in total 1.498 patients were enrolled in the study, 746 in the rapid arm and 752 in the
control arm. From 1465 patients costing data was available: 731 in the rapid arm and 734 in the
control arm. Compared to the control arm, the mean reduction in Turn Around Time (TAT) in
the rapid arm was 13h for identification results and 20h for susceptibility testing (p< 0.001). in
the rapid arm 130 out of 739 patients (17.6%) died within the 4-week follow up period. in the
control arm 112 out of 738 patients (15.2%) died (p= 0.21).The average total hospital costs per
patient in the rapid arm were € 9821 compared to € 9572 in the control group (ns).
Discussion: Rapid identification and susceptibility testing has no impact on mortality and total
hospital cost. However it does lead to a mean reduction in TAT and a trend towards reducing
antibiotic cost with 27 euro’s.
cost of rapid diagnostics 75
introduction
sepsis is associated with significant mortality and morbidity. in the United states approxi-
mately 750,000 cases occur annually with high mortality rates (1, 11). Over the last decades,
multiple improvements have been made in the management of sepsis. One of the interven-
tions to increase effectiveness of the clinical microbiology laboratory is faster reporting of
microbiological results .This enables the clinician to start appropriate treatment sooner, which
is associated with better clinical outcome (1, 11). As soon as results are reported, empirical
therapy can be adjusted to achieve the highest treatment efficacy for the patient; this may
prevent the development of antimicrobial resistance (10) and may reduce costs (3). The Vitek is
an automated method for performing same-day identification and antimicrobial susceptibility
tests on non-fastidious bacteria. The Vitek 2, successor of the Vitek 1, is developed to generate
faster results and is accessible through the internet to facilitate on line reading and verification.
The advantage of the Vitek 2 is the reduced hands on time and more rapid identification and
susceptibility testing compared with the Vitek 1.
studies (2, 6) showed that a rapid identification could result in a favorable cost-effectiveness.
However, these studies contained several methodological limitations. Furthermore, these
studies were conducted in the United states; differences between the American and European
health care setting may additionally influence the results. Recently, a Dutch study showed that
there were no significant clinical differences in the rapid group (Vitek 2) compared with the
control group (4).
shortening of the turnaround time (TAT) could decrease the costs and consequently be
dominant to the conventional method. Hence, the aim of this study was to assess the cost and
effects of using the Vitek 2 system compared with conventional methods.
materials and methods
Study design and intervention. Patients of the Erasmus MC, Rotterdam, the netherlands, were
randomly assigned to either the intervention (rapid) arm or the control arm, when they had a
positive culture from a normally sterile body fluid (excluding urine samples). Rapid testing was
achieved by combining three methods. First, the Vitek 2 system (bioMérieux, Marcy-l’Étoile,
France) was used for identification (2–3 h) and antibiotic susceptibility testing (AsT) (6-12 h).
secondly, positive blood cultures were inoculated directly into the Vitek 2 cards (8) and thirdly,
the use of remote access to the Vitek 2 system in the evening hours. specimens from the control
group were analyzed by the overnight (21 h) Vitek 1 system.
Patients were prospectively followed up for 4 weeks after inclusion for mortality data and
cost of hospital care. The inclusion period was from February 2001 until March 2003. Patients
randomized into the rapid (intervention) arm had their positive culture specimens processed
using rapid methods during the follow up period of 4 weeks. Patients randomized to the con-
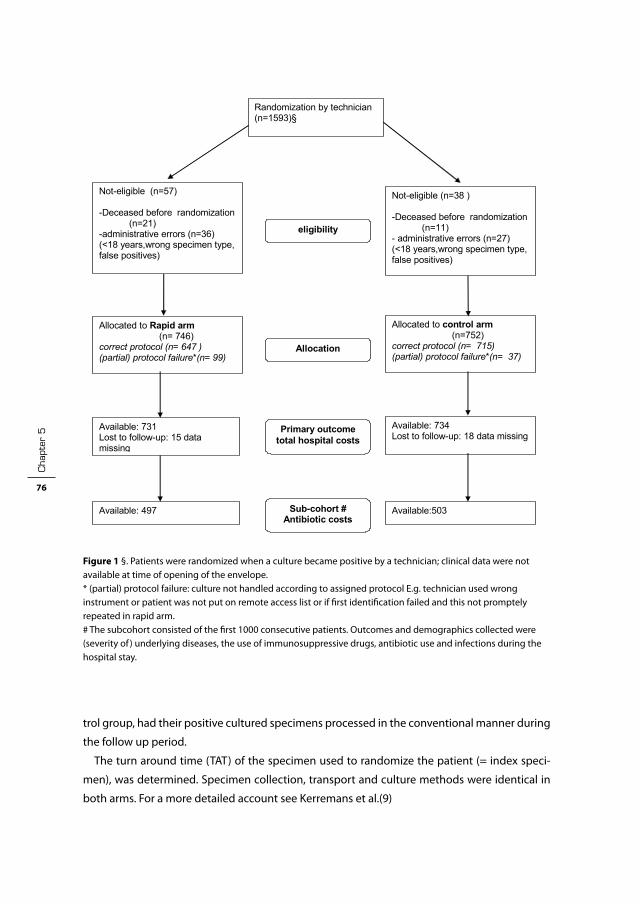
cha
pter
5
76
trol group, had their positive cultured specimens processed in the conventional manner during
the follow up period.
The turn around time (TAT) of the specimen used to randomize the patient (= index speci-
men), was determined. specimen collection, transport and culture methods were identical in
both arms. For a more detailed account see Kerremans et al.(9)
Hoofdstuk 5 fig 1
Figure 1 Flowchart of the randomized patients
Analyzed cost (n=746 ) 4-week Mortality: 739 “gedetaileerd”: 497*
Randomization by technician (n=1593)§
Available: 497
Available: 731 Lost to follow-up: 15 data missing
Allocated to Rapid arm (n= 746)
correct protocol (n= 647 ) (partial) protocol failure*(n= 99)
Available: 734 Lost to follow-up: 18 data missing
Allocated to control arm (n=752)
correct protocol (n= 715) (partial) protocol failure*(n= 37)
Available:503
Allocation
Sub-cohort #Antibiotic costs
Primary outcome total hospital costs
Not-eligible (n=57) -Deceased before randomization
(n=21) -administrative errors (n=36) (<18 years,wrong specimen type, false positives)
eligibility
Not-eligible (n=38 ) -Deceased before randomization
(n=11) - administrative errors (n=27) (<18 years,wrong specimen type, false positives)
Figure 1 §. Patients were randomized when a culture became positive by a technician; clinical data were not available at time of opening of the envelope.* (partial) protocol failure: culture not handled according to assigned protocol E.g. technician used wrong instrument or patient was not put on remote access list or if first identification failed and this not promptely repeated in rapid arm.# The subcohort consisted of the first 1000 consecutive patients. Outcomes and demographics collected were (severity of ) underlying diseases, the use of immunosuppressive drugs, antibiotic use and infections during the hospital stay.

cost of rapid diagnostics 77
Power calculation. it was calculated that 1500 patients were needed to demonstrate a 6%
absolute reduction in mortality (power of 80% and a two-sided α of 0.05) from 25% in the
control group to 18% in the rapid group. (sample Power, sPss, Chicago, UsA) The study was
approved by the Medical Ethics Committee of the Erasmus MC and no informed consent was
required.
Inclusion criteria. included were patients hospitalized or seen at the emergency department,
older than 18 years and who had a specimen from a usually sterile bodily fluid (excluding urine)
that showed bacterial or fungal growth in blood culture bottles or on agar plates. Patients were
followed up for 28 days. The inclusion period was from February 2001 until March 2003
Randomization. The randomization was carried out in, computer generated, permuted blocks
of variable size stratified on the department where the specimen was collected. Opaque, sealed
envelopes were prepared by personnel of the biostatistics department, who had no direct
contact with the study-investigators,. The laboratory technician handling the cultures random-
ized the patients. Randomization was carried out before patients’ medical data were obtained.
Final eligibility was assessed by the study investigator, who checked if the patients met the
predefined inclusion criteria and were alive at time of randomization. Only these patients were
included in the intention to treat analyses. subsequent cultures of an already randomized
patient were processed by the same method as the index culture. Patients were included only
once.
Data collection. Of all included patients data on microbiological culture, age, sex, department
and duration of stay and mortality data was collected from the hospital information system.
Underlying disease data, antibiotic use data and infections were collected manually from the
patients’ medical files.
Effect measures. in the current study mortality within 4 weeks of follow-up was the primary
effect measure. Mortality after discharge was assessed by contacting the Dutch municipal
population registers for all patients with unknown status of life/death at the end of the follow
up period. The clinical effectiveness of the rapid identification and antimicrobial susceptibility
testing was described in a separate paper (9)
Costs. The cost estimates were calculated from the perspective of the hospital. Data on hospital
days (normal and intensive care), was acquired from the hospital information system and medi-
cal procedures, laboratory and imaging costs were acquired from the accounting information
system. We calculated the costs by multiplying the volumes by unit prices of 2002. The hospital
days were identified as general – and intensive care (i.C.). Data on the antibiotics were collected
from the patient files in a subcohort consisting of the first 1000 patients. bottom-up methodol-
ogy was used to calculate the hospital costs; that is, the medical consumption was multiplied
by the 2002 unit prices of the corresponding health care service. The unit cost estimates for
interventions, laboratory- and (radio)diagnostic investigations were based on charges (Dutch
Tariff Authority (CTG). The costs of antibiotics were based on the costs per mg according to the

cha
pter
5
78
Dutch national Formulary (13) combined with the cost to administer these drugs. (7) The costs
of hospital and iCU days were the reference price estimated by Oostenbrink et al (12)
Additionally, we conducted a micro-costing study estimating the costs of the Vitek 1 and 2
per test. The cost estimate of the Vitek 1 and 2 test contained the following cost components;
labor costs, capital costs, maintenance costs and Vitek cards. We assumed a life span of 8 years
for the Vitek. Estimating the capital costs of the Vitek 1 and 2 we calculated annuities per year,
using an interest rate of 5 %. it was assumed that no residue value remained after this period.
The unit cost per card included the purchase price, use of disposables and labor cost.
The labor cost was calculated from labour time considering a labour cost of 0.43 euro per
minute, based on the total number of hours per year and annual salary. Time needed was
measured with a stopwatch while observing the technicians.
The cost per patient was calculated by multiplying the number of hospital days, contacts,
laboratory- and (radio)diagnostic investigations respectively with their corresponding unit
costs. in this paper the costs are presented as mean costs in euros per patient.
Statistical analysis. All patients randomized who met the eligibility criteria were analyzed
on their assigned trial arm (intention-to-treat). Patient characteristics, culture isolates and
Table 1 Patient characteristics at baseline
Rapid Control
Age ( ±SD) 56,1 (16.7) 55.9 (17.1)
Male sex: no./total (%) 448/731 (61%) 445/734 (61%)
Ward: no./total (%) Medical 230/731 (31%) 238/734 (32%)
General surgery 155/731 (21%) 170/734 (23%)
neurology and neurosurgery 46/731 (6%) 49/734 (7%)
Cardiology and thorax surgery 45/731 (6%) 46/734 (6%)
Emergency Department 77/731 (11%) 69/734 (9%)
intensive Care Unit 178/731 (24%) 162/734 (22%)
infections no./total (% bacteraemia)Urinary tract 45/497 (100%) 48/503 (97,9%)
iV-Catheter related 81/497 (100%) 57/503 (100%)
Respiratory tract 39/497 (69,2%) 40/503 (45,0%)
intra-abdominal 87/497 (43,7%) 88/503 (59,1%)
skin* 44/497 (29.5%) 39/503 (23.1%)
Central nervous system 19/497 (15,8%) 24/503 (20,8%)
bloodstream of unknown origin 53/497 (100%) 50/503 (100%)
Other 25/497 (44,0%) 26/503 (57,7%)
Contamination** 104/497 (82.7%) 131/503 (73.3)
* including non-organ space surgical site infection; ** cultures not fulfilling the CDC criteria and/or organism not considered clinically relevant
cost of rapid diagnostics 79
infections at baseline were analyzed by chi square tests and t-tests. Differences in turn-around
times were analyzed using t-tests. Differences in antibiotic use and cost were analyzed with
Mann Whitney tests. A p-value of <0.05 was considered statistically significant.
results
in total 1.498 patients were enrolled in the study, 746 in the rapid arm and 752 in the control
arm. From 1465 patients costing data was available: 731 in the rapid arm and 734 in the control
arm.(fig 1) Table 1 shows the baseline characteristics of the patients. There were no significant
differences in baseline characteristics between the two groups. Compared to the control arm,
the mean reduction in TAT in the rapid arm was 13h for identification results and 20h for sus-
ceptibility testing (p< 0.001)
Of 7 patients in the rapid arm and 14 in the control arm no data on survival were available. in
the rapid arm 130 out of 739 patients (17.6%) died within the 4-week follow up period. in the
control arm 112 out of 738 patients (15.2%) died (p= 0.21). The 95% confidence interval (C.i.) for
the difference in mortality is –1,6% to 6.1%.
Table 2 presents the costs per card of the Vitek 1 and 2. The costs per card of the Vitek 2 was
0.56 euro higher compared with the Vitek 1. Per isolate this difference was 1.3 euro. The cost of
direct inoculation of blood cultures was 1.6 euro.
Table 3 presents the overall hospital cost per patient by study arm (antibiotic use excluded).
The average costs per patient in the rapid arm was higher than in the control group, 9821 com-
pared to 9572. However, the mean cost estimates per patient were not significantly different
between the two groups. Therefore, no cost effectivenes can be shown/calculated.
Table 4 shows the antibiotic cost and use per antibiotic group in the subcohort. Total antibi-
otic cost (figure 2) showed a trend by declining from 552 in the control arm to 535 in the rapid
arm (P: 0.06)

cha
pter
5
80
Table 2 Costs per card of the rapid (Vitek 2 + direct inoculation) and control arm (Vitek i) (in Euro, 2002)
Rapid Controlinitial expense 81681 38303
residue value 0 0
Depreciation (8 years) 10210 4788
interest (5%) 2042 958
Maintenance (10%) 8168 3830
Total costs per year 20420 9576
number of cards per year(n) 25000 25000
“Machine” cost per card (€/N) 0.82 0.38
Purchase Costs card 3.94 3.71
Disposables per card1 0.24 0.23
Technician time2 0.63 0,74
Total costs per card 5.63 5.0610 % repeat rate3 0.56 0.51
Cost per isolate4 12.4 11.1Cost direct inoculation of blood cultures5 1.6 n.a.
Costs per blood culture isolate6 14.0 11.1
n.a.: not applicable 1. blood agar, half strength saline, plastic reageerbuisjes, cottontips, tips,2. time rapid: 1.5 min, time control 1.74 min)3. Percentage :estimate based on identification failure Kerremans et al4. 2 cards per isolate5. additional costs consists o: (serumseparator tube (0.13 euro), technician time(0.26euro), and 10% additionele repeat rate (Kerremans et al)(1.24 euro)6. direct inoculation not valid for more than one isolate.
Table 3 number of and mean cost per patient for the rapid and control group (Euro, 2002)
Rapid ControlNumber Costs Number Costs
Microbiology 8.3 135 7.9 117
Laboratorium tests 202.3 1160 205.1 1132
imaging 5.4 661 5.2 583
Other diagnostics 3.0 82 3.1 78
invasive procedures* 31.6 1745 30.3 1566
General nursing days 12.5 4001 12.6 4025
iCU days 1.39 2037 1.41 2070
Total 9821 9572
* including surgical procedures and venapunctures
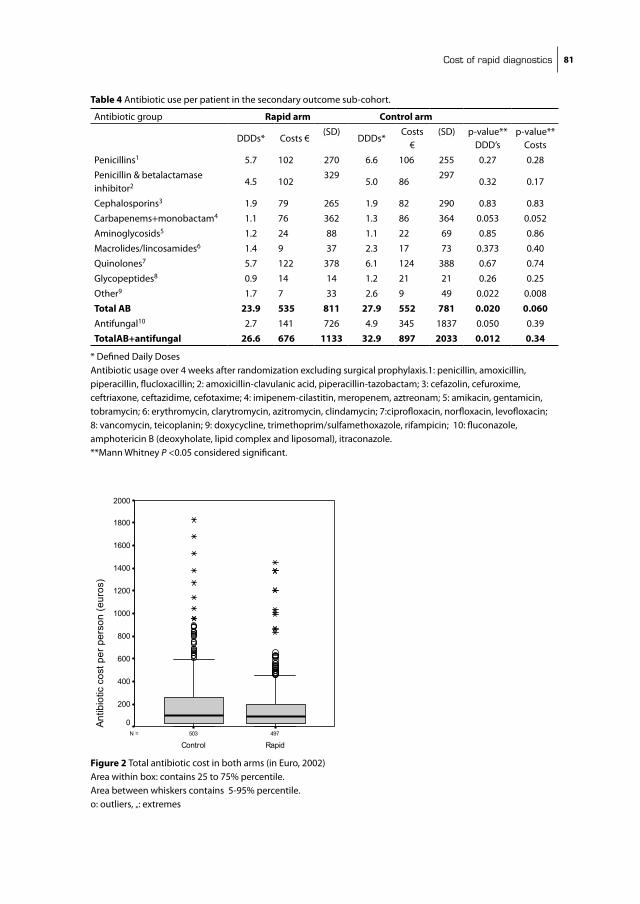
cost of rapid diagnostics 81
Table 4 Antibiotic use per patient in the secondary outcome sub-cohort.
Antibiotic group Rapid arm Control arm
DDDs* Costs €(sD)
DDDs* Costs
€(sD) p-value**
DDD’sp-value**
Costs
Penicillins1 5.7 102 270 6.6 106 255 0.27 0.28
Penicillin & betalactamase inhibitor2 4.5 102
3295.0 86
2970.32 0.17
Cephalosporins3 1.9 79 265 1.9 82 290 0.83 0.83
Carbapenems+monobactam4 1.1 76 362 1.3 86 364 0.053 0.052
Aminoglycosids5 1.2 24 88 1.1 22 69 0.85 0.86
Macrolides/lincosamides6 1.4 9 37 2.3 17 73 0.373 0.40
Quinolones7 5.7 122 378 6.1 124 388 0.67 0.74
Glycopeptides8 0.9 14 14 1.2 21 21 0.26 0.25
Other9 1.7 7 33 2.6 9 49 0.022 0.008
Total AB 23.9 535 811 27.9 552 781 0.020 0.060Antifungal10 2.7 141 726 4.9 345 1837 0.050 0.39
TotalAB+antifungal 26.6 676 1133 32.9 897 2033 0.012 0.34
* Defined Daily DosesAntibiotic usage over 4 weeks after randomization excluding surgical prophylaxis.1: penicillin, amoxicillin, piperacillin, flucloxacillin; 2: amoxicillin-clavulanic acid, piperacillin-tazobactam; 3: cefazolin, cefuroxime, ceftriaxone, ceftazidime, cefotaxime; 4: imipenem-cilastitin, meropenem, aztreonam; 5: amikacin, gentamicin, tobramycin; 6: erythromycin, clarytromycin, azitromycin, clindamycin; 7:ciprofloxacin, norfloxacin, levofloxacin; 8: vancomycin, teicoplanin; 9: doxycycline, trimethoprim/sulfamethoxazole, rifampicin; 10: fluconazole, amphotericin b (deoxyholate, lipid complex and liposomal), itraconazole. **Mann Whitney P <0.05 considered significant.
Hoofdstuk 5 fig 2
497503N =
RapidControl
Antib
iotic
cos
t per
per
son
(eur
os)
2000
1800
1600
1400
1200
1000
800
600
400
200
0
Figure 2 Total antibiotic cost in both arms (in Euro, 2002)Area within box: contains 25 to 75% percentile. Area between whiskers contains 5-95% percentile. o: outliers, *: extremes
cha
pter
5
82
discussion
Rapid identification and susceptibility testing has no impact on mortality and total hospital
cost. However it does lead to a mean reduction in turnaround time of 13h for identification
results and of 20h for susceptibility testing for a modest increase in cost 1.3 euro per isolate for
upgrading the Vitek 1 to the Vitek 2 and 1.6 euro for direct inoculation of blood cultures. Also
there was a trend towards reducing antibiotic cost with 27 euros.
We applied a micro-costing study, in which the specified elements are defined in great detail
and then linked together to form larger cost components, for estimating the costs of the Vitek 1
and 2. This is considered as the golden standard for estimating the unit costs. Furthermore, we
used the bottom-up methodology for the hospital costs.
Our study has several limitations. The study was conducted in only one academic hospital.
However another Dutch study conducted in a general hospital in the netherlands also showed
that rapid identification and susceptibility testing had no impact on mortality and costs. (5)
Another limitation of this study is the fact that laboratory (chemistry and microbiology) test
costs are booked in the accounting system on the day of specimen collection. This does not
lead to problems for tests performed on the day of collection. However most microbiology
tests are not completed within one day therefore costs should have been attributed to these
different days. However this was not feasible. Thus bacteriology cost in this article do not
represent the actual costs made, but underestimate these significantly, especially because the
specimen leading to inclusion will, in general, be collected before the day of inclusion and will
therefore not be included in the costs. Of course this will affect both arms equally and therefore
the comparison between the arms is still valid. Also this represents only a small percentage of
the total cost. However it restricts use of these data to comparison between the two arms of
the study only.
A further limitation was the use of charges for procedures, laboratory- and (radio) diagnostic
investigations. These charges are close to real costs as these had been recently recalculated by
the Dutch Tariff Authority (CTG). Furthermore, estimating real unit costs for so many different
interventions and laboratory tests was not feasible. Furthermore, these cost components were
only responsible for a small part of the costs in both arms. Of course this does not invalidate
the comparison
We have discussed the reasons for the lack of effect on mortality in another paper (9). The
fact that a significant reduction in defined daily doses (DDD’s) does not lead to a significant
reduction in antibiotic cost is probably due to the much greater difference in cost between
antibiotics. DDD’s have been standardized as to be comparable between different classes and
types of antibiotics.
The direct comparison of the cost between the Vitek 1 and the Vitek 2 is of limited value as
the production of the former will be discontinued. After discontinuation, service and supplies
will likely become more expensive and eventually will be discontinued completely. The Vitek
2 has reduced hands on time, a larger panel of antibiotics and more advanced algorithms for

cost of rapid diagnostics 83
detecting resistance mechanisms besides a somewhat shorter turnaround time. The additional
costs are limited. However due to the lack of cost effectiveness it seems not economical feasible
to replace the Vitek 1 with the Vitek 2 before the end of it’s economic lifespan.
The additional cost of direct inoculation is also limited: 1.6 euros. Although not significant
a potential reduction of 27 euros seems worth the additional effort, especially because the
are other non-monetary gains as further increasing the number of patient receiving timely
appropriate treatment, decreasing the number of adverse drug reactions due to discontinu-
ing unnecessary antibiotics and earlier streamlining which might have a favourable effect on
antibiotic resistance.
cha
pter
5
84
referenceS
1. Angus, D. C., and R. s. Wax. 2001. Epidemiology of sepsis: an update. Crit Care Med 29:s109-16. 2. barenfanger, J., C. Drake, and G. Kacich. 1999. Clinical and financial benefits of rapid bacterial identifi-
cation and antimicrobial susceptibility testing. J Clin Microbiol 37:1415-8. 3. berild, D., A. Mohseni, L. M. Diep, M. Jensenius, and s. H. Ringertz. 2006. Adjustment of antibiotic
treatment according to the results of blood cultures leads to decreased antibiotic use and costs. J Antimicrob Chemother 57:326-30.
4. bruins, M., H. Oord, P. bloembergen, M. Wolfhagen, A. Casparie, J. Degener, and G. Ruijs. 2005. Lack of effect of shorter turnaround time of microbiological procedures on clinical outcomes: a randomised controlled trial among hospitalised patients in the netherlands. Eur J Clin Microbiol infect Dis 24:305-13.
5. bruins, M. J., P. bloembergen, G. J. Ruijs, and M. J. Wolfhagen. 2004. identification and susceptibility testing of Enterobacteriaceae and Pseudomonas aeruginosa by direct inoculation from positive bACTEC blood culture bottles into Vitek 2. J Clin Microbiol 42:7-11.
6. Doern, G. V., R. Vautour, M. Gaudet, and b. Levy. 1994. Clinical impact of rapid in vitro susceptibility testing and bacterial identification. J Clin Microbiol 32:1757-62.
7. Gyssens, i. C., C. A. Lennards, Y. A. Hekster, and J. W. Van der Meer. 1991. Cost of hospital antimicrobial chemotherapy. A method for global cost calculation. Pharm Weekbl sci 13:248-53.
8. Kerremans, J. J., W. H. Goessens, H. A. Verbrugh, and M. C. Vos. 2004. Accuracy of identification and susceptibility results by direct inoculation of Vitek 2 cards from positive bACTEC cultures. Eur J Clin Microbiol infect Dis 23:892-8.
9. Kerremans, J. J., P. Verboom, T. stijnen, L. Hakkaart-van Roijen, W. Goessens, H. A. Verbrugh, and M. C. Vos. 2008. Rapid identification and antimicrobial susceptibility testing reduce antibiotic use and accelerate pathogen-directed antibiotic use. J Antimicrob Chemother 61:428-35.
10. Livermore, D. M. 2005. Minimising antibiotic resistance. Lancet infect Dis 5:450-9. 11. Martin, G. s., D. M. Mannino, s. Eaton, and M. Moss. 2003. The epidemiology of sepsis in the United
states from 1979 through 2000. n Engl J Med 348:1546-54. 12. Oostenbrink, J., C. bouwmans, M. Koopmanschap, and F. Rutten. 2004. Manual for costing
research,revised version 2004 institute for Medical Technology Assessment The netherlands: Health Care insurance board, Amstelveen.
13. College voor Zorgverzekeringen,. 2002. Pharmaceutical Compass 2002. CVZ.

Chapter 6
the effect of infectious disease consultancy and microbiological results on microbiologically correct antibiotic therapy
J. J. Kerremans, H.A. Verbrugh, m.c. Vos
Dept. of Medical Microbiology & Infectious Diseases
Erasmus University Medical Center, Rotterdam, the Netherlands
cha
pter
6
86
ABStrAct
A small observational cohort study of patients with positive blood cultures representing true
infection was performed. The study question was to ascertain which part of the culture results
was most influencial on patient management; i.e. how many infectious diseases were treated
by correct empirical therapy, and whether advice of infectious disease (iD) consultants is fol-
lowed. From January 2002 until May 2002, 93 patients with confirmed bloodstream infections
requiring antibiotic treatment, were included. Patient with iD-consultations are more likely to
receive microbiologically correct empirical antibiotic therapy than patients without infectious
disease consultations (75% versus 53% p: 0.03). After Gram stain results become available, 92%
of patients receive microbiologically correct antibiotic therapy. Advice given by iD-consultants
is followed in 96%.
factors influencing correct therapy 87
introduction
severe sepsis and septic shock are major healthcare problems, affecting millions of patients
around the world each year. The incidence of sepsis and septic shock is increasing, the mortality
rate remains 25% (3).
The appropriateness of therapies administered soon after severe sepsis develops is likely
to influence outcome (3). Patient management can be positively influenced by the timely
reported results of positive blood cultures and by infectious disease consultations. byl et al. (2)
showed that with the availability of blood culture identification and susceptibility results the
proportion of appropriate treatments increased from 63% to 94%. This study also showed that
empirical therapy was significantly more often correct if given by infectious disease specialists.
We performed this observational cohort study of positive blood cultures representing true
infections, to answer the following questions:
which part of the culture results, Gram stain or final (identification /susceptibility data) was
most influencial on patient management;
What was the effect of infectious disease consultations on correct choice of empirical therapy
Was advice given by infectious disease consultants followed by the clinicians?
Patients and methods
Setting. The Erasmus MC is a 1200-bed tertiary-care university medical centre. The department
of Medical Microbiology and infectious Diseases has its laboratory integrated with an active
infectious diseases (iD) consultation service run by a team of MD-microbiologists and infec-
tious diseases specialists (internal medicine, approximate number of consultations: 20.000 /
year). This iD consultation service operates 24/7. The laboratory is active on weekdays from
7:30 am until 5 pm, on saturdays and sundays from 8:30 am until 1 pm. During opening hours
all blood-culture specimens are processed immediately. During evening and night shifts, a
technician and an infectious diseases (iD) consultant are on call for emergency purposes. blood
culture bottles are inoculated directly at the bedside using a closed vacutainer needle system.
The iD consultants actively trace the attending physician when their patients have a positive
blood culture and recommend antibiotic treatment. iD consultants are also frequently asked
for advice on empiric treatment of septic patients. The majority of consultations take place by
telephone or during interdisciplinary meetings, but bedside consultations are also performed.
Inclusion. A prospectively defined subset of participants of a trial into the effect of acceler-
ated diagnostics on antibiotic use and patient outcome (4) was included. in 225 consecutive
patients with a culture result leading to inclusion in this trial were selected to study the impact
of consultations and the different culture results (Gram stain, identification and susceptibility
testing). A questionnaire was distributed to the respective iD consultants (medical microbiolo-
gists (MD) or infectious diseases specialists or registrars in training for one of these specialities)
to collect advice given. Patient could be included only once. All patients with positive blood

cha
pter
6
88
Hoofdstuk 6 Figure 1
225 questionnaires distributed
5 lost 11 empty or
incomprehensiable
209 questionnaires available
109 BSI*
54 non-bloodculture46 bloodcultures
but non-BSI*
16 BSI* not requiring antibiotic
treatment**
93 BSI* requiring antibiotic treatment
Figure 1 inclusion of patients in analysis225 consecutive patients with a culture result leading to inclusion in the trial were selected to study the impact of consultations and the different culture results (Gram’) by means of a questionnaire distributed to the respective iD consultants. From these patients all patients with positive blood cultures representing true infection requiring antibiotic therapyand of which a valid questionnaire was returned, were included in this analysis. *bsi: bloodstream infection**bsi not requiring Ab treatment: 11 catheter related infection after removal of the catheter, 4 biliary tract obstruction related infection after removal of blockage 1. possible contamination s.aureus in single bloodculture positive at end of incubation periode (5 days) , no antibiotic treatment was given.
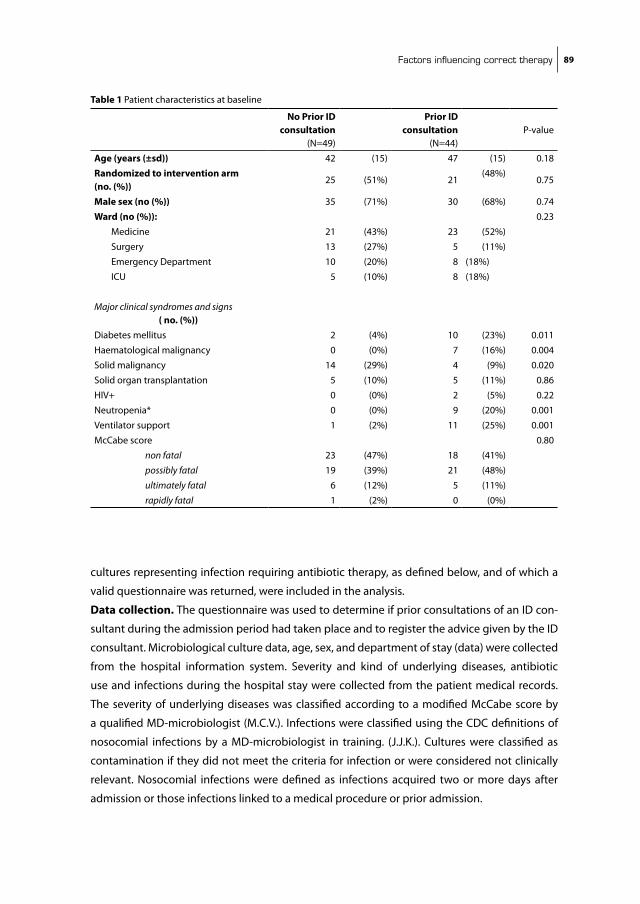
factors influencing correct therapy 89
cultures representing infection requiring antibiotic therapy, as defined below, and of which a
valid questionnaire was returned, were included in the analysis.
Data collection. The questionnaire was used to determine if prior consultations of an iD con-
sultant during the admission period had taken place and to register the advice given by the iD
consultant. Microbiological culture data, age, sex, and department of stay (data) were collected
from the hospital information system. severity and kind of underlying diseases, antibiotic
use and infections during the hospital stay were collected from the patient medical records.
The severity of underlying diseases was classified according to a modified McCabe score by
a qualified MD-microbiologist (M.C.V.). infections were classified using the CDC definitions of
nosocomial infections by a MD-microbiologist in training. (J.J.K.). Cultures were classified as
contamination if they did not meet the criteria for infection or were considered not clinically
relevant. nosocomial infections were defined as infections acquired two or more days after
admission or those infections linked to a medical procedure or prior admission.
Table 1 Patient characteristics at baseline
No Prior ID consultation
(n=49)
Prior ID consultation
(n=44)P-value
Age (years (±sd)) 42 (15) 47 (15) 0.18
Randomized to intervention arm (no. (%))
25 (51%) 21(48%)
0.75
Male sex (no (%)) 35 (71%) 30 (68%) 0.74
Ward (no (%)): 0.23
Medicine 21 (43%) 23 (52%)
surgery 13 (27%) 5 (11%)
Emergency Department 10 (20%) 8 (18%)
iCU 5 (10%) 8 (18%)
Major clinical syndromes and signs ( no. (%))Diabetes mellitus 2 (4%) 10 (23%) 0.011
Haematological malignancy 0 (0%) 7 (16%) 0.004
solid malignancy 14 (29%) 4 (9%) 0.020
solid organ transplantation 5 (10%) 5 (11%) 0.86
HiV+ 0 (0%) 2 (5%) 0.22
neutropenia* 0 (0%) 9 (20%) 0.001
Ventilator support 1 (2%) 11 (25%) 0.001
McCabe score 0.80
non fatal 23 (47%) 18 (41%)
possibly fatal 19 (39%) 21 (48%)
ultimately fatal 6 (12%) 5 (11%)
rapidly fatal 1 (2%) 0 (0%)

cha
pter
6
90
Microbiological correct therapy / therapy-advice was defined retrospectively by comparing
the susceptibility results with the given/advised antibiotic at the following time points: before
any laboratory result was available, when Gram stain result was available, when identification
was ready, when susceptibility testing was available or when identification and susceptibility
were available at the same time. if the isolate was susceptible to the advised/given therapy,
this therapy was considered microbiological correct; dosing and administrative route were
not taken into account. All pathogens recovered from the blood culture were required to be
covered by the treatment with the exception of likely skin contaminants. Advised antibiotic
therapy was used for comparisons, with exception of empirical therapy given by the attending
physician without iD advice, then the ordered antibiotics were used.
Advice on antibiotic therapy was categorized into seven categories: no therapy, start,
continue, streamline (change to smaller spectrum), broaden (change to broader spectrum),
different (change other than streamlining or broadening), and stop.
An advice was classified as “followed” when the advised antibiotic was changed before the
next result was available or within 24h after susceptibility results were available.
The following infections were excluded from the analysis as antibiotic therapy is not strictly
required according to the Dutch guidelines (sWAb): catheter related infection after removal
of the catheter, and biliary tract infection due to obstruction and after drainage. Also patients
to whom no more active treatment was given due to fatal underlying diseases were excluded
from analysis.
Statistical analysis. Patient characteristics, culture isolates and infections were analyzed by
Fisher’s Exact Test (non-continuous variables) and t-tests (continuous variables) for difference
between patients receiving prior iD-consultations and patients without prior iD-consultations
(sPss 16.0 for windows). Differences in percentage correct antibiotic therapy were analyzed
by chi square test between patients receiving prior iD-consultations and patients without
prior iD-consultations (http://faculty.vassar.edu/lowry/Vassarstats.html). Differences between
empirical correct therapy and correct advised therapy after Gram stain result was available,
were analysed by the Mcnemar test for paired samples. A p-value of < 0.05 was considered
significant.
results
From January 2002 until May 2002, 225 questionnaires were distributed. Of these 225 patients,
93 patients had a bloodstream infection requiring antibiotic treatment (figure 1).
Table 1 shows the baseline patient characteristics at inclusion stratified by patients without
and patient with prior iD-consultation. The percentage of patients with diabetes mellitus, hae-
matological malignancies, neutropenia or ventilator supports was significantly higher in the
group with prior iD-consultation. The number of patients with solid malignancies was higher
in the group without prior iD-consultation. Tables 2 and 3 show the causative microorganisms
and the associated infections, respectively. Although not significantly different, the percentage

factors influencing correct therapy 91
of patients with Cons and iV-Catheter related infections was higher in the group with prior
iD-consultation.
Empirical therapy without prior iD-consultation was microbiologically correct in 26 out of 49
(53%) cases compared to 33 out of 44 (75%) cases with prior iD-consultation (p: 0.03 )
From all 93 available Gram stain results, follow up data were available for the advice as given
by the iD consultant; from 27 of 30 results of “identification only” follow up data advice was
Table 2 Types of micro-organisms isolated in the no prior and the prior consultations group
No prior ID consulations
Prior ID consultation
n=49 (%) n=44 (5)
Gram positive Cons 1 (2%) 6 (14%)
S.aureus 6 (12%) 2 (5%)
S.pneumoniae 2 (4%) 4 (9%)
Enterococci 1 (2%) 2 (5%)
Other Gram positive 9 (18%) 4 (9%)
Gram negative Enterobacteriaceae 22 (45%) 19 (43%)
non-fermentative bacilli 1 (2%) 1 (2%)
Other Gram-negative bacilli 2 (4%) 1 (2%)
Yeast 2 (4%) 1 (2%)
Mixed infection 3* (6%) 5** (11%)
Total 49 44
P-value: 0.238 *E.coli and C.diversus; E.coli and E.faecalis; E.cloacae and K.pneumoniae** H.influenzae and S.mitis; P.aeruginosa and E.faecalis;s.mucilagenes and streptococcus sp ; Cons and E.faecalis; Cons and S.aureus
Table 3 Distribution of infections in the no prior and the prior consultations group.
No prior ID consultationPrior
ID consultationinfections* n=49 (%) n=44 (%)
Urinary tract 12 (24% 9 (20%)
iV-Catheter related 4 (8%) 9 (20%)
Endocarditis 2 (4%) 2 (5%)
Respiratory tract 3 (6%) 2 (5%)
intra-abdominal 14 (29%) 7 (16%)
skin 2 (4%) 1 (2%)
Central nervous system 1 (2%) 3 (7%)
Arthritis 1 (2%) 0 (0%)
bloodstream of unknown origin 10 (20%) 11 (25%)
nosocomial infections (% total)** 32 (65%) 26 (59%)
*P-value: 0.544, **P-value 1.0

cha
pter
6
92
Hoofdstuk 6 Figure 2
0
20
40
60
80
100
empirical (N= 49 &44)
Gram stain (N=93)
(empirical) therapy without ID-advice
therapy with ID-advice
*
**
Figure 2 Percentage effective antimicrobial therapy* Difference between therapy with iD-advice and without iD-advice is statistically signficant (P:0.03)**Difference between empirical therapy (with and without avice)and advised therapy after Gram stain are statistical significant (P: <0.0001)
Hoofdstuk 6 fig 3
Start therapy
Continue therapy
Streamline therapy
Broaden therapy
Different therapy
Stop therapy
No therapy
Gram stain (N=93)
18%
46%
9%
10%
13%
0%
4%
Other results (n=111)
4%
66%
19%
2%
6%
3% 0%
Figure 3 Advised therapy changes by iD consultants after laboratory result became available given by different categories of changes in antibiotic therapy

factors influencing correct therapy 93
avaliable (3 were lost to follow up); whereas this was known in 61 out of 63 combined identifica-
tion and susceptibility results (2 were lost to follow up) and in 23 of 30 susceptibility alone
results had information on advice (7 lost to follow up). Therefore 204 advices were available for
analysis. After Gram stain results only were available, advised therapy was microbiologically cor-
rect in 86 out of 93 (92 %) (Figure 2). After identification alone, identification and susceptibility
combined, and susceptibility alone, these percentages were 100 %, 97% en 100% respectively.
in 195 of 204 advices given (96 %) the advice given after a result was available this was followed.
nine of the 204 advices given were not followed (table 4).
Table 4 infectious disease advice not followed by the treating physician.
Recommendation administered Culture result commentsGram stain (4/93)1 Amoxicillin /
clavulanic acid combined with gentamicine
Amoxicillin /clavulanic acid.
E.coli Amoxicillin/clavulanic acid resistant and gentamicin sensitive
2 Cefuroxim Amoxicillin /clavulanic acid
E.coli sensitive to both
3 Amoxicillin /clavulanic acid combined with gentamicin
Amoxicillin /clavulanic acid
P.aeruginosa amoxicillin/clavulanic acid resistant and gentamicin sensitive
4 Amoxicillin/clavulanic acid
nothing E.coli Amoxicillin/clavulanic acid sensitive
Patient had obstructive cholangitis due to a tumor; no adequate drainage possible; after second positive blood culture antibiotic therapy was started.
Identification and susceptibility (4/61) 1 amoxicillin flucoxacillin E.faecalis amoxicillin
sensitivesensitive after second positive blood culture antibiotic therapy was changed.
2 stop amoxicillin/clavulanic acid; start ciprofloxacilin
amoxicillin/clavulanic acid and ciprofloxacilin
Salmonella sp ciprofloxacilin sensitive
Amoxicillin/clavulanic was stopped after a few days
3 stop amoxicillin/clavulanic acid; start amoxicillin
amoxicillin/clavulanic acid
e.coli amoxicillin sensitive
4 = patient number 4 of Gram stain
Susceptibility (1/23) 1 continu flucoxacillin
for 14 daysflucloxacillin for 1 day
S.aureus flucoxacillin sensitive
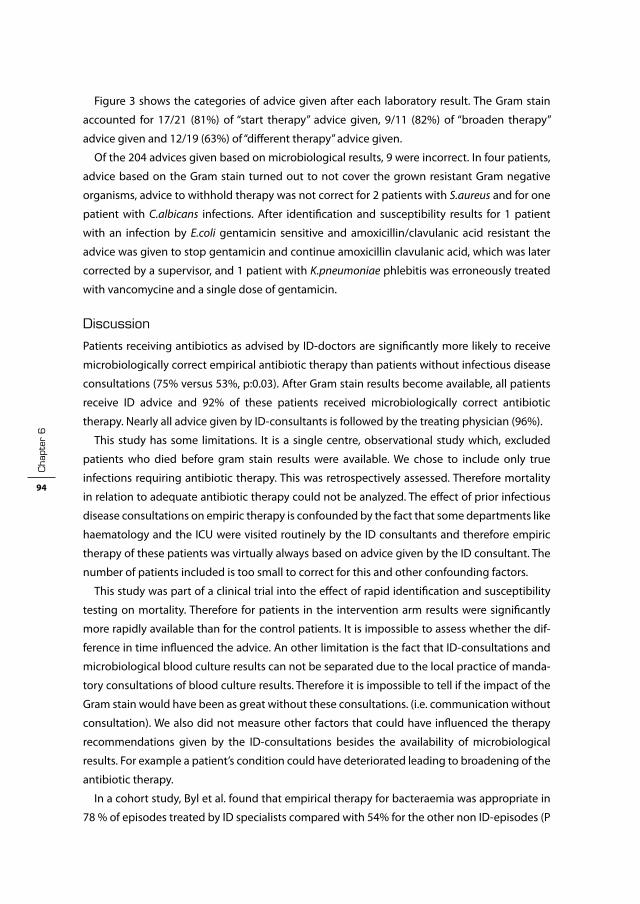
cha
pter
6
94
Figure 3 shows the categories of advice given after each laboratory result. The Gram stain
accounted for 17/21 (81%) of “start therapy” advice given, 9/11 (82%) of “broaden therapy”
advice given and 12/19 (63%) of “different therapy” advice given.
Of the 204 advices given based on microbiological results, 9 were incorrect. in four patients,
advice based on the Gram stain turned out to not cover the grown resistant Gram negative
organisms, advice to withhold therapy was not correct for 2 patients with S.aureus and for one
patient with C.albicans infections. After identification and susceptibility results for 1 patient
with an infection by E.coli gentamicin sensitive and amoxicillin/clavulanic acid resistant the
advice was given to stop gentamicin and continue amoxicillin clavulanic acid, which was later
corrected by a supervisor, and 1 patient with K.pneumoniae phlebitis was erroneously treated
with vancomycine and a single dose of gentamicin.
discussion
Patients receiving antibiotics as advised by iD-doctors are significantly more likely to receive
microbiologically correct empirical antibiotic therapy than patients without infectious disease
consultations (75% versus 53%, p:0.03). After Gram stain results become available, all patients
receive iD advice and 92% of these patients received microbiologically correct antibiotic
therapy. nearly all advice given by iD-consultants is followed by the treating physician (96%).
This study has some limitations. it is a single centre, observational study which, excluded
patients who died before gram stain results were available. We chose to include only true
infections requiring antibiotic therapy. This was retrospectively assessed. Therefore mortality
in relation to adequate antibiotic therapy could not be analyzed. The effect of prior infectious
disease consultations on empiric therapy is confounded by the fact that some departments like
haematology and the iCU were visited routinely by the iD consultants and therefore empiric
therapy of these patients was virtually always based on advice given by the iD consultant. The
number of patients included is too small to correct for this and other confounding factors.
This study was part of a clinical trial into the effect of rapid identification and susceptibility
testing on mortality. Therefore for patients in the intervention arm results were significantly
more rapidly available than for the control patients. it is impossible to assess whether the dif-
ference in time influenced the advice. An other limitation is the fact that iD-consultations and
microbiological blood culture results can not be separated due to the local practice of manda-
tory consultations of blood culture results. Therefore it is impossible to tell if the impact of the
Gram stain would have been as great without these consultations. (i.e. communication without
consultation). We also did not measure other factors that could have influenced the therapy
recommendations given by the iD-consultations besides the availability of microbiological
results. For example a patient’s condition could have deteriorated leading to broadening of the
antibiotic therapy.
in a cohort study, byl et al. found that empirical therapy for bacteraemia was appropriate in
78 % of episodes treated by iD specialists compared with 54% for the other non iD-episodes (P
factors influencing correct therapy 95
< .001). After availability of blood culture end-results, the proportion of appropriate treatments
increased to 97% for patients treated by iD-specialists and 89% for other patients (P: 0.008). This
is in line with our results, but they also suggest that blood culture results may have more impact
on appropriate therapy than consultations. However these results are not available during the
crucial first 48h .
From a trial of the impact of different methods in reporting of positive blood culture results,
bouza et al (1) concluded that clinical advice complementing written and oral microbiological
reports lead to 92.1 and 91.1% appropriate therapy days, respectively, compared with 66.3%
appropriate therapy days in cases without unsolicited advice. These data support our findings.
Trenholme et al (7) showed that rapid identification and susceptibility testing of blood culture
isolates leads to a significant reduction of antibiotic use. They reported that treatment recom-
mendations made by an iD-specialist based upon a rapid susceptibility test result were more
likely to be followed compared to the slow results. However, Munson et al. (6) concluded that
antimicrobial susceptibility data had the least impact on antimicrobial management compared
with interventions at the time of phlebotomy and after notification of Gram stain results by
telephone, which is in line with our findings. For this results, one should keep in mind that it is
indispensible to have a regularly updated antibiotic policy based on susceptibility results for
adequate empiric therapy.
Lo et al. (5) found a 92% compliance rate of therapeutic advice given by iD-specialists. All
consultations were solicited by the treating physicians. This is comparable to the 96% compli-
ance rate we found with a large portion of unsolicited consultations, indicating that acceptance
of unsolicited advice by iD-specialist is high.
in other countries the relative importance of the Gram stain and iD-consultations could be
lower due to increased and less predictable resistance.
The answers will be important to determine if one should invest in more iD-specialists, better
logistics or faster identification and susceptibility testing techniques.

cha
pter
6
96
referenceS
1. bouza, E., D. sousa, P. Munoz, M. Rodriguez-Creixems, C. Fron, and J. G. Lechuz. 2004. bloodstream infections: a trial of the impact of different methods of reporting positive blood culture results. Clin infect Dis 39:1161-9.
2. byl, b., P. Clevenbergh, F. Jacobs, M. J. struelens, F. Zech, A. Kentos, and J. P. Thys. 1999. impact of infec-tious diseases specialists and microbiological data on the appropriateness of antimicrobial therapy for bacteremia. Clin infect Dis 29:60-6; discussion 67-8.
3. Dellinger, R. P., M. M. Levy, J. M. Carlet, J. bion, M. M. Parker, R. Jaeschke, K. Reinhart, D. C. Angus, C. brun-buisson, R. beale, T. Calandra, J. F. Dhainaut, H. Gerlach, M. Harvey, J. J. Marini, J. Marshall, M. Ranieri, G. Ramsay, J. sevransky, b. T. Thompson, s. Townsend, J. s. Vender, J. L. Zimmerman, and J. L. Vincent. 2008. surviving sepsis Campaign: international guidelines for management of severe sepsis and septic shock: 2008. Crit Care Med 36:296-327.
4. Kerremans, J. J., P. Verboom, T. stijnen, L. Hakkaart-van Roijen, W. Goessens, H. A. Verbrugh, and M. C. Vos. 2008. Rapid identification and antimicrobial susceptibility testing reduce antibiotic use and accelerate pathogen-directed antibiotic use. J Antimicrob Chemother 61:428-35.
5. Lo, E., K. Rezai, A. T. Evans, M. G. Madariaga, M. Phillips, W. brobbey, D. n. schwartz, Y. Wang, R. A. Weinstein, and G. M. Trenholme. 2004. Why don’t they listen? Adherence to recommendations of infectious disease consultations. Clin infect Dis 38:1212-8.
6. Munson, E. L., D. J. Diekema, s. E. beekmann, K. C. Chapin, and G. V. Doern. 2003. Detection and treat-ment of bloodstream infection: laboratory reporting and antimicrobial management. J Clin Microbiol 41:495-7.
7. Trenholme, G. M., R. L. Kaplan, P. H. Karakusis, T. stine, J. Fuhrer, W. Landau, and s. Levin. 1989. Clini-cal impact of rapid identification and susceptibility testing of bacterial blood culture isolates. J Clin Microbiol 27:1342-5.

Chapter 7
needle to incubator time: logistic factors influencing transport times of blood culture specimens
J.J. Kerremans, A.K. van der Bij, W. Goessens,
H.A. Verbrugh, m.c. Vos
Dept. of Medical Microbiology & Infectious Diseases
Erasmus University Medical Centre, Rotterdam, the Netherlands
Journal of Clinical Microbiology 2009 47:819-22. (Abbreviated to note)

cha
pter
7
98
ABStrAct
Little is known about the pre-laboratory logistics of blood cultures. The aim of the present cohort
study was to measure transport times of blood cultures from the ward to the laboratory and to
identify factors influencing these transport times in a Dutch university medical centre. All blood
cultures for which time of culture sampling and arrival time at the laboratory were recorded,
were included in the study. To determine predictors associated with laboratory transport time,
univariate and multivariate Cox proportional hazards models were used. A total of 4,322 blood
cultures taken from 1,313 patients were included. The median time between culture collection
and arrival at the laboratory was 3.5 h (iQR 1.3-13.9 h). The most important predictors for long
transport times of blood culture specimens were: specimen collected at an off-site location
(HR 0.26), at one of the intensive care units (HR 0.52), or at the emergency room (HR: 0.30) (a
hazard ratio <1 is associated with a longer transport time). Another significant predictor for late
arrival was a (return) walking distance of 4-8 minutes. short walking distance to the laboratory
was associated with a significantly shorter transport time, as was being visited twice a day by
laboratory staff to collect the specimens. Transport times were longer than the recommended
4 h (AsM-guideline) for over 46% of cultures. Off-site location and type of clinical specialty are
the most important predictors of long transport times.
needle to incubator time 99
introduction
numerous techniques have been tested and marketed to reduce the turnaround time (TAT)
of microbiological diagnostics, including the TAT of blood culture systems. Methods vary from
optimising the use of automated techniques, direct inoculation of positive blood cultures into
identification (iD) and antimicrobial susceptibility testing (AsT) systems, to fully molecular-
based techniques. Reducing TAT has a significant effect on patient outcome, antibiotic use
and costs [1, 5, 7]. However, most studies so far have been limited to reducing assay times in
the laboratory while the total TAT (including the logistics of ordering tests in a routine setting)
would be much more informative.
surprisingly little is known about the pre-laboratory logistics of blood cultures. We previously
reported that the average time from collection of a blood culture specimen to its registration
by laboratory clerks was 10.4 h [7], which is much longer than the recommended maximum
of 4 h in the AsM (American society for Microbiology) guideline [6]. in contrast, bengtsson et
al. achieved a median transport time of 2.1 h with 24 h loading of the bacT/Alert; according to
these authors this is probably the shortest achievable transport time [2]. The recovery of micro-
organisms is reduced when loading of blood culture bottles into automated incubator systems
is delayed, especially when they are stored at 36° C prior to loading [8]. Therefore, transport
times should be monitored and minimized whenever possible. However, to our knowledge, no
other studies have actually measured transport time of blood cultures to the laboratory and
identified determinants of transport delay.
The aim of the present cohort study was to measure transport times of blood cultures and to
identify factors influencing these transport times in a university medical center.
methods
Setting and Specimens. The Erasmus MC is a 1200-bed tertiary-care university medical center;
it has an on-site medical microbiological laboratory that is open on weekdays from 07:30 am
until 5 pm, and on saturdays and sundays from 8:30 am until 1 pm. Commercial blood culture
bottles are inoculated directly at the bedside using a closed vacuum driven system. A small,
continuously monitoring, blood culture incubator (bactec 9120, becton Dickinson, sparks, MD,
UsA) is placed outside the laboratory to enable the direct incubation of blood culture bottles
outside laboratory opening hours.
blood is inoculated in a (standard) blood culture set consisting of a bactec PLUs Aerobic/F
bottle and an Anaerobic blood culture bottle or, on special indication, in single bactec MYCO/F-
Lytic (Mycobacterium spp) or bactec Mycosis (fungi) bottles. The two bottles of the standard
blood culture set are considered a single blood culture.
The laboratory receives blood cultures from 66 different clinical wards, of which 13 are
located outside the main building in another part of the city (off-site wards). The laboratory
staff collects blood culture bottles from 44 (on-site) departments during rounds scheduled at
cha
pter
7
100
8.30 am, 11.00 am, 1.30 pm or 2.00 pm. in total, 23 wards are visited once daily, 20 twice daily,
and one (the on-site hematology ward) is visited three times a day.
nine other on-site wards and all 13 off-site wards are not routinely visited by laboratory
personnel. From these wards the laboratory specimens are transported to the laboratory by a
courier service (off-site wards) or by their own personnel (the on-site wards). For on-site wards
the median time to walk (there and back) to the laboratory was 4.16 min (interquartile range;
iQR 3.24-4.48 min). For this study, the 66 clinical wards were grouped into 13 clinical specialties
based on the type of clinical care provided.
Inclusion and data collection. All blood cultures for which time of culture sampling and
arrival time at the laboratory were recorded, were included in this study. The transport time
was defined as the difference between these two times. For each specimen, data on micro-
biological culture results and department of collection were collected, and for each patient,
age was collected from the hospital information system. Walking distance from the wards to
the laboratory was measured in minutes during the daytime, and also in the evening hours.
both measurements were averaged. During the study period a bactec incubator placed directly
outside the laboratory was used to collect data outside the opening hours. in this way, time of
bottle entry into the bactec incubator was registered automatically; therefore, these data were
used to determine the time of arrival at the laboratory outside opening hours. During opening
hours the arrival time of a blood culture bottle is automatically registered; these data were used
as time of arrival during opening hours. The person performing the phlebotomy puts the time
of specimen collection on the laboratory request form.
Statistical analysis. Median laboratory transport times, and iQR were calculated per clinical
speciality group as defined above. To determine predictors associated with laboratory trans-
port time, we used univariate and multivariate Cox proportional hazards models including the
following variables: patient’s age, walking distance from the ward to the laboratory, number
of daily rounds at wards to collect cultures, time of culture collection before a daily round,
collection during laboratory opening hours, collection during week or weekend days, clinical
speciality, and bacterial culture growth. We interpreted a variable with a hazard ratio higher
>1 as associated with a shorter transport time, while we interpreted a variable with a hazard
ratio <1 as associated with a longer transport time. backward selection was used to obtain a
multivariate model that included significant variables only. To exclude intra-individual correla-
tion among blood cultures of the same patient, we repeated the multivariate analysis restricted
to one (the first) blood culture per patient to assess the robustness of our results. A p-value
<0.05 was considered statistically significant.
results
During 15 weeks (in the period 24 March to 5 October 2005) 5,868 blood culture sets were sub-
mitted to the laboratory. Of these 1,546 (26%) lacked information on time of sampling or arrival
time at the laboratory. Thus, 4,322 blood cultures taken from 1,313 patients were included;

needle to incubator time 101
their mean age was 55 years (standard deviation [sD] 17 years). A median number of two blood
cultures were collected per patient ranging from 1 culture to 44 cultures (iQR 1-3). The median
time between culture collection and arrival at the laboratory was 3.5 h (iQR 1.3-13.9 h). The
percentage of cultures arriving within 4 h was 53.2%.
Table 1 shows the median transport time, the median time required to cover the two-way
walking distance from the ward to the laboratory, and the number of daily collection rounds per
clinical specialty. The specialties with a median transport time of less than 1 hour were nephrol-
ogy and neurology. blood cultures from hematology/oncology, lung disease, intensive Care Unit
(iCU) and the thorax center’s iCU, and the emergency department (ER) had a median transport
time exceeding 3 h, with cultures from the ER having a median transport time of 16 h. Median
transport times for the off-site wards were substantially longer than for the on-site wards.
Table 1 Median laboratory transport times from collection until arrival of blood cultures by clinical specialty and location of wards in a Dutch university medical center.
Clinical specialtygroup
Number of clinical wards
Number of off-site wards
Number of daily rounds*
Minimum-maximum walking time in minutes (two-way)*
Number of blood cultures analyzed
Median laboratory transport time (IQR)** in hours
neurology 2 0 1-2 3.5-36 65 0.60 (0.38-1.41)
nephrology 1 0 2 1.3 212 0.87 (0.38-1.97)
General internal Medicine
3 0 1 1.3-2.1 131 1.17 (0.53-3.93)
surgery 12 0 1-2 2.7-5.7 411 1.30 (0.53-3.49)
Gastroenterology 1 0 2 2.3 173 1.33 (0.48-2.94)
infectious Diseases 2 0 2 3.2 293 1.90 (0.73-4.37)
Other (outpatients, psychiatry and revalidation)
20 3 0-2 4.3-4.4 67 2.00 (0.81-3.20)on-site: 1.56 (0.78-2.65)off-site: 12.63 (9.37-13.50)
Thorax center*** 5 0 1-2 4.9-7.9 193 2.65 (1.22-5.75)
Pulmonology 2 0 1 4.7 44 3.08 (0.83-14.20)
intensive care 3 0 1-2 2.3-5.7 818 3.54 (2.12-11.90)
Thorax center ***iCU
2 0 2 6.8-6.9 241 3.87 (1.83-8.47)
Hematology/Oncology
12 10 1-3 1.3-4.3 1450 12.63 (3.06-16.36)on-site: 2.83 (1.39-10.82)off-site: 14.55 (4.92-17.78)
Emergency Medicine
1 0 1 5.1 224 16.00 (9.70-19.07)
Total 66 13 0-3 1.3-7.9 4322 3.52 (1.33-13.90)
* not applicable for off-site departments** interquartile range*** Combined wards of cardiology and thoracic surgery, located in a separate building but connected with the main hospital building.
cha
pter
7
102
in univariate analysis, patient age, walking distance, number of daily rounds, time of culture
collection, and medical specialty were significantly associated with blood culture transport
time (Table 2). Associated with a shorter transport time were cultures collected from: persons
older than 50 years, departments with a two-way walking distance within 4 min from the labo-
ratory, wards with twice-a-day collection rounds, and specimens taken within 0.5-2 h before a
daily round. Associated with a longer transport time were cultures collected from departments
located outside the main building, the ER, iCU, and the departments of pulmonology, hema-
tology/oncology, as well as cultures collected during weekend days. in multivariate analysis
walking distance, number of collection rounds, collection during week days or weekend days
and clinical specialty were independently associated with transport time (Table 2). Cultures col-
lected from off-site wards were associated with a longer transport time than cultures collected
from in-house wards (HR [hazard ratio] 0.26, 95% Ci [confidence interval] 0.15-0.45) when
compared with cultures collected from wards within 4 min two-way walking to the laboratory.
Cultures collected from wards with one or three rounds were associated with longer transport
times compared with cultures collected from wards with two rounds (HR 0.85, 95% Ci 0.75-
0.97 and HR 0.44, 95% Ci: 0.21-0.93). specimens collected at the thorax center, nephrology,
infectious disease, pulmonary disease, iCU and thorax center iCU and the ER showed longer
transport times compared with specimens collected at the surgical wards.
To assess the robustness of our results we performed multivariate Cox regression restricted
to the first culture available of patients, to exclude confounding by intra-individual correlation.
This analysis showed similar results concerning walking distance, number of rounds and clini-
cal specialty as for all available blood cultures. However, the day of specimen collection (week
versus weekend) was excluded from the multivariate model since it was not significant (p=0.7).
discussion
in our institution we found a median transport time of 3.5 h, with more than 46% of cultures
exceeding the 4 h recommend by the AsM [6]. The most important predictors for long transport
times of blood culture specimens were: specimen collected at an off-site location (HR 0.26), at
one of the iCUs (HR 0.52) or at the ER (HR: 0.30). Other significant predictors for long transport
time were a walking distance of 4-8 minutes (HR 0.80). short walking distance to the labora-
tory was associated with significantly shorter transport time. Also, being visited twice a day by
laboratory staff to collect specimens was associated with short transport times.
Only blood culture specimens for which the time of collection was available could be
included in our analysis. However, the percentage of correctly filled out request forms differs
significantly per clinical specialty, with hematology and oncology performing the worst (35 and
40% missing data, respectively) and the iCU and the thorax center iCU performing the best (11
and 13% missing data, respectively) (data not shown). This could have led to some selection
bias, but the direction of which is unclear.
needle to incubator time 103
Table 2 Univariate and multivariate Cox proportional-hazards models for laboratory transport time of 4,322 blood cultures.
Factor Univariate Model Overall p-value
Multivariate Model
Age ≤ 50 years > 50 years
11.11 (1.04-1.18)
0.001
Walking distance (two-way) Within 4 minutes between 4 minutes and 8 minutes not applicable: collected at off-site Wards
10.51 (0.48-0.55)
0.30 (0.28-0.33)
<0.00110.80 (0.69-0.84)*
0.26 (0.15-0.45)
<0.001
Number of daily rounds none/off-site One Two Three
0.38 (0.35-0.42)0.65 (0.60-0.70)10.71 (0.64-0.78)
<0.0010.64 (0.39-1.05)0.85 (0.75-0.97)10.40 (0.28-0.56)
<0.001
Time of specimen collection before daily rounds <0.5 hours 0.5-2 hours 2-4 hours 4-8 hours >8 hours not applicable (off-site or no daily rounds)
11.16 (1.01-1.34)1.00 (0.86-1.18)0.96 (0.83-1.11)0.84 (0.75-0.94)
0.44 (0.39-0.50)
<0.001
Collection during laboratory opening hours (7.30-16.30) Yes no
10.95 (0.90-1.01)
1.24
Collection day Week days Weekend days
10.87 (0.81-0.94)
<0.00110.92 (0.85-0.98)
0.017
Medical specialty surgery Thorax center** General internal Medicine Hematology/Oncology Gastroenterology nephrology infectious Diseases Pulmonology neurology intensive care Thorax center** iCU Emergency Medicine Other (outpatients, psychiatry and revalidation)
10.74 (0.63-0.88)0.94 (0.77-1.14)0.34 (0.30-0.38)1.05 (0.88-1.25)0.98 (0.83-1.16)0.84 (0.72-0.98)0.47 (0.35-0.64)1.24 (0.95-1.61)0.48 (0.42-0.54)0.54 (0.46-0.63)0.26 (0.22-0.30)
0.85 (0.67-1.10)
<0.00110.80 (0.65-0.98)0.90 (0.72-1.14)1.37 (1.04-1.80)0.87 (0.72-1.05)0.81 (0.68-0.97)0.69 (0.58-0.81)0.56 (0.41-0.78)1.16 (0.88-1.53)0.52 (0.45-0.60)0.55 (0.44-0.68)0.30 (0.25-0.36)
1.48 (1.08-2.04)
<0.001
Bacterial growth no growth s. aureus Cons streptococcus & enterococcus spp Enterobacteriaciae non fermenter Yeast 2 or more different organisms Other
11.07 (0.84-1.38)0.83 (0.71-0.98)0.89 (0.58-1.36)0.86 (0.72-1.04)0.82 (0.55-1.23)1.11 (0.69-1.78)1.30 (0.89-1.90)1.15 (0.78-1.69)
0.18
Data are hazard ratio (95% confidence interval)A variable with a hazard ratio larger than one is associated with a longer transport time, while a variable with a hazard ratio smaller than one is associated with a shorter transport time.* The difference between 4 and 8 minutes and off-site wards is significant ** Combined departments of wards and thoracic surgery, located in a separate building but connected with the main hospital building.
cha
pter
7
104
Only during laboratory opening hours do off-site locations have a regular transport of patient
specimens to our laboratory; this explains the longer transport times for these wards. The iCUs
also have longer transport times, which is surprising considering that these patients are at high
risk for invasive nosocomial infections and would probably benefit most from rapid turnaround
times of the blood cultures ordered. At these latter wards, the transport delay is most likely due
to the high workload of the nursing staff. The iCU ward located nearest to the laboratory had
significantly shorter transport time than the iCU wards located further away; again, emphasiz-
ing the importance of distance between patient rooms and the medical microbiology facility.
The ER had the longest transport time; a blood culture took a median of 16 h to arrive in
our laboratory. This delay appears to be caused by the ER personnel waiting for cultures to
be collected (by laboratory personnel at 8.30 am each morning), despite that they are clearly
instructed to bring them to the laboratory outside the opening hours of the laboratory.
The on-site hematology ward (the only ward visited three times a day to collect cultures) had
significantly longer transport times. An explanation for this could be the timing of the visits
(8:30 am, 11:30 am and 14:00 pm) which is not optimal because a large part of the afternoon is
not covered. Paradoxically, due to these frequent visits the nursing staff may feel it is unneces-
sary to bring the blood cultures to the laboratory themselves.
To minimize transport delay at off-site departments a blood culture incubator system should
be installed at these locations. negative blood culture bottles can be disposed of on site, and
only positive blood cultures need to be transferred to the main laboratory location. Feedback
regarding their transport time in relation to the hospital’s average transport time should be
provided to all on-site wards to make them more aware of the need to consider the logistics of
the diagnostic tests they order and, hopefully, to improve their performance.
Patient care can be improved by timely results of positive blood cultures. byl et al. [4] showed
that with the availability of blood culture results the proportion of appropriate treatments
increased from 63 to 94%. Adjustment of antibiotic treatment according to results of blood
cultures also leads to decreased antibiotic use and costs [3]. Therefore, efforts to reduce the
turnaround time of these vital results are essential.
conclusion
Much effort has been focused on developing rapid diagnostic testing techniques. However,
surprisingly little is known about the seemingly simple but basic logistic principles that
determine the transport to the laboratory. Therefore, transport times should be monitored and
efforts should be made to optimize transport times.
needle to incubator time 105
referenceS
1. barenfanger, J., C. Drake, and G. Kacich. 1999. Clinical and financial benefits of rapid bacterial identifi-cation and antimicrobial susceptibility testing. J Clin Microbiol 37:1415-8.
2. bengtsson, J., M. Wahl, and P. Larsson. 1998. Assessment of the bacT/Alert blood culture system: rapid bacteremia diagnosis with loading throughout the 24 h. Clin Microbiol infect 4:33-37.
3. berild, D., A. Mohseni, L. M. Diep, M. Jensenius, and s. H. Ringertz. 2006. Adjustment of antibiotic treatment according to the results of blood cultures leads to decreased antibiotic use and costs. J Antimicrob Chemother 57:326-30.
4. byl, b., P. Clevenbergh, F. Jacobs, M. J. struelens, F. Zech, A. Kentos, and J. P. Thys. 1999. impact of infec-tious diseases specialists and microbiological data on the appropriateness of antimicrobial therapy for bacteremia. Clin infect Dis 29:60-6; discussion 67-8.
5. Doern, G. V., R. Vautour, M. Gaudet, and b. Levy. 1994. Clinical impact of rapid in vitro susceptibility testing and bacterial identification. J Clin Microbiol 32:1757-62.
6. Garcia, E. i. C. L. s. 2007. 2007 Update: Clinical Microbiology Procedures Handbook, 2nd Edition, PRinT, 2nd ed. AsM Press, Herndon.
7. Kerremans, J. J., P. Verboom, T. stijnen, L. Hakkaart-van Roijen, W. Goessens, H. A. Verbrugh, and M. C. Vos. 2008. Rapid identification and antimicrobial susceptibility testing reduce antibiotic use and accelerate pathogen-directed antibiotic use. J Antimicrob Chemother 61:428-35.
8. sautter, R. L., A. R. bills, D. L. Lang, G. Ruschell, b. J. Heiter, and P. P. bourbeau. 2006. Effects of delayed-entry conditions on the recovery and detection of microorganisms from bacT/ALERT and bACTEC blood culture bottles. J Clin Microbiol 44:1245-9.

Chapter 8
direct incubation of blood cultures outside routine opening hours accelerates antibiotic switch
J. J. Kerremans*, A.K. van der Bij, W. Goessens,
H.A. Verbrugh, m.c. Vos
Dept. of Medical Microbiology & Infectious Diseases
Erasmus University Medical Center, Rotterdam, the Netherlands
Journal of Clinical Microbiology published in modified form online ahead of print on
26 August 2009

cha
pter
8
108
ABStrAct
The aim of this prospective randomized controlled clinical trial was to assess the impact of
direct incubation of blood cultures delivered at the laboratory outside hours of operation on
turnaround times, antibiotic prescription practices, and patient outcomes. A continuously
monitoring blood culture incubator was placed outside the laboratory, which was switched
On (intervention arm) and OFF (control arm) in a randomized manner. included were new
bacteraemia episodes of patients older than 18 years. During the 30-week study period, the
first positive blood culture specimen of an episode had to be brought to the laboratory outside
opening hours. The primary outcome was time from specimen collection to the first change in
antibiotic regimen defined as start, switch, addition or stop of an antibiotic after detection of
culture growth. secondary outcome parameters were total duration of hospital stay, and hos-
pital mortality. The median time from specimen collection until growth detection was reduced
by 10.1 h in the intervention arm (p value <0.001). From a total of 46 of 66 (70%) episodes
in the intervention arm and from 51 of 85 (60%) episodes in the control arm, the antibiotic
regimen was changed (not significant). The median time until the first change was 42.8 h in
the intervention arm and 64.0 h in the control arm (p value: 0.024). There was no difference in
length of stay or hospital mortality. Direct incubation of blood cultures outside opening hours
reduces turnaround times and accelerates antibiotic switch.
direct incubation of blood cultures 109
introduction
Appropriate antibiotic therapy in bacteraemia is associated with a decrease in mortality (13).
shortening the period in which no or only empiric therapy is given, may result in improved
patient outcomes. Antibiotic stewardship requires clinical expertise combined with accurate
microbiological identification and susceptibility profiles of the causative micro-organisms. A
major step in reducing mortality rates (7), costs (2) and antibiotic use (4, 5) was the introduction
of microbiological diagnostic systems that reduce the turnaround time of tests for identifica-
tion and susceptibility testing of bacterial pathogens.
Probably the most important moment for changing antibiotic therapy is when results
become available of blood-culture specimens taken from patients with signs and symptoms of
severe sepsis. blood-culture specimen analysis was considerably improved by the introduction
of automated blood-culture systems. Compared to the manual blood culture systems one of
the major improvements was the reduction of time needed to identify positive blood cultures,
i.e. bottles that have significant growth. However, Riest et al.(11) demonstrated that this time
benefit for detection of positive blood cultures is lost if loading and processing of the blood
culture bottles is organized discontinuously. Also, the recovery of micro-organisms is compro-
mised if loading of blood culture bottles is delayed, especially when they are stored at 36° C
before loading into the blood-culture system (12), therefore preincubation.without growth
monitoring is not advised.
Our hypothesis was that direct incubation of blood culture bottles would shorten the time
period until antibiotic therapy is changed and, therefore, may improve patient outcomes.
Therefore, we placed a continuously monitoring blood culture incubator (bactec 9120, becton
Dickinson, sparks, MD, UsA) outside the laboratory. This enabled loading of blood culture
bottles in the incubator outside laboratory opening hours by non-laboratory personnel. We
assessed the impact of direct incubation of blood cultures delivered at the laboratory after
hours of operation, on turnaround time, time to antibiotic regimen change, in-hospital mortal-
ity and hospital stay in a randomized controlled clinical trial.
Patients and methods
Setting. The Erasmus MC is a 1200-bed tertiary-care university medical center. The department
of Medical Microbiology and infectious Diseases has its laboratory integrated with an active
infectious diseases (iD) consultation service run by a team of MD-microbiologists and infec-
tious diseases specialists. This iD consultation service operates 24/7. The laboratory is open
on weekdays from 07:30 am until 5 pm, on saturdays and sundays from 8:30 am until 1 pm.
During hours of operation all blood-culture specimens are processed directly. During evening
and night shifts, a technician and an iD consultant are on call for emergency purposes. blood
culture bottles are inoculated directly at the bedside using a closed vacutainer needle system.
A standard blood culture set consists of an aerobic and an anaerobic bottle.

cha
pter
8
110
Intervention. A continuously monitoring blood culture incubator (bactec 9120, becton Dickin-
son, sparks, MD, UsA) was placed in the hall directly outside the laboratory facility. This enabled
loading of blood culture bottles in the incubator. outside laboratory hours of operation. This
incubator was randomly switched on and off. During the bactec-On periods (intervention
periods) negative bottles were transferred to the main bactec inside the laboratory and positive
bottles were processed at the start of the working day. During the bactec-OFF periods (control
periods) the outside bactec functioned as a blood culture storage cabinet at ambient tempera-
ture and all bottles were transferred to the main bactec in the morning.
Randomization. An independent epidemiologist provided a computer-generated list defin-
ing outside bactec status (On/OFF); 3 randomization blocks of 8 weeks and one of 6 weeks
were used. The setting of the instrument was changed weekly, by two senior technicians, in
accordance with the computer-generated list. These senior technicians did not have any direct
involvement with patient diagnostics.
After the 30-week study period was completed the primary investigator assessed each entry
for eligibility according to predefined inclusion criteria (see below).
A reduction in turnaround time cannot be blinded, thus no formal blinding was attempted.
However, the attending physicians and the consulting iD specialists were not informed that the
patient was included in the trial. The monitor displaying the outside bactec status was switched
off throughout the entire study period.
Inclusion criteria. included were new bacteraemia episodes of patients hospitalized or seen
at the emergency department, older than 18 years. The first positive blood cultures specimen
of an episode had to be brought to the laboratory outside its hours of operation. Only new
bacteraemia episodes were included. To qualify as a new bacteraemia episode there had to be
at least 7 days between positive cultures with the same organism, and at least 24 h if different
species of micro-organisms were recovered.
Outcomes and data collection. The primary outcome measure was time from specimen col-
lection to the first change in antibiotic regimen as defined as start, switch, addition, or stop of
an antibiotic, that happened after detection of growth. secondary outcome parameters were
turnaround times (defined as collection until growth detection, identification and susceptibility
testing results), total duration of hospital stay, and hospital mortality.
Episodes were followed until 48 h after the susceptibility testing results were available for
the primary outcome, or 48 h after identification if no susceptibility testing was performed.
Changes after this period were considered not to be related to culture results (Figure 1). For the
secondary outcomes, mortality and hospital stay, the first episode of each patient was followed
until hospital discharge.
Of all included patients, data on microbiological cultures, age, gender, duration and depart-
ment of stay, mortality data and antibiotic use were collected from the hospital information
system and the intensive care units’ information systems.
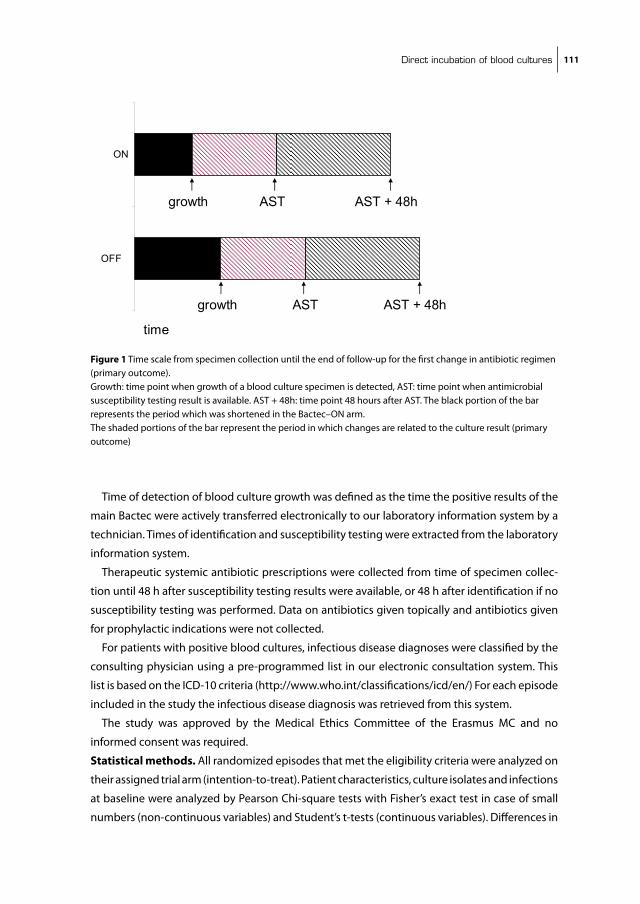
direct incubation of blood cultures 111
Time of detection of blood culture growth was defined as the time the positive results of the
main bactec were actively transferred electronically to our laboratory information system by a
technician. Times of identification and susceptibility testing were extracted from the laboratory
information system.
Therapeutic systemic antibiotic prescriptions were collected from time of specimen collec-
tion until 48 h after susceptibility testing results were available, or 48 h after identification if no
susceptibility testing was performed. Data on antibiotics given topically and antibiotics given
for prophylactic indications were not collected.
For patients with positive blood cultures, infectious disease diagnoses were classified by the
consulting physician using a pre-programmed list in our electronic consultation system. This
list is based on the iCD-10 criteria (http://www.who.int/classifications/icd/en/) For each episode
included in the study the infectious disease diagnosis was retrieved from this system.
The study was approved by the Medical Ethics Committee of the Erasmus MC and no
informed consent was required.
Statistical methods. All randomized episodes that met the eligibility criteria were analyzed on
their assigned trial arm (intention-to-treat). Patient characteristics, culture isolates and infections
at baseline were analyzed by Pearson Chi-square tests with Fisher’s exact test in case of small
numbers (non-continuous variables) and student’s t-tests (continuous variables). Differences in
Hoofdstuk 8 fig 1
OFF
ON
time
growth
growth
AST
AST
AST + 48h
AST + 48h
Figure 1 Time scale from specimen collection until the end of follow-up for the first change in antibiotic regimen (primary outcome). Growth: time point when growth of a blood culture specimen is detected, AsT: time point when antimicrobial susceptibility testing result is available. AsT + 48h: time point 48 hours after AsT. The black portion of the bar represents the period which was shortened in the bactec–On arm. The shaded portions of the bar represent the period in which changes are related to the culture result (primary outcome)
cha
pter
8
112
turnaround time and time from specimen collection until the first change in antibiotic regimen,
and length of hospital stay were analyzed using non-parametric tests (Mann-Whitney U-test).
Time from specimen collection until the first change in antibiotic regimen and mortality were
analyzed univariately using Kaplan Meier (KM) survival analysis. A p value <0.05 was considered
statistically significant.
results
The inclusion period was from March 2005 until October 2005. The bactec was switched on
during 104 days (intervention period) and switched off during 107 days (control period). Figure
2 depicts the bactec On/OFF switch regimen and the flow of blood cultures delivered to the
laboratory during the hours that the laboratory was closed. A total of 170 new bacteraemia
episodes were identified: 78 (70 patients) in the bactec-On arm, 92 (85 patients) in the bactec-
OFF arm.
Hoofdstuk 8 fig 2
1325 blood cultures* from
664 patients
1334 blood cultures* from
692 patients
139 positive bloodcultures
from 93 patients
143 positive bloodcultures
from 108 patients
78 new bacteraemia episodes
from 70 patients
92 new bacteraemia episodes
from 85 patients
70 first episodes from 70 patients
85 first episodes from 85 patients
Intervention arm "BACTEC-ON" (104 days)
Control arm "BACTEC-OFF" (107 days)
Excluded 11:collection time
missing 1::antibiotics missing
Excluded 1: not admitted to
hospitalNo exclusion
Excluded 6:collection time
missing 1: antibiotics missing
Primary outcome changes in antibiotic
regimen
Secondary outcomes
Mortality Hospital stay
Figure 2 blood cultures brought to the laboratory outside office hours from March 2005 until October 2005, and selection of positive episodes to be included in the study. *A blood culture consists of 2 bottles: an aerobic and an anaerobic bottle.

direct incubation of blood cultures 113
Table 1 summarizes baseline demographic and clinical characteristics of each group. There
were no significant differences at baseline between the two groups.
From 67 (86%) episodes in the intervention and from 86 (92%) episodes in the control arm,
time of specimen collection was available. The median time from blood culture collection until
growth detection was reduced by 10.1 h in the bactec-On arm (p <0.001) subsequently, median
times from specimen collection until identification and susceptibility testing results were also
significantly reduced (Table 2).
For two episodes (one in each of the two arms of the study), antibiotic use could not be
assessed due to missing data. in 46 of 66 (70%) episodes in the bactec-On arm and in 51 of
85 (60%) episodes in the bactec-OFF arm the antibiotic regimen was changed (at least once)
between growth detection and 48 h after susceptibility testing results became available. Of
Table 1 Characteristics of patients and bacteraemia episode at baseline.
Bactec-ON Bactec-OFFPatient characteristics (first episode) n=70 n=85
Age in years (±sD)* 57.4 (19) 56.6 (14.3)
Males: number (%)* 48 (69%) 55/85 (65%)
Ward: number (%)*
Medical 25 (36%) 32 (38%)
General surgery 7 (10%) 16 (19%)
neurology and neurosurgery 5 (7%) 2 (2%)
Cardiology and thorax surgery 6 (9%) 10 (12%)
Emergency Department 2 (3%) 6 (7%)
iCU 25 (36%) 19 (22%)
Episode characteristics n=78 n=92
Micro-organism*
Cons 24 (31%) 34 (37%)
S.aureus 14 (18%) 7 (8%)
streptococci and enterococci 2 (3%) 11 (12%)
Enterobacteriaceae and Pseudomonas 25 (30%) 22 (24%)
Other 4 (5%) 8 (9%)
Yeast 1 (1%) 2 (2%)
Mixed culture 8 (10%) 8 (9%)
Underlying infections*
Urinary tract 6 (8%) 7 (8%)
intravenous catheter-related 27 (35%) 28 (30%)
Respiratory tract 1 (1%) 5 (5%)
intra-abdominal 19 (24%) 21 (23%)
bloodstream of unknown origin 9 (11%) 5 (5%)
Other 7 (9%) 4 (4%)
Contamination 9 (12%) 22 (24%)
* Differences not significantCons: coagulase negative staphylococci

cha
pter
8
114
the first changes in the bactec-On arm 14 (30%) were starts, 20 (43%) were switches, 8 (17%)
were additions, and 4 (9%) were stops; in the bactec-OFF arm these numbers were 11 (22%),
21 (41%), 9 (18%) and 10 (20%), respectively. The median time from specimen collection until
the first change in antibiotic therapy was 42.8 h (interquartile range; iQR 23.5-72.1) in the
bactec-On arm and 64.0 h (iQR 41.8-74.5) in the bactec-OFF arm (p = 0.024). Figure 3 presents
the result of the KM survival analysis, showing the significant reduction in time to change in
antibiotic regimen. in the bactec-On arm 14 of 70 patients (20%) died during their hospital
stay; in the bactec-OFF arm 11 of 84 patients (13%) died (p =0.25). For the 56 surviving patients
in the bactec-On arm the median hospital stay was 28 days (iQR 13.5-43.5), for the 73 surviving
patients in the control arm this was 23 days (iQR 9.5-64.5) (p= 0.89).
discussion
Direct incubation of blood cultures arriving when the medical microbiology laboratory is
closed, significantly reduces turnaround times and this reduction, consequently results in a
significantly earlier change of antibiotic regimen in patients with potentially life-threatening
infections. However, this earlier change in antibiotic regimen did not result in a reduction of
mortality or length of hospital stay in these patients.
Limitations of our study are, firstly, that we used the time that the technician detected
growth in the bactec as start of the time period in which changes of antibiotic regimen were
based on the culture result (figure 1). We elected to use this point in time as this information
was recorded without bias and was easily obtained. However, some delay exists between this
time and the time a result was brought to the attention of the attending physician; this time lag
can range from 15 minutes (time to make a Gram stain and make a telephone call) to a couple
of hours, depending on the workload and schedule of the iD consultant.
A second limitation of our study design is the follow-up period of 48 h after susceptibility
testing results became available. This time frame may have been too short, such that we may
have missed a number of later antibiotic changes based on the blood culture result. However,
extending this time frame would have increased the chance to include changes in the antibi-
otic regimen that were unrelated to the reporting of the microbiological test results. However,
Table 2 Time intervals between blood culture collection and growth detection, identification and susceptibility testing for new bacteraemia episodes.
interval (h) from specimen collection to
bactec-Onn=67
bactec-OFFn=86
P value
median (iQR*) median (iQR*)
Growth detection 29 (18-39) 39 (29-51) <0.001
identification 44 (36-61) 63 (44-86) <0.001
susceptibility testing 62 (45-81) 70** (60-92) 0.009
*iQR: interquartile range**n=82
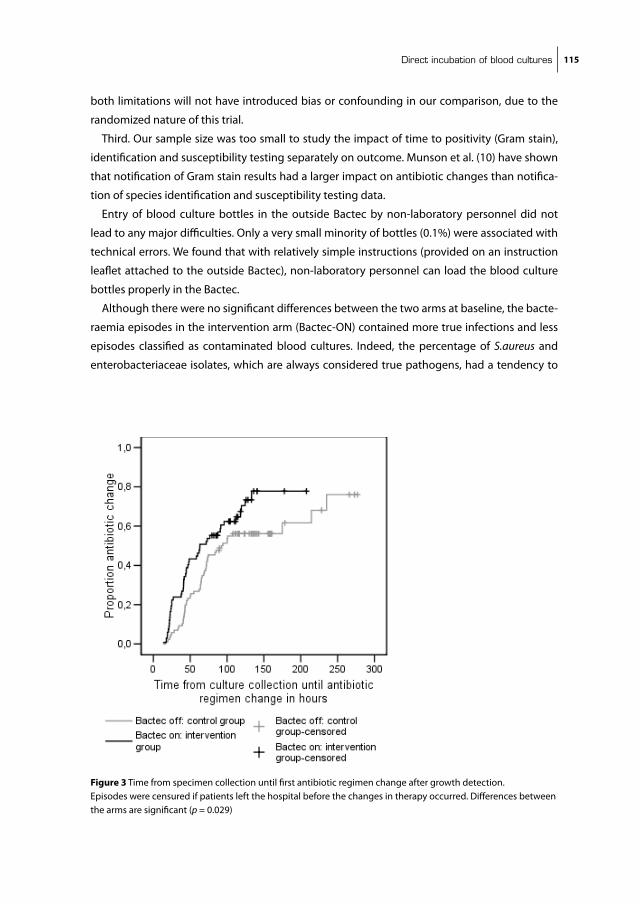
direct incubation of blood cultures 115
both limitations will not have introduced bias or confounding in our comparison, due to the
randomized nature of this trial.
Third. Our sample size was too small to study the impact of time to positivity (Gram stain),
identification and susceptibility testing separately on outcome. Munson et al. (10) have shown
that notification of Gram stain results had a larger impact on antibiotic changes than notifica-
tion of species identification and susceptibility testing data.
Entry of blood culture bottles in the outside bactec by non-laboratory personnel did not
lead to any major difficulties. Only a very small minority of bottles (0.1%) were associated with
technical errors. We found that with relatively simple instructions (provided on an instruction
leaflet attached to the outside bactec), non-laboratory personnel can load the blood culture
bottles properly in the bactec.
Although there were no significant differences between the two arms at baseline, the bacte-
raemia episodes in the intervention arm (bactec-On) contained more true infections and less
episodes classified as contaminated blood cultures. indeed, the percentage of S.aureus and
enterobacteriaceae isolates, which are always considered true pathogens, had a tendency to
Hoofdstuk 8 fig 3
Figure 3 Time from specimen collection until first antibiotic regimen change after growth detection.Episodes were censured if patients left the hospital before the changes in therapy occurred. Differences between the arms are significant (p = 0.029)

cha
pter
8
116
be higher in the intervention arm. Correction for these factors did not significantly influence
the outcome (data not shown).
There are molecular techniques for direct identification of micro-organisms from blood
without a culturing step under development (9), which promise an even further reduction in
turnaround time. However, Ammann et al. (1) compared a 16s rRnA PCR with blood culture
and found a disappointingly low sensitivity and specificity of that test. Also, nucleic acid based
methods remain expensive. To benefit fully from these rapid molecular tests the laboratory
would have to offer these tests 24/7 and should not process them in batches during office
hours only. This is because, in the latter case, direct incubation of blood culture specimens after
hours of operation combined with rapid identification and susceptibility testing (8) will have a
shorter turnaround time than these molecular assays.
bengtsson et al. (3) showed that with continuous (24/7) loading of the bacT/Alert blood
culture system the median time from specimen collection until Gram stain was only 21.5 h. The
7.5 h difference with the 29 h we found, is probably due to less efficient transport in our setting.
The impact of direct incubation depends on the opening hours of the laboratory, and the
willingness of non-laboratory personnel to bring the blood culture bottles to the laboratory
and load them into a continuously monitoring blood culture incubator. Therefore, the location
of this unit should be carefully considered and be as convenient for them as possible.
in the netherlands the concept of de-escalation therapy (6) to a regimen with the narrowest
spectrum providing adequate coverage is widely accepted, advised by the iD consultants and
implemented by the attending physicians. Earlier reporting of laboratory results will have less
impact if these de-escalating policies are not present. in countries with high rates of multiple-
resistant micro-organisms causing bacteraemic disease, streamlining will prove more difficult.
However, rapid reporting of results could also reduce the time a patient is exposed to an inef-
fective regimen. byl et al. (5) reported that empirical treatment was appropriate in only 63%
of bacteraemia episodes and that after availability of blood culture results, the proportion of
appropriate treatments increased to 94%.
The cost of implementing our intervention is low: just a small size continuously monitoring
blood culture incubator that takes little space. The benefits could be substantial as berild et al.
(4) have shown that adjustment of antibiotic treatment according to results of blood cultures
leads to decreased antibiotic use and costs. Rapid availability of results by direct incubation
leads to an earlier adjustment and probably to even lower antibiotic costs.
in conclusion, we have shown that direct incubation of blood culture bottles, brought to the
laboratory outside opening hours, results in significantly reduced turnaround times and the
reduced turnaround times result in significantly earlier changes in antibiotic therapy. This inter-
vention is inexpensive and easy to integrate in present medical microbiological laboratories.

direct incubation of blood cultures 117
funding
becton Dickinson provided the outside bactec incubator used in this study but had no influ-
ence on the design, conduct and analysis of the trial. Otherwise no funding was received.
transparency declarations
none to declare.

cha
pter
8
118
referenceS
1. Ammann, R. A., F. Zucol, C. Aebi, F. K. niggli, T. Kuhne, and D. nadal. 2007. Real-time broad-range PCR versus blood culture. A prospective pilot study in pediatric cancer patients with fever and neutrope-nia. support Care Cancer 15:637-41.
2. barenfanger, J., C. Drake, and G. Kacich. 1999. Clinical and financial benefits of rapid bacterial identifi-cation and antimicrobial susceptibility testing. J Clin Microbiol 37:1415-8.
3. bengtsson, J., M. Wahl, and P. Larsson. 1998. Assessment of the bacT/Alert blood culture system: rapid bacteremia diagnosis with loading throughout the 24 h. Clin Microbiol infect 4:33-37.
4. berild, D., A. Mohseni, L. M. Diep, M. Jensenius, and s. H. Ringertz. 2006. Adjustment of antibiotic treatment according to the results of blood cultures leads to decreased antibiotic use and costs. J Antimicrob Chemother 57:326-30.
5. byl, b., P. Clevenbergh, F. Jacobs, M. J. struelens, F. Zech, A. Kentos, and J. P. Thys. 1999. impact of infec-tious diseases specialists and microbiological data on the appropriateness of antimicrobial therapy for bacteremia. Clin infect Dis 29:60-6; discussion 67-8.
6. Deresinski, s. 2007. Principles of antibiotic therapy in severe infections: optimizing the therapeutic approach by use of laboratory and clinical data. Clin infect Dis 45 suppl 3:s177-83.
7. Doern, G. V., R. Vautour, M. Gaudet, and b. Levy. 1994. Clinical impact of rapid in vitro susceptibility testing and bacterial identification. J Clin Microbiol 32:1757-62.
8. Kerremans, J. J., W. H. Goessens, H. A. Verbrugh, and M. C. Vos. 2004. Accuracy of identification and susceptibility results by direct inoculation of Vitek 2 cards from positive bACTEC cultures. Eur J Clin Microbiol infect Dis 23:892-8.
9. Lehmann, L. E., K. P. Hunfeld, T. Emrich, G. Haberhausen, H. Wissing, A. Hoeft, and F. stuber. 2007. A multiplex real-time PCR assay for rapid detection and differentiation of 25 bacterial and fungal pathogens from whole blood samples. Med Microbiol immunol 197:313-24
10. Munson, E. L., D. J. Diekema, s. E. beekmann, K. C. Chapin, and G. V. Doern. 2003. Detection and treat-ment of bloodstream infection: laboratory reporting and antimicrobial management. J Clin Microbiol 41:495-7.
11. Riest, G., H. J. Linde, and P. M. shah. 1997. Comparison of bacT/Alert and bACTEC nR 860 blood culture systems in a laboratory not continuously staffed. Clin Microbiol infect 3:345-351.
12. sautter, R. L., A. R. bills, D. L. Lang, G. Ruschell, b. J. Heiter, and P. P. bourbeau. 2006. Effects of delayed-entry conditions on the recovery and detection of microorganisms from bacT/ALERT and bACTEC blood culture bottles. J Clin Microbiol 44:1245-9.
13. Valles, J., J. Rello, A. Ochagavia, J. Garnacho, and M. A. Alcala. 2003. Community-acquired bloodstream infection in critically ill adult patients: impact of shock and inappropriate antibiotic therapy on sur-vival. Chest 123:1615-24.

Chapter 9
Summary and concluding remarks

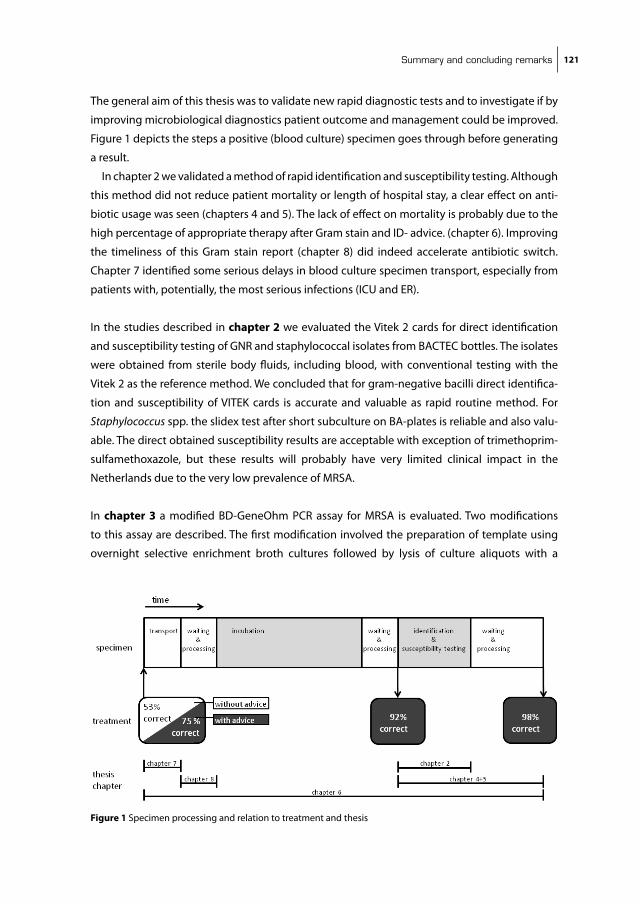
Summary and concluding remarks 121
The general aim of this thesis was to validate new rapid diagnostic tests and to investigate if by
improving microbiological diagnostics patient outcome and management could be improved.
Figure 1 depicts the steps a positive (blood culture) specimen goes through before generating
a result.
in chapter 2 we validated a method of rapid identification and susceptibility testing. Although
this method did not reduce patient mortality or length of hospital stay, a clear effect on anti-
biotic usage was seen (chapters 4 and 5). The lack of effect on mortality is probably due to the
high percentage of appropriate therapy after Gram stain and iD- advice. (chapter 6). improving
the timeliness of this Gram stain report (chapter 8) did indeed accelerate antibiotic switch.
Chapter 7 identified some serious delays in blood culture specimen transport, especially from
patients with, potentially, the most serious infections (iCU and ER).
in the studies described in chapter 2 we evaluated the Vitek 2 cards for direct identification
and susceptibility testing of GnR and staphylococcal isolates from bACTEC bottles. The isolates
were obtained from sterile body fluids, including blood, with conventional testing with the
Vitek 2 as the reference method. We concluded that for gram-negative bacilli direct identifica-
tion and susceptibility of ViTEK cards is accurate and valuable as rapid routine method. For
Staphylococcus spp. the slidex test after short subculture on bA-plates is reliable and also valu-
able. The direct obtained susceptibility results are acceptable with exception of trimethoprim-
sulfamethoxazole, but these results will probably have very limited clinical impact in the
netherlands due to the very low prevalence of MRsA.
in chapter 3 a modified bD-GeneOhm PCR assay for MRsA is evaluated. Two modifications
to this assay are described. The first modification involved the preparation of template using
overnight selective enrichment broth cultures followed by lysis of culture aliquots with a Hoofdstuk 9 fig 1
Figure 1 specimen processing and relation to treatment and thesis

cha
pter
9
122
commercial nucleic acid preparation kit. The second modification involved the use of pooled
broth-enrichment cultures for amplification. Performance characteristics of the test modifica-
tions were compared to selective enrichment broth culture for MRsA which was considered the
reference method. The modified procedure gives satisfactory results and the pooling of broths
may reduce costs. The influence of the reference method on the calculated performance of the
PCR assay was also assessed by comparing the studies initially using selective broth and direct
plating with those initially using direct plating. studies using direct plating overestimate the
sensitivity of the PCR assay by approximately 9%.
in chapter 4 and 5 different aspects of impact of rapid diagnostics are evaluated: patient
outcome, patient management and costs. A prospective randomized trial of rapid versus con-
ventional identification of pathogens in sterile body fluids was conducted. There was no effect
on mortality or hospital stay. The antibiotic therapy however was changed earlier as a result
allowing more directed therapy without affecting mortality. There was also a trend towards
reducing antibiotic cost with 27 euros per patient for a modest increase in cost for upgrading
the Vitek 1 to the Vitek 2 and direct inoculation of blood cultures (3 euros per blood culture).
in chapter 6 we performed a small observational cohort study of positive blood cultures
representing true infection, to ascertain which part of the culture results was most influential
on patient management, and how many infectious diseases were treated by correct empiri-
cal therapy. Patients with iD-consultations are more likely to receive microbiologically correct
empirical antibiotic therapy than patients without infectious disease consultations (75% versus
53%; p: 0.03). After Gram stain results became available, 92% of patients received microbiologi-
cally correct antibiotic therapy. After identification and susceptibility: 98%.
Chapter 7 describes a cohort study measuring transport times of blood cultures in a larger
sample and identified predictors for transport time. The median transport time was 3.5 h, with
47% of cultures exceeding the recommended 4 hours. Off-site location and type of clinical
specialty were the most important predictors of long transport times. Cultures from patients
in the emergency room or the intensive care units had the worst transport times. Cultures col-
lected during weekend days or on wards at the largest distances from the laboratory were also
associated with long transport times.
in chapter 8 we conducted a prospective randomized controlled clinical trial to assess the
impact of direct incubation of blood cultures delivered at the laboratory outside opening hours
on TAT, antibiotic prescription practices, and patient outcomes. The median time from speci-
men collection until growth detection was reduced with 10.1 h in the intervention arm (p value
<0.001). The median time until the first change was 42.8 h in the intervention arm and 64.0 h
in the control arm (p value: 0.024). Direct incubation of blood cultures outside opening hours

Summary and concluding remarks 123
reduces turnaround times and accelerates antibiotic switch. However no difference in length of
stay or hospital mortality was detected.
General discussion and concluding remarks
Microbiological diagnostics are generally considered to be important for patient care in sepsis.
There is numerous evidence from epidemiological studies (6) (5, 7, 9, 10) that appropriate
antimicrobial therapy has a positive impact on survival of patient with sepsis. To achieve appro-
priate therapy (blood) culture results can be helpful (2).
schonheyder and Hojberg (13) assessed the impact on antibiotic therapy of notification
of the Gram stain of 735 positive blood cultures in Denmark. The antibiotic coverage before
this result was appropriate in 418 episodes (60%), non-optimal in 90 (13%), and lacking in 186
(27%). The notification of positive blood cultures led to changes in antibiotic therapy in 315
episodes (45%), including commencement of antibiotic therapy in 127 (18%).
Munson et al. (11) analyzed antimicrobial use in clinically significant bloodstream infection to
assess the impact that microbiology laboratory reporting had on antimicrobial therapy. Most
therapy changes occurred at the time of phlebotomy and after notification of Gram stain results.
Release of antimicrobial susceptibility data had the least impact on antimicrobial management.
berild et al. (1) investigated if results of blood cultures led to changes in antibiotic use and
costs in a tertiary-care university hospital in norway. Antibiotic therapy was adjusted and
this adjustment led to a reduction in the number of antibiotics and a narrowing of antibiotic
therapy decreasing the antibiotics costs.
This is in line with the findings in our trials described in chapter 4 and 8 which showed that
reducing turn around time results in an earlier change in antibiotic therapy. Doern et al. (4) also
demonstrated a reduction in mortality, however in our setting we could not reproduce that
finding.
A lot of effort and money has been invested in developing and validating rapid techniques.
Most validations focus on technical performance and assay time. Although these are essential
in evaluating a new test, actual turnaround time in real life conditions should also be measured.
Figure 1 depicts the steps through which a blood culture specimen goes through before gen-
erating a result. The scale is an estimated relative time scale of the different steps. (Estimation is
based on the studies performed in chapter 4 and 8.) Approximately 40-50% of time needed is
used for transport, waiting and processing of the specimen (the clear boxes). This is mainly due
to the fact that the laboratory is closed most of the time (>60%).
Another important factor is what time frame is needed. The surviving sepsis campaign (3)
emphasizes that empirical treatment should be started within the hour after presentation in a
patient with severe sepsis. in some patient populations 24-48 h of inadequate therapy didn’t
seem to result in a negative outcome (8, 12).
To influence empiric therapy, result of this test should therefore be available within this first
hour. There are few diagnostic tests available with an assay time compatible with this goal (e.g.
cha
pter
9
124
Legionella and pneumococcal antigen test). Therefore broad spectrum antibiotics are started,
directed at the likely pathogens based on the clinical syndrome.
Although at presentation microbiology is less helpful than for example clinical chemistry and
radiology in aiding the clinician, it can improve patient outcome by establishing a diagnosis in
patients not empirically treated (clinically stable, less severe presentation or missed diagnosis)
and by correcting inadequate empiric therapy. it can also improve patient management by
allowing for the streamlining of the broad-spectrum antibiotics to more effective, less toxic
smaller spectrum drugs.
impact of logistics factors should be taken into account when developing a test. (3) Tests
that can be initiated continuously (e.g. blood culture incubation, automated susceptibility test-
ing) could have an advantage over tests that are run in batches (most real time PCR, serology).
However results of PCR tests can be reported in a predictable time frame and do not rely on
growth characteristics of the organism as culture based methods do.
For most present day PCR tests performing nucleic-acid extraction and amplification within
one hour for is not feasible. but perhaps labs-on-chip could achieve this in the future. Due to
the logistics problems mentioned above point of care test seem to be a logical step. However,
if untrained, non-laboratory, personnel have to perform these tests, this tests should be simple
to execute.
important to know is when clinicians expect and utilize test results, because although infec-
tions do not occur preferentially during office hours, there are much more doctors available in
these times to recognize and treat them. Results before or after morning rounds could also have
different impact on patient management, much larger than expected by the time difference.
For now, applying a combined approach of direct incubation and direct identification and
susceptibility testing with rapid transport and longer opening hours should result in turn
around time of 24-48 hours for most pathogens from blood cultures at very limited extra costs.
Summary and concluding remarks 125
referenceS
1. berild, D., A. Mohseni, L. M. Diep, M. Jensenius, and s. H. Ringertz. 2006. Adjustment of antibiotic treatment according to the results of blood cultures leads to decreased antibiotic use and costs. J Antimicrob Chemother 57:326-30.
2. Cunha, b. A. 2004. Empiric antimicrobial therapy for bacteremia: get it right from the start or get a call from infectious disease. Clin infect Dis 39:1170-3.
3. Dellinger, R. P., M. M. Levy, J. M. Carlet, J. bion, M. M. Parker, R. Jaeschke, K. Reinhart, D. C. Angus, C. brun-buisson, R. beale, T. Calandra, J. F. Dhainaut, H. Gerlach, M. Harvey, J. J. Marini, J. Marshall, M. Ranieri, G. Ramsay, J. sevransky, b. T. Thompson, s. Townsend, J. s. Vender, J. L. Zimmerman, and J. L. Vincent. 2008. surviving sepsis Campaign: international guidelines for management of severe sepsis and septic shock: 2008. Crit Care Med 36:296-327.
4. Doern, G. V., R. Vautour, M. Gaudet, and b. Levy. 1994. Clinical impact of rapid in vitro susceptibility testing and bacterial identification. J Clin Microbiol 32:1757-62.
5. Garnacho-Montero, J., J. L. Garcia-Garmendia, A. barrero-Almodovar, F. J. Jimenez-Jimenez, C. Perez-Paredes, and C. Ortiz-Leyba. 2003. impact of adequate empirical antibiotic therapy on the outcome of patients admitted to the intensive care unit with sepsis. Crit Care Med 31:2742-51.
6. Hanon, F. X., D. L. Monnet, T. L. sorensen, K. Molbak, G. Pedersen, and H. schonheyder. 2002. survival of patients with bacteraemia in relation to initial empirical antimicrobial treatment. scand J infect Dis 34:520-8.
7. Kang, C. i., s. H. Kim, W. b. Park, K. D. Lee, H. b. Kim, E. C. Kim, M. D. Oh, and K. W. Choe. 2005. blood-stream infections caused by antibiotic-resistant gram-negative bacilli: risk factors for mortality and impact of inappropriate initial antimicrobial therapy on outcome. Antimicrob Agents Chemother 49:760-6.
8. Kim, s. H., W. b. Park, C. s. Lee, C. i. Kang, J. W. bang, H. b. Kim, n. J. Kim, E. C. Kim, M. D. Oh, and K. W. Choe. 2006. Outcome of inappropriate empirical antibiotic therapy in patients with staphylococcus aureus bacteraemia: analytical strategy using propensity scores. Clin Microbiol infect 12:13-21.
9. Leibovici, L., i. shraga, M. Drucker, H. Konigsberger, Z. samra, and s. D. Pitlik. 1998. The benefit of appropriate empirical antibiotic treatment in patients with bloodstream infection. J intern Med 244:379-86.
10. Leone, M., A. bourgoin, s. Cambon, M. Dubuc, J. Albanese, and C. Martin. 2003. Empirical antimicrobial therapy of septic shock patients: adequacy and impact on the outcome. Crit Care Med 31:462-7.
11. Munson, E. L., D. J. Diekema, s. E. beekmann, K. C. Chapin, and G. V. Doern. 2003. Detection and treat-ment of bloodstream infection: laboratory reporting and antimicrobial management. J Clin Microbiol 41:495-7.
12. scarsi, K. K., J. M. Feinglass, M. H. scheetz, M. J. Postelnick, M. K. bolon, and G. A. noskin. 2006. impact of inactive empiric antimicrobial therapy on inpatient mortality and length of stay. Antimicrob Agents Chemother 50:3355-60.
13. schonheyder, H. C., and T. Hojbjerg. 1995. The impact of the first notification of positive blood cultures on antibiotic therapy. A one-year survey. APMis 103:37-44.

Samenvatting en conclusie 127
SAmenVAttinG en concLuSie
Dit laatste, nederlandstalige hoofdstuk geeft een korte uitleg van achtergronden en begrippen.
Het is een beknopte weergave van hoofdstuk 9 waarin de wetenschappelijke samenvatting en
enkele slotbeschouwingen staan.
Sepsis (bloedvergiftiging) is een algemene ontstekingsreactie van het lichaam op een
infectie. Deze ontstekingsreactie wordt gekenmerkt door koorts, een versnelde hartslag
en in ernstige gevallen een daling van de bloeddruk (septische shock). Het is een ernstige
aandoening met een grote kans dat de patiënt hieraan overlijdt, zeker indien hij niet snel en
goed behandeld wordt. De meeste gevallen van sepsis worden veroorzaakt door een infectie
met bacteriën maar ook infecties met virussen, parasieten, gisten en schimmels kunnen een
dergelijke reactie veroorzaken (siRs: systemic inflammatory respons syndrome genaamd).
De behandeling van sepsis bestaat uit bestrijden van de te lage bloedruk en zuurstoftekor-
ten van de patiënt; het aanpakken van de oorzaak van de infectie en het geven van antibiotica
(middelen die de groei van bacteriën remmen).
Om een sepsis optimaal te behandelen is het belangrijk om te achterhalen welk micro-
organisme de infectie veroorzaakt. in veel gevallen van sepsis gaat de infectie gepaard met
de aanwezigheid van bacteriën in de bloedbaan (bacteriëmie). Daarom is de afname van
bloedkweken belangrijk. na afname van een hoeveelheid bloed (bij volwassenen circa 20 ml)
wordt dit in twee flesjes met een vloeibare kweekbouillon gespoten. Deze bouillon bevordert
de groei van bacteriën en bevat stoffen om bacteriedodende bestanddelen te neutraliseren.
Hierna worden deze flesjes in een speciale kast (broedstoof) geplaatst. Deze kast zorgt voor
optimale groeiomstandigheden in de flesjes door ze op lichaamstemperatuur te houden en
ze te zwenken. Wanneer bacteriën groeien, produceren zij koolzuurgas (C02.) net als mensen.
Daarom is de broedstoof ook uitgerust met sensoren die het C02 gehalte van de flesjes meten.
indien er toename van C02 te zien is, geeft de stoof een signaal, zodat het betreffende bloed-
kweekflesje verder verwerkt kan worden.
nadat een dergelijk positief flesje door de analist uit de stoof gehaald is, haalt zij wat vloeistof
uit het flesje en doet een druppel op een klein glazen plaatje. Deze druppel wordt vervolgens
met meerdere vloeistoffen gekleurd (de kleuring volgens Gram, het Grampreparaat). De
Gramkleuring zorgt ervoor dat de bacteriën zichtbaar worden onder de microscoop en geeft
ook een eerste idee met wat voor soort bacterie men te maken heeft. Een arts-microbioloog
kan hierdoor vaak al een goede inschatting maken welke behandeling effectief zal zijn. na deze
eerste indicatie over de identiteit van de verwekker volgen er nog aanvullende tests. Op basis
van een combinatie van chemische reacties kan de exacte identiteit van een bacterie worden
vastgesteld. Ook wordt gekeken welke antibiotica gebruikt kunnen worden voor de behande-
ling van de patiënt middels een gevoeligheidsbepaling (resistentiespectrum). Hiervoor wordt
gekeken of de bacteriën groeien in de aanwezigheid van antibiotica. Als de bacterie gewoon
doorgroeit in de aanwezigheid van het antibioticum, noemen we de bacterie resistent voor
cha
pter
9
128
dat antibioticum. Dat middel kan/kon achteraf dus niet gebruikt worden voor de behandeling
van de patiënt. indien de bacterie niet kan groeien in de aanwezigheid van een antibioticum
noemen we de bacterie gevoelig voor dat antibioticum. indien dat middel, in voldoende con-
centratie, op de plaats van infectie kan komen, is het een geschikt middel voor de behandeling.
Voordat al deze gegevens bekend zijn, zijn er enkele dagen verlopen. Zo lang kan de behan-
deling uiteraard niet wachten. De behandelend arts zal dus zonder deze informatie (“blind”)
een behandeling met antibiotica moeten starten; zo snel mogelijk daarna wil hij/zij “gericht”
behandelen.
De “overleef een sepsis”-campagne benadrukt dat empirische (=blinde) therapie gestart zou
moeten worden binnen een uur nadat een patiënt tekenen vertoont van een ernstige sepsis.
Om de empirische therapie te beïnvloeden, zouden de testresultaten daarom binnen het
eerste uur al beschikbaar moeten zijn. Er zijn weinig tests beschikbaar die aan deze eis kun-
nen voldoen. Daarom wordt gestart met breedspectrum-antibiotica, die gericht zijn tegen alle
waarschijnlijke ziekteverwekkers passend bij het klinisch syndroom van de patiënt.
Microbiologische diagnostiek kan wel gebruikt worden om de behandelresultaten te
verbeteren door het vaststellen van een diagnose bij patiënten die niet empirisch worden
behandeld (als de ziekte zich minder ernstig manifesteert, of als de diagnose is gemist) en door
het corrigeren van inadequate/minder geschikte empirische therapie. Het kan bovendien de
behandeling verbeteren doordat het bijstellen van de antibiotische therapie mogelijk maakt:
het overstappen van breedspectrum-antibiotica naar effectievere smalspectrum-middelen
met minder bijwerkingen.
bij het ontwikkelen van tests zou rekening gehouden moeten worden met logistieke
beperkingen; ook is het belangrijk om te weten wanneer artsen testuitslagen verwachten en
gebruiken, want hoewel infectieziekten niet bij voorkeur tijdens gewone werktijden ontstaan,
zijn er op die tijdstippen wel veel meer artsen aanwezig om de ziektes te herkennen en te
behandelen. Ook of resultaten vóór dan wel na de ochtendvisite beschikbaar komen, zou
een invloed kunnen hebben op de behandeling van de patiënten die veel groter is dan je zou
verwachten op grond van een paar uurtjes tijdsverschil.
Het doel van dit proefschrift was het uittesten van nieuwe sneldiagnostiekmethodes en het
onderzoeken of versnellen van microbiologische diagnostiek ook betere behandelresultaten
zou opleveren.
in hoofdstuk 2 is te lezen hoe we testen hebben gevalideerd om sneller de identificatie en
gevoeligheid van bacteriën uit de bloedbaan te bepalen door bacteriën zowel met de reguliere
als met de snelle methode te testen. Deze sneltesten leverden betrouwbare resultaten op en
waren veel sneller beschikbaar.
in hoofdstuk 3 is een snelle test voor de identificatie van MRsA (Methicilline resistente
Staphylococcus aureus)-bacteriën onderzocht. De resultaten verkregen met deze aange-
paste testmethode werden vergeleken met de standaardmethode: een gewone selectieve
Samenvatting en conclusie 129
verrijkingsbouillon voor het kweken van de MRsA-bacteriën. De aangepaste werkwijze geeft
goede resultaten, en is beduidend sneller.
in hoofdstukken 4 en 5 werd gekeken wat voor invloed de in hoofdstuk 2 gevalideerde
methoden van sneldiagnostiek hadden op het overleven van patiënten, het beloop van de
behandeling en op de kosten. Er werd een prospectieve gerandomiseerde trial uitgevoerd
waarin sneldiagnostiek werd vergeleken met de standaarddiagnostiekmethode. De patiënten
werden willekeurig in de twee groepen verdeeld, zodat de groepen onderlinge te vergelijken
waren. De resultaten waren bijna een dag eerder beschikbaar in de snelle groep, maar er was
geen effect op mortaliteit of op opnameduur. Wel werd de antibiotische therapie sneller aan-
gepast, zodat de optimale therapie werd gegeven. Er was geen effect op de totale kosten per
patiënt. Wel werd er iets minder geld uit gegeven aan antibiotica in de snelle groep (27 euro per
persoon), sneldiagnostiek was echter duurder dan de standaarddiagnostiek (3 euro per test).
in hoofdstuk 6 hebben we een kleine beschrijvende studie bij patiënten met een bloed-
baaninfectie uitgevoerd. Hieruit bleek dat patiënten bij wie de behandelend arts advies had
gevraagd aan een arts-microbioloog of infectioloog voor de blinde therapie (voordat er uitsla-
gen van kweken bekend zijn) achteraf vaker goed behandeld waren (75% versus 53%). nadat
resultaten van de Gramkleuring (altijd met advies) bekend werden, kreeg 92% van de patiënten
de goede antibiotica. En na identificatie van de ziekteverwekker en gevoeligheidsbepaling
steeg dit verder tot 98%.
in hoofdstuk 7 hebben we gemeten hoe lang bloedkweekflesjes onderweg zijn naar het
laboratorium. Meer dan 47% van de kweekflesjes deed er langer over dan de voorgeschreven 4
uur. Deze transportduur verschilde per specialisme en locatie van de afdeling. Zo deden bloed-
kweekflesjes van een elders in de stad gelegen kliniek er ruim 14 uur over. bloedkweekflesjes
afgenomen op de Eerste Hulp-afdeling (3 minuten lopen naar het lab) deden er echter het
langst over: 16 uur.
in hoofdstuk 8 werd middels een gerandomiseerd onderzoek gekeken wat het effect was
van het ’s nachts in de broedstoof zetten van bloedkweekflesjes i.p.v. deze bij kamertempera-
tuur te laten staan. Het direct in de stoof zetten leverde een tijdswinst op van bijna een halve
dag. Ook werden de antibiotica bij de patiënten, indien nodig, eerder aangepast. Maar er werd
tussen de twee groepen weer geen verschil in (de erg grove eindpunten) opnameduur of
mortaliteit tijdens ziekenhuisopname vastgesteld.
conclusie
bij de behandeling van mensen met sepsis wordt veel waarde gehecht aan microbiologische
diagnostiek naar de verwekker. Er is veel bewijs uit epidemiologisch onderzoek dat snelle
behandeling met geschikte antibiotica (=antibiotica waarvoor de verwekker gevoelig is) een
positief effect heeft op de overlevingskansen van septische patiënten. De resultaten van
(bloed)kweekonderzoek dragen hiertoe bij.
cha
pter
9
130
Een grote hoeveelheid moeite en geld zijn geïnvesteerd in het ontwikkelen en valideren van
sneldiagnostiek-technieken. De meeste validatiestudies focussen op technische prestaties van
de test in het laboratorium zelf en op hoe lang het duurt om de test (zelf ) uit te voeren. Hoewel
die twee dingen essentieel zijn bij het evalueren van nieuwe testmethodes, zou je ook de
daadwerkelijke tijdsduur om tot een resultaat te komen, in de echte klinische situatie, moeten
meten. namelijk 40-50% van de benodigde tijd wordt in beslag genomen door transport en
wachttijd! Dit heeft voornamelijk te maken met het feit dat het laboratorium het grootste deel
van de dag (>60%) gesloten is en georganiseerd transport van bloedkweekflesjes naar dat
laboratorium maar enkele keren per dag gebeurt.
Ook met de huidige gebruikte diagnostiek zouden microbiologische laboratoria voor de
meeste verwekkers van bacteriëmie de uitslagen na 24-48 uur beschikbaar moeten hebben. Dit
vereist geen grote investeringen maar het optimaliseren van de huidige middelen en logistiek:
een combinatie van directe incubatie en directe identificatie en gevoeligheidsbepaling, met
daarbij een snel transport van de monsters en langere openingstijden van het laboratorium.

dankwoord 131
dAnKWoord
Zonder de bijdrage van veel mensen zou dit proefschrift niet tot stand gekomen zijn. Hoewel
het niet mogelijk is iedereen persoonlijk te bedanken, wil ik toch een aantal personen met
name noemen.
Ten eerste wil ik de analisten van het routinelab van het Erasmus MC bedanken. Ondanks
het feit dat jullie “geen research analisten waren”, hebben jullie met veel enthousiasme mee-
gewerkt aan het onderzoek. Zonder jullie inzet was het onderzoek zeker mislukt. nog speciale
dank voor Arjen. Dank zij jouw bereidheid om ook ’s avonds uitslagen op te vragen, bleven er
nog avonden over voor restaurant-, theater- en bioscoopbezoek.
Verder wil ik natuurlijk dr. Greet Vos, mijn copromotor en mijn promotor prof. dr. Henri
Verbrugh bedanken. Greet, de afgelopen jaren hebben we productief samengewerkt. Jouw
resultaatgerichtheid en positievere instelling hebben me vaak verder geholpen. Henri, ik heb
veel geleerd van uw kritische blik en vermogen hoofd- van bijzaken te onderscheiden en
natuurlijk van uw voorliefde voor de mediaan.
De overgebleven leden van de RAPiD-studiegroep moeten zeker niet vergeten worden: dr.
Wil Goessens, prof. dr. Theo stijnen en dr. Leona Hakkaart-van Roijen. Wil, ik heb veel geleerd
van jouw kennis van de microbiologie in het algemeen en resistentiebepalingen in het bijzon-
der. Theo en Leona, bedankt voor de onmisbare statistische en economisch ondersteuning. Dr.
Akke van der bij, bedankt voor de epidemiologische analyses.
Christien, Liselotte, Manju, Mascha en nazli, bedankt voor jullie hulp bij het invoeren van de
data uit de patiëntenstatussen. Mogelijk hebben jullie in jullie latere carrière nog baat gehad bij
deze cursus artsenhandschrift ontcijferen, maar in ieder geval bedankt voor jullie bijdrage aan
de totstandkoming van dit proefschrift.
Uiteraard bedankt iedereen zijn ouders. in mijn geval hebben jullie meer dan morele steun
verleend. nadat de enige echte clinicus geroepen werd tot een ander ambt, heb jij, vader, mij
voorzien van inzichten vanuit de praktijk. Ook jouw redactioneel commentaar op verschillende
artikelen en het uiteindelijk manuscript was zeer bruikbaar en tijdig.
Verder natuurlijk ook alle (oud) arts-assistenten van de afdeling Medische Microbiologie.
samen beleef je de ups and downs van een promotietraject en opleiding. bedankt voor jullie
luisterend oor, goede raad en de gezelligheid tijdens het gezamenlijk nuttigen van alcoholische
versnaperingen (uiteraard na werktijd). speciale dank voor Damian omdat hij mijn paranimf
wilde zijn.
Een goede werksfeer is belangrijk, maar vriendschap buiten het vak (of beter gezegd buiten
het vakgebied) mogelijk nog meer. Dus daarom wil ik ook mijn vrienden bedanken voor alle
intellectuele stimulering, goede wijnen en maaltijden, ontspannende vakanties, ondersteu-
ning en meeleven. Mogelijk heeft de gecombineerde druk van promotie en opleiding / werk
de frequentie van het contact wat doen verwateren. Daarom ik wil van deze ruimte gebruik-

cha
pter
9
132
maken om mijn excuses aan te bieden voor alle verlate kraamvisites, vergeten verjaardagen en
dergelijke. Vanaf nu zal ik mijn leven beteren! Michiel, bedankt dat je mijn paranimf wilde zijn.
Etel, Henk en Martin: bedankt voor jullie geduld toen bleek dat een bijna afgerond promotie-
onderzoek toch nog bijna 2 jaar zou gaan duren.
Lieve irene, dank voor al je ondersteuning en geduld, als ik weer tijdens vakanties week-
enden en avonden achter de laptop moest. bovendien heb je, toen ik al bijna mijn laptop in
het Merwedekanaal wilde gooien, de opmaak van het bestand overgenomen en onderwijl ook
nog wat spelfouten verbeterd! Tevens ben je de allerliefste. Hopelijk kunnen we nu wat meer
tijd samen doorbrengen: reizend of gewoon op de bank.
curriculum Vitae 133
curricuLum VitAe
Jos Kerremans werd op 20 juni 1975 geboren te nijmegen.
na eerst in nijmegen, Rochester (Minnesota) en Helmond de lagere school doorlopen te
hebben, behaalde hij zijn gymnasiumdiploma aan het Carolus borromeus College te Helmond
in 1993.
in dat jaar begon hij ook aan de studie geneeskunde aan de medische faculteit van de
Universiteit van nijmegen. naast zijn studie was hij lid van de faculteitsraad van de Faculteit
der Medische Wetenschappen en van de universiteitsraad namens de progressieve studenten-
fractie. Tevens was hij een onverdienstelijke roeier bij Phocas.
Zijn wetenschappelijke stage deed hij bij de afdeling Medische Microbiologie van het UMC
st. Radboud bij Dr. Paul Verweij naar de aanwezigheid van Aspergillus in tabak en marihuana.
na het behalen van zijn artsexamen in april 2000 heeft hij eerst enkele maanden als Agnio
interne geneeskunde gewerkt in het Lorentz ziekenhuis te Zeist, alvorens in september 2000
te beginnen aan dit promotieonderzoek (promotor: Prof. Dr. Henri Verbrugh). september 2002
begon hij aan de opleiding tot arts-microbioloog aan de afdeling Medische Microbiologie en
infectieziekten van het Erasmus MC te Rotterdam (opleider: Prof. Dr. Henri Verbrugh, later Dr.
Hubert Endtz), welke hij in 2007 afrondde.
Momenteel is hij werkzaam als arts-microbioloog in het Diaconessenhuis te Leiden en het
bronovo ziekenhuis te Den Haag. Hij woont samen met irene Jaquet.

Publicaties 135
PuBLicAtieS
Verweij PE, Kerremans JJ, Voss A, Meis JF. Fungal contamination of tobacco and marijuana.
JAMA 2000; 284:2875.
Kerremans JJ, Goessens WH, Verbrugh HA, Vos MC. Accuracy of identification and susceptibility
results by direct inoculation of Vitek 2 cards from positive bACTEC cultures. Eur J Clin Microbiol
infect Dis 2004; 23:892-8.
Kerremans JJ, Goessens WH, Verbrugh HA, Vos MC. Rapid identification of staphyloccocus
aureus in positive-testing blood cultures by slidex staph Plus agglutination test. J Clin Micro-
biol. 2008 Jan;46(1):395.
Kerremans JJ, Verboom P, stijnen T, Hakkaart–van Roijen L, Goessens WH, Verbrugh HA, Vos MC.
Rapid bacterial identification and antimicrobial susceptibility testing decrease antibiotic use
and accelerate pathogen directed antibiotic use J Antimicrob Chemother. 2008 Feb;61(2):428-
35.
Kerremans JJ. improvement of public health in London in the nineteenth century and the prob-
ably limited role of the new sewage system ned Tijdschr Geneeskd. 2008 Apr 5;152(14):846.
Kerremans JJ, Maaskant J, Verbrugh HA, van Leeuwen Wb, Vos MC. Detection of methicillin-
resistant staphylococcus aureus in a low-prevalence setting by polymerase chain reaction with
a selective enrichment broth. Diagn Microbiol infect Dis. 2008 Aug;61(4):396-401.
böcher s, smyth R, Kahlmeter G, Kerremans J, Vos MC, skov R. Evaluation of four selective agars
and two enrichment broths in screening for methicillin-resistant staphylococcus aureus. J Clin
Microbiol. 2008 sep;46(9):3136-8.
Kerremans JJ, van der bij AK, Goessens W, Verbrugh HA, Vos MC. needle to incubator time:
logistic factors influencing transport time of blood culture specimens..
J Clin Microbiol. 2009 Mar;47(3):819-22.
Kerremans JJ, van der bij AK, Goessens W, Verbrugh HA, Vos MC. immediate incubation of blood
cultures outside routine opening hours accelerates antibiotic switch. J Clin Microbiol. 2009 Aug
26. [Epub ahead of print]