Embed Size (px)
Citation preview

2
Rapid Assessment of the Impact of the Global Financial Crisis in Bangladesh May, 2009 Prepared by Issa Sanogo, Programme Adviser, Market specialist WFP Food Security Analysis Service © World Food Programme, VAM Food Security Analysis For any queries on this document, please contact [email protected] For information about the Food Security Analysis/VAM, please visit: www.wfp.org/food-security United Nations World Food Programme Headquarters: Via C.G. Viola 68, Parco de’ Medici, 00148, Rome, Italy For questions or comments concerning any aspect of this report please contact: WFP Rome [email protected] WFP Bangladesh John Aylieff, WFP Country Director: john.aylieff @wfp.org

3
Table of Content
Abbreviations and Acronyms ........................................................................................................................................ 4 Acknowledgements ....................................................................................................................................................... 5 Executive Brief .............................................................................................................................................................. 6 Ongoing Responses and Recommendations ............................................................................................................... 7 1- Background and Objectives ...................................................................................................................................... 9
1.1. The Legacy of the High Food Prices.................................................................................................................................................9 1.2. Objectives of the Case Study...........................................................................................................................................................10
2- Methodology and Limitations .................................................................................................................................10 2.1. Data Collection, Collation and Review...........................................................................................................................................10 2.2. Limitations...................................................................................................................................................................................11
3- Macro-Economic Performance and Impact of the Global Financial Crisis ........................................................... 11 3.1. Recent Economic Developments......................................................................................................................................................11 3.1.1 GDP Growth Performance..........................................................................................................................................................11 3.1.2 Inflation Patterns ........................................................................................................................................................................11 3.1.3 Performance of the Financial Sector..............................................................................................................................................12 3.1.4 Fiscal Performance ......................................................................................................................................................................12 3.1.5 Performance of the Capital Market..............................................................................................................................................13 3.2. Degree of Exposure to the Effects of the Global Financial Crisis ....................................................................................................13 3.3. Transmission Channels and Macro-Impacts ...................................................................................................................................15 3.3.1 High Remittance Inflows with Decelerating Outmigration .............................................................................................................15 3.3.2 Declining Trade Performance: Garment and Agricultural Exports and Imports............................................................................15 3.3.3 Slowdown of Foreign Capital Flows: Aid and Foreign Direct Investment......................................................................................17 3.3.4 Implications for Foreign Reserves and Exchange Rates .................................................................................................................18
4- Perceived Impacts at Household Level ...................................................................................................................19 4.1. Impacts on Livelihoods and Incomes...............................................................................................................................................19 4.2. Impacts on Employment and Wages ..............................................................................................................................................22 4.3. Impacts on Remittances and Migration ..........................................................................................................................................22 4.4. Recent Food Price, Expenditures and Consumption Patterns ..........................................................................................................24 4.4.1 Perceived Food Price Changes ......................................................................................................................................................24 4.4.2 Perceived Recent Expenditure and Consumption Changes.............................................................................................................24 4.5. Coping Strategies and Priority Needs .............................................................................................................................................25
5- Perspectives and Ongoing Interventions ................................................................................................................26 5.1. Future Outlook and Scenario ........................................................................................................................................................26 5.2. Ongoing Interventions of the Government........................................................................................................................................27
6- Conclusions and Recommendations .......................................................................................................................28 References ....................................................................................................................................................................29 Annexes.........................................................................................................................................................................30
Annex 1. List of Key Informants Met during the Mission .....................................................................................................................31 Annex 2. Sample Sites for FGD .........................................................................................................................................................32 Annex 3. Selected Key Macroeconomic Performance Indicators in Bangladesh .........................................................................................33 Annex 4. Checklist for Focus Group Discussion...................................................................................................................................34

4
Abbreviations and Acronyms
ADB Asian Development Bank ADP Annual Development Program BB Bank of Bangladesh BBS Bangladesh Bureau of Statistics BIDS Bangladesh Institute of Development Studies BMET Bureau of Manpower Employment and Training BRAC Bangladesh Rural Advancement Committee CPD Centre for Policy Dialogue DFID UK Department for International Development DSE Dhaka Stock Exchange EU European Union FAO Food and Agriculture Organization FDI Foreign Direct Investment GDP Gross Domestic Product IMF International Monetary Fund IPHN Institute of Public Health and Nutrition IRS Interest Rate Spread LDC Least Developed Countries NGO Non Government Organizations NPL Non-Performing Loans NSD National Savings Directorate ODA Official Development Assistance OMS Open Market Sale RMG Ready-Made Garment UD Utilization Declaration UNICEF United Nations Children's Fund US United States USITC United States International Trade Commission VAM WFP Vulnerability Analysis and Mapping WB World Bank WFP World Food Programme
5
Acknowledgements
I would like to thank the key informants who spared their time enlightening me about the outlook and the perspectives of the impacts of the global financial crisis in Bangladesh. I wish to thank Dr. M. Habibur Rahman for his great support in reviewing the macro-economic data. I am also extremely grateful to MITRA & Associates and their enumerators for leading focus group discussions in the field and compiling the household level information.
This case study would not have possible without the extremely effective (human and logistic) resources provided by WFP country office in Bangladesh. I would like to thank the country office management, in particular John Aylieff (Country Director), Michael Dunford (Deputy Country Director) and John McHarris for their support and interest in the case study. A special thank goes also to the country office vulnerability and mapping (VAM) staff, namely Nusha Choudhury, Malik Kabir and Md. Mahabubul Alam who invested a great deal of their time supporting the field work.
I gratefully acknowledge helpful comments received from Joyce Luma (Chief, OMXF) and Agnes Dhur. Finally, I would like to extend my acknowledgements to Cinzia Papavero, Wael Attia, Caroline Chaumont and Mark Bennett for valuable editorial inputs to the report.
I am solely responsible for any remaining errors.

6
Executive Brief
Overview
The People's Republic of Bangladesh is home to more than 150 million people concentrated on 144,000 sq Km. Over 40% of the population are children. Three-quarters of Bangladeshis live in rural areas. The country sits on the world’s largest delta formed by Ganges, Brahmaputra and Meghna rivers, making it extremely vulnerable to floods, and cyclones.
The global financial crisis is another challenge that is testing the resilience of Bangladeshi people to recent adversities such as the Cyclone Sidr in 2007 and the global food price crisis in 2008. Evidence shows that the food price crisis has sent a substantial number of households back to poverty, after a decade of progress. The global financial crisis could compound this situation through macro-economic pass-through channels such as remittances, exports of ready-made garment and other agricultural exports (e.g. shrimp, jute and tea).
This case study is part of a series of WFP country case studies to elicit how the global financial crisis is manifested in Bangladesh at macro-economic level as well as how the macro-level impacts are manifested on households’ living conditions1. Rapid qualitative information was collected from March 22 to April 4, 2009 through 40 focus group discussions. This case study aims at completing the findings of a nation-wide representative household survey jointly undertaken by WFP, UNICEF and the Government in November-December 2008, to assess the impacts of the global food price crisis on households’ food security and nutrition. Recent Developments
In the past decade, Bangladesh has made impressive economic and social progress towards achieving some of the Millennium Development Goals (MDGs), despite repeated natural disasters and external shocks. Bangladesh has met the MDGs for gender parity in education and has made impressive progress towards achieving universal primary enrolment. According to the Bangladesh MDG mid-term report of 2007, the net enrolment ratio in primary education was 87%. The average GDP growth over the last six years was over 6%. Although poverty fell from 57% of the population in 1990 to 40% in 2005, challenges remain in eradicating extreme hunger and malnutrition.
Indeed, recently, the global food and fuel price crisis in 2008 and the Cyclone Sidr in 2007 have tested the resilience of the Bangladeshi people. A nation wide survey conducted by WFP, UNICEF and the government in December 2008 to assess the impact of high food prices on the population revealed significant food insecurity (one in four Bangladeshi) and increased severe (stunting, underweight and wasting) malnutrition rates.
The global financial crisis could compound this situation. The economy is indeed increasingly exposed to global shocks as a result of increased openness to the global economy. The contribution of trade (export and import) increased significantly since 2001 from 33.4% of the gross domestic product (GDP) to 43.4% in 2008. Macro-Economic Effects of the Global Financial Crisis
Bangladesh is affected by the global financial crisis through the reduction of remittances, migration, ready-made garments and agricultural exports (shrimp and tea). The economy is heavily dependent on migrants’ earnings in the Gulf countries and Western countries. Bangladesh is in the fifth position among the top remittance recipient countries in the world. The contribution of remittances more than doubled from 4% in 2001 to 10% of GDP in 2008. Exports take up 20% of the GDP. Exports of ready-made garments (RMG) represent 80% share of total exports. Almost half of the exports go to the Europe, while 25% goes to the United States.
The volume of trade decelerated by 5.3% between July-December 2008 against an increase of 3.4% during the same period in 20072. A further decrease of 7.1% was observed in January 2009, compared to January 2008. Export orders of RMG fell by 5% in January and 17.6% in February 2009, with lagged effects on actual RMG exports expected 3-4 months later. Fish exports decreased by 16% on average in July-December 2008 compared to July-December 2007. Jute exports also decreased by 17% over the same period and by 19.8% in January 2009 compared to January 2008.
Migration decreased by 40% in January-March 2009 compared to the same period in 2008. Cancellation of 55,000 work visas to Malaysia in March 2009 is adding to concerns about the increasing number of deportees, which nearly doubled to 8,000 in February 2009. Although remittances are still high at trend levels, there are signs of deceleration since February 2009, with a drop of remittance flows by 8.7% compared to January.
1 The case studies include Armenia, Nicaragua, Ghana, Bangladesh and Zambia. 2 The volume of trade is proxied by export and import cargo handled in the port of Chittagong.

7
Preliminary Effects at Household Level
The economic down-swing is affecting households’ livelihoods. Households seek additional work opportunities, mainly casual labour due to low purchasing power and reduced job opportunities, particularly in shrimp-hatcheries, garment factories and tea estates.
The most frequently reported estimate of job losses is 10%. On this basis, 300,000 new unemployed people have most likely been released onto the job market in the last 6 months. The livelihoods of 1.09 million individuals could be at stake, with subsequent risks to health care, food intake, education, debt and other vital services.
Focus groups reported a significant decline in incomes, as a result of the fall in foreign currencies (dollar and pound), commodity prices, reduced casual labour opportunities and job losses in foreign countries. Women more frequently rely on remittances. A significant decline in production and prices has led to a decrease in unskilled wage rates in the fish/shrimp processing hatcheries and garment factories. The amount and frequency of remittances decreased in the last 6 months due to job cuts abroad, foreign currency depreciation and high expenses of migrants in host countries.
With the recent decline of food prices, the share of household’s budget spent on food has decreased to 62% in December 2008 and 57% in March 2009. However, the food budget share is still higher than in 2005 (52%). The share of education and health expenses increased (from 6 to 7.2% and from 4.4 to 5.2%, respectively) - not only as a result of the decrease of the share of food expenditure, but also because of other costs related to education (materials and transport) and health (reduction of health services in tea estates, medicines and fees). Indebtedness remains high, absorbing 10% of households’ expenditure.
Households are adopting various coping strategies. Most commonly households are reducing the number of meals and diversifying their income activities in order to bring in more revenue. Income diversification could lead to child labour or less care provided by mothers to children. Based on the discussions, the main priority needs of households are: 1) access to employment generation activities; 2) financial support; and 3) price cuts in basic needs to mitigate the cumulative impacts of the global food and financial crises. Future Outlook
The economy is feeling the impact of the ongoing financial crisis and significant downside risks exist in the coming months. Projections by international financial organisations converge on the fact that GDP growth will be lower (ranging from 4.5 to 6.0%) than the 6.5% initially projected for the fiscal year (July 2008-June 2009). Growth is expected to expand weakly in 2009 before recovering gradually in 2010, leaving no chance for the Bangladeshi economy to gain momentum before 2010.
Against the backdrop of the deceleration of export growth and remittances, foreign reserves will contract and could consequently weaken the food import capacity of the country and depreciate the exchange rate of the Taka against major currencies. Currency depreciation could lead to some losses of real income and purchasing power through inflation driven by imported goods. An expected increase in government spending for rescue packages (including tax breaks, cash subsidies and food rationing programs) could lead to monetary financing of increased fiscal deficits beyond the 4.99% target, fuelling inflation.
The current estimate of about 0.3 million job losses in the last 6 months could double in the coming months as a result of increased lay-offs in export-led sectors and a further contraction of migration. As households’ expenditures are not back to their 2005 level, there are serious concerns about health care, food intake, education, debt and other vital services and their implications in terms of food security and nutrition.
Focus group discussions revealed a bleak perception of the evolution of the situation. Households expected that it will take 1 to 2 years to recuperate their income level of 6 months ago. Such a pessimistic outlook is due to the long lasting impact of combined shocks endured since 2007. Ongoing Responses and Recommendations
On the macro-economic side, the Bank of Bangladesh eased the lending capacity of the commercial banks to the productive and employment intensive sectors by cutting interest rates and relaxing the conditions for opening fresh letters of credit from 90 to 150 days. Furthermore, the central bank monitors and manages the currency composition of foreign exchange reserves. The government will also expand the open market sale program to provide subsidized rice to all workers in the RMG sector.
In addition to these efforts there is an urgent need to:

8
Expand and accelerate social protection programs (e.g. nutrition and education) targeting households most affected such as female-headed households, agriculture and non-agriculture wage earners and casual laborers. Specific targeting of female-headed households reliant on remittances should be considered in specific areas such as in Sylhet division.
Accelerate the implementation of the Annual Development Plan (ADP) in investing more in labor intensive income generating activities (e.g. basic infrastructure, water supply, sanitation, rural roads and electricity) through cash for work.
Accelerate investment to increase productivity in the agriculture sector to face the lack of arable land and counter production disincentives such as the decrease of agricultural commodity prices.
Monitor the evolution of the macro-economic and sectoral performance. Strengthen the household-level monitoring by establishing the linkages between the macro and micro-levels and by building on existing systems that monitor remittances, migration flows, low-skilled wage rates, food and livestock prices, nutrition indicators.
A follow-up assessment could be envisaged in the second-half of 2009 with partners to review the depth of the impact of the global financial crisis on household food security and livelihoods.

9
1- Background and Objectives
Political instability, natural disasters, the global food and fuel price hikes: Bangladesh’s economy has withstood several challenges since 2006. The global financial and economic crisis is another challenge that is testing its resilience coming on top of the former adversities.
The global financial crisis started in mid-2007 has culminated in widespread financial stress among major financial institutions since September 2008. The economic downturn has now degenerated into recession. Projections of the gross domestic product (GDP) provide a gloomy picture for 2009. The 2009 world growth forecast has been revised downward by 1.0-1.5 percentage points to -1.0 to -0.5 percent in March 2009 compared with the last IMF projection of 0.5 percent made in January 20093. While developed countries were the first hit by the recession, developing and least developed countries (LDCs) have also started to feel the consequences of the crisis on commodity prices, trade volumes, access to international financial markets and job losses, though to various degrees. These developments have led to shifting the debate from the causes to the consequences and policy actions required to mitigate the adverse impacts of the crisis.
1.1. The Legacy of the High Food Prices
As most of the developing countries, Bangladesh has no hiding place as the impact of the global financial crisis could compound the impacts of the food price rises. Although the recent food security situation cannot be attributed solely to the food price rises, there is evidence in the literature that the food price crisis has sent a substantial number of households back to poverty, after a decade of progress. The recent joint WFP/UNICEF/IPHN household survey suggests that 25 percent of the population has become food insecure as of December 2008, as many as the food poverty percentage of 1995-96. The most affected households are overwhelmingly headed by female (38 percent food insecure), they have higher dependency ratio (45 percent), the head of households are less educated (70 percent), and they have less assets (asset score of 4 against a national average of 9.4).
In terms of livelihood, household have barely 1 income earner (1.38 on average), depend on agriculture wage labor (23.7 percent), non agriculture wage labor (19.1 percent) and casual labor (5.2 percent). Most of them are landless (48.6 percent) and net food buyers (39.6 percent). The highest increases in the proportion of net food buyer households are non-agriculture wage laborers (59 percent), remittances earners (53 percent) and casual workers (55 percent). Female headed households included a much higher increase of the proportion of net food buyer (64 percent) compared to male headed households (26 percent).
On average, households spend 62.2 percent of their budget on food, up from 52 percent in 2005. Unfortunately, such an increase of the food budget share is made possible at a high opportunity cost, using multiple coping mechanisms. In addition to eating less than 3 meals a day for adults and less than 4 meals a day for children under 5, 22 percent of households recourse to negative coping mechanisms such as cutting expenditure on health and 33 percent of them getting further indebted from the financial institutions.
As a consequence, severe malnutrition rates increased. Severe acute malnutrition rate increased to 3.4 percent in end-2008 from 2.9 percent in 2007; severe underweight increased from 11.8 to 12.3 percent; and severe stunting increased from 16.1 percent in 2007 to 20.1 percent in end-2008.
While the recent downturn of commodity prices may be seen as a relief for some of the affected households, the recession is likely to further worsen the situation of the most affected households who depend on agriculture and non-agriculture wage labor and casual labor. A review of literature by the Centre for Policy Dialogue (CPD, 2009) reveals that the most vulnerable areas to the global financial crisis in Bangladesh are likely to be export-oriented sectors, manpower export, remittance and domestic resource mobilization. The livelihoods in these areas are the most affected by the food price rises. Bangladesh’s foreign exchange rely mainly on workers’ remittances (10 percent of the GDP) and ready-made garment (RMG) exports (more than 75 percent of total exports).
3 IMF Survey online, March 19, 2009.

10
1.2. Objectives of the Case Study
Against this background, WFP initiated a rapid assessment of the impact of the financial crisis on households’ food security and livelihoods to enable better preparedness and appropriate and effective responses. This rapid assessment is part of a series of WFP country case studies to elicit how the global financial crisis is manifested in Bangladesh at macro-economic level as well as how the macro-level impacts are manifested on households’ living conditions4. More specifically, the assessment aims at:
• Understanding how the global financial crisis is being transmitted to the Bangladesh economy, particularly the performance of the channels through which the crisis is being transmitted.
• Assessing the extent to which the pass-through effects is trickling down at the household level, through key indicators such as remittances, wages, employment and commodity prices and ultimately the living conditions of households.
• Proposing actions to strengthen responses and monitoring.
2- Methodology and Limitations
In order to capture the impact of the current global financial crisis on households both secondary data analysis (SDA) and primary data collection are conducted. The assessment reviewed secondary data available and then conducted primary data. 2.1. Data Collection, Collation and Review
The SDA reviewed literature on the impact of the global financial crisis both at macro-economic level and on households’ incomes sources and food security. This information was used to provide an overview of the macro-economic vulnerability with insights into the country’s recent macro-economic performance. The macro-level analysis also aimed at gaining insights into how the global financial crisis transmits to the domestic economy.
Key informants (KI) interviews were held from 12-18 March with senior government officials, development partners, NGOs, research institutions and leading members of the private sector (annex 1) to triangulate the secondary data review.
The primary data collection was carried out through focus group discussions (FGD). The FGD helped to apprehend how households have been affected so far by the global financial crisis. They provided perceptions of vulnerability, including sources of incomes, expenditures, coping strategies, priority needs and responses, discriminated by sex. They also guided the discussions on the changes which occurred within the last few months.
The field work took place between 22 March and April 04, 2009. Forty FGD were held (annex 2). Survey areas were identified through literature review of the dominant livelihoods that are most likely to be affected by the global financial crisis. Hence, areas with high concentration of migration and dependent on remittances in the North East and South East, areas with high concentration of agricultural labor and cash crops such as tea estates in the North East and shrimp farms in the South West and areas with high concentration of non agricultural unskilled labor (e.g., garment industry) of the two biggest cities Dhaka (capital city) and Chittagong where selected. Two more locations were selected in Khulna and Rajshahi as control groups in both rural and urban areas to represent other categories of casual labor.
From each selected location, two FGDs (female and male) were selected and interviewed separately. FGD participants were identified with the help of key informants (village heads, health and education workers, government employees) in each selected location. A team of five members comprising a supervisor, an organizer, a moderator, a note taker and a field writer interviewed the FGD participants. FGD materials included voice recorders and note books among others. A total of 304 individuals participated in the FGD discussions with an average of 8 participants per FGD.
4 The case studies include Armenia, Nicaragua, Ghana, Bangladesh and Zambia.

11
Table 1: Summary of FGD Composition Number of
participants per FGD
Number of FGD Number of individuals
6 8 487 7 498 19 1529 5 4510 1 1040 40 304
Average size of FGD = 8 2.2. Limitations
The findings of this study cannot be generalized to the whole population, mainly because of the purposive nature of sample and the small number of people participating in the survey. The survey is designed to draw upon respondents’ perceptions of the impact of the global financial crisis. However, the possibility of multiple understandings of the situation makes it difficult to articulate the findings.
The validity of the results may also be affected by ability of moderators to have control over the discussion process with participants. The moderator has to allow participants to talk to each other, ask questions and express doubts and opinions, while having very little control over the interaction other than generally keeping participants focused on the topic. By its nature focus group research is open ended and cannot be entirely predetermined. To reduce such a potential bias, the moderators received a 4-day training to facilitate recall and quantitative estimates to improve internal validity. The checklist was also translated into Bangla to improve interactions between the moderators and the participants and among participants.
The reliability of focus groups’ perception may be weakened by internal cultural and hierarchical dynamics and lack of confidentiality within the group. As a result full participation of all may not have been ensured by the moderators. The effort made to select homogenous groups both by sex and livelihoods aimed at reducing this bias.
3- Macro-Economic Performance and Impact of the Global Financial Crisis
3.1. Recent Economic Developments 3.1.1 GDP Growth Performance
In recent years, Bangladesh enjoyed a substantial growth of the real GDP. The GDP growth stood at 6.2 percent in FY08, slightly below the 6.4 percent growth recorded in FY07. The GDP growth in FY08 was led by substantial growth in industry (6.9 percent) and services (6.7 percent) sectors while the agriculture sector grew by 3.6 percent.
However, in the backdrop of the current global crisis, there are some indications of uncertainties about the growth projection in FY09. Although the global financial crisis is yet to significantly affect the Bangladesh economy, all the projections converge on the fact that the GDP growth will be lower than the initial projection of 6.5 percent in FY09 (annex 3). The central bank of Bangladesh (BB) and the Ministry of Finance (MoF) set an optimistic target of the GDP growth of at least 6.0 percent. The GDP growth of 4.5 percent (lower than its earlier projection of 4.8 to 5.4 percent) projected very recently by the World Bank (WB) is the most conservative one. The latest projection of the annual GDP growth (5.6 percent revised from its previous stand of 5.5 to 6.0 percent) made by Asian Development Bank (ADB) is between the government and the WB’s projections, based on recent signs of the impact of the global financial crisis on key sectors. 3.1.2 Inflation Patterns
Although the trend in inflation is subsiding, it is still above the long-run path, making it difficult for the most affected and vulnerable households to cope with recent shocks--high food prices (2007-2008) and localized natural disasters (cyclone Sidr) in 2007. The 12-month average inflation stood at 8.9 percent by end 2008 with a declining trend since August. While the softening of the inflationary pressure is likely to continue, it is important

12
to keep in view that the current price fall in the global commodity market is largely due to changes in demand side factors while the global supply situation has remained unchanged. As such if the major economies, especially the advanced ones, succeed in recovering from the crisis within a relatively short period, the commodity markets may again experience tight conditions. It is also worth noting the potential disincentive of the price decline on domestic food commodity production. While the high food prices resulted in only a small percentage increase of the net sellers of food commodities (i.e., 5 percent increase in the category of small farmers of 0.5-2.5 acres), these winners are likely to become losers as a result of the global financial crisis. With the global financial crisis, potential income losses are also likely to affect the households identified by the recent WFP/UNICEF/IPHN as the most affected by the food price crisis, namely non-agriculture, agriculture wage and casual laborers. 3.1.3 Performance of the Financial Sector
The demand for credit has weakened between July-December 2008. The growth in the broad money (M2) at the end of December 2008 remained around the same level of 17.6 percent in June 20085. However, both the domestic credit and private sector credit dropped significantly during the last six months reflecting weak credit demand in the economy. While the growth in domestic credit dropped to about 19.3 percent in December from about 21.0 percent recorded in June 2008, the growth in private sector credit mainly concentrated to trade and industry recorded a decline of about 3 percentage point to 21.8 percent in December from about 24.9 percent in June 2008. This pattern is an indication of relatively lower economic activities during the period.
Interest rates such as deposits, lending, repo and reverse repo rates moved up relative to their levels in the first half (H1) of FY20086. During the last six months, however, the Bank Rate (Discount Rate) and yields of government Treasury bills (T-bills)7 and bonds remained mostly unchanged. The commercial lending and deposit rates of the banks varied within a relatively wide margin during H1 FY2009 compared with the narrow margin variation during H1 FY2008. Commercial lending rate reached its peak of 13.5 percent in December 2008 from a low of 12.6 percent in September 2008. Commercial deposits rate, on the other hand, reached 7.9 percent in December 2008 from 7.3 percent in August 2008. Real lending and deposits rate exhibited increasing trend during H1 FY2009 due to the decelerating inflation rate of the period. The interest rates on the certificates of National Savings Directorate (NSD) for the duration of 3 and 5 years remained unchanged respectively at 11.5 percent and 12.0 percent during H1 FY2009.
The major indicators of health of the banking system, such as the ratio of non-performing loans (NPLs), amount of actual provisioning, total deposits and advances, the ratio of capital adequacy, the interest rate spread (IRS), and indicators of profitability remained broadly stable and satisfactory during H1 FY2009. Given the low level of foreign capitalization, the country's banking sector remained broadly unaffected from the ongoing global financial turmoil. However, it would be important to refresh the surveillance of the banking sector and revisit the financial sector management to counteract any potential adverse impact on the country's banking sector. 3.1.4 Fiscal Performance
During the July-December period of FY2009, the realized amount of revenue receipts fell short of its annual target. In the FY2009 budget, the target for revenue earnings was set at 11.3 percent. During H1 FY2009, preliminary estimates show that total revenue and total expenditure stood respectively at 5.9 percent and 8.1 percent of GDP, resulting in a fiscal deficit of 2.2 percent of the GDP (during H1 FY2009) against the yearly target of 4.99 percent. The financing of the deficit amounted to Tk.135.8 billion of which Tk.93.1 billion was accommodated from domestic sources, including bank financing of Tk.73.6 billion while the remaining Tk.42.7 billion came from foreign sources. The implementation of the Annual Development Program (ADP) also remained very low at 1.2 percent of GDP in H1 FY2009 compared with the yearly target of 4.2 percent of the GDP, due to slow execution rate of projects. The execution rate of the ADP is unlikely to improve beyond 70 percent by the end of FY2009 in June. 5 Broad money is considered to be the most inclusive measurement of the money supply in a given country. It involves the most liquid or cash components of money supply or non-cash components that can be converted into cash very easily. Broad money is a key economic indicator used to forecast inflation and the decisions of investors. 6 Repo (repurchase agreement) is a financial instrument used in the money market. It is a transaction in which one party sells securities to another while agreeing to repurchase those securities at a future date. Bangladesh Bank has introduced repo for banks and financial institutions, as an indirect monetary tool for day-today liquidity management to smoothen temporary and unexpected disturbances in the supply and demand for money. 7 T-bills (Treasury Bills) are short-term debt obligation backed by the government with a maturity of less than one year.

13
3.1.5 Performance of the Capital Market
In the backdrop of the ongoing financial turmoil, investors' shaky confidence might have played a role in the recent mixed performance of the capital market in Bangladesh. Stock prices showed significant upturn during the first half (January-June) of 2008 while the second half (July-December) witnessed a downward movement. Although the daily average turnover improved, different monthly average price indexes at Dhaka Stock Exchange (DSE) have declined, showing some fluctuations in 2008. Compared with December 2007, the monthly average of all share price index (DSI), DSEG, and DSE20 declined by 14.1 percent, 12.1 percent, and 8.3 percent respectively in December 2008. 3.2. Degree of Exposure to the Effects of the Global Financial Crisis
The World Bank identified Bangladesh as highly exposed to the global financial crisis8. Almost 20 percent of the population was already leaving in the hardcore (i.e. food) poverty in 2005. The high food price crisis has sent ¼ of the population into food insecurity by end 2008. According to the World Bank, the capacity of the country to cope with the impacts of the financial crisis on poverty is constrained by limited leverage for larger fiscal deficits9 and moderate inflation at 8.9 percent at end 2008. Despite efforts made by the government to mitigate the negative impacts of the high food prices on households, the implementation of the Annual Development Program (ADP) remained very low in 2008, raising some concerns about the country’s capacity to efficiently and effectively scale-up public expenditures to protect vulnerable groups and reduce poverty.
Figure 1: Exposure of Countries to the Global Financial Crisis
Source: World Bank, 2009
Bangladesh’s economy is increasingly exposed to global economic shocks, given its increased integration with the global economy during the last decade. The contribution of trade (export and import) increased significantly since 2001 from 33.4 percent of the gross domestic product (GDP) to 43.4 percent in FY2008. About 85 percent of exports are destined to developed countries and roughly 60 percent of import originates from those countries. Exports take up 20 percent of the GDP in Bangladesh. Ready-made garment (RMG) is the main driver of exports, with a share of almost 80 percent of total exports (i.e. 16 percent of GDP). Almost half of the exports go to the European Union (EU), while 25 percent goes to the United States (US). The dependence on foreign aid has progressively reduced since the 1990s, while foreign direct investment remains low at 1 percent of the GDP over the last decade (2000-2009).
8 World Bank (2009): The Global Economic Crisis: Assessing Vulnerability with a Poverty Lens, Washington, D.C. 9 The IMF estimated the FY2008 fiscal deficit at 4.7 percent of the GDP (IMF, 2008).

14
Table 2: Bangladesh’s Degree of Openness to the Global Economy
FY1981 FY1991 FY2001 FY2007 FY2008
(Export + Import)/GDP 13.5 16.8 33.4 43.3 43.4 Remittances/GDP 1.9 2.5 4.0 8.8 10.0 ODA Disbursed/GDP 5.8 5.6 2.9 2.3 2.4 ODA Disbursed/Export 158.1 100.9 21.2 12.9 13.3
Foreign Direct Investment (FDI)/GDP - 0.1 1.2 1.2 0.8 Source: Centre for Policy Dialogue (CPD, 2009), adapted. Note: FY stands for Fiscal Year, i.e. July-June.
The contribution of remittances has more than doubled since 2001 from 4 percent of the GDP to 10 percent in FY2008. Bangladesh is a huge labor surplus country, putting it on the supply side of the global labor market and at the fifth position among the top remittance recipient countries in the world. As a result, the economy is heavily dependent on migrants’ earnings in the Gulf countries and Western countries. In FY2007-08, total remittances (i.e., USD8 billion) accounted for 10 percent of the GDP. As per the latest statistics, 5.5 million Bangladeshis are currently working abroad. About 65 percent of these workers are semi-skilled (16 percent) and low-skilled (49 percent). Two-thirds of the migrants work in Middle East countries, mainly in Saudi Arabia, Kuwait, Qatar, and United Arab Emirates (table 3). They constitute 25.3 percent of the total labor in those countries and contribute 63 percent of the total remittances inflow in Bangladesh. The remittances inflow from these countries doubled from USD2.4 billion in FY2003-04 to USD4.97 billion in FY2007-08, as a result of the construction boom in the Gulf, mainly Dubai.
Table 3: Importance of Migrant Workers and Remittances Labor Force
(Million) Share of Bangladeshis in
Labor Force (%) Share in Total Remittance
Inflow (%) Kingdom of Saudi Arabia 6.7 27.8 30 Kuwait 2.2 14.2 11 Qatar 1.1 10.0 4 United Arab Emirates 3.3 33.4 14 Bahrain 0.5 26.2 2 Oman 0.9 23.8 3 Total 14.7 25.3 63
Source: BBS (Statistical Yearbook) and Bureau of Manpower Employment and Training (BMET)
The most recent data (July-December 2008) suggest that the pass-through of the ongoing global economic crisis into Bangladesh economy is real. Even though Bangladesh is not integrated to the global capital market, the economy is facing the second round effects of the global financial crisis. There is evidence that international trade, exports of manpower and inflow of foreign official development assistance (ODA) are being adversely affected (table 4). The major source of the potential adverse impact is emanated from the projected contraction of foreign aggregate demand. Recent trends in the volume of Cargo (export plus import) handled in the Chittagong (CTG) port decreased by 5.3 percent during H1 FY2009.
Table 4: Recent Developments in Trade, Remittances and Aid Flows
Jul-Dec. 2008 (Provisional)
Jul-Dec. 2007 (Revised)
Growth in Jul.-Dec. 2008
Growth in (FY08)
1. Cargo (export plus import) handled in CTG port ('000 MT)
2. Exports (fob) 3. Imports (Settlement of LCs) 4. Remittances 5. Gross ODA inflow 6. Net ODA inflow 7. Foreign direct investment (FDI) 8. Change in reserve position 9. Change in exchange rate
13489.0 7754.7 11115.4 4504.7 898.3 579.6 706.0 -361.0 -0.42
14244.0 6495.9 9078.4 3440.5 903.2 630.0 285.0 437.3 0.23
-5.3 19.4 22.4 30.9 -0.5 -8.0
147.7 --- ---
3.4 15.7 27.6 32.4 20.4 25.2 -18.0 --- ---
Sources: (1) Bangladesh Bank, (2) Export Promotion Bureau (EPB), (3) Chittagong Port Authority, and (4) External Resources Division (ERD) of the Ministry of Finance. All figures are in millions of USD unless otherwise mentioned.

15
3.3. Transmission Channels and Macro-Impacts 3.3.1 High Remittance Inflows with Decelerating Outmigration
According to the statistics of the Bureau of Manpower Employment and Training (BMET), the export of manpower decreased by 40 percent in January-March 2009 compared to the same period in 2008. On average, the number of migrant workers stood roughly at 47,000, a 40 percent decrease compared to the same quarter a year ago. Likewise, a declining trend is also observed in the number of clearance certificates issued by BMET for migrant workers, came down to around 2 thousand per day from around 6 thousand per day in early 2008. Saudi Arabia reduced recruitment of Bangladeshi workers to a monthly average of 1,000-1,500 compared to a monthly average of 5,000-7,000 workers in previous years. The recent cancellation of work visas of 55,000 Bangladeshi jobseekers by Malaysia raised concerns about the future outlook of migration to traditional destinations. Migrant workers in the United Arab Emirates (UAE) are reportedly being sent back to Bangladesh on long-term vacation due to the slowdown in the construction sector in Dubai. Official figures of the BMET indicate about 4,800 workers returned home in January 2009. This number almost doubled to 8,000 in February 2009.
The latest data from the central bank of Bangladesh indicate that although the inflows of wage earners' remittances remained at its trend level, it dropped 8.7 percent to USD 784.5 million in February 2009 from USD 859.0 million in January 2009. This pattern is likely to accentuate with the slowdown of the modernization and infrastructure building process in the Middle-Eastern countries. As a result, stoppage of new recruitments along with partial layoff of existing jobs are very likely, which will ultimately affects the inflow of remittances in Bangladesh negatively. There are concerns that continued decrease of inflows of remittances will hurt demand side mainly in construction, financial and telecommunications services. As most of the low skilled remittance earners are from rural areas, it is also feared that any decline in the manpower exports and inflow of remittances will have direct impact on the livelihood of rural population who is still paying a dire cost of the recent price shocks in the international commodity market.
Figure 2: Flow of Remittances (Year-on-Year Basis)
500.0
550.0
600.0
650.0
700.0
750.0
800.0
850.0
900.0
Jul-0
8
Aug-
08
Sep-
08
Oct
-08
Nov
-08
Dec
-08
Jan-
09
Feb-
09
In M
illio
n U
SD
Flow of Remitances 820.7 721.9 794.2 648.5 761.4 758.0 859.0 784.5
Jul-08 Aug-08 Sep-08 Oct-08 Nov-08 Dec-08 Jan-09 Feb-09
Source: Central Bank of Bangladesh
3.3.2 Declining Trade Performance: Garment and Agricultural Exports and Imports
The volume of exports as well as import Cargo handled in the port show a deceleration of the volume trade, resulting from the drastic fall in the international demand. The volume of cargo handled in Chittagong Sea Port, one of the largest of the country, covering around two-third of international trade volume is considered as an indicator of trade performance in Bangladesh. The latest data on the volume of Cargo handled in the Chittagong (CTG) port indicate a fall of around 5.3 percent during July-December 2008 against 3.4 percent increase in the same period of 2007. The number of exports and imports ships declined further to 163 and 177 in January 2009 respectively from 176 and 190 in January 2008.
The movements in exports earnings during the first seven months of FY2009 (July 2008-January 2009) were quite volatile (figure 3). While FY2009 started with about 71 percent export growth in July 2008, subsequent

16
months faced a downward trend which culminated at a decline of more than 70 percent in October 2008. The positive growth of 13.2 percent recorded in January 2009 is explained by deferred shipment from December 2008.
Recent developments suggest readymade garment (RMG) exports have started to endure some impacts of the global recession, though not yet at a large scale. Data from the United States International Trade Commission (USITC) and EUROSTAT indicates that Bangladesh’s major export destinations have been badly hurt by the global financial crisis. From July to December 2008, the US import of knitwear and woven garments from Bangladesh increased by 25.9 and 12.5 percent respectively, compared to the same period in 2007. While, imports of knitwear increased by 6.7 percent in the EU, imports of woven garments from Bangladesh, decreased by 2 percent during July-December 2008, compared to the same period a year ago. This occurred as a result of the end of quotas on China from January 1, 2008 which increased competition in the EU market putting downward pressure on prices. In addition to a decrease of about 20 percent price drop of RMG products in the international market, the volume of Utilization Declaration (UD) declined by about 5.0 percent in January and about 17.6 percent in February 2009. The decrease of the utilization declaration will result in shrinking export trend for the readymade garment in the next months, leading possibly to job losses. This pattern will reflect negatively in the export earnings of the coming months. There is general consensus among exporters of RMG that although orders are moving from competitive countries such as India and China to Bangladesh, profitability of exports is in question as increases of export volumes are marginal and prices are significantly low. In other words, the so-called “Wal-Mart Effect” or the resilience of Bangladesh RMG to the global recession is coming to an end. The safeguard on China was withdrawn from January 1, 2009 in the US market. This is likely to increase competition on low-end textile products in the US market, putting further downward pressures on garment prices and hence margins. To keep the competitive advantage and productivity, especially in low-end RMG, effort is made to reduce wasting and wages are kept unchanged with more work pressure on workers. As a result, workers are likely to work more for the companies though the work benefits less their families.
There is also a clear indication that traditional agricultural exports are facing a downturn. Fish exports to the US decreased by 16.5 percent in July-December 2008 compared to July-December 2007. The decline of jute exports was estimated at 20 percent over the same period. The EU imports of fish, jutes and rawhides also decreased by 15.9, 13.3 and 25.4 percent respectively. Reportedly, exports of vegetables and allied products have declined by at least 40 percent, over the last few months. The export figures for frozen food showed a decline of 4 percent in the July-December 2008 period. In January 2009, exports of traditional items decreased further. Exports of raw jute declined by 15.2 percent; jute goods declined by 19.8 percent, frozen food and leather declined by 5.5 percent and 31.8 percent respectively, compared to January 2008.
Although no major lay-offs have taken place so far, continued slowdown in both RMG and traditional agricultural exports are likely to result in job cuts. Prolonged slowdown may also lead increased insolvability of companies, with the risk of increased non performing loans in the banking system and reduced flow of new fund to new investment projects.
Figure 3: Exports Growth (Year-on-Year Basis)
-80
-60
-40
-20
0
20
40
60
80
Jul-0
8
Aug-
08
Sep-
08
Oct
-08
Nov
-08
Dec
-08
Jan-
09
Gro
wth
in P
erce
nt
Export growth 71.01 -14.69 8.11 -70.34 33.12 -8.5 13.22
Jul-08 Aug-08 Sep-08 Oct-08 Nov-08 Dec-08 Jan-09
Source: Central Bank of Bangladesh

17
The impact of the global financial crisis is also being felt through the fall of imports, partly due to substantial reduction in the imports of consumer goods and capital machinery. The latest figures from the Bangladesh Bank show that the cumulative growth of letter of credits (LCs) opening started with a growth of about 29.1 percent in July 2008 and dropped down to -2.3 percent and -4.2 percent respectively in January and February 2009. LCs opening data for January, 2009 portrays a decline of 34.6 percent for industrial raw materials and a decline of 39.7 percent for capital machineries, compared to January, 2008 figures (CPD, 2009). Likewise, during the first week of March 2009 the amount of LCs opening stood at USD405.2 million, a decline of about 29.6 percent compared to the same week of March 2008. The falling volume of imports and their prices (food and fuel in particular) may be seen as a relief on the fiscal deficit through lower import bills. However, the reduction of imports of industrial raw materials and capital machineries are likely to transmit to reduced investment, with potential negative impacts on employment and economic growth.
Besides, lower imports result in reduced import revenues (import duties and VAT) of the central government, with the risk of limiting the government capacity to meet the target of its annual development plan (ADP). The month-on-month growth of imports during July-December 2008 shows a downturn in import duty, starting from 35.7 percent in July to a negative growth of 13.9 percent in December 2008 (CPD, 2009). Continued decline of import revenues could put pressure on government expenditures in development projects and social safety programs with consequent negative impact on the poor.
Figure 4: Growth of Settlement and Opening of LCs (Year-on-Year Basis)
-10
0
10
20
30
40
Jul-0
8
Jul0
8-Au
g08
Jul0
8-Se
p08
Jul0
8-O
ct08
Jul0
8-N
ov08
Jul0
8-D
ec08
Jul0
8-Ja
n09
Jul0
8-Fe
b09Gro
wth
in P
erce
nt
LCs Settlement LCs Opening
Source: Central Bank of Bangladesh
3.3.3 Slowdown of Foreign Capital Flows: Aid and Foreign Direct Investment
Bangladesh is facing a slowdown of the flow of Official Development Assistance (ODA), mainly because of its low absorption capacity during the last two years. The global financial crisis is likely to compound the contraction of the ODA flows due to ballooning domestic budget deficits in donor countries, some of which have already announced aid cuts. The period of July-December 2008 witnessed a declining trend both in gross and net ODA flows to Bangladesh. During this period, the total amount of gross and net ODA stood at USD 898.3 million and USD 579.6 million respectively, 0.5 percent and 8 percent below the amounts of the same period in 2007. Continued decline is likely to further hamper the execution rate of foreign aid dependent infrastructure and social safety net programs.
Despite its upward trend, the amount of foreign direct investment (FDI) flow to Bangladesh remains low (less than 1 percent of the GDP) due to the limited international exposure to capital markets. Indeed the non-convertible capital account restricts somehow the outflow of foreign exchange, making it difficult for the government to attract more FDI into the country. Efforts are made to create export processing zones (EPZs) which are mainly run by foreign shared joint ventures. Provisional data on the inflow of FDI stood at USD 706.0 million during July-December 2008, a 147.7 percent increase compared to the same period in 2007. This sharp increase is due to some onetime investments in the telecommunications sector, overstating the actual

18
performance of FDI in the country. It is unlikely that FDI inflows will increase further in the context of tighter global credit markets, and consequently substantial reduction in the worldwide flow of FDI.
In the near future, a slowdown of the inflow of FDI is likely to slowdown technology transfer and productivity growth, which are crucial for poverty alleviation. The aforesaid declining trends of the UDs and imports of capital machineries are signs that both FDI and domestic investment initiatives are likely to dry up, in the face of a gloomy global economic outlook.
Figure 5: Inflow of Foreign Aid (in Million Dollars)
500 550 600 650 700 750 800 850 900 950
Gro
ss A
idN
et A
id
July-Dec. 2007 July-Dec. 2008
Source: Central Bank of Bangladesh
3.3.4 Implications for Foreign Reserves and Exchange Rates
Lower growth in exports, remittances and aid flows in recent months, resulted in a slight contraction of the total amount of gross official reserves by 5.9 percent in December 2008 compared to June 2008. The level of foreign reserves is directly related to exports, imports, remittances, ODA and FDI flows. While export earnings, inflow of remittances, ODA and FDI are positively related to the reserve position, the payments against import bills as well as principal and interest of the aid are negatively related to the international reserve position. The total amount of gross official reserves stood lower at USD 5787.8 million (equivalent to 3.2 months of imports) in December 2008 declining by about USD 361 million from USD 6148.8 million in June 2008. Further reduction of the foreign reserves position is expected, in line with the unfavorable future outlook for exports and remittances, unless this downward trend is offset by improved ODA flows.
In the backdrop of the current squeeze of the foreign exchange, the Bangladeshi currency lost about 0.6 percent of its value against the dollar (depreciation) during the period of July-December 2008, compared to an appreciation of 0.3 percent appreciation during July-December 2007. Since the floatation of the exchange rate in May 2003, the bilateral exchange rate of Bangladeshi Taka is determined by the demand and supply conditions in the foreign exchange market. While the increased supply of foreign currency tends to appreciate the par value of Taka, the opposite situation would tend to depreciate the currency. Although the depreciation of the domestic currency is seen as an indication of increased export competiveness, the ultimate implication of the currency depreciation for an import dependent country like Bangladesh depends on the net effect of export and import elasticities with respect to exchange rate depreciation. Any depreciation of the domestic currency leads to an indirect deterioration in the terms of trade, as it increases the import cost relative to export price and thereby increases the overall price level of the country eroding real income and purchasing power of the low income population.
Data from the Bangladesh Bank show that, the real effective exchange rate (REER) indexes appreciated during H1 FY2009 while the nominal exchange rate depreciated slightly. As a result, Bangladesh incurred some losses in its export competitiveness in the international market. Despite the increase in the REER, the nominal exchange rate (Taka 68.94 per USD) remained higher than the REER based exchange rate (Taka 61.41 per USD), maintaining the export competitiveness, despite the shrinking margin relative to earlier periods.

19
Figure 6: Exchange Rate Movements
50.0
60.0
70.0
80.0
90.0
100.0
Jan-05
Apr-05
Jul-05
Oct-05
Jan-06
Apr-06
Jul-06
Oct-06
Jan-07
Apr-07
Jul-07
Oct-07
Jan-08
Apr-08
Jul-08
Oct-08
Nominal ER REER Index REER Based ER
Source: Central Bank of Bangladesh
4- Perceived Impacts at Household Level
Five divisions were covered namely Chittagong, Dhaka, Khulna, Rajshahi and Sylhet. To understand the impact of the global financial crisis, focus groups discussions (FGDs) were conducted in purposively selected locations to cover livelihood groups that are most likely to be affected by the financial, according to the macro-economic pass-through channels analyzed in previous sections. Hence, 40 FGDs were organized, 12 with remittance earners, 8 with garment workers, 12 with workers of export-oriented agriculture (shrimp and tea estate) and 8 control groups made up with casual workers not involved in the former activities (table 5). Overall, discussions did not reveal any major difference between control groups and other FGDs, suggesting workers of the most exposed sectors and casual laborers are similarly affected by the effects of the global financial crisis. Therefore, the next sections will not distinguish control groups from others. Given the small sample size, the next sections will not emphasize the analysis of the characteristics of individual livelihood groups either.
Table 5: Geographical and Sectoral Coverage of FGDs
Sector of Activity Division District No. FGD
Sylhet 4Comilla 2Noakhali 2Chandpur 2Maulvibazar 2Dhaka 4Gazipur 2
Chittagong Chittagong (Ctg) 2Satkhira 4Bagerhat 2
Sylhet Maulvibazar 6Gaibandha 2Panchagarh 2Rajshahi 2
Khulna Khulna 240
Remittance earners Sylhet
Garment workers
Total
Export oriented agriculture labourers (shrimp, tea estate)
Control group rural (casual labour)
Dhaka
Khulna
Rajshahi
4.1. Impacts on Livelihoods and Incomes
Based on discussions with the 40 focus group members, remittances are mentioned by 9 of 40 FGDs as the first income source of the communities, followed by unskilled non-agriculture daily labor (8 of 40 FGDs), work in tea estate (6 of 40 FGDs) and work in garment factories (4 of 40 FGDs). As the first source of income, 4 FGDs mentioned that remittances contribute to about 80 percent of their incomes. Unskilled non-agriculture daily

20
labor is the second main income source for 9 of 40 FGDs, , followed by agriculture daily labor (8 of 40 FGDs) and small businesses (6 of 40 FGDs). As a second source of income, the contribution of unskilled non-agriculture daily labor to income is estimated at 25 percent, according to 8 FGDs.
Female FGDs reported more dependence on remittances as their main income sources, compared to male FGDs. Five of 20 female FGDs depend on remittances as their first source of income, compared to 4 male FGDs. Four female FGDs mentioned that remittances contribute to 80 percent of their incomes, suggesting female-headed household whose husbands are migrant workers are vulnerable to decreases of remittances. No male FGD reported such a high level of contribution of remittances to household incomes. Five of 20 female FGDs are also more dependent on unskilled non-agriculture daily labor as their second source of income, compared to 4 in 20 for male FGDs. By contrast, male FGDs are more dependent on agriculture daily labor (5 in 20 FGDs) as their second source of income compared to female FGDs (3 in 20 FGDs). In total, 4 in 40 FGDs mentioned work in garment factories as both their first and second source of incomes.
Figure 7: Main Income Sources (Number of Respondent FGDs)
0 2 4 6 8 10 12 14 16 18 20
Fish/shrimp-processing worker
Wood/bamboo/f irewood seller
Tea estate worker
Other services
Rickshaw/van/cart puller
Remittance
Skilled labour (non-agric.)
House-maid
Garment worker
Fishing in deep sea/river
Earth-digging
Unskilled day labour (non-agric.)
Day labour (agric.)
Small business
First Second Third There is a sense that activity changes witnessed by FGDs are being made at the expense of sustainable livelihoods. In response to whether households have changed activities in the past 6 months, 17 out of 40 FGDs (12 male FGDs and 5 female FGDs) answered positively. According to respondent FGDs, households most frequently changed their activity to daily labor, suggesting they are likely engaging in less regular livelihoods. The main reasons of livelihood changes are low purchasing power (9 FGDs) and reduced job opportunities (7 FGDs) suggesting households are likely facing the impacts of the global financial crisis on top of the lasting effects of the high food prices. The issue regarding low purchasing power is in line with the findings of a recent assessment of the food security and nutritional impacts of the high food prices conducted by WFP/UNICEF. Based on nationwide and representative data collected in December 2008-January 2009, this report indicated that real incomes decreased by 12 percent compared to 2005, with 40 percent of households perceiving the impact of high food prices as severe or high.
Table 6: Activity Changes Observed over the Last 6 Months
Before NowEarth-digging Selling firewood 1Tea estate worker Earth-digging 1
Selling betel leaf and bidi (tobacco) 1Day labourer 8
Agriculture farmer Day labourer 1Unemployed Migrant worker 2Worker in shrimp-hatchery Fishing in deep sea/river 2Day labourer Small business 1Total 17
Type of activity change
Rickshaw-puller, Mason, Street-vendor
Number of Respondent FGDs
The estimated proportion of households who have changed their livelihood activity over the last 6 months is likely less than 25 percent, with an estimate of 10 percent most often reported (i.e. the mode). FGDs were asked to estimate the proportion of households who have changed their livelihood activity. Out of 40 FGDs, 11 (7

21
male FGDs and 4 female FGDs) successfully conducted the proportional piling exercise. Five of the 11 respondent FGDs estimated the proportion of households who have changed their activities to be less than 25 percent and 3 of them estimated this proportion to be less than 10 percent, in particular in the garment sector. Compared to male FGDs, more female FGDs reported that the proportion of households who have changed their livelihood activities is above 50 percent, suggesting female groups are more sensitive to livelihood changes than male groups.
Figure 8: Estimated Proportions of Households Who Have Changed an Activity
0
1
2
3
4
5
6
Less than 25% Between 25-50% Between 50-75% More than 75%
Male
Female
Total
Unusual cash income decreases can be associated with the global financial crisis, according to the majority of FGDs interviewed. FGDs were asked if the levels of cash income of households changed in the past 6 months. In all, 20 FGDs (10 male FGDs and 10 female FGDs) mentioned it has decreased. With regards to the reasons of the income decreases directly related to the global financial crisis, 11 FGDs mentioned the fall in dollar/pound and commodity prices. In addition, 7 FGDs (mainly female FGDs) considered the main reason of cash income decrease is reduced casual labour opportunities whereas 4 FGDs mentioned job losses in foreign countries. Female FGDs mentioned job losses in foreign countries as the main reason of cash income decreases, an indication of their higher dependence on remittances as mentioned above. The majority of FGDs (22 out of 40) said cash income decreases are unusual compared to seasonal patterns. Half of these FGDs are concentrated in Sylhet and depend on remittances.
Figure 9: Main Reasons of Cash Income Decreases
0123456789
No/less jobs incountry
Fall in commodityprices
Fall in dollar/poundsterling
Less jobs in foreigncountries
Total Male Female
22
4.2. Impacts on Employment and Wages
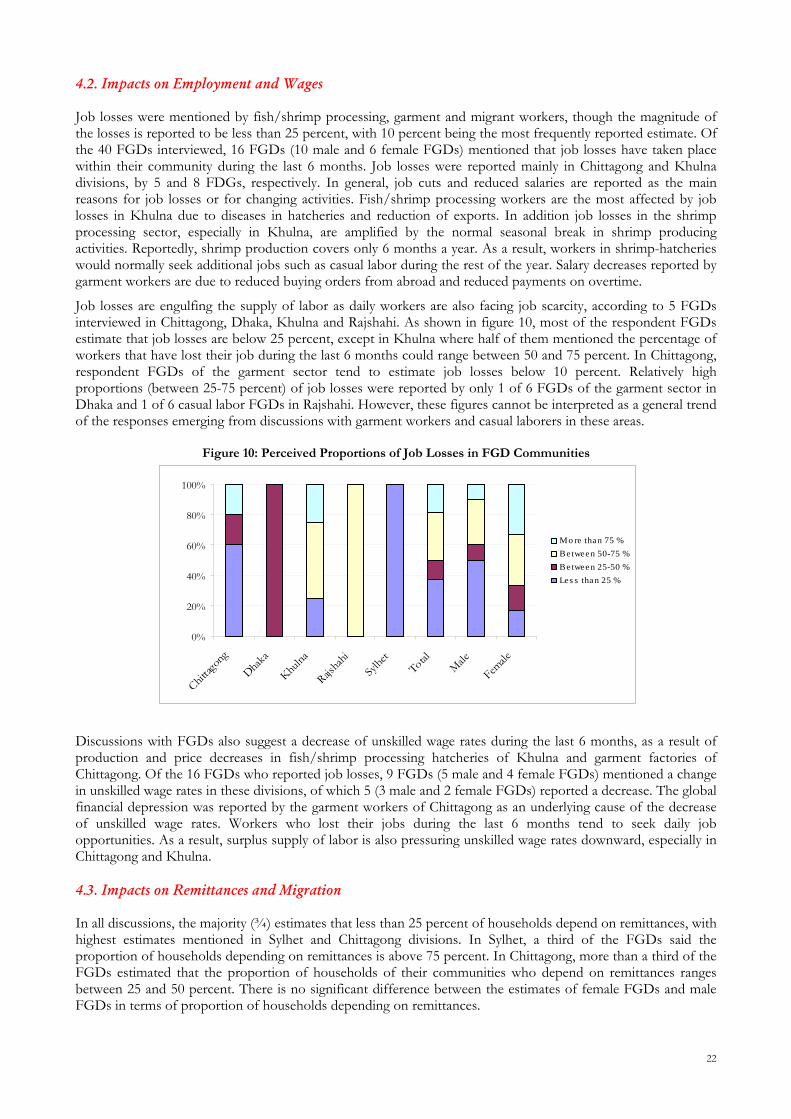
Job losses were mentioned by fish/shrimp processing, garment and migrant workers, though the magnitude of the losses is reported to be less than 25 percent, with 10 percent being the most frequently reported estimate. Of the 40 FGDs interviewed, 16 FGDs (10 male and 6 female FGDs) mentioned that job losses have taken place within their community during the last 6 months. Job losses were reported mainly in Chittagong and Khulna divisions, by 5 and 8 FDGs, respectively. In general, job cuts and reduced salaries are reported as the main reasons for job losses or for changing activities. Fish/shrimp processing workers are the most affected by job losses in Khulna due to diseases in hatcheries and reduction of exports. In addition job losses in the shrimp processing sector, especially in Khulna, are amplified by the normal seasonal break in shrimp producing activities. Reportedly, shrimp production covers only 6 months a year. As a result, workers in shrimp-hatcheries would normally seek additional jobs such as casual labor during the rest of the year. Salary decreases reported by garment workers are due to reduced buying orders from abroad and reduced payments on overtime.
Job losses are engulfing the supply of labor as daily workers are also facing job scarcity, according to 5 FGDs interviewed in Chittagong, Dhaka, Khulna and Rajshahi. As shown in figure 10, most of the respondent FGDs estimate that job losses are below 25 percent, except in Khulna where half of them mentioned the percentage of workers that have lost their job during the last 6 months could range between 50 and 75 percent. In Chittagong, respondent FGDs of the garment sector tend to estimate job losses below 10 percent. Relatively high proportions (between 25-75 percent) of job losses were reported by only 1 of 6 FGDs of the garment sector in Dhaka and 1 of 6 casual labor FGDs in Rajshahi. However, these figures cannot be interpreted as a general trend of the responses emerging from discussions with garment workers and casual laborers in these areas.
Figure 10: Perceived Proportions of Job Losses in FGD Communities
0%
20%
40%
60%
80%
100%
Chittag
ong
Dhaka
Khulna
Rajsha
hiSy
lhet
TotalMale
Female
Mo re than 75 %Between 50-75 %Between 25-50 %Les s than 25 %
Discussions with FGDs also suggest a decrease of unskilled wage rates during the last 6 months, as a result of production and price decreases in fish/shrimp processing hatcheries of Khulna and garment factories of Chittagong. Of the 16 FGDs who reported job losses, 9 FGDs (5 male and 4 female FGDs) mentioned a change in unskilled wage rates in these divisions, of which 5 (3 male and 2 female FGDs) reported a decrease. The global financial depression was reported by the garment workers of Chittagong as an underlying cause of the decrease of unskilled wage rates. Workers who lost their jobs during the last 6 months tend to seek daily job opportunities. As a result, surplus supply of labor is also pressuring unskilled wage rates downward, especially in Chittagong and Khulna. 4.3. Impacts on Remittances and Migration
In all discussions, the majority (¾) estimates that less than 25 percent of households depend on remittances, with highest estimates mentioned in Sylhet and Chittagong divisions. In Sylhet, a third of the FGDs said the proportion of households depending on remittances is above 75 percent. In Chittagong, more than a third of the FGDs estimated that the proportion of households of their communities who depend on remittances ranges between 25 and 50 percent. There is no significant difference between the estimates of female FGDs and male FGDs in terms of proportion of households depending on remittances.

23
Although transfers are made both in-cash and in-kind, 10 FDGs out of 16 discussions mentioned that remittances are transferred more often in the form of cash. According to 16 FGDs (out of 21 discussions), cash transfers are usually made through banks, followed by relatives (4 FGDs). International remittances are sent mainly by three types of migrant: (i) American and British, diaspora of well-educated, high or middle income earners, (ii) a diaspora of Bangladeshi origin belonging to the low-income or unemployed segments of the population also exists in industrialized countries, and (iii) a major group of migrant laborers, who are residing for a specific period of time in Middle Eastern (mainly Saudi Arabia, UAE, Kuwait), South-East Asian (Malaysia, Singapore) and some industrialized countries (De Bruyn, 2006). From the point of view of utilization, three different types of transfers can be discerned. Firstly and most importantly, individual transfers to families or friends. Investment in business or traditional productive uses and in savings is rather limited, but remittances are also seen as important financial means to investment in human capital (i.e. education), housing and land purchase. Remittances allow families to meet their basic needs; open up opportunities for investing in education, health care, etc.; loosen up constraints in the family budget to invest in business or to save; are a kind of emergency resource; provide a social security for the elderly. The importance of the repayment of the cost of migration should not be underestimated. Secondly, individual transfers are sent to sponsor charity or community development initiatives. Lastly, collective transfers are identified to fund charity or community development initiatives.
Figure 11: Perceived Proportions of Households Dependent on Remittances
0%
20%
40%
60%
80%
100%
Chittag
ong
Dhaka
Khulna
Rajsha
hi
Sylhe
tTota
l Male
Female
Abo ve 75%Between 50-75%Between 25-50%Les s than 25%
In the last six months, decreases of frequency and amount of remittances mentioned by 12 FGDs are associated with the impacts of the global financial crisis. Of the 16 FGDs which responded to the question on changes in frequency and amount of remittances received by households, ¾ mentioned that both the amount and the frequency of remittances decreased in the last six months. The first reason of the decrease of frequency and amount of remittances is job cuts abroad, according to 9 respondent FGDs, followed by foreign currency depreciation (5 FGDs), high expenses in migrants’ host countries (5 FGDs). Female FGDs tend to report more frequently job losses as the main reason of the decline of the frequency and amount of remittances. This is an indication of their relative dependence on family members working abroad. As for domestic transfers, the main reason of the decreases in both the amount and the frequency of transfers is low or irregular wages (5 FGDs).
Figure 12: Perceived Changes in Amount and Frequency of Remittances Received
0%10%20%30%40%50%60%70%80%90%
100%
Chittagong Khulna Rajshahi Sylhet Total Female Male
Amo unt increas ed and mo re frequent Amo unt decreas ed and les s frequent Do n't kno w

24
There is evidence that some migrants workers have returned home in the last six months, with the most frequent estimate falling between 10-20 percent. Of the 16 respondents FGDs, 9 said some community members have returned home in the last six months. The estimated average proportion of returnees is 17 percent, with a median of 20 percent. Of the 9 respondent FGDs that said community members have returned, 8 mentioned the increased number of returnees is unusual, compared to normal seasonal patterns. This is mainly due to reduced job opportunities abroad, according to 5 FGDs, illegal migrants deported (3 FGDs), job losses abroad (2 FGDs) and reduced wages (2 FGDs). According to key informants, namely the Bureau of Manpower Employment and Training (BMET) migrants are sent back home by employers of the Gulf countries for long vacations (3-6 months), as a way of responding to the short-term implications of global financial crisis.
4.4. Recent Food Price, Expenditures and Consumption Patterns 4.4.1 Perceived Food Price Changes
In the last 6 months, the prices of import-related staple foods (cereals, pulses and edible oil) decreased, as a result of a combination of domestic and global factors. An overwhelming number of respondent FGDs said the prices of rice, pulses and wheat decreased mainly due to government interventions. In addition, increases of imports and production, in particular for rice, were mentioned as contributing factors (table 7).
In the contrary, the majority of FGDs said the prices of vegetables and fish increased mainly in relation with the end of the production season. In the last 6 months, these price increases occurred mainly in January-February 2009 for both vegetables and fish.
Table 7: Changes of Staple Food Prices in the Last 6 Months
Decrease Main Reasons Increase Main ReasonsGovernment interventionsIncreased importsIncreased productionReduced hoarding
Pulses 18/23 Government interventions 4/23 Less importsWheat Flour 10/12 Government interventions 0/12 -
Government interventionsReduced hoarding
End of seasonLow production
Fish 0/10 - 9/10 End of season
Hoarding
Food Commodity
Edible Oil 7/9 2/9
Vegetables 5/22 16/22Government interventions
Price Changes (# Respondent FGDs)
Rice 39/40 1/40 Don't know
4.4.2 Perceived Recent Expenditure and Consumption Changes
The share of expenditure on food decreased to 57 percent from an average of 67 percent six months ago. FGDs were asked if households’ expenditures had changed over the last six months (September 2008-March 2009) for key expenditure categories.
For food, all the 40 FGDs indicated the share of their food expenditure in total expenditure had decreased, on average from 67 percent to 57 percent, compared to 6 months ago. The December 2008-January 2009 household survey conducted jointly by WFP and UNICEF estimated the share of food in total expenditure at 62 percent, compared to 52 percent in 2005. It is worth mentioning that figures reported by FGDs cannot be generalized as opposed to the WFP/UNICEF joint survey results. However, the trends suggest that the current share of food expenditure is not yet back to its normal level of pre-high food price crisis, despite recent cereal price falls reported by FGDs.
For non-food items, the majority of FGDs indicated that the reduction of the share of food expenditure enabled households to allocate more of their budget to education, health, debt reimbursement and rent. As a result, the share of expenditure on education increased from 6 percent on average to 7.2 percent. The share of expenditure on health also increased from an average of 4.4 percent to 5.2 percent.
However, there is an indication that the increase of the share of education and health is also related to increased costs of education (materials and transport) and health (reduction of provisions to health

25
services in tea estates, medicines and fees). These additional costs were reported by 16 FGDs for education and 4 FGDs for health.
It is interesting to note that the level of household indebtedness is relatively high as they spend a higher share of their total budget on debt reimbursement (about 10 percent) compared to health and education.
Table 8: Perceived Changes of Expenditures in the Last 6 Months
Number of FGD Respondents (out of 40)
Average Share (%) Median Share (%)
Number of FGD Respondents (out of 40)
Average Share (%) Median Share (%)
Health 37 4.4 4.7 37 5.2 7.9 *** 7.8Education 40 6.0 7.7 40 7.2 7.9 *** 5.0Transport 20 2.3 3.7 20 1.9 2.9 ** 3.1Food 40 66.9 70.0 40 56.5 60.0 *** 61.6Debt reimbursement 11 9.9 3.7 12 9.6 4.9 - 6.1House rent 11 8.2 8.7 11 8.2 7.9 ** 1.0Utility bills 15 2.4 1.7 15 1.6 0.9 * -Others - - - 35 9.8 7.9 - 15.5Note: Significance levels at 1% (***), 5% (**), 10% (*)
Expenditure category
Share in Total Expenditure (Sept.2009) -A- Share in Total Expenditure (Mar. 2009) -B-Significance
Paired Test of Difference
(B-A)
Share in Total Expenditure
(%, Jan. 2009)
From the consumption point of view, about 3/5 of FGDs (including 16 male and 9 female FGDs) mentioned changes in the diets toward cereals at the expense of vegetables and fish for which prices have increased in the last 6 months. Due to vegetable and fish price increases, some households eat less of these items, according to 8 FGDs. The tendency is to opt for cheaper food items such as cereals for which prices have decreased, according to 10 FGDs.
4.5. Coping Strategies and Priority Needs
Focus group interviews disclosed job losses in fish/shrimp processing, garment and migrant workers, partially as a result of the global financial crisis. There is evidence that some migrants workers have returned home in the last six months. Unusual cash income decreases are also associated with the global financial crisis. Discussions also suggest a decrease of unskilled wage rates during the last 6 months, as a result of production and price decreases in fish/shrimp processing hatcheries and garment factories. The share of non-food items such as education and health not only increased as a result of the decrease of the share of food expenditure, but also because of higher other costs such as school materials, transport cost to school, of education (materials and transport) and health (reduction of provisions to health services in tea estates, medicines and fees).
In response to these difficulties, the majority of FGDs (29 out of 40) said households are coping by changing their diet, diversifying their livelihoods and income source and taking on more debt, compared to 6 months ago. As shown in figure 13, households eating less than three meals a day were the most reported coping mechanisms (15 FGDs). Equally reported is also the fact that households are diversifying their income activities in order to bring in more revenue. On the negative side, income diversification could lead to child work or less care provided to mothers to children due to increased time spent on income generating activities. Discussions disclosed that households are increasing the time spent on work, according to 12 FGDs , equally distributed between female and male FGDs. Of these 29 FGD respondents, 24 said these behaviors are unusual.
When asked when they think households will recuperate their income level of 6 months ago, 10 FGDs responded it will take 1-2 years, 3 said it will take 3-5 years, 7 said the situation will never come back to normal and 7 others said they don't know. The majority of FGDs (23) said community members receive support at the time of the survey in late March 2009. The most frequent support is old-age pension, followed by VGD card and widow pension, according to 16, 15 and 12 FGDs respectively.
The three main priority needs of households are by order of importance: employment creation, financial support and price cuts in basic needs, according to 38, 26 and 10 FGDs, respectively. Majority of FGDs indicated that providing adequate response to these priorities will mitigate the negative impact of increased unemployment on households living conditions.

26
Figure 13: Recent Coping Strategies Adopted by Households
1
5
3
8
6
10
2
5
2
1
6
7
6
5
6
2
3
7
9
15
12
15
8
7
1
1
4
0
2
1
1
2
0
0
1
3
2
3
0
0
0
4
2
9
3
7
3
0
2
0
0
0
0
4
0
1
0
1
2
3
4
0
4
4
0 5 10 15 20 25 30 35 40 45 50
Rearing livestock
Intake of less quality food items
Cutting spending on utilities, clothes and transport
Eating less than 3 times a day
Working overtime
Diversifying income sources
Taking loans
No measure taken
Number of Respondent FGDs
Male Female Total Chittagong Dhaka Khulna Rajshahi Sylhet
5- Perspectives and Ongoing Interventions
5.1. Future Outlook and Scenario
Although Bangladesh economy has not yet faced a substantial negative impact of the ongoing financial crisis, significant downside risks exist in the coming months.
The overall macroeconomic outlook beyond FY2009 is difficult to predict as it is very closely related to the duration and severity of the current global crisis, natural calamities and their consequences on the economy. Available information indicates that external sectors comprising international trade, remittances, foreign aid and FDI are being affected by the ongoing global economic meltdown. Given the overall stake of total trade and remittances as a ratio of GDP (around 53 percent), the Bangladesh economy is likely to slowdown to less than 6 percent growth in FY200910. As warned by the IMF, activity is expected to expand only weakly in 2009 before recovering gradually in 2010 leaving no chance for Bangladesh economy to gain momentum before 2010.
In the backdrop of the deceleration of export growth and the inflow of remittances, the current account as well as the overall balance is likely to deteriorate further from the current surplus position. This pattern is likely to lead to further depletion of foreign reserves. The contraction of foreign reserves will further depreciate the exchange rate of the Taka against major currencies. Domestic currency depreciation could lead to some losses of real income and purchasing power through inflation driven by imported goods.
The fall in exports and remittances may have resulted in about 0.3 million job losses in the last 6 months. There are around 3.0 million people working in more than 5 thousands factories in the RMG sector alone. According to a preliminary estimate, around 20-30 percent of the factories do not have any direct foreign buyers. They just survive by executing sub-contracts of factories who have directs orders from the foreign buyers. As the direct orders for these factories from foreign buyers are drying up, the survival of the sub-contracting factories are in real danger. The current trend shows that the flow of sub-contract is likely to stop due to the global economic downturn. In this context, workers of the sub-contracting firms will lose their jobs immediately as witnessed already. From the above analysis, the most frequently reported estimate of job losses is 10 percent. Assuming the most likely scenario of job losses in the last six months is a 10 percent job losses, say in the RMG sector alone, around 0.3 million new unemployed people have likely been released in the Bangladesh economy. With an average of 1.38 income earner per household of 5 in 2009, and 0.3 million new unemployed workers, around 1.09 million people (i.e. 3.62*0.30 million), are likely to lose their livelihood, with subsequent risks on access to health care, food intake, education, debt and access to other vital services11. The worst case scenario of 20
10 The GDP growth of 6.21 percent achieved in FY08 is taken as a benchmark for FY09, assuming the outlook for agriculture sector is unchanged and a 10 percent drop in the outlook of industry and services sector activities. The direct impact of the global turmoil on manufacturing and trade would cost around 0.47 percentage point reduction in the overall GDP growth (0.47 = 6.21*0.75[share of industry and services sectors to GDP]*0.1). As a result, expected GDP growth in FY09 would be around 5.74 percent (i.e., 6.21-0.47). 11 This estimate is based on the average income earner (1.38) per household of 5 in 2009 (WFP/UNICEF/IPHN, 2009) or alternatively 3.62 people dependent on an employed person.

27
percent job losses as implied by FGDs would double the number of people whose livelihoods are endangered (i.e. 2.18 million)12. Based on the most frequent estimate reported by FGDs, the optimistic scenario of 5 percent job losses over the last 6 months is unlikely.
Expected increase of government spending (in the short term) in terms of rescue package including tax break, cash subsidies and food rationing programs to safeguard the external sector and socially vulnerable people, could lead to monetary financing of increased fiscal deficits beyond the fiscal deficit target of 4.99 percent of the GDP. No inflationary pressure is foreseen in the short run because of the substantial decrease of the import bill in the aftermath of fuel and food price decreases. However inflation will be contained if and only if government spending does not exceed monetary targets. Provisional data show that the growth in tax revenue fell short of its target while expenditure showed high growth resulting in government's bank borrowing above the central bank's monetary program target. This pattern is likely to affect negatively private investment through 'crowding out' effect and inflation through 'seignoriage'13. This may generate some pressure on the overall fiscal deficit by the end of the current fiscal year (June 2009), beyond the target of 4.99 percent of GDP. 5.2. Ongoing Interventions of the Government
The Government of Bangladesh maintains an extensive social safety net system designed to address mainly transient food insecurity, stemming from shocks and setbacks. The Public Food Distribution System (PFDS) is the Government’s main mechanism for addressing household level food access shortfalls. Public food stocks are maintained and used for both ongoing food-based development programmes and for emergency purposes during periods of acute or transitory food insecurity. Although the PFDS has numerous programmes or channels through which food assistance is provided; the bulk of assistance, which covers more than 30 million people, is provided via the following eight channels:
OMS/Open Market Sales VGD/Vulnerable Group Development VGF/Vulnerable Group Feeding FFW/Food for Work TR/Test Relief GR/Gratuitous Relief Food Assistance for CHT Area. Cash for Work.
In order to safeguard the income losses due to the global financial crisis, a decision has been made in March 2009 to scale up and extend the open market sale (OMS) program. The OMS is expected to provide subsidized rice to all workers in the RMG sector. This program is currently under review by the government.
At the macro-economic level, the government of Bangladesh is closely monitoring the day-to-day developments in the major economic indicators. In view of improving the interactions between the business community and the government, a public-private business forum titled 'Bangladesh Better Business Forum' (BBBF) was formed in November 2007. In March 2009, a broad-based national committee ('27-member taskforce') was formed to follow the developments related to the ongoing economic crisis and suggest measures to address the adverse impacts on Bangladesh economy.
In view of safeguarding Bangladesh's key exports such as readymade garments, jute, leather, and frozen foods, a stimulus/rescue package including some form of incentives through tax break, rate cut and cash subsidy are under active consideration.
Besides, in order to protect the loss of future remittance flows, the government of Bangladesh is taking various steps such as facilitating faster and easy transfer of remittances through official channels, finding new labor export markets, and negotiating with migrant workers’ host countries to preserve jobs.
On the other hand, the central bank of Bangladesh recently (March 11, 2009) reduced the repo rates by 25 basis points to 8.5 percent to ease the lending capacity of the commercial banks. Besides, it has been decided to cap lending rate of all types of loans except credit card and consumer loans at 13 percent to offset the fallout of global meltdown. This rate cut is expected to boost credit to the productive and employment intensive sectors. In view of the losses incurred by importers as a result of the fall in global commodity prices (e.g. wheat, edible oil 12 The 20 percent job loss is the second most frequent estimate provided by FGDs. 13 ‘Seignoriage’ is defined as the profit made by a government by issuing currency (the difference or margin between the face value of the currency and its production cost).
28
and pulses) and the difficulties faced by importers in honoring fresh letters of credit (LCs), the central bank has relaxed the conditions for opening fresh LCs from the existing 90 days time to 150 days. The central bank has also set up a Forex Investment Committee to monitor and manage the currency composition of foreign exchange reserves. The central bank withdrew about 90 percent of its total investment from international banks which were perceived to be at risk.
6- Conclusions and Recommendations
The importance of nonfarm and farm employment, including casual labor, in rural and urban areas alike, underscores the need for rapid job creation in services, manufacturing and agriculture sectors to mitigate the adverse implications of the ongoing global financial crisis. Although it is too early to have a thorough insight on the extent of the impact on household livelihoods and food security, the urgent need to take policy initiatives and actions to address the emerging challenges is justified by the fact that the impacts of the global food crisis are compounding the livelihood and food security situation of households most affected by the global food crisis, namely agriculture and non agriculture wage labor and casual laborers. In addition to the efforts being made by the government to mitigate the negative impacts on economic activities, mitigating actions could consider the following:
• Expand and accelerate social protection programs (e.g. nutrition and education) targeting better households most affected both by the food and financial crises such as female-headed households, agriculture and non-agriculture wage earners and casual laborers. Specific targeting of female-headed households reliant on remittances should be considered in specific areas such as in Sylhet division.
• Accelerate the implementation of the Annual Development Plan (ADP) in investing more in labor intensive income generating activities (e.g. basic infrastructure, water supply, sanitation, rural roads and electricity) to mitigate the impacts of job losses in economic sectors and the downturn of the export of migrants.
• Accelerate investment to increase productivity in the agriculture sector to face the lack of arable land and counter production disincentives that are likely to occur with the decrease of agricultural commodity prices as a result of the global economic downturn. Promoting continued productivity growth in agriculture is expected to improve agricultural wages to absorb migrant returnees and less-skilled domestic workers who have lost their jobs in the face of the financial crisis. Diversification into higher value added crops, use of new seed varieties, and technology are crucial in this respect (World Bank, 2008). At the household level, endowment in productive assets – both physical as well as financial (microcredit) capital could be considered as a means to help job losers and returned migrants to set up small businesses and cultivate land.
• There is a momentum for quality investment in migrant workers to reduce the predominance of less skilled migrant workers. While exploring new destinations for migrant workers, there is a general sense in the country that further effort is required to strengthen the skills of candidates for migration. This is seen as a means to increase the likelihood of protecting jobs abroad and entering a new era of quality migration in the aftermath of the global financial crisis.
• Monitor both macro-economic indicators and household food security and nutrition for early actions. At macro-level, the broad-based national committee ('27-member taskforce') formed by the government is expected to follow the developments related to the ongoing economic crisis and suggest measures to address the adverse impacts on Bangladesh economy. To monitor the evolution of the macro-economic and sectoral performance, key signal indicators such as non-performing loans (NPLs), letter of credit opening (LCs), utilization declarations (UDs), general inflation (food and non-food), exchange rate fluctuations, etc. should be carefully monitored. To see whether the slowdown of macro-economic indicators is affecting household food security and livelihoods, the macro-level monitoring should establish the implications for households, including fiscal implications for social safety programs. The micro-level monitoring could benefit from establishing the linkages between the macro-level and micro-level monitoring, by building on existing systems that monitor remittances, out-migration flows, flows of returnees, less-skilled wage rates in nonfarm and farm activities, staple food, cash and livestock prices, nutrition indicators, etc. In this context, a joint follow-up assessment could be envisaged in the second half of 2009 together with the government and others interested partners (e.g. FAO) to evaluate the

29
magnitude of the impact of the global financial crisis on household food security and livelihoods, assuming the crisis will persist.
References
1. 22 April 2006, Golden Tulip (Bel Air Hotel), The Hague. 2. Asian Development Bank, Bangladesh Quarterly Economic Update, December 2008. 3. Bangladesh Bank, Annual Reports (Various Issues). 4. Bangladesh Bank, Bangladesh Bank Quarterly (Various Issues). 5. Bangladesh Bank, Monetary Policy Review and Financial Sector Review (Various Issues). 6. Bangladesh Bank, Navigating the Global Financial Storm: Challenges for Bangladesh, Policy Paper Series 0903:
November 2008. 7. Bangladesh Bank, Recent Employment Situation and Labour Market Developments in Bangladesh, Policy Paper
Series 0807: June 2008. 8. De Bruyn T. (2006): “Dynamics of Remittance Utilization in Bangladesh”, Forum on “Remittances and
Expatriates: Development in Bangladesh”, organised by the Bangladesh Support Group (BASUG), 9. Eurostat, Trade Data Online, 2009, available in the website: ec.europa.eu/eurostat. 10. International Monetary Fund, Article IV Consultation, Country Report No. 334, October 2008. 11. International Monetary Fund, IMF Survey, January 2009. 12. Ministry of Finance, Economic Review (Various issues). 13. Rahman M., K. G. Moazzem and S. S. Hossain, Impact of the Global Financial Crisis on the Employment and
Labour Market of Bangladesh, a Preliminary Assessment, Paper 80, CPD in collaboration with ILO, Dhaka. 14. UNCTAD, Assessing the impact of the current financial and economic crisis on global FDI flows, January 2009. 15. WFP, UNICEF, IPHN, Impacts of Recent Shocks on Food Security and Nutrition in Bangladesh, Joint
Assessment, Dhaka, March 2009. 16. World Bank, Global Financial Crisis: Implications for Bangladesh, (preliminary draft), October 2008, Dhaka:
Bangladesh Resident Mission, World Bank. 17. World Bank, Poverty Assessment for Bangladesh: Creating Opportunities and Bridging the East-West Divide,
November 2008, Bangladesh Development Series, Paper No. 26, Dhaka: Bangladesh Resident Mission, World Bank.
18. World Bank, The Global Economic Crisis: Assessing Vulnerability with a Poverty Lens, 2009, Washington, D.C.

30
Annexes

31
Annex 1. List of Key Informants Met during the Mission
Key Informants’ Organization Key Informants (Name and Position) Meeting Date/Time
1 IMF International Monetary Fund
Mr. Jonathan C, Dunn, Resident Representative 12 March 2009 2:00 pm
2 Bangladesh Bank
Mr. Habibullah Bahar, Economic Advisor Dr. M. Habibur Rahman, Senior Research
Economist, Policy Analysis Unit
12 March 2009 3:00 pm
3 FAO/ NSPCSP National Food Policy capacity Strengthening Programme
Mr. Ciro Fiorillo, Chief Technical Advisor 12 March 2009 4:30 pm
4 CPD Centre for Policy Dialogue
Professor Mustafizur Rahman, Executive Director Dr. Uttam Kumar, Additional Director
15 March 2009 9:00 am
5 BIDS Bangladesh Institute of Development Studies
Dr. Quazi Shahabuddin, Director General Dr. Abdul Hye Mondal, Sr. Research Fellow
15 March 2009 2:30 pm
6 BRAC
Mr. S.N. Kairy, Director Finance Mr. Gunendu K. Roy, Program Head, Ultra Poor
program
16 March 2009 10:00 am
7 FBCCI Federation of Bangladesh Chambers of Chamber and Industries
Mr. Annisul Huq, President Mr. Abu Alam Chowdhury, Vice President Mr. Obaidur Rahman, Director Dr, Monwar Hossain, Head of Research and
Development Mr. Kamran T. Rahman, MD, Pubali Jute Mills
17 March 2009 3:00 pm
8 Ministry of Finance Government of Bangladesh
Mr. Iqbal Abdullah Harun, Sr, Assistant Secretary Md. Muslim Chowdury, Deputy Secretary,
Resource and Debt management Wing.
18 March 2009 9:30 am
9 Ministry of Expatriates’ Welfare & Overseas Employment Government of Bangladesh
Mr. Kazi Abdul Kalam, Deputy Secretary 18 March 2009 10:30 am
10 Bureau of Manpower, Employment and Training (BMET), under Ministry of Expatriates’ Welfare & Overseas Employment
Mr. Salim Reza, Deputy Secretary, Director of Emigration and Protocol
18 March 2009 11:45 am
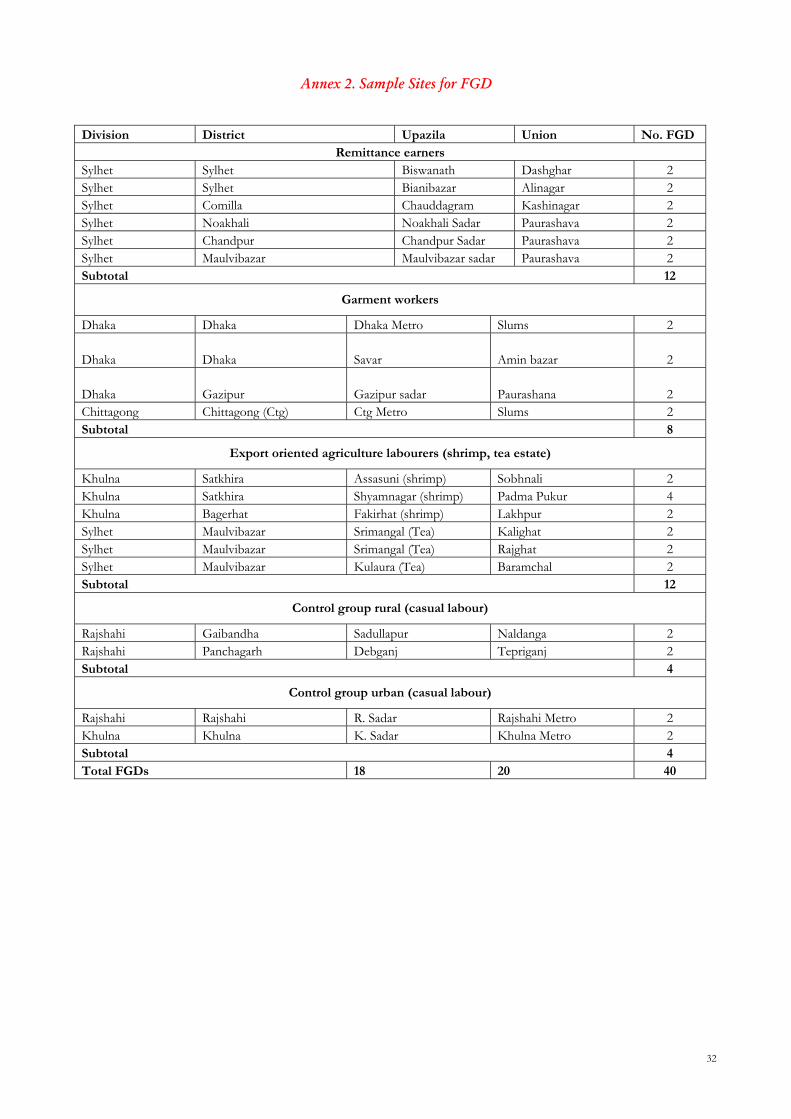
32
Annex 2. Sample Sites for FGD
Division District Upazila Union No. FGD
Remittance earners Sylhet Sylhet Biswanath Dashghar 2 Sylhet Sylhet Bianibazar Alinagar 2 Sylhet Comilla Chauddagram Kashinagar 2 Sylhet Noakhali Noakhali Sadar Paurashava 2 Sylhet Chandpur Chandpur Sadar Paurashava 2 Sylhet Maulvibazar Maulvibazar sadar Paurashava 2 Subtotal 12
Garment workers
Dhaka Dhaka Dhaka Metro Slums 2
Dhaka Dhaka Savar Amin bazar 2
Dhaka Gazipur Gazipur sadar Paurashana 2 Chittagong Chittagong (Ctg) Ctg Metro Slums 2 Subtotal 8
Export oriented agriculture labourers (shrimp, tea estate)
Khulna Satkhira Assasuni (shrimp) Sobhnali 2 Khulna Satkhira Shyamnagar (shrimp) Padma Pukur 4 Khulna Bagerhat Fakirhat (shrimp) Lakhpur 2 Sylhet Maulvibazar Srimangal (Tea) Kalighat 2 Sylhet Maulvibazar Srimangal (Tea) Rajghat 2 Sylhet Maulvibazar Kulaura (Tea) Baramchal 2 Subtotal 12
Control group rural (casual labour)
Rajshahi Gaibandha Sadullapur Naldanga 2 Rajshahi Panchagarh Debganj Tepriganj 2 Subtotal 4
Control group urban (casual labour)
Rajshahi Rajshahi R. Sadar Rajshahi Metro 2 Khulna Khulna K. Sadar Khulna Metro 2 Subtotal 4 Total FGDs 18 20 40

33
Annex 3. Selected Key Macroeconomic Performance Indicators in Bangladesh
FY06 FY07 FY08 FY09 (Dec.) FY09* Growth (in percent) Real Economy
Real GDP 6.63 6.43 6.21 --
6.50 (MoF) 6.00 (BB)
5.6 (ADB) 4.5(WB)
Quantum index of manufacturing output 16.30 11.70 7.80 10.64 (Oct.) -- Cargo handled (export + import) in the port 7.01 7.32 3.35 -5.30(Jul.-Dec.) -- GDP deflator 5.17 6.84 7.69 -- --
CPI (average) 7.16 7.20 9.94 8.90 9.95(IMF) 8.00 (BB)
7.00 (ADB) CPI (point to point) 7.54 9.20 10.04 6.03 --Money and Credit Domestic credit 20.32 14.85 20.95 19.34 20.4
Private sector credit from all banks 18.12 15.01 24.94 21.77 18.50Broad money (M2) 19.29 17.07 17.63 17.88 17.50
Balance of Payments Exports (value) 21.45 15.76 15.70 19.38 15.50Imports (value) 12.06 16.62 25.63 23.25 21.00Remittances 24.79 24.51 32.38 29.36 24.00 As a percent of GDP
Gross domestic investment 24.65 24.46 24.16 -- 24.40 Gross domestic savings 20.30 20.40 20.08 -- 20.20 Budget deficit -3.24 -3.58 -4.85 -2.17 -4.99 Total revenue 10.79 10.47 11.01 5.86 11.31
Tax 8.70 8.31 9.17 3.92 9.26Nontax 2.09 2.16 1.84 1.94 2.05
Total expenditure 14.03 14.05 15.86 8.10 16.30Current expenditure 7.99 8.28 9.23 6.2 10.89Annual Development Program 4.96 5.10 3.15 1.2 4.18
Financing (net) 3.24 3.58 4.85 2.17 4.99Domestic financing 2.02 1.97 2.88 1.46 2.77Foreign financing 1.22 1.61 1.97 0.71 2.22
External current account balance 1.33 1.39 0.85 0.90 0.70 Exchange Rate Nominal (Taka per USD) 69.70 68.80 68.53 68.94 -- REER based exchange rate 58.48 59.55 58.95 61.41 -- REER Index (base FY01=100) 83.90 86.55 86.02 89.09 -- (in millions of U.S. dollars) Gross official reserves 3483.80 5077.20 6148.80 5787.80 --
In term of import months 2.67 3.34 3.22 3.15 --Foreign aid 1567.64 1624.62 1956.70 898.29 --Source: Bangladesh Bank (BB), Ministry of Finance (MoF) Bangladesh Bureau of Statistics (BBS), WB=World Bank, ADB=Asian Development Bank, and IMF=International Monetary Fund. Notes: FY=Financial Year (July-June), *=Target/Projection, and -- = not available.

34
Annex 4. Checklist for Focus Group Discussion
Date: Gender group: Province: Name of Moderator: District: Name of Note Taker: Village: Name of Organizer: City Cluster: Name of Supervisor: Number of Participants: Name of Field Report Writer Introduce yourself and the note taker and read this protocol before you start the discussions – Adapt the below introduction according to your audience (simplify, summarize as necessary) This discussion is intended to assess recent changes in households living conditions such as changes in employment, salaries, wages, remittances, sales etc. In many places of the world, the economy has recessed since September 2008 and this has had some effects on households’ living conditions. For this reason, we are meeting with a number of households in various countries to estimate the possible changes of their living conditions and what should be done about it. We would like the discussion to be informal, so please feel free to intervene at any time and to also respond to comments other people make. If you don’t understand a question, please let us know. We are here to learn from you and make sure that your voices can be heard. All our discussions will be kept confidential, for the sole purpose of our agencies and the identities of the participants will not be disclosed to anyone. We hope you’ll feel free to speak openly and honestly. After reading this protocol, give participants a chance to introduce themselves before you begin. “Let’s find out some more about each other by going around the room one at a time. Tell us your first name, since when you have been living here, how many children do you have and what are your main occupations. 1. LIVELIHOODS AND INCOMES 1.1. At present, what are the 3 major income sources of households like you? Ask them to report by order of importance. Ask then to estimate the contribution of each income source to their total incomes. Use proportional pilling if needed. 1.2. In the last 6 months, have changes occurred in the activities of most of the households in this community?
If no, go to the next question. If yes:
Which types of change have occurred? How many households were concerned by these changes (Estimate the proportion of households whose activities have changed, using
proportional piling if needed). What are the main reasons that have occasioned these changes?
1.3. In the last 6 months, have the cash income levels changed for households like you?
If no, go to the next question. If yes:
How have they changed? (Indicate whether the cash income levels have increased or decreased; Distinguish between “normal” seasonal changes and changes due to other reasons)
What are the main reasons that have occasioned these changes? Are these changes unusual in any way?
2. EMPLOYMENT AND WAGES 2.1. In the last 6 months, have some community members lost their job, including casual work and informal or formal employment?
If no, skip the next question. 2.2. If some have lost their jobs, how many approximately? Estimate proportions of the total number of workers in the community, using proportional pilling techniques if needed 2.3. In which activities job losses have been the most severe? 2.4. What are the main reasons for job losses? 2.5. In the last 6 months, have unskilled wage rates changed?
If no, go to section 3. If yes:
How have they changed? (Distinguish between increase and decrease; And between “normal” seasonal changes and changes due to other reasons)
What are the reasons of these changes? 3. REMITTANCES 3.1. In this community, how many households rely on remittances for their income? Estimate the proportion of households, using proportional pilling if necessary.

35
3.2. What type of remittances do households receive? (Distinguish cash, in-kind etc.) 3.3. Through which channels do households receive their remittances? 3.4. In the last 6 months have the frequency and the amount of remittances received changed?
If no, go to the next question If yes:
Has the frequency changed? (Distinguish between increase and decrease; And between “normal” seasonal changes and changes due to other reasons)
Has the amount changed? (Distinguish between increase and decrease; And between “normal” seasonal changes and changes due to other reasons)
What are the reasons of these changes? 3.5. In the last 6 months, have some community members returned from migration?
If no, go to the section 4 If yes:
How many have returned this time? (Estimate proportions, using proportional pilling if needed) How have the returned numbers changed compared to usually at this time of the year? (Distinguish between increase and
decrease; And between “normal” seasonal changes and changes due to other reasons) Why the number of returned migrants is different compared to usually? (Ask participants to provide the reasons)
4. PRICES 4.1. In the last 6 months, have prices of the food consumed by households in the community changed?
If no, go to the section 5 If yes:
For which food commodities prices have changed? (Check for the 3 most consumed staple foods) How have the prices changed? (For each staple, distinguish between increase and decrease; And between “normal” seasonal changes and
changes due to other reasons) What are the main reasons of the changes? (If changes are different by staple, record reasons for each one of them).
See example below for recording the answers to the three questions above
Name of food Price change (Increase/Decrease/Same, Normal seasonal changes, Unusual) Main reasons for price change
4.2. For staple foods which prices increased, in which months did you feel that the increases were the highest? (Use a calendar. Repeat the calendar for each staple food, if the timing is different.) Example for recording Name of staple food:
Jan Feb Mar Apr May Jun Jul Aug Sep Oct Nov Dec
Name of staple food: Jan Feb Mar Apr May Jun Jul Aug Sep Oct Nov Dec
Name of staple food:
Jan Feb Mar Apr May Jun Jul Aug Sep Oct Nov Dec
5. EXPENDITURES AND CONSUMPTION 5.1. What are the main expenditures of households like you at present? (Use proportional pilling for the various categories – e.g. health, education, transport, food, debt repayment, rent and utilities - and any additional one that the group members may mention) 5.2. What were the relative shares of these expenditures 6 months ago? (Use proportional pilling for the various categories – e.g. health, education, transport, food, debt repayment, rent and utilities - and any additional one that the group members may mention) 5.3. What are the reasons for changes in expenditure shares from 6 months ago? (Ask this question only if you observe some changes in the expenditure shares, comparing answers for 5.1 and 5.2).
See example below for recording the answers to the three questions above Expenditure category At present (%) Six (06) months ago
(%) Main reasons of changes
Health Education
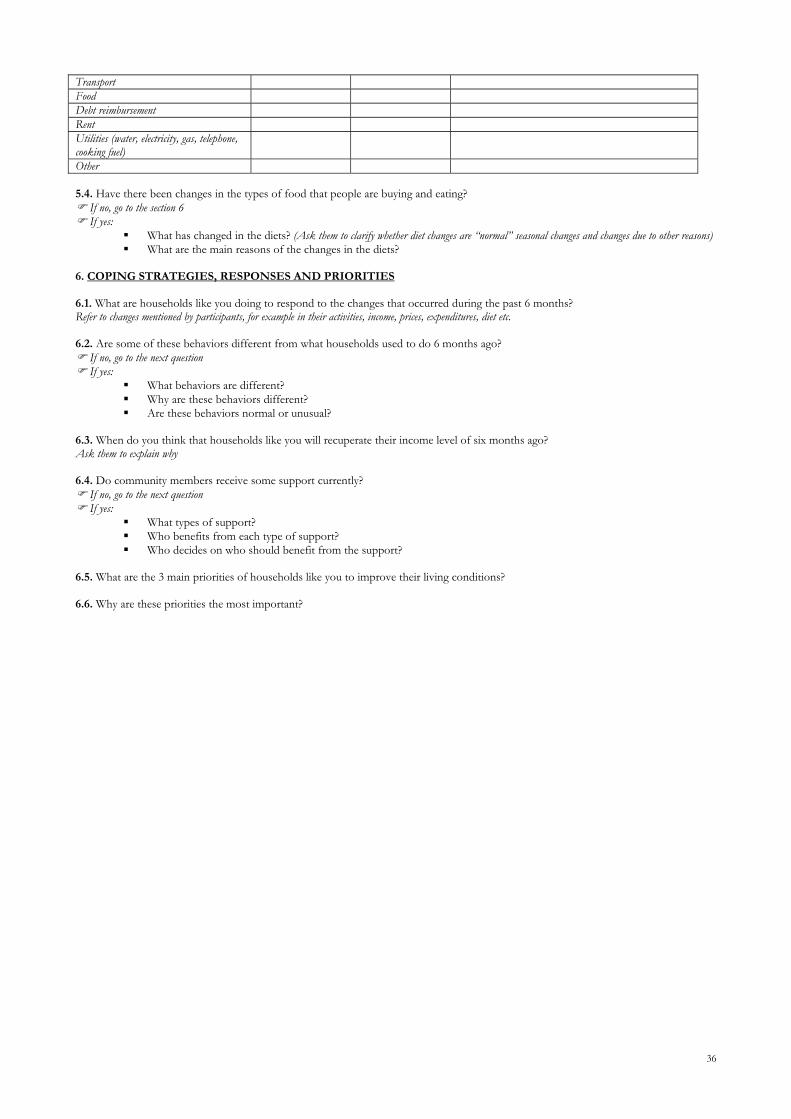
36
Transport Food Debt reimbursement Rent Utilities (water, electricity, gas, telephone, cooking fuel)
Other 5.4. Have there been changes in the types of food that people are buying and eating?
If no, go to the section 6 If yes:
What has changed in the diets? (Ask them to clarify whether diet changes are “normal” seasonal changes and changes due to other reasons) What are the main reasons of the changes in the diets?
6. COPING STRATEGIES, RESPONSES AND PRIORITIES 6.1. What are households like you doing to respond to the changes that occurred during the past 6 months? Refer to changes mentioned by participants, for example in their activities, income, prices, expenditures, diet etc. 6.2. Are some of these behaviors different from what households used to do 6 months ago?
If no, go to the next question If yes:
What behaviors are different? Why are these behaviors different? Are these behaviors normal or unusual?
6.3. When do you think that households like you will recuperate their income level of six months ago? Ask them to explain why 6.4. Do community members receive some support currently?
If no, go to the next question If yes:
What types of support? Who benefits from each type of support? Who decides on who should benefit from the support?
6.5. What are the 3 main priorities of households like you to improve their living conditions? 6.6. Why are these priorities the most important?


![Rapid impact assessment - Ministry of Civil Defence and ... · Rapid Impact Assessment i[IS 14/13] ... gives a broad overview of the concept of rapid impact assessment, ... and prioritise](https://img.pdfslide.us/doc/110x75/5b5b2f2a7f8b9a24038e1c9e/rapid-impact-assessment-ministry-of-civil-defence-and-rapid-impact-assessment.jpg)