Embed Size (px)
Citation preview
Clays and Clay Minerals, Vol. 46, No. 2, 183-194, 1998.
RAPID, ACCURATE PHASE QUANTIFICATION OF CLAY-BEARING SAMPLES USING A POSITION-SENSITIVE X-RAY DETECTOR
MERYL BATCHELDER AND GORDON CRESSEY
Department of Mineralogy, The Natural History Museum, Cromwell Road, London, SW7 5BD, UK
Abstract--The rapid phase quantification method using X-ray diffraction (XRD) with a position-sensitive detector (PSD), outlined by Cressey and Schofield (1996), has been extended to facilitate mineral phase quantification of clay-beating samples. In addition, correction factors for differences in matrix absorption effects have been calculated and applied. The method now enables mudrock mineralogy to be quantified rapidly and efficiently. Using this approach overcomes many of the problems hitherto associated with the quantitative analysis of clay minerals, in particular the effects of preferred orientation of crystallites and variable sample-area irradiation, that make the task of quantification extremely difficult by conventional Bragg-Brentano scanning diffractometry.
Key Words---Absorption Correction, Mudrocks, Position-sensitive Detector. Quantification, X-ray Dif- fraction.
INTRODUCTION
Quantitative analysis of phase proportions by XRD using internal and external standards (Chung 1974a, 1974b) and employing whole-pattern methods (Smith et al. 1987) and Rietveld methods (Hill and Howard 1987; Bish and Howard 1988) are well documented. The quantitative analysis of clay mineral proportions in mixed-assemblage samples has been reviewed by Brindley (1980), Moore and Reynolds (1989), Mc- Manus (1991) and Snyder and Bish (1989).
Many procedures for quantitative analysis rely upon internal standards, laborious sample preparation and tedious data processing. Peak interference and the suit- ability of the standard constitute 2 major obstacles in quantitative analysis. The state of disaggregation, al- teration from chemical pretreatment, particle size sep- aration, preferred orientation of crystallites in the pre- pared sample and the method of assessing clay mineral proportions from the diffraction pattern may all con- tribute to errors in quantification (McManus 1991). Published methods of quantitative analysis for clay- bearing samples commonly result in standard devia- tions of up to 20% (Moore and Reynolds 1989).
Foster and Wolfel (1988) utilized an early, curved PSD system in transmission mode for quantitative analysis. Although the method was rapid, their accu- racy was limited, errors being generated from sample loading and transmission absorption measurements. In the present study, we have acquired XRD data using a curved PSD. Our experiments are in reflection rather than transmission mode, and we calculate matrix ab- sorption correction factors. We employ conventional whole-pattern fitting to analyze these data, and dem- onstrate that the PSD-XRD method is a rapid and ac- curate technique that avoids many of the pitfalls hith-
erto associated with the quantification of clay-bearing samples by XRD.
EXPERIMENTAL
Our quantification method utilizes a curved PSD with an output array consisting of 4096 channels rep- resenting an arc of 120 ~ (0.03 ~ channel width). This detector enables diffraction patterns to be acquired rapidly by measuring diffracted intensity at all angles simultaneously around the 120 ~ arc. The use of an an- ode blade rather than a fragile anode wire within a new generation of such detectors allows reliable, high- precision, high-quality diffraction patterns to be re- corded extremely rapidly. The resolution of the PSD is sufficiently good to record all the subtle details in the inherently broad peak patterns from clays. Our data were collected using an Enraf-Nonius PDS 120 (Powder Diffraction System 120) with a curved PSD and a fixed beam-sample-detector geometry. A ger- manium 111 monochromator was used to select only CuKoq radiation from the primary beam and tube op- erating conditions were 45 kV and 45 mA. Horizontal and vertical slits between the monochromator and sample were used to restrict the beam to 0.24 x 5.0 ram, respectively, and thus, the irradiated area was constant for each experiment. Measurements were made in reflection geometry with the powder sample surface at a fixed angle of ~5 ~ to the incident beam. The sample was rotated continuously in its own plane which statistically increases the number of crystallites orientated in diffracting positions (Brindley 1980). The tilt of the sample surface to the beam was held con- stant during data acquisition, but can be altered by a micrometer adjustment control. This angle can be re- produced with high precision for subsequent experi- ments. If desired, the incidence angle can be chosen to avoid the Bragg angle of a crystallite set lying in
Copyright �9 1998, The Clay Minerals Society 183
184 Batchelder and Cressey Clays and Clay Minerals
preferred orientation. Data acquisition times of only 10 rain were used for the majority of the analyses. NIST silicon powder (SRM 640) was used (unground) as an external standard for the 20 calibration. The 20 linearization was performed with the ENRAF-GUFI software using a least-squares cubic spline function. All mineral standards used in this study are from the mineral collection at the Natural History Museum, London, United Kingdom.
Theoretical Considerations
The diffracted intensity from hkl planes in a single- phase fiat powder sample can be expressed as:
where t is the detector counting time, Io is the direct beam intensity, k is an experimental constant, m is the multiplicity of reflection hkl, Lp is the Lorenz-polar- ization factor, I~ A is the linear absorption coefficient for phase A and V A is the volume of diffracting crys- tals. For phase A in a mixed-assemblage sample, the diffracted intensity will be reduced relative to that re- corded under identical conditions from a sample con- taining 100% A and the ratio of diffracted intensities will be given by:
tZ- = t2]
where I ~ is the diffracted intensity for phase A in the mixture, ~ ' is the linear absorption coefficient of the total matrix and v A is the volume fraction of phase A in the mixture. The diffracted intensity from phase A in a sample diluted by other phases will be reduced in direct proportion to the volume fraction of phase A in the mixture. The intensity observed is also a function of absorption by the sample, the incident beam flux and the total counting time by the detector. The whole diffraction pattern (including sharp and diffuse scat- tering characteristics) from component A in the mix- ture will be proportionally reduced in intensity relative to the standard pattern (100% A). Any part(s) of the diffraction signature can be used to assess the phase proportions. Taking I ~ and V A of the standard as uni- ty, the quantification procedure using whole-pattern assessment can be summarized thus:
\ t /k lo/\t~,j [3]
where X A is the pattern intensity fraction relative to the standard (pure A) and t and t' are the acquisition times of the standard and mixed-assemblage patterns respectively. Io and Io' represent the incident beam flux during acquisition of standard and mixed-assemblage patterns, respectively. This relationship can be used quantitatively, provided that a constant sample volume
is irradiated by the X-ray beam. For phases with sim- ilar linear absorption coefficients we can easily dem- onstrate that application of Equation [3] yields accu- rate quantification of phases in known mixtures. The reproducibility of the results indicates that similar packing densities are achieved and therefore the sam- ple volume irradiated is almost constant. In cases where matrix absorption does affect penetration depth, a correction can be applied after pattern stripping; this aspect is discussed later. Using a PSD system and re- producible sample volume conditions, the diffracted intensity is also proportional to pattern acquisition time. Standard patterns need not necessarily be ac- quired over a counting-time period equivalent to that of any multiphase sample, as patterns to be compared can be proportioned appropriately during data analy- sis. Any differences in incident beam X-ray flux can be taken into account using the method described by Cressey and Schofield (1996) where the backgrounds of the external Si calibrant patterns associated with each experimental session are used as a relative mea- sure of total X-ray flux at the sample.
Sample Preparation
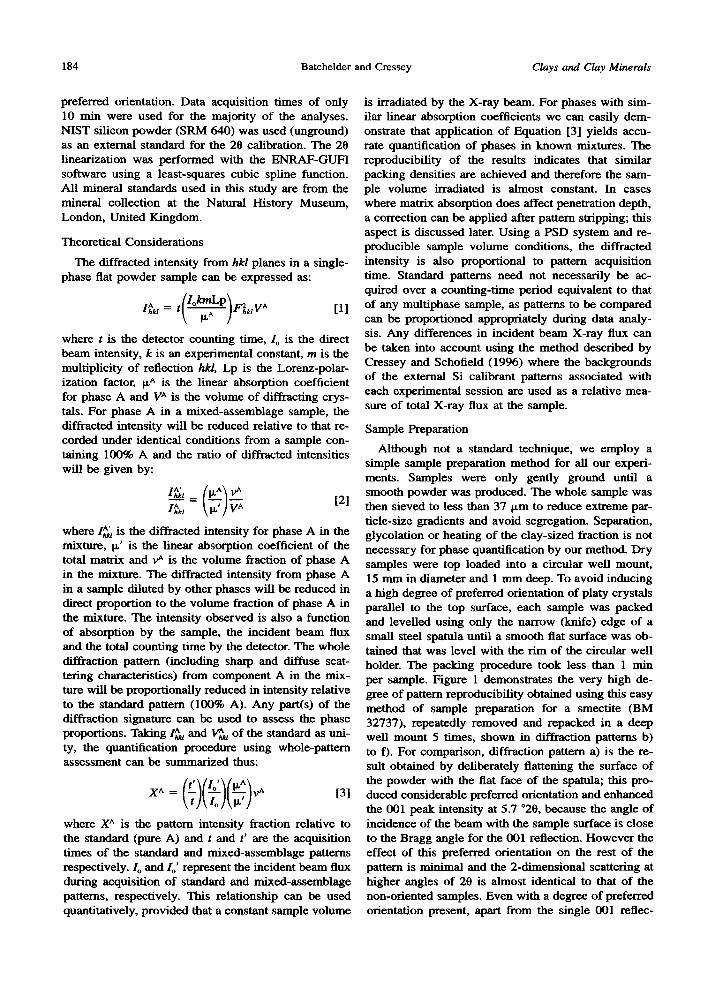
Although not a standard technique, we employ a simple sample preparation method for all our experi- ments. Samples were only gently ground until a smooth powder was produced. The whole sample was then sieved to less than 37 ~m to reduce extreme par- ticle-size gradients and avoid segregation. Separation, glycolation or heating of the day-sized fraction is not necessary for phase quantification by our method. Dry samples were top loaded into a circular well mount, 15 mm in diameter and 1 mm deep. To avoid inducing a high degree of preferred orientation of platy crystals parallel to the top surface, each sample was packed and levelled using only the narrow (knife) edge of a small steel spatula until a smooth flat surface was ob- tained that was level with the rim of the circular well holder. The packing procedure took less than 1 rain per sample. Figure 1 demonstrates the very high de- gree of pattern reproducibility obtained using this easy method of sample preparation for a smectite (BM 32737), repeatedly removed and repacked in a deep well mount 5 times, shown in diffraction patterns b) to f). For comparison, diffraction pattern a) is the re- sult obtained by deliberately flattening the surface of the powder with the flat face of the spatula; this pro- duced considerable preferred orientation and enhanced the 001 peak intensity at 5.7 ~ because the angle of incidence of the beam with the sample surface is close to the Bragg angle for the 001 reflection. However the effect of this preferred orientation on the rest of the pattern is minimal and the 2-dimensional scattering at higher angles of 20 is almost identical to that of the non-oriented samples. Even with a degree of preferred orientation present, apart from the single 001 reflec-
Vol. 46, No. 2, 1998 Position-sensitive XRD for clay quantification 185
I 0,00
~ L~ d. demp well mount
' I ' I ' I ' I ' I 20.00 40.00 2 theta 60.00 80.00 100.0
Figure 1. Diffraction patterns of montmorillonite (BM 32737) repacked 5 times in the same deep-well holder, b) to f); a) is the pattern produced by deliberately flattening the sample surface to induce preferred orientation.
tion, the pattern still portrays diffraction from the crys- tallite set closely representing random orientations. This method of sample preparation is highly repro- ducible and, coupled with the PSD geometry, is po- tentially of great value in constructing a future clay mineral database similar to that of Smith et al. 1995. Unlike scanning diffractometer systems with coupled 0-20 geometry using a fixed 0 incidence geometry, only 1 preferred orientation set (per phase), originating from sample flattening, is ever likely to be in Bragg orientation. This represents a very important differ- ence between the stationary PSD and scanning meth- ods and is one of the main reasons for the much im- proved quantification results reported here.
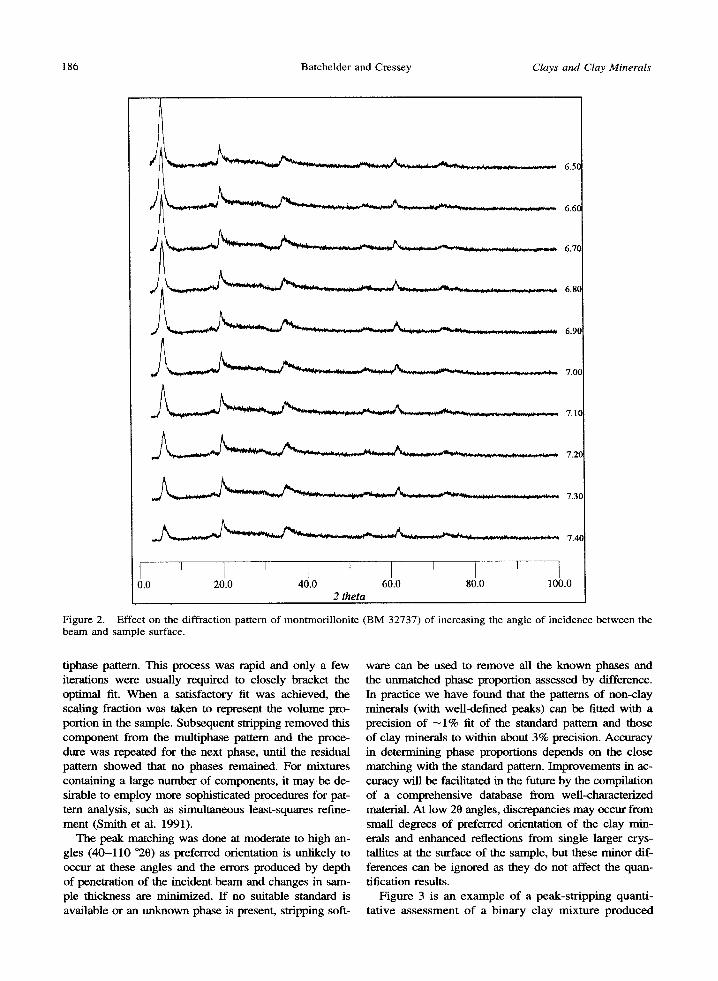
We do not claim to produce mounts with perfectly random orientation of particles; a degree of platelet orientation is present in our dry-packed mounts, as demonstrated by Figure 2. Decreasing the angle be- tween the sample surface and the incident beam in- creases the 001 peak intensity as the Bragg angle is approached at low 0, illustrating the presence of some preferred orientation. Although the 001 peak at low 20 shows considerable variation in intensity with beam incidence angle, the resulting difference in scattering at higher angles of 20 is minimal. This characteristic
of the PSD system allows patterns collected at differ- ent beam-incidence angles to be used in quantification because pattern matching is done at moderate to high 20, the 001 reflection being used only to aid initial clay mineral identification.
DATA ANALYSIS PROCEDURES
Sequential pattern-stripping (subtraction) was per- formed with ENRAF-GUH software in order to identify and subtract each phase present in mixed-assemblage samples until the residual pattern indicated that no phases remained. This process provided a rapid quantitative as- sessment of the mineral phases present. Although the order in which the different minerals were removed did not affect the final quantification, generally the most eas- ily identifiable phases, with sharp peaks, were stripped ftrst, such as quartz and calcite. The remaining clay min- eral phases were removed last as these have variable and broader peaks that required more careful matching to standards in order to minimize errors in quantification. For each phase identified, a single-phase standard pattern from the database, representing 100% of that phase, was superimposed upon the multipbase pattern. We then pro- portionally reduced the standard counts in order to achieve a best match (by eye) to that phase in the mul-
186 Batchelder and Cressey Clays and Clay Minerals
6.5C
6.6(
6.7(
6.8(
6.90
7.00
. d ~ - ~ : . ~ ~ f ~ l l l ~ ~ ~ ~ ~ l i ~ : . ....... '., 7.10
~ : ~ ' ~ - ' - 7.20
7.4(
I ' I ' I I ' I ' f 0.0 20.0 40.0 60.0 80.0 100.0
2 theta
Figure 2. Effect on the diffraction pattern of montmorillonite (BM 32737) of increasing the angle of incidence between the beam and sample surface.
tiphase pattern. This process was rapid and only a few iterations were usually required to closely bracket the optimal fit. When a satisfactory fit was achieved, the scaling fraction was taken to represent the volume pro- portion in the sample. Subsequent swipping removed this component from the multiphase pattern and the proce- dure was repeated for the next phase, until the residual pattern showed that no phases remained. For mixtures containing a large number of components, it may be de- sirable to employ more sophisticated procedures for pat- tern analysis, such as simultaneous least-squares refine- ment (Smith et al. 1991).
The peak matching was done at moderate to high an- gles (40-110 ~ as preferred orientation is unlikely to occur at these angles and the errors produced by depth of penetration of the incident beam and changes in sam- ple thickness are minimized. If no suitable standard is available or an unknown phase is present, stripping soft-
ware can be used to remove all the known phases and the unmatched phase proportion assessed by difference. In practice we have found that the patterns of non-clay minerals (with well-defined peaks) can be fitted with a precision of --1% fit of the standard pattern and those of clay minerals to within about 3% precision. Accuracy in determining phase proportions depends on the close matching with the standard pattern. Improvements in ac- curacy will be facilitated in the future by the compilation of a comprehensive database from well-characterized material. At low 20 angles, discrepancies may occur from small degrees of preferred orientation of the clay min- erals and enhanced reflections from single larger crys- tallites at the surface of the sample, but these minor dif- ferences can be ignored as they do not affect the quan- tification results.
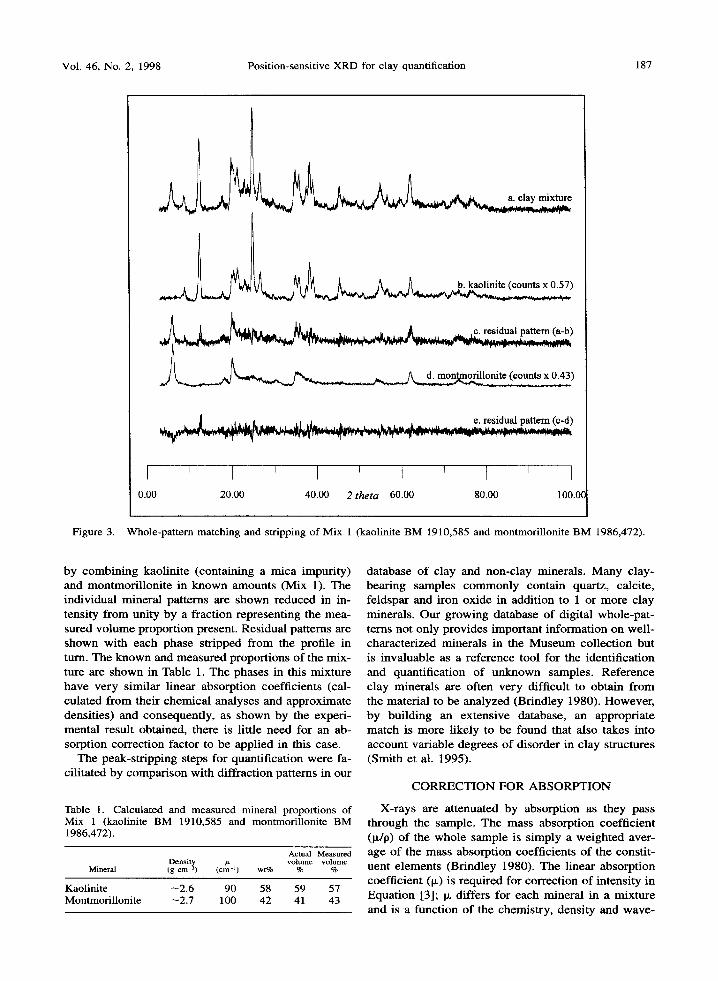
Figure 3 is an example of a peak-stripping quanti- tative assessment o f a binary clay mixture produced
Vol. 46, No. 2, 1998 Position-sensitive XRD for clay quantification 187
)
~ - . - - e. residual pattern (c-d)
I ' I ' I ' I ' I ' I 0.00 20.00 40.00 2 theta 60.00 80.00 100.0~
Figure 3. Whole-panern matching and stripping of Mix 1 (kaolinite BM 1910,585 and montmorillonite BM 1986,472).
by combin ing kaolini te (containing a mica impurity) and montmori l loni te in known amounts (Mix 1). The individual mineral patterns are shown reduced in in- tensity f rom unity by a fraction representing the mea- sured vo lume proport ion present. Residual patterns are shown with each phase stripped f rom the profile in turn. The known and measured proportions of the mix- ture are shown in Table 1. The phases in this mixture have very similar l inear absorption coefficients (cal- culated f rom their chemical analyses and approximate densities) and consequently, as shown by the experi- mental result obtained, there is little need for an ab- sorption correction factor to be applied in this case.
The peak-str ipping steps for quantification were fa- cili tated by compar ison with diffraction patterns in our
Table 1. Calculated and measured mineral proportions of Mix 1 (kaolinite BM 1910,585 and montmorillonite BM 1986,472).
Actual Measured Density ~ volume volume
Mineral (g cm ~) (cm -~) wt% % %
Kaolinite --2.6 90 58 59 57 Montmorillonite ~2.7 100 42 41 43
database o f clay and non-clay minerals. Many clay- bearing samples c o m m o n l y contain quartz, calcite, feldspar and iron oxide in addition to 1 or more clay minerals. Our g rowing database of digital whole-pat- terns not only provides important information on well- characterized minerals in the M u s e u m col lect ion but is invaluable as a reference tool for the identification and quantification of unknown samples. Reference clay minerals are often very difficult to obtain f rom the material to be analyzed (Brindley 1980). However , by building an extensive database, an appropriate match is more l ikely to be found that also takes into account variable degrees of disorder in clay structures (Smith et al. 1995).
C O R R E C T I O N F O R A B S O R P T I O N
X-rays are attenuated by absorption as they pass through the sample. The mass absorption coefficient (Ix/p) of the whole sample is s imply a weighted aver- age o f the mass absorption coefficients of the constit- uent e lements (Brindley 1980). The l inear absorption coeff icient (IX) is required for correct ion of intensity in Equat ion [3]; Ix differs for each mineral in a mixture and is a function of the chemistry, density and wave-
188 Batchelder and Cressey Clays and Clay Minerals
Table 2. Examples of tx for Cu radiation for several non-clay minerals commonly associated with sedimentary rocks.
Densi ty Ix Mineral Formula (g cm 3) (cm ~)
Albite NaAISi308 2.62 90 Anorthite CaAleSi208 2.76 145 Calcite CaCO3 2.71 202 Gypsum CaSOa-2H20 2.32 149 Halite NaCI 2.17 170 Hematite Fe20 ~ 5.26 1140 Orthoclase KAISi308 2.57 123 Quartz SiO2 2.65 97
leng th of rad ia t ion used. Values o f ix for each phase can be ob ta ined by mul t ip ly ing the c o m p u t e d mass absorp t ion coeff ic ient by the dens i ty of the mineral . I f the minera l s in a m i x e d a s semblage sample have s im- i lar l inear absorp t ion coeff ic ients then cor rec t ion for absorp t ion can, to a first approx imat ion , be neglec ted (Cressey and Schof ie ld 1996).
F r o m our exper imen ta l work wi th mix tures o f non- c lay minera l s in k n o w n propor t ions it is obv ious that a cor rec t ion factor mus t be appl ied to accoun t for dif- fe rences in the l inear absorp t ion coeff ic ients o f min- erals that typica l ly occur in s ed imen ta ry rocks. To demons t r a t e this, a b ina ry quar tz-ca lc i te mix ture of k n o w n vo lume rat io 1:1 was ana lyzed and the corre- spond ing m e a s u r e d v o l u m e rat io was found to be 0.64: 1.36, that is, the apparen t p ropor t ion o f calci te is sig- ni f icant ly enhanced , an effect that is wel l k n o w n (Az,i- ro f f and Bue rge r 1958). T he dispar i ty is a consequence of the d i f fe rence in ix for quar tz and calcite; IXQ is 97 c m -1 and ixc is 202 cm-~; the rat io o f IXC/IXQ is 2.08. Table 2 shows the var ia t ion in ix for several non-c lay minera l s c o m m o n l y assoc ia ted wi th clays in sed imen- tary rocks.
To de t e rmine the cor rec t ion factors that mus t be ap- p l ied in order to accoun t for the effect of absorpt ion, a series o f b ina ry mix tures con ta in ing di f ferent pro- por t ions of mine ra l phases wi th d i f ferent ix values was
analyzed. Four series of mix tures were we ighed out: calci te and quar tz (ixc/ixQ = 2.08); hemat i t e and quar tz (ix,/ixo -- 11.75); ca lc i te and g y p s u m (ixc/ixo _ 1.36) and g y p s u m and quar tz (IXG/IXO -- 1.54). The actual vo lume ratios, measu red vo lume rat ios and absorp t ion cor rec t ion factors for the inc rementa l ca l c i t e -qua r t z and h e m a t i t e - q u a r t z mix tures f rom 10% to 90% are g iven in Tables 3 and 4. F r o m these resul ts it is c lear that the exper imenta l ly de t e rmined absorp t ion correc- t ion factors are in exce l len t ag reemen t wi th the theo- ret ical values. On ly in the ex t reme case o f smal l amoun t s of a low absorbe r (quartz) in a h igh ly ab- sorb ing mat r ix (hemat i te ) does the absorp t ion correc- t ion b e c o m e sl ight ly less rel iable, because the errors in exper imen ta l a s sessment b e c o m e large re la t ive to the apparen t amoun t s present .
There fore cor rec t ion for absorp t ion can be calcula t - ed for a theoret ical mix ture o f A and B, f rom their respec t ive absorp t ion coeff ic ients IXA and ixa. Thus , an absorp t ion cor rec t ion d i ag ram can be cons t ruc ted and used to assess the cor rec t ion fac tor requi red to conver t measu red vo lumes to actual vo lumes (Figure 4). To ca lcula te the re la t ionship b e t w e e n the m e a s u r e d vol- u m e and actual vo lume of phase A in a b ina ry mix tu re of A and B, the l inear absorp t ion coeff ic ient of the mix ture (ix') is s imply c o m p u t e d as:
ix, = (xAIXA) + (yBIXB) [4]
where x A and yB are the k n o w n vo lume f rac t ions o f phases A and B, respect ively. The v o l u m e of phase A m e a s u r e d f rom the d i f f rac t ion pa t te rn wil l be g iven by:
IXA A = x A - [ 5 ]
Vmeas ix'
The exper imen ta l da ta p resen ted in Tables 3 and 4 conf i rm Equa t ion [5]. These exper imen t s re la t ing k n o w n to measu red (apparent ) v o l u m e f rac t ions dem- onst ra te that a cor rec t ion fac tor for absorp t ion can be m a d e s imply b y apply ing a s ingle scal ing factor, ix'/ IXA; see Equa t ion [5]. The apparen t in tens i ty o f each
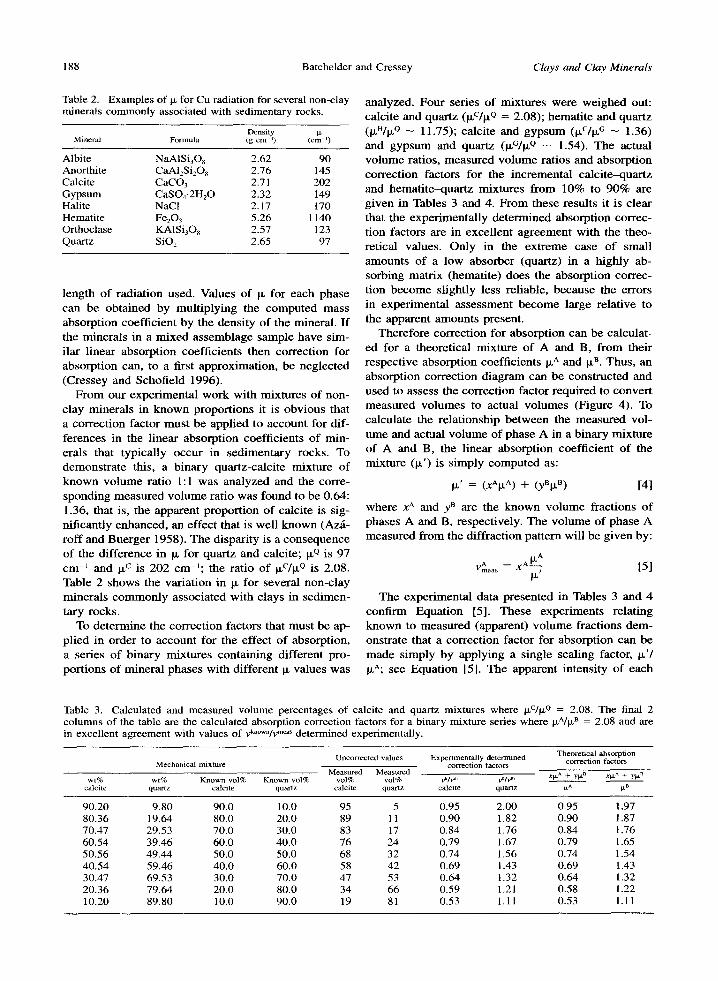
Table 3. Calculated and measured volume percentages of calcite and quartz mixtures where IXC/~LQ = 2.08. The final 2 columns of the table are the calculated absorption correction factors for a binary mixture series where p A/IXB = 2.08 and are in excellent agreement with values of Vk"~ m~` determined experimentally.
Mechanical mixture Uncorrected values Experimental ly determined Theoretical absorption
correction factors correction factors Measured Measured
wt% wt% Known vol% Known vol% vol% vol% Vk/V m V~Iv m XP~A + yixa XIX A + yixR calcite quartz calcite quartz calcite quartz calcite quartz IX ̂ p a
90.20 9.80 90.0 10.0 95 5 0.95 2.00 0.95 1.97 80.36 19.64 80.0 20.0 89 11 0.90 1.82 0.90 1.87 70.47 29.53 70.0 30.0 83 17 0.84 1.76 0.84 1.76 60.54 39.46 60.0 40.0 76 24 0.79 1.67 0.79 1.65 50.56 49.44 50.0 50.0 68 32 0.74 1.56 0.74 1.54 40.54 59.46 40.0 60.0 58 42 0.69 1.43 0.69 1.43 30.47 69.53 30.0 70.0 47 53 0.64 1.32 0.64 1.32 20.36 79.64 20.0 80.0 34 66 0.59 1.21 0.58 1.22 10.20 89.80 10.0 90.0 19 81 0.53 1.11 0.53 1.11
Vol. 46, No. 2, 1998 Position-sensitive XRD for clay quantification 189
Table 4. Calculated and measured volume percentages of hematite and quartz mixtures where I~"/~L Q = 11.75. The final 2 columns of the table are the calculated absorption correction factors for a binary mixture series where irA/it B = 11.75 and are in excellent agreement with values of vkn~ m~ determined experimentally.
Theoretical absoq3tion Uncorrected values Experimentally determined correction factors
Mechanical mixtttrc correction factors Measured Measured
wt% wt% Known vol% Known vol% vol% vol% vklv ~ v~lv m xFta + yI'LB xP~^ + ylx8 hernat, quartz hemat, quartz hemat, quartz hemat, quartz I~ a le a
94.70 5.30 90.0 10.0 99 1 0.91 ~ 10 0.91 10.7 88.81 11.19 80.0 20.0 98 2 0.81 - 10 0.82 9.60 82.24 17.76 70.0 30.0 97 3 0.72 ~ 10 0.73 8.53 74.86 25.14 60.0 40.0 95 5 0.63 8.00 0.63 7.45 66.50 33.50 50.0 50.0 92 8 0.54 6.25 0.54 6.38 56.96 43.04 40.0 60.0 89 11 0.45 5.45 0.45 5.30 45.97 54.03 30.0 70.0 84 16 0.36 4.38 0.36 4.23 33.17 66.83 20.0 80.0 75 25 0.27 3.20 0.27 3.15 18.07 81.93 10.0 90.0 57 43 0.18 2.09 0.18 2.08
phase in the mix tu re is c o m p a r e d di rect ly wi th the in- tens i ty pa t t e rn p roduced b y the pure phase f rom an area of sample i r radia ted equal to the area of mix tu re irradiated. Thus , the scal ing fac tor is a func t ion o f ab- sorpt ion, pack ing dens i ty and surface roughnes s (af- fec t ing b e a m pene t ra t ion and v o l u m e irradiated).
Mic roabso rp t ion (Wi lch insky 1951; H e r m a n and E r m r i c h 1987) is a func t ion o f gra in size and surface roughness o f the sample irradiated, and can lead to an unde res t ima te o f the h igh -abso rbe r phase in a mix tu re i f its cons t i tuen t gra ins are large (Bish and Reyno lds 1989). However , u s ing our m e t h o d of sample prepa- rat ion, we o b s e r v e no ev idence in our quant i f ica t ion resul ts for the effects o f mic roabso rp t ion ar is ing f rom dif ferent surface roughness of s tandard and mix tu re samples . I f mic roabso rp t ion is opera t ive then we are able to ach ieve an equal degree of surface roughness and pack ing in the s tandard and sample exper iments ; wi th a sp inn ing sample , sur face roughnes s effects are ave raged ove r a large area (2xrr a ~- 20 m m 2) re la t ive to the b e a m d i m e n s i o n s of 5 • 0 .24 m m . In our ex- pe r imen t s wi th b i n a r y h e m a t i t e - q u a r t z mixtures , each phase was g round only unt i l smooth , then s ieved to re t r ieve a < 3 7 p,m f rac t ion before h o m o g e n i z i n g the mixture . The major i ty of grains were o b s e r v e d opti- cal ly to b e in the r ange 5 - 2 0 Ixm for bo th hemat i t e and quartz. E v e n us ing Cu rad ia t ion (absorp t ion by hemat i t e max imized) , the effects of mic roabso rp t ion d id not affect the quant i f icat ion. T he resul ts in Tables 3 and 4 demons t r a t e tha t reproduc ib le surface rough- ness and pack ing dens i ty are easi ly achieved, and that apparen t phase propor t ions can be regarded as be ing modi f ied b y mat r ix absorp t ion effects alone.
For a mix ture of A and B in u n k n o w n propor t ions , it is not poss ib le to ca lcula te the actual l inear absorp- t ion coeff ic ient of the mat r ix (pL') f r om Equa t ion [4], because the v o l u m e f rac t ions m e a s u r e d are no t the true values. However , the true ma t r ix absorp t ion coeff ic ient is re la ted to an apparen t ma t r ix absorp t ion coeff ic ient
(IX"), ca lcu la ted f r o m the m e a s u r e d (apparent ) v o l u m e fract ions, by a sca l ing fac tor o f va lue s:
IX' = S[(VAmeas~ a) + (VBm~,sixB)] [61
IX' = Sp~" [7]
The va lue of six" m a y then be subs t i tu ted in Equa t ion [5] and by ca lcula t ing phase propor t ions as ra t ios or as no rma l i zed quant i t ies , the scale fac tor (value s) can- cels out. Thus , the actual v o l u m e f rac t ion x A can b e ca lcu la ted s imply f rom the m e a s u r e d v o l u m e f rac t ions and l inear absorp t ion coeff icients:
A tr A x A = V . . . . ( IX/IX) [8]
VAmeas ( ix " / ix A) + VSmr ( IX "/ IX B)
Resul ts ca lcu la ted for the 2 test mixtures , c a l c i t e - quar tz and hema t i t e -qua r t z , u s ing Equa t ion [8] are s h o w n in Table 5 and indica te tha t this cor rec t ion pro- cedure can be used wi th conf idence , even in the case whe re the cons t i tuen t phases o f the mix tu re h a v e v e r y d i f fe rent absorp t ion coeff icients .
This approach can be ex t ended to any mu l t i phase sys tem and in the genera l case wi th i phases:
IX' = ~ / Xiixi [91 i
and,
wi th
IX" = Z Viixi [ 1 0 ] i
IX' = six"
where xi is the actual v o l u m e fract ion, vi is the mea - sured (apparent ) v o l u m e fract ion, Ixi is the l inear ab- sorp t ion coeff ic ient o f phase i and s is a scale factor. These values can be subs t i tu ted in Equa t ion [5] and propor t ions no rma l i zed to g ive actual v o l u m e frac- t ions:
190 Batchelder and Cressey Clays and Clay Minerals
Figure 4.
100 - "
60 ,~
50
40. ~
30,
20, ~ ,
'~ 10'
0 ~ - , , , , , , , , , ,
l0 20 30 40 50 60 70 80 90 100
Actual volume (%)
..-ii..-0.10
�9 0.20
al, 0.50
�9 0.67
-~t-o.80 --x-I 25 -.o--1.50 ~ 2 0 -.0--50
i-~.--lO.G
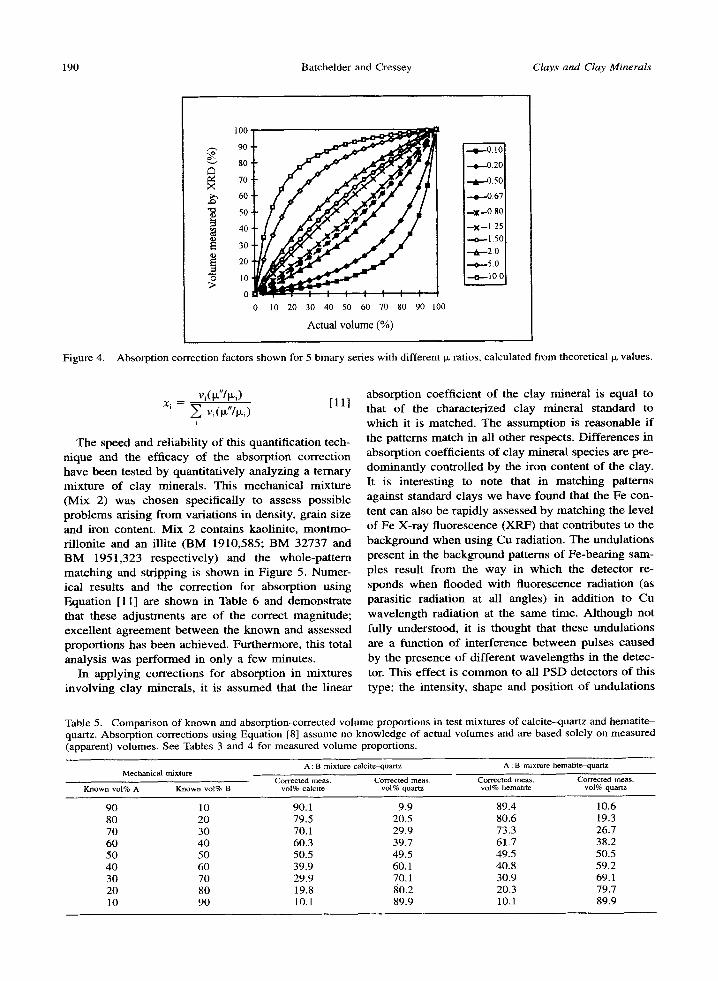
Absorption correction factors shown for 5 binary series with different Ix ratios, calculated from theoretical Ix values.
Vi(~"/~i ) x~ = ~ v~(~"/tx)
i
[11]
The speed and re l iabi l i ty of this quant i f ica t ion tech- n ique and the eff icacy of the absorp t ion cor rec t ion have b e e n tes ted by quant i ta t ive ly ana lyz ing a t e rnary mix tu re of clay minera ls . Th i s mechan ica l mix tu re (Mix 2) was chosen specif ical ly to assess poss ib le p rob l ems ar is ing f rom var ia t ions in densi ty, gra in size and i ron content . Mix 2 conta ins kaolini te , m o n t m o - r i l loni te and an illi te ( B M 1910,585; B M 32737 and B M 1951,323 respec t ive ly) and the whole -pa t t e rn ma tch ing and s t r ipping is s h o w n in F igure 5. Numer- ical resul ts and the cor rec t ion for absorp t ion us ing Equa t ion [11] are s h o w n in Table 6 and demons t r a t e that these ad jus tmen t s are of the correc t magni tude ; exce l len t ag reemen t b e t w e e n the k n o w n and assessed propor t ions has b e e n achieved. Fur the rmore , this total analys is was pe r fo rmed in on ly a few minutes .
In app ly ing cor rec t ions for absorp t ion in mix tures invo lv ing clay minera ls , it is a s s um ed that the l inear
absorp t ion coeff ic ient of the c lay mine ra l is equal to tha t of the charac ter ized clay minera l s tandard to wh ich it is matched . The a s sumpt ion is r easonab le i f the pat terns m a t c h in all o ther respects . Di f fe rences in absorp t ion coeff ic ients o f c lay mine ra l species are pre- dominan t ly cont ro l led by the i ron con ten t of the clay. It is in teres t ing to note that in ma tch ing pa t te rns agains t s tandard clays we h a v e found that the Fe con- tent can also b e rapidly assessed by ma tch ing the level of Fe X- ray f luorescence (XRF) that con t r ibu tes to the b a c k g r o u n d w h e n us ing Cu radiat ion. The undula t ions present in the b a c k g r o u n d pa t te rns of Fe -bea r ing sam- ples resul t f rom the way in w h i c h the de tec tor re- sponds w h e n f looded wi th f luorescence rad ia t ion (as parasi t ic rad ia t ion at all angles) in addi t ion to Cu wave leng th rad ia t ion at the same t ime. A l t h o u g h not fully unders tood , it is t hough t tha t these undu la t ions are a func t ion o f in te r fe rence be tween pulses caused by the p resence o f d i f ferent wave leng ths in the detec- tor. This effect is c o m m o n to all P S D detec tors of this type; the intensity, shape and pos i t ion o f undu la t ions
Table 5. Comparison of known and absorption-corrected volume proportions in test mixtures of calcite-quartz and hematite- quartz. Absorption corrections using Equation [8] assume no knowledge of actual volumes and are based solely on measured (apparent) volumes, See Tables 3 and 4 for measured volume proportions.
Mechanical mixture A : B mixture calcite~luartz A : B mixture hematite-quartz
Corrected meas. Cor rec ted meas . Corrected meas. Corrected meas. Known vol% A Known vol% B vol% calcite vol% quartz vol% hematite vol% quartz
90 10 90.1 9.9 89.4 10.6 80 20 79,5 20.5 80.6 19.3 70 30 70.1 29.9 73.3 26.7 60 40 60.3 39.7 61,7 38.2 50 50 50.5 49.5 49.5 50.5 40 60 39.9 60.1 40.8 59.2 30 70 29.9 70.1 30.9 69.1 20 80 19,8 80.2 20.3 79.7 lO 90 10,1 89,9 10.1 89.9
Vol. 46, No. 2, 1998 Position-sensitive XRD for clay quantification 191
e. residual pattern (a-b)
d. illite (counts x 0.40)
e. residual pattern (e-d)
~ . f. montmorillonite (counts x 0.28)
. ~ g . residual pattern (eft) , . . , JL . , L . . . ~1 . . t . . . . 1 ~ , j . ~J l . . . . L l a~TL .daL . . . . . . . . . ~ . , I ~ , , ~ - -
I ' I ' I I I ' I ).00 20.00 40.00 2 theta 60.00 80.00 100.0
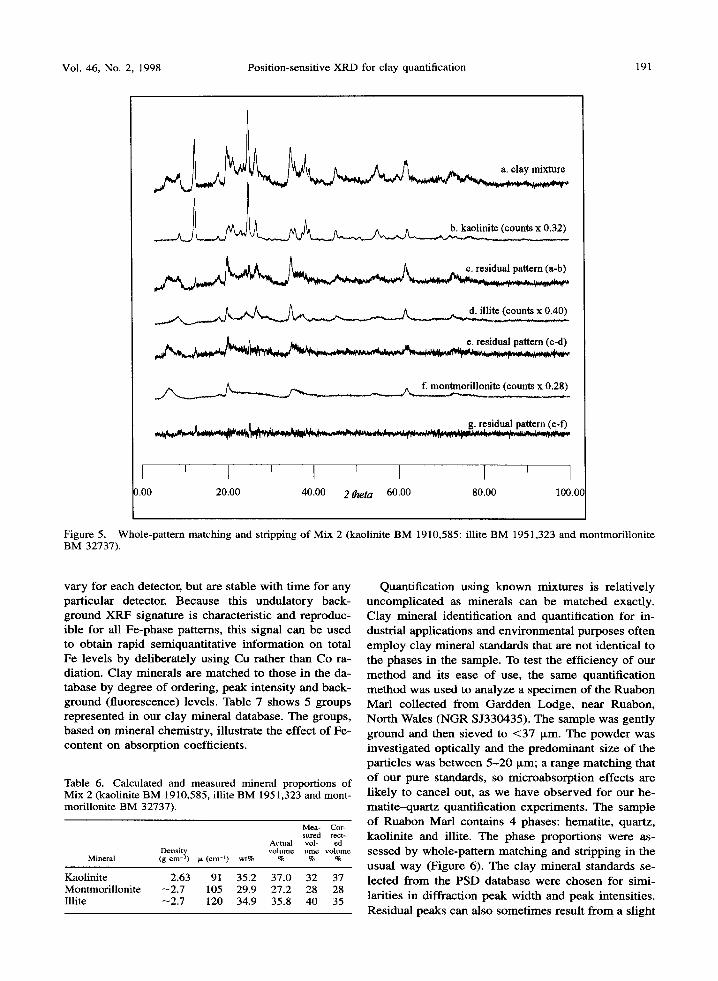
Figure 5. Whole-pattern matching and stripping of Mix 2 (kaolinite BM 1910,585: illite BM 1951,323 and montmorillonite BM 32737).
va ry for each detector, bu t are s table wi th t ime for any par t icular detector. Because this undu la to ry back- g round X R F s ignature is character is t ic and reproduc- ible for all Fe -phase pat terns , this s ignal can be used to ob ta in rapid semiquan t i t a t ive in fo rma t ion on total Fe levels by del ibera te ly us ing Cu ra ther than Co ra- diat ion. Clay minera l s are m a t ched to those in the da- tabase by degree o f order ing, peak in tens i ty and back- g round ( f luorescence) levels. Table 7 shows 5 groups r ep resen ted in our clay m i ne r a l database . T he groups, ba sed on mine ra l chemis t ry , i l lustrate the effect of Fe- con ten t on absorp t ion coefficients .
Table 6. Calculated and measured mineral proportions of Mix 2 (kaolinite BM 1910,585, iUite BM 1951,323 and mont- morillonite BM 32737).
Mea- Cor- surcd rect-
Actual vol- ed Density volume u me volume
Mineral (g crn 3) ~ (cm -t) wt% % % %
Kaolinite 2.63 91 35.2 37.0 32 37 Montmorillonite --2.7 105 29.9 27.2 28 28 Illite --2.7 120 34.9 35.8 40 35
Quant i f ica t ion us ing k n o w n mix tu res is re la t ive ly uncompl i ca t ed as minera l s c an be m a t c h e d exactly. Clay mine ra l ident i f ica t ion and quant i f ica t ion for in- dustr ial appl ica t ions and e n v i r o n m e n t a l pu rposes of ten e m p l o y clay mine ra l s tandards tha t are no t ident ica l to the phases in the sample. To test the ef f ic iency of our m e t h o d and its ease of use, the same quant i f ica t ion m e t h o d was used to ana lyze a spec imen o f the R u a b o n Mar l co l lec ted f r o m G a r d d e n Lodge , near Ruabon , N o r t h Wales ( N G R SJ330435) . The sample was gent ly g round and then s ieved to < 3 7 ixm. The p o w d e r was inves t iga ted opt ical ly and the p r e d o m i n a n t size o f the par t ic les was b e t w e e n 5 - 2 0 )~m; a r ange m a t c h i n g tha t o f our pure s tandards , so mic roabso rp t ion effects are l ikely to cance l out, as we have o b s e r v e d for our he- m a t i t e - q u a r t z quant i f ica t ion exper iments . The sample o f R u a b o n Mar l conta ins 4 phases: hemat i te , quartz , kao l in i te and illite. The phase propor t ions were as- sessed b y whole -pa t t e rn ma tch ing and s t r ipping in the usual way (Figure 6). The clay mine ra l s tandards se- lec ted f rom the PSD da tabase were chosen for s imi- lari t ies in d i f f rac t ion peak wid th and peak intensi t ies .
Res idua l peaks can also some t imes resul t f r om a s l ight
192 Batchelder and Cressey Clays and Clay Minerals
Table 7. Groups of clay minerals used for quantification demonstrating the small standard deviation in linear absorption coefficient for each of the groups.
Low-Fe High-Fe Low-Fe High-Fe Kaolinite illitcs illites rnontrnorillonites montmorillonites
No. samples analyzed 12 12 6 14 6 Average tz/p 32.7 42.5 52.5 36.4 45.0 Limit of laJp all <45 >45 <45 >45 Range of densities 2.60 2.60-2.80 2.60-2.80 2.50-2.90 2.50-2.90 Average p. 86.5 117.3 147.2 98.3 121.4 Standard deviation 0 3.4 3.9 5.8 7.1
20 shift be tween the standard and sample patterns. These mismatches can be explained by imperfect transferability o f the 20 l inearization ftmction be tween samples via the external si l icon standard, probably arising f rom inexact sample height reproducibili ty. He- mati te has an absorption coeff icient approximately 12 t imes that o f the other 3 phases, resulting in an en- hanced measured vo lume for hemati te with respect to quartz, kaolini te and illite. Correct ion for absorption
was achieved using Equat ion [11] and the results are presented in Table 8.
Chemica l analysis by H F digest ion and ICP/AES of this sample o f Ruabon Marl was per formed and the Fe203 content determined to be 6.15 wt%. Recalculat- ing as vo lume percent gives a value of 3.1% Fe203, in excel lent agreement with the X R D quantification o f 3.6% hematite. For naturally occurring, mixed-assem- blage samples a s imple chemical analysis can provide
b. hematite (counts x 0.30)
A .... d. quartz (counts x 0.37)
e, residual pattern (c-d)
_ _ ^ ~ ~ ^ f. kaolinite (counts x 0.18)
g. residual pattern (e-f)
h. illRe (counts x 0.14)
i. residual pattern (g-h)
I I i I I I t t I I
~).00 20.00 40.00 2 thcta 60.00 80.00 100.01
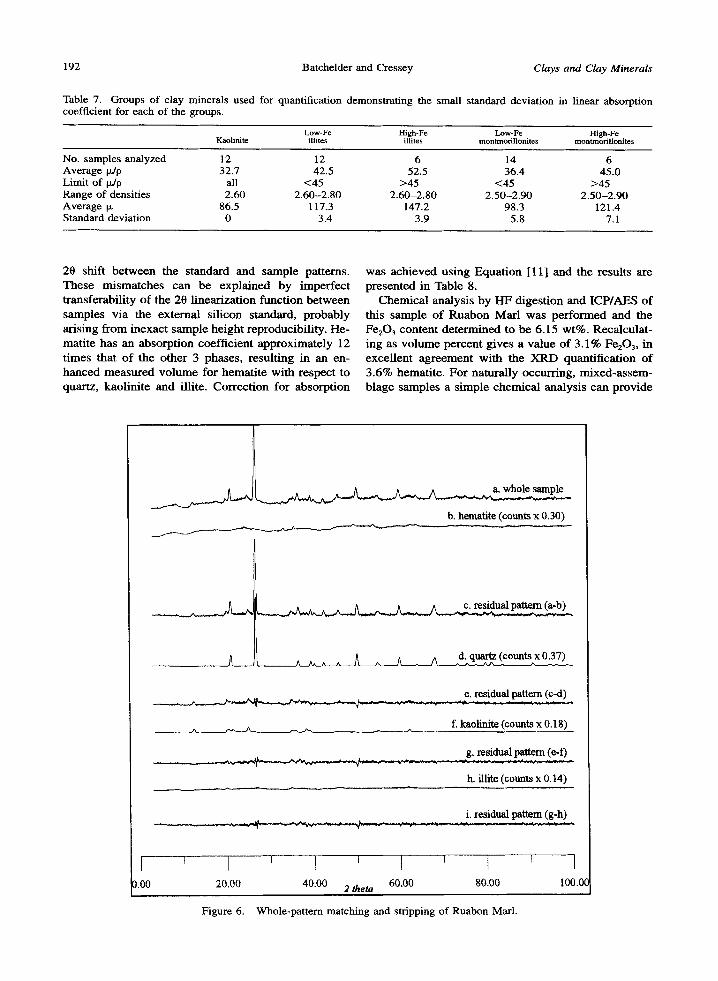
Figure 6. Whole-pattern matching and stripping of Ruabon Marl.
Vol. 46, No. 2, 1998 Position-sensitive XRD for clay quantification 193
Table 8. Measured and absorption-corrected mineral propor- tions determined for the Ruabon Marl.
Density Measured Con'ected Mineral (g cm -3) tt (cm-') volume % volume %
Hematite 5.26 1140 30 3.6 Quartz 2.65 97 37 52.7 Kaolinite ~2.6 ~90 18 27.6 Illite ~2.7 ~ 120 14 16.1
useful corroborat ive informat ion in confirmation o f quanti tat ive estimates. The absorption coefficient of a sample can also be dramatical ly affected by the pres- ence o f small quantifies o f accessory minerals (easily identifiable by analytical SEM), so simple chemica l analyses are always desirable.
C O N C L U S I O N S
In compar ison with other methods o f quanti tat ive analysis, such as the use o f internal standards or Riet- ve ld methods, the technique described here is exceed- ingly rapid and involves only s imple data processing. We have demonstrated that this method overcomes many of the inherent problems associated with quan- tification. The results obtained f rom the analysis o f known mixtures confirms that the technique can be applied with confidence to quant ify natural mudrocks. This alternative method has direct re levance to prob- l em solving associated with the use o f clays in envi- ronmental waste management , the petroleum industry and many other industrial applications.
The P S D quant i f ica t ion p rocedure invo lves pat- tern ma tch ing and pat tern s t r ipping us ing me thods that are we l l es tab l i shed for handl ing d ig i ta l data. However , one area in wh ich our m e t h o d is super ior o v e r that o f Smi th et al. (1987) is that i t requi res no ca l ib ra t ion by spik ing wi th re fe rence in tens i ty ra t io (RIR) mater ia ls . The de tec to r s tabi l i ty and pat tern reproduc ib i l i ty are exce l l en t w h e n us ing the s tat ion- a ry g e o m e t r y o f a P S D sys tem for wh ich pat tern in tens i ty is s imply a func t ion o f acquis i t ion t ime and total X- ray flux. There fo re , who le pat terns can be c o m p a r e d d i rec t ly and rap id ly wi th an ex is t ing who le -pa t t e rn database. We can p rec i se ly r ep roduce pat terns f r o m the same sample in expe r imen t s per- f o r m e d o v e r 1 yea r apart, because any d i f fe rences in total flux can be eas i ly assessed and adjus ted for us ing an (external ) s i l i con standard. Th is means that in the future, pat terns and thei r in tensi t ies acqu i red in d i f fe ren t labora tor ies can be in tens i ty cal ibrated, enab l ing the d i rec t c o m p a r i s o n of pat terns for quan- t i f icat ion purposes . T h e speed o f our m e t h o d is also un ique ; pat tern acquis i t ion t imes o f on ly a few min - utes are suff ic ient for accura te assessment o f phase propor t ions . Our m e t h o d also a l lows cor rec t ions for absorp t ion to be appl ied qu ick ly in a s t r a igh t fo rward m a n n e r f rom first p r inc ip les , p rov ided that the
phases in the mix tu re are ident i f ied and par t ic le s izes o f s tandards and mix tu res are comparab le . Taken co l l ec t ive ly , these factors resul t in a robus t new m e t h o d for phase quant i f ica t ion. In m a n y re- spects, the P S D sys tem is able to p rov ide a be t ter approach to c lay mine ra l s tudies, because h igh ly re- p roduc ib le who le -pa t t e rn data f rom nea r - r andomly or ien ted samples can be acqu i red eas i ly and rapidly. In addi t ion, for the diff icul t task o f quan t i fy ing phase p ropor t ions in c lays and mudrocks , the P S D approach is p rov ing to be par t icu lar ly benef ic ia l .
A C K N O W L E D G M E N T S
The authors wish to extend many thanks to Shanks and McEwan Ltd., especially J. B. Joseph, for providing both fi- nancial support and materials.
REFERENCES
Az,~iroff LV, Buerger MJ. 1958. The powder method. New York: McGraw-Hill. 342 p.
Bish DL, Howard SA. 1988. Quantitative phase analysis us- ing the Rietveld method. J Appl Crystallogr 21:86-91.
Bish DL, Reynolds RC Jr. 1989. Sample preparation for X- ray diffraction. In: Bish DL, Post JE, editors. Modern pow- der diffraction. Washington, DC: Rev Mineral 20. Mineral Soc Am. p 73-97.
Brindley GW. 1980. Quantitative X-ray mineral analysis of clays. In: Brindley GW, Brown G, editors. Crystal struc- tures of clay minerals and their X-ray identification. Lon- don: Mineral Soc. p 411-438.
Chung FH. 1974a. Quantitative interpretation of X-ray dif- fraction patterns of mixtures. I. Matrix flushing method for quantitative multicomponent analysis. J AppI Crystallogr 7:519-525.
Chung FH. 1974b. Quantitative interpretation of X-ray dif- fraction patterns of mixtures. II. Adiabatic principle of X- ray diffraction analysis of mixtures. J Appl Crystallogr 7: 526-531.
Cressey G, Schofield PE 1996. Rapid whole pattern profile- stripping method for the quantification of multiphase sam- pies. Powder Diff 11:35-39.
Foster BA, Wolfel ER. 1988. Automated, quantitative multi- phase analysis using a focussing transmission diffractom- eter in conjunction with a curved position-sensitive detec- tor. Adv X-Ray Anal 31:325-330.
Herman H, Ermrich M. 1987. Microabsorption of X-ray in- tensity in randomly packed powder specimens. Acta Crys- tallogr A43:401-405.
Hill RJ, Howard CJ. 1987. Quantitative phase analysis from neutron powder diffraction using the Rietveld method. J Appl Crystallogr 20:467-474.
McManus DA. 1991. Suggestions for authors whose manu- scripts include quantitative clay mineral analysis by X-ray diffraction. Marine Geol 98:1-5.
Moore DM, Reynolds RC Jr. 1989. X-ray diffraction and the identification and analysis of clay minerals. Oxford: Oxford Univ Pr. 332 p.
Smith DK, Johnson GG Jr, Hoyle SQ. 1991. MATCHDB-- A program for the identification of phases using a digitized diffraction-pattern database. Adv X-Ray Anal 34:377-385.
Smith DK, Johnson GG Jr, Jenkins R. 1995. A full-trace da- tabase for the analysis of clay minerals. Adv X-Ray Anal 38:117-125.
Smith DK, Johnson GG Jr, Scheible A, Wires AM, Johnson JL, Ullmann G. 1987. Quantitative X-ray powder diffrac-

194 Batchelder and Cressey Clays and Clay Minerals
don method using the full diffraction pattern. Powder Diff 2:73-77.
Snyder RL, Bish DL. 1989. Quantitative analysis. In: Bish DL, Post JE, editors. Modern powder diffraction. Washing- ton, DC: Rev Mineral 20. Mineral Soc Am. p 101-142.
Wilchinsky ZW. 1951. Effect of crystal, grain, and particle size on X-ray power diffracted from powders. Acta Crys- tallogr 4:1-9.
(Received 13 May 1996; accepted 1 July 1997; Ms. 2765)


![Building an automated bioinformatician: More accurate ... · -2 [ --mates2 ] arg File containing the #2 mates -o [ --output ] arg Output quantification file. --discardOrphansQuasi](https://img.pdfslide.us/doc/110x75/601d69e5daba9741a1749b85/building-an-automated-bioinformatician-more-accurate-2-mates2-arg-file.jpg)