Embed Size (px)
Citation preview
DOI: 10.4018/JGIM.20210701.oa5
Journal of Global Information ManagementVolume 29 • Issue 4 • July-August 2021
This article, published as an Open Access article on April 30th, 2021 in the gold Open Access journal, the Journal of Global Information Management (converted to gold Open Access January 1st, 2021), is distributed under the terms of the Creative Commons At-
tribution License (http://creativecommons.org/licenses/by/4.0/) which permits unrestricted use, distribution, and production in any medium, provided the author of the original work and original publication source are properly credited.
93
Ranking Influential Nodes of Fake News Spreading on Mobile Social NetworksYunfei Xing, School of Information Management, Central China Normal University, China
Xiwei Wang, School of Management, Jilin University, China
Feng-Kwei Wang, Tunghai University, Taiwan
Yang Shi, University of California, Berkeley, USA
https://orcid.org/0000-0001-9995-4370
Wu He, Old Dominion University, USA
Haowu Chang, College of Computer Science and Technology, Jilin University, China
ABSTRACT
Online fake news can generate a negative impact on both users and society. Due to the concerns with spread of fake news and misinformation, assessing the network influence of online users has become an important issue. This study quantifies the influence of nodes by proposing an algorithm based on information entropy theory. Dynamic process of influence of nodes is characterized on mobile social networks (MSNs). Weibo (i.e., the Chinese version of microblogging) users are chosen to build the real network and quantified influence of them is analyzed according to the model proposed in this paper. MATLAB is employed to simulate and validate the model. Results show the comprehensive influence of nodes increases with the rise of two factors: the number of nodes connected to them and the frequency of their interaction. Indirect influence of nodes becomes stronger than direct influence when the network scope rises. This study can help relevant organizations effectively oversee the spread of online fake news on MSNs.
KeywoRdSComprehensive Influence, Direct Influence, Fake News, Indirect Influence, Influential Nodes, Information Dissemination, Microblog, Mobile Social Networks
1. INTRodUCTIoN
The rapid development of information technology has radically changed the way in which people communicate with each other. Mobile social networks (MSNs) play a crucial role in people’s daily communications, nowadays. A growing number of social network users with similar interests can converse and share information via their mobile devices (Ferreira et al., 2019; Su et al, 2018; Syn & Oh, 2015). According to the latest data from GSMA Intelligence, by the end of 2019, there were 5.19 billion unique mobile phone users in the world, up 100 million from the prior year.
Word-of-mouth communication is becoming much easier, and communication often goes viral in a short period, via simple clicks. However, fake news spread on social networks can be distinctively abrupt and extremely fast-spreading, which can adversely affect the normal social order (Chua & Banerjee, 2018). The term “online fake news” refers to “unconfirmed bits of information” in circulation
Journal of Global Information ManagementVolume 29 • Issue 4 • July-August 2021
94
(Zhao et al., 2016). When disasters or emergencies occur, online fake news can easily trigger public panic that could profoundly threaten social stability. People often share fake news in social groups in which the members are not necessarily familiar with each other. They forward fake news to other individuals or groups without verifying the credibility of the news. Research shows that fake news spreads “significantly farther, faster, deeper, and more broadly” than true news (Vosoughi, Roy, & Aral, 2018). Thus, there is an increasing interest in studying the spread of fake news on social networks (Xu et al., 2017).
Existing studies on fake news spreading largely focus on rumor identification, detection and prediction (Bondielli & Marcelloni, 2019; Xu et al., 2020; Yu et al., 2020; Zhang & Ghorbani, 2020). However, not many studies pay attention to the identification of influential users in the research area of fake news spreading. As fake news spreading is rapid and fluid, the identification and detection of fake news are generally conducted after fake news was spread to some extent. To reduce the spread of fake news on social network, one possible way is to identify those who play influential role in fake news spreading and educate them to check the credibility of news before disseminating news with others. If those influential people on the social network are able to change their behaviors to share or forward fake news, the severity of fake news spreading will be mitigated. To this end, we believe ranking the influence of users in the widespread of online fake news would be a useful technique to reduce future distribution of fake news.
News can reach an even greater number of people instantly (Gao et al., 2018) via MSNs, which usually consist of a huge number of users having something in common, such as careers, projects, common goals, or lifestyles. Influential nodes are those users with greater influence on social networks; their communications are more likely to infect others (Tulu et al., 2018). Given the existence of the internet’ s current dramatic progress, the ability to find the influential nodes on MSNs is becoming more and more critical.
In recent years, much attention has been given to identifying influential nodes on MSNs. A number of approaches and measures have been proposed from a variety of fields, including SNA (centrality analysis), clustering coefficient analysis, and eigenvector analysis (Chen et al., 2017; Wang et al., 2017; Wu et al., 2018). Degree centrality, betweenness centrality, and closeness centrality are the three basic measurements that are used to evaluate the influence of network nodes (Blaszczyk, 2018). The method of clustering coefficient analysis focuses on the network topological structure, the vertex’s local feature, and the connection of the set pair (Sisodia et al., 2016). The method of eigenvector analysis basically analyzes the importance of a network’s quality and the number of connections in the network.
A variety of evaluation models for ranking influential nodes have been proven to be efficient; however, an important question remains: which fundamental rules should the evaluation model follow? To answer this question, we present a novel model for evaluating the influence of individuals on social networks based on the theory of information entropy. The network influence of a node is a measurement of its uncertainty, which is the fundamental law of entropy. We construct a relationship graph to gain a basic understanding of the influence of nodes, and then we provide an innovative approach to ranking influential nodes to learn more about the spreading of fake news on MSNs. We present a model that measures the direct influence, indirect influence and comprehensive influence of nodes on MSNs in order to describe the complexity and the uncertainty of their influence.
Exploring the influence of network users and the spreading of fake news is helpful, in that it reveals public behaviors from the angle of sociology and it provides a theoretical basis for public decision making and the guidance of public opinion. More importantly, we propose a method to more effectively identify key social media users participating in the spreading of rumors by quantifying the influence of various users in rumor diffusion. Targeted managements are recommended to identify influential users who contribute more than others to the fake news spreading. This research can help government and related regulatory units to more effectively reduce the dissemination of online fake news in terms of identifying and educating influential users in spreading fake news.

Journal of Global Information ManagementVolume 29 • Issue 4 • July-August 2021
95
In summary, our research aims to answer the following questions:
1. How to build an evaluation model for ranking influential nodes based on the information entropy theory?
2. How to measure the influence of nodes on fake news spreading on an MSN, using Sina’s Weibo as an example?
3. How to simulate the influence of nodes on an MSN?4. What are the insights of our research for regulatory organizations?
The remainder of this paper is organized as follows. Section 2 provides the related works on fake news, information entropy, and influential nodes. In Section 3, a model for ranking influential nodes on MSNs based on information entropy is provided. In Section 4, the findings are discussed in detail. Section 5 summarizes the findings and section 6 provides the conclusion and the limitations, as well as recommendations for future studies.
2. LITeRATURe ReVIew
2.1 Fake NewsFake news has been defined as “news articles that are intentionally and verifiably false and could mislead readers” (Kim et al.,2019). Fake news has long been a problem, but it became increasingly important since 2016 during the election in United States. The speed with which information can be disseminated on social media creates an opportunity to rapidly spread misinformation. Current research conducted on the spread of fake news include spreading fake news across different democracies (Freelon et al.,2020; Humprecht, 2019), detecting emerging fake news topics (Alkhodair et al.,2020), tracking whether the presence of fake news flag affects users’ cognition and judgment (Moravec et al.,2019), and studying the impact of fake news on users (Rapti et al.,2019). Those studies found that different combinations of cultural and media effects affected the accuracy of deception detection. For example, the nodes in social media were found to have different endurance against the “virus”, and the presence of a fake news flag can increase cognitive activity. Kim & Dennis (2019) investigated whether changing the presentation format to highlight the source of the article affects its believability and how social media users choose to engage with it. Kim (2019) found that source ratings influence social media users’ trust on news and that the rating mechanisms behind the ratings mattered.
Effective management on users and the content of rumor is equally important to fake news detection and prediction (Guo et al.,2018). However, due to massive number of users participating in the spreading of fake news, it is difficult to manage all users on social media. An effective way is to identify influential users in spreading fake news and provide targeted management and education on them.
2.2 Information entropyInformation entropy is an important notion of measuring uncertainty, and it has received a great amount of attention over the past decades. The theory was first proposed by Shannon (Shannon, 1948), and it has been applied in diverse fields to characterize information contents in various models since then. Information entropy has been heavily applied in information research. Chen (2014) proposed a concept called “neighborhood entropy” to evaluate the uncertainty in neighborhood systems and to improve traditional accuracy. Dong (2018) built a hybrid Back Propagation Neural Network model based on information entropy theory to optimize the weights and the thresholds of the network. Sangam (2015) explored a similarity coefficient method based on information entropy and analyzed the time complexity of the k-modes algorithm. Research on the information entropy
Journal of Global Information ManagementVolume 29 • Issue 4 • July-August 2021
96
theory is extensive, yet the applications of this theory to analyze the relationship of network users, as well as the social influence of users, is rare.
Entropy in information theory uses the discrete probability distribution to represent the amount of uncertainty. It quantifies how “informative” the entire random variable is, averaged on all its possible outcomes (Zhao et al., 2015). LetX be a discrete random variable with alphabetX and probability mass function p x X x x X( ) Pr{ }= = ∈� . The entropyH X( )of a discrete random variableX is defined as follows:
H X p x p xx X
( ) ( ) log ( )= −∈∑ 1
The distribution degree of individuals in a population can be calculated based on the information entropy. If the population diversity is high, the corresponding information entropy will be high, and vice versa. A network with smaller entropy has less transitive information, which indicates that the information is more certain.
2.3 Influential NodesNetwork nodes refer to the nodes that have information exchanging behaviors in the networks. Nodes can be workstations, customers, network users, personal computers or servers (Fei et al., 2018; Kauffman & Weber, 2019). The entire network is composed of these network nodes, and they are connected to form a certain geometric relationship. An influential node is treated as the node with great capability that can affect other nodes easily and can spread messages to a large number of users (Fang & Zheng, 2019; Ni et al., 2017). The identification and the specification of influential nodes and their spreading capability are highly needed, in order to improve the quality of network management and regulatory systems. They can also help to maximize the network range and to accelerate the dissemination of public opinion on a complex network. Influential nodes are also associated with the research of online opinion leaders which attracts the attention of many researchers. Online opinion leaders are also called social media influencers who are active on social media or other electronic platforms by posting their opinions about various topics and directing those opinions to their followers (Rosenthal, 2014; Lin et al., 2018). Their recommendations and opinions will influence other followers’ attitudes towards and behavioral intentions on certain topics (Hsu et al.,2013).
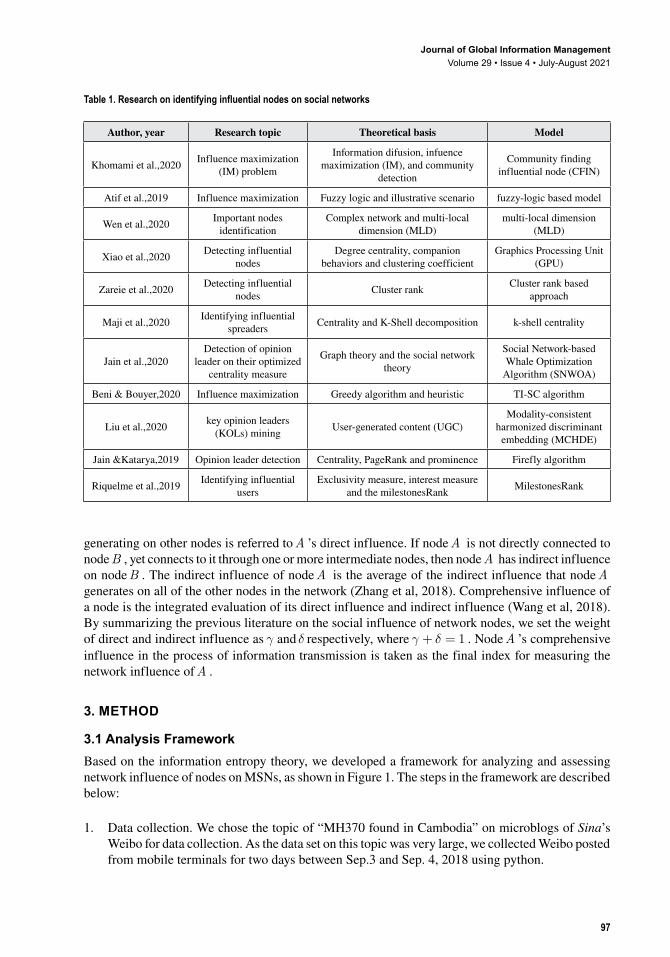
Many studies have focused on influential nodes ranking, in recent years. Zareie (2018) used the k-shell method to present a special hierarchical measure for detecting and ranking nodes’ influence. Mahyar (2018) introduced a novel approach, called DICeNod, to efficiently identify influential nodes in several real-world networks without direct measurement of each node. Hosseini-Pozveh (2017) applied the community structure of social networks and the influence-based closeness centrality measure of the nodes to maximize the spread of influence on the multiplication threshold. Wei (2018) proposed an effective method, based on network representation learning, which takes into account not only the overlapping communities on networks but also the network structure. Recent studies on influential nodes ranking or opinion leader detection are shown in Table 1. Based on various theories, scholars build different models to measure the influence of nodes on the networks, and verify the effectiveness and superiority of those models through experiments. The chart shows that influence maximization is a popular branch on studying the influence of network nodes. However, there has not been a study on measuring the influence of nodes on fake news spreading that is based on information entropy. Applying the information entropy theory to rank network nodes is a novel and innovative way to detect the spreading of fake news online on MSNs.
The influence of nodes can be composed of direct influence, indirect influence, and comprehensive influence (Susarla et al., 2018; Zhong et al., 2018). Specifically, if nodeA is directly connected with several nodes, then it has a direct impact on those nodes. Together, the total impact of nodeA
Journal of Global Information ManagementVolume 29 • Issue 4 • July-August 2021
97
generating on other nodes is referred toA ’s direct influence. If nodeA is not directly connected to nodeB , yet connects to it through one or more intermediate nodes, then nodeA has indirect influence on nodeB . The indirect influence of nodeA is the average of the indirect influence that nodeA generates on all of the other nodes in the network (Zhang et al, 2018). Comprehensive influence of a node is the integrated evaluation of its direct influence and indirect influence (Wang et al, 2018). By summarizing the previous literature on the social influence of network nodes, we set the weight of direct and indirect influence as γ and δ respectively, where γ δ+ = 1 . NodeA ’s comprehensive influence in the process of information transmission is taken as the final index for measuring the network influence ofA .
3. MeTHod
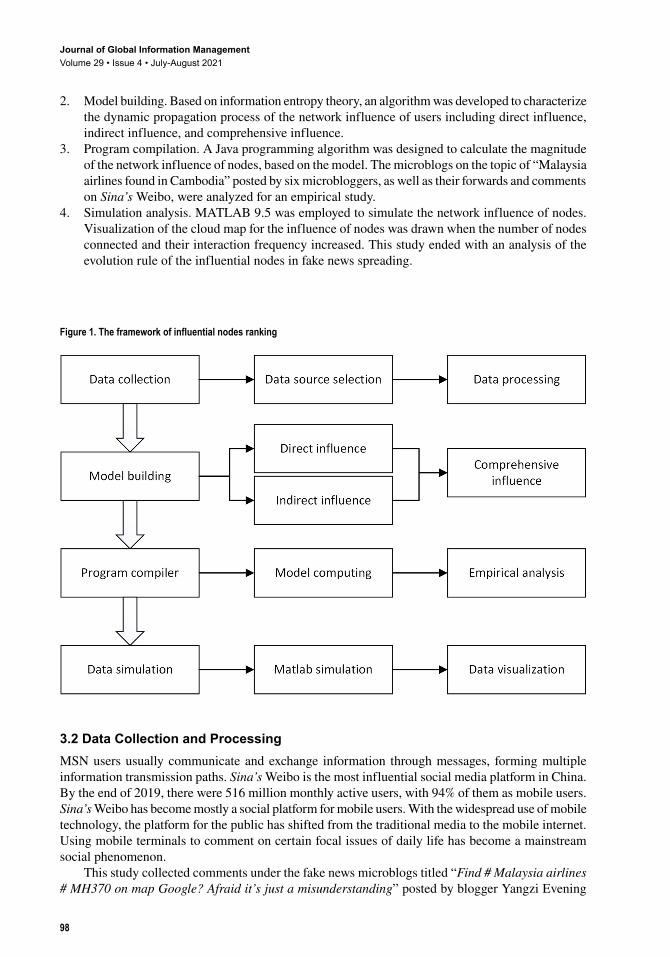
3.1 Analysis FrameworkBased on the information entropy theory, we developed a framework for analyzing and assessing network influence of nodes on MSNs, as shown in Figure 1. The steps in the framework are described below:
1. Data collection. We chose the topic of “MH370 found in Cambodia” on microblogs of Sina’s Weibo for data collection. As the data set on this topic was very large, we collected Weibo posted from mobile terminals for two days between Sep.3 and Sep. 4, 2018 using python.
Table 1. Research on identifying influential nodes on social networks
Author, year Research topic Theoretical basis Model
Khomami et al.,2020 Influence maximization (IM) problem
Information difusion, infuence maximization (IM), and community
detection
Community finding influential node (CFIN)
Atif et al.,2019 Influence maximization Fuzzy logic and illustrative scenario fuzzy-logic based model
Wen et al.,2020 Important nodes identification
Complex network and multi-local dimension (MLD)
multi-local dimension (MLD)
Xiao et al.,2020 Detecting influential nodes
Degree centrality, companion behaviors and clustering coefficient
Graphics Processing Unit (GPU)
Zareie et al.,2020 Detecting influential nodes Cluster rank Cluster rank based
approach
Maji et al.,2020 Identifying influential spreaders Centrality and K-Shell decomposition k-shell centrality
Jain et al.,2020Detection of opinion
leader on their optimized centrality measure
Graph theory and the social network theory
Social Network-based Whale Optimization
Algorithm (SNWOA)
Beni & Bouyer,2020 Influence maximization Greedy algorithm and heuristic TI-SC algorithm
Liu et al.,2020 key opinion leaders (KOLs) mining User-generated content (UGC)
Modality-consistent harmonized discriminant
embedding (MCHDE)
Jain &Katarya,2019 Opinion leader detection Centrality, PageRank and prominence Firefly algorithm
Riquelme et al.,2019 Identifying influential users
Exclusivity measure, interest measure and the milestonesRank MilestonesRank
Journal of Global Information ManagementVolume 29 • Issue 4 • July-August 2021
98
2. Model building. Based on information entropy theory, an algorithm was developed to characterize the dynamic propagation process of the network influence of users including direct influence, indirect influence, and comprehensive influence.
3. Program compilation. A Java programming algorithm was designed to calculate the magnitude of the network influence of nodes, based on the model. The microblogs on the topic of “Malaysia airlines found in Cambodia” posted by six microbloggers, as well as their forwards and comments on Sina’s Weibo, were analyzed for an empirical study.
4. Simulation analysis. MATLAB 9.5 was employed to simulate the network influence of nodes. Visualization of the cloud map for the influence of nodes was drawn when the number of nodes connected and their interaction frequency increased. This study ended with an analysis of the evolution rule of the influential nodes in fake news spreading.
3.2 data Collection and ProcessingMSN users usually communicate and exchange information through messages, forming multiple information transmission paths. Sina’s Weibo is the most influential social media platform in China. By the end of 2019, there were 516 million monthly active users, with 94% of them as mobile users. Sina’s Weibo has become mostly a social platform for mobile users. With the widespread use of mobile technology, the platform for the public has shifted from the traditional media to the mobile internet. Using mobile terminals to comment on certain focal issues of daily life has become a mainstream social phenomenon.
This study collected comments under the fake news microblogs titled “Find # Malaysia airlines # MH370 on map Google? Afraid it’s just a misunderstanding” posted by blogger Yangzi Evening
Figure 1. The framework of influential nodes ranking
Journal of Global Information ManagementVolume 29 • Issue 4 • July-August 2021
99
News on Weibo. This message contained fake content which has been claimed false by Chinese government. However, it attracted great attention and generated a huge influence on social media in many countries before it was claimed to be false. We used the API interface to access the Sina platform, and we collected data between September 3rd and 4th, 2018 by python. The process of collecting data from the mobile environment on this topic is listed here:
1) Check all comments on this microblog and get the corresponding addresses from mobile terminals; 2) If the number of comments is not equal to 0, then the microblog link level is added to 1, and the
“fromUid” field of the information source node is set to the “Uid” of the microblog; 3) Repeat Step 1 and 2 for each comment. If the number of comments is 0, return to this traversal; 4) Retrieve the addresses of all of the comments after completion; 5) Save the results to the Access database.
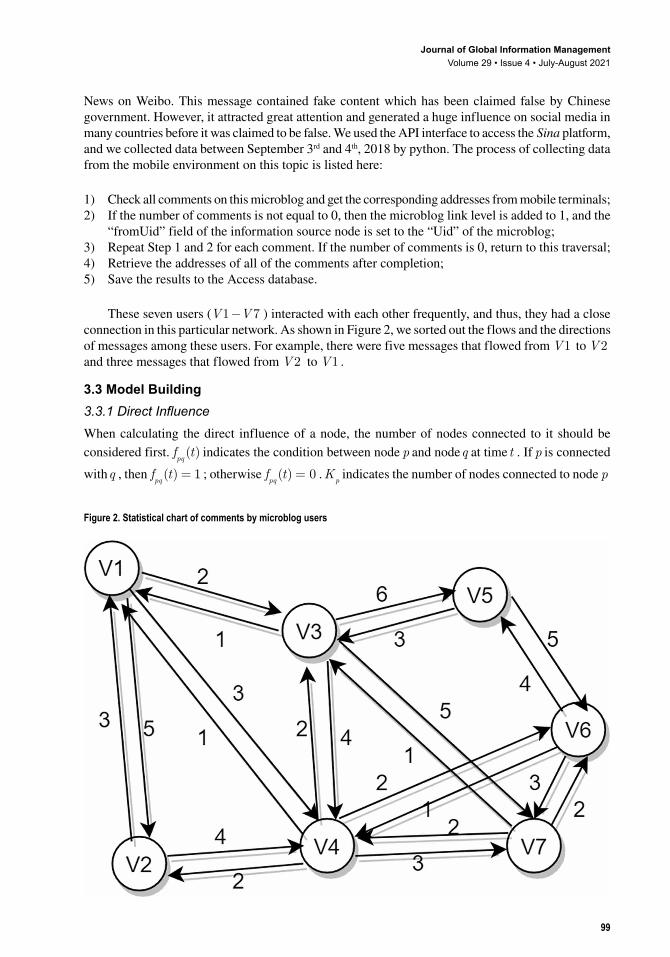
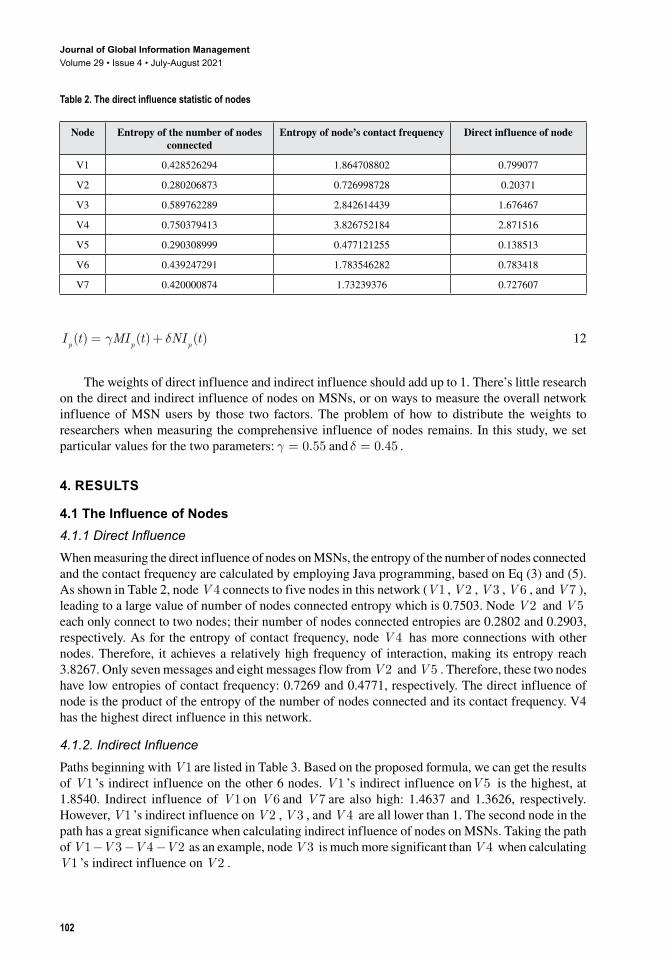
These seven users (V V1 7− ) interacted with each other frequently, and thus, they had a close connection in this particular network. As shown in Figure 2, we sorted out the flows and the directions of messages among these users. For example, there were five messages that flowed from V1 to V2 and three messages that flowed from V2 to V1 .
3.3 Model Building3.3.1 Direct InfluenceWhen calculating the direct influence of a node, the number of nodes connected to it should be considered first. f t
pq( ) indicates the condition between node p and nodeq at time t . If p is connected
withq , then f tpq( )= 1 ; otherwise f t
pq( )= 0 .K
pindicates the number of nodes connected to node p
Figure 2. Statistical chart of comments by microblog users

Journal of Global Information ManagementVolume 29 • Issue 4 • July-August 2021
100
at time t . For instance, if V1 connects to three nodes (V2 , V 3 andV 4 ) at time t , thenK tV 1
3( )=
. Formula forK tp( ) is:
K t f tp pq
q
n
( ) ( )==∑1
(2)
The logarithm is based on 10, and entropy of the number of nodes connected for node p is:
I tK t K tp
c
pp
K t
p
p
( )( )
lg( )
( )
= −+ +=
∑ 1
1
1
11
(3)
Thus, the total value of the entropy of the number of nodes connected for node V1 is:
I t I t I t I tVC
Vc
Vc
Vc
1 2 3 4( ) ( ) ( ) ( )= + + (4)
Then, we analyze the entropy of interaction frequency between nodes.F tpq( ) indicates the
connection between node p andq at time t . For instance, if node V1 comments to V 3 twice, then F tV V1 3
2( )= . Therefore, the entropy of interaction frequency for node p at time t is:
I tF t
F t
F t
F tpf pj
pkk
K tj
K tpj
pkk
i
i
( )( )
( )
lg( )
( )( )
( )
= −
+ +=
=
=∑
∑1 1
1
1
11
K ti ( )
∑ (5)
Thus, the entropy of contact frequency for node V1 is:
I t I t I t I tVF
Vf
Vf
Vf
1 2 3 4( ) ( ) ( ) ( )= + + (6)
Direct influence of node p is the product of the number of nodes connected entropy and its contact frequency entropy, which is:
MI t I t I tp p
CpF( ) ( ) * ( )= (7)
3.3.2 Indirect InfluenceWhen analyzing the indirect influence of nodes, the first consideration is that whether node p and nodeq are connected through other nodes at time t .K t
pq( ) indicates connection between node p and
nodeq . If there is no node connecting them, then K tpq( )= 0 . The indirect influence of node p to
nodeq through other nodes decreases floor by floor, and the degree of declining increases exponentially. It should be noted that nodes which are three or four hops away from the original node have a
low probability to be influenced by the original node. Calculating the influence from the original node to them is time-consuming and may not be necessary (Ma et al., 2017). Also, the hazard rate of
Journal of Global Information ManagementVolume 29 • Issue 4 • July-August 2021
101
each node is multiplicative on the infection times of other previously infected nodes, which is called the cumulative intensity process (Chen et al., 2019). Based on experimental statistics, we find that the declining rate on the path grows very quickly, and at a negative exponent.
The declining rate in this study is set at the level of 1 -0 n . Presume node p and node q are connected by nodek , which means nodek acts as a bridge between those two, then the indirect influence from node p to nodeq is:
NI t I t I tpq pk kq( ) ( ) * ( ) *= +− −10 101 2 8
= +− −MI t MI tp k( ) * ( ) *10 101 2 (9)
In the path of V V V1 3 5− − , the value of indirect influenceV1 generates on V 5 isV1 ’s direct influence multiplied by 10-1 plus V 3 ’s direct influence multiplied by10-2 .NI I t I t MI t MI t
V V V V V V V V V1 3 5 1 31
3 52
11
310 10 10− −− − −= + = +( ) * ( ) * ( ) * ( )) * 10 2− .
Presume node p and nodeq are connected by nodek ,m , andn . That said, nodek , m , andnbuild the bridge between nodes p andq , and then the indirect influence from node p to nodeq is:
NI t I t I t I t I tpq pk km mn np( ) ( ) * ( ) * ( ) * ( ) *= + + +− − − −10 10 10 101 2 3 4 (10)
= + + +− − − −MI t MI t MI t MI tp k m n( ) * ( ) * ( ) * ( ) *10 10 10 101 2 3 4 (11)
In the path of V V V V V V1 4 3 7 6 5− − − − − , the value of the indirect influence V1 generates on V 5 is V1 ’s direct influence multiplied by 10−1 , plus V 4 ’s direct influence multiplied by 10 2− , plus V 3 ’s direct influence multiplied by10 3− , plus V 7 ’s direct influence multiplied by 10−4 , plus V 6 ’ s d i r e c t i n f l u e n c e m u l t i p l i e d b y 10-5 . NI
I t I t I tV V V V V V
V V V V V V
1 4 3 7 6 5
1 41
4 32
3 710 10 1
− − − − −− −
=
+ +( ) * ( ) * ( ) * 00 10 10
10 10
37 6
46 5
5
11
42
− − −
− −
+ +
= +
I t I t
MI t MI tV V V V
V V
( ) * ( ) *
( ) * ( ) * ++ + +− − −MI t MI t MI tV V V3
37
46
510 10 10( ) * ( ) * ( ) *
This method
can be used to calculate V1 ’s indirect influence on V 5 through all paths beginning with node V1 and ending at V 5 . The final indirect influence that V1 generates on V 5 is the sum of the indirect influence through all paths from V1 to V 5 . By calculating the average value of V1 ’s indirect influence on the other six nodes, we can get the final indirect influence of V1 . At last, we can have the indirect influence of all seven nodes in this social network.
3.3.3 Comprehensive InfluenceThe comprehensive influence of a node should be the integrated evaluation of the node’s direct and indirect influence. It refers to the role of a node in the process of information transmission. One occurrence might be this: node p connects to only one nodeq , whereas nodeq connects to thousands of nodes in the social network. Although node p has a low direct influence, it still contains a large indirect influence, and thus it has a relatively high comprehensive influence in that social network. Based on this, node p ’s comprehensive influence at time t is indicated as:
Journal of Global Information ManagementVolume 29 • Issue 4 • July-August 2021
102
I t MI t NI tp p p( ) ( ) ( )= +γ δ 12
The weights of direct influence and indirect influence should add up to 1. There’s little research on the direct and indirect influence of nodes on MSNs, or on ways to measure the overall network influence of MSN users by those two factors. The problem of how to distribute the weights to researchers when measuring the comprehensive influence of nodes remains. In this study, we set particular values for the two parameters: γ = 0.55 and δ = 0.45 .
4. ReSULTS
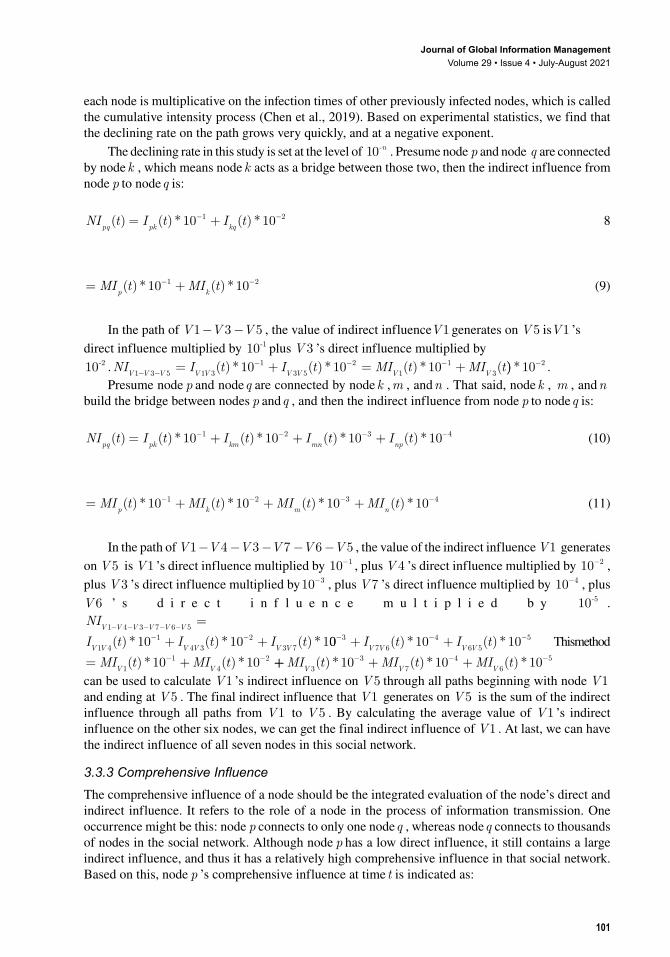
4.1 The Influence of Nodes4.1.1 Direct InfluenceWhen measuring the direct influence of nodes on MSNs, the entropy of the number of nodes connected and the contact frequency are calculated by employing Java programming, based on Eq (3) and (5). As shown in Table 2, node V 4 connects to five nodes in this network (V1 , V2 , V 3 , V 6 , and V 7 ), leading to a large value of number of nodes connected entropy which is 0.7503. Node V2 and V 5 each only connect to two nodes; their number of nodes connected entropies are 0.2802 and 0.2903, respectively. As for the entropy of contact frequency, node V 4 has more connections with other nodes. Therefore, it achieves a relatively high frequency of interaction, making its entropy reach 3.8267. Only seven messages and eight messages flow from V2 and V 5 . Therefore, these two nodes have low entropies of contact frequency: 0.7269 and 0.4771, respectively. The direct influence of node is the product of the entropy of the number of nodes connected and its contact frequency. V4 has the highest direct influence in this network.
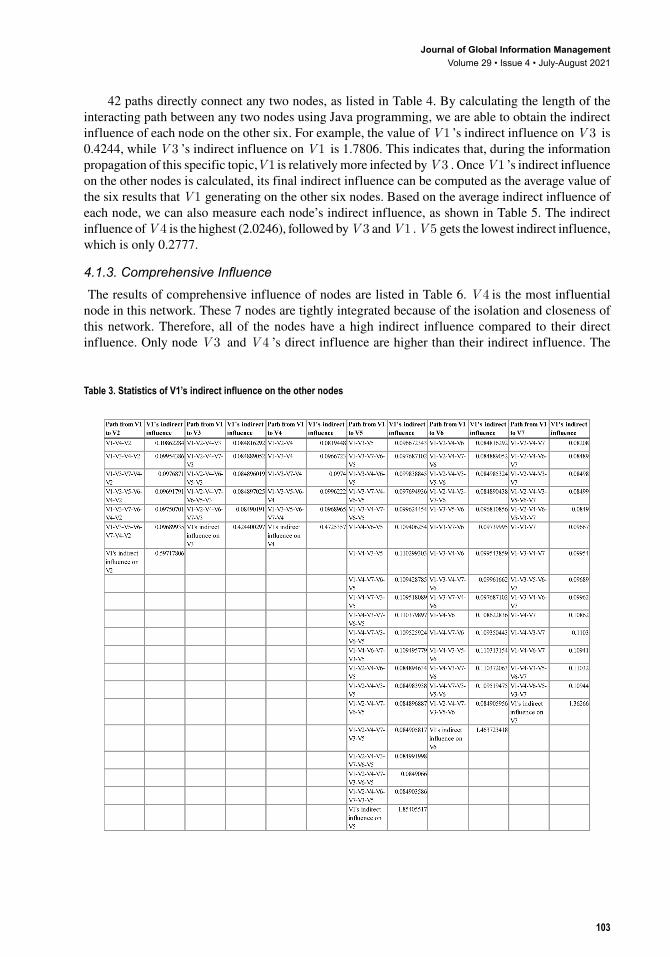
4.1.2. Indirect InfluencePaths beginning with V1 are listed in Table 3. Based on the proposed formula, we can get the results of V1 ’s indirect influence on the other 6 nodes. V1 ’s indirect influence onV 5 is the highest, at 1.8540. Indirect influence of V1 on V 6 and V 7 are also high: 1.4637 and 1.3626, respectively. However, V1 ’s indirect influence on V2 , V 3 , and V 4 are all lower than 1. The second node in the path has a great significance when calculating indirect influence of nodes on MSNs. Taking the path of V V V V1 3 4 2− − − as an example, node V 3 is much more significant than V 4 when calculating V1 ’s indirect influence on V2 .
Table 2. The direct influence statistic of nodes
Node Entropy of the number of nodes connected
Entropy of node’s contact frequency Direct influence of node
V1 0.428526294 1.864708802 0.799077
V2 0.280206873 0.726998728 0.20371
V3 0.589762289 2.842614439 1.676467
V4 0.750379413 3.826752184 2.871516
V5 0.290308999 0.477121255 0.138513
V6 0.439247291 1.783546282 0.783418
V7 0.420000874 1.73239376 0.727607
Journal of Global Information ManagementVolume 29 • Issue 4 • July-August 2021
103
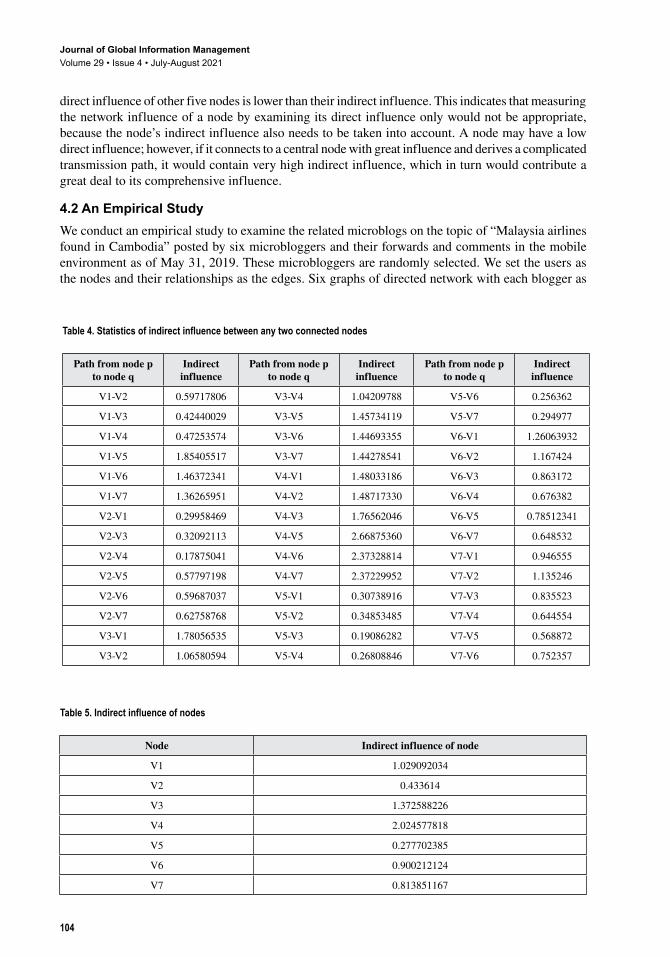
42 paths directly connect any two nodes, as listed in Table 4. By calculating the length of the interacting path between any two nodes using Java programming, we are able to obtain the indirect influence of each node on the other six. For example, the value of V1 ’s indirect influence on V 3 is 0.4244, while V 3 ’s indirect influence on V1 is 1.7806. This indicates that, during the information propagation of this specific topic,V1 is relatively more infected by V 3 . Once V1 ’s indirect influence on the other nodes is calculated, its final indirect influence can be computed as the average value of the six results that V1 generating on the other six nodes. Based on the average indirect influence of each node, we can also measure each node’s indirect influence, as shown in Table 5. The indirect influence of V 4 is the highest (2.0246), followed by V 3 and V1 . V 5 gets the lowest indirect influence, which is only 0.2777.
4.1.3. Comprehensive Influence The results of comprehensive influence of nodes are listed in Table 6. V 4 is the most influential node in this network. These 7 nodes are tightly integrated because of the isolation and closeness of this network. Therefore, all of the nodes have a high indirect influence compared to their direct influence. Only node V 3 and V 4 ’s direct influence are higher than their indirect influence. The
Table 3. Statistics of V1’s indirect influence on the other nodes
Journal of Global Information ManagementVolume 29 • Issue 4 • July-August 2021
104
direct influence of other five nodes is lower than their indirect influence. This indicates that measuring the network influence of a node by examining its direct influence only would not be appropriate, because the node’s indirect influence also needs to be taken into account. A node may have a low direct influence; however, if it connects to a central node with great influence and derives a complicated transmission path, it would contain very high indirect influence, which in turn would contribute a great deal to its comprehensive influence.
4.2 An empirical StudyWe conduct an empirical study to examine the related microblogs on the topic of “Malaysia airlines found in Cambodia” posted by six microbloggers and their forwards and comments in the mobile environment as of May 31, 2019. These microbloggers are randomly selected. We set the users as the nodes and their relationships as the edges. Six graphs of directed network with each blogger as
Table 4. Statistics of indirect influence between any two connected nodes
Path from node p to node q
Indirect influence
Path from node p to node q
Indirect influence
Path from node p to node q
Indirect influence
V1-V2 0.59717806 V3-V4 1.04209788 V5-V6 0.256362
V1-V3 0.42440029 V3-V5 1.45734119 V5-V7 0.294977
V1-V4 0.47253574 V3-V6 1.44693355 V6-V1 1.26063932
V1-V5 1.85405517 V3-V7 1.44278541 V6-V2 1.167424
V1-V6 1.46372341 V4-V1 1.48033186 V6-V3 0.863172
V1-V7 1.36265951 V4-V2 1.48717330 V6-V4 0.676382
V2-V1 0.29958469 V4-V3 1.76562046 V6-V5 0.78512341
V2-V3 0.32092113 V4-V5 2.66875360 V6-V7 0.648532
V2-V4 0.17875041 V4-V6 2.37328814 V7-V1 0.946555
V2-V5 0.57797198 V4-V7 2.37229952 V7-V2 1.135246
V2-V6 0.59687037 V5-V1 0.30738916 V7-V3 0.835523
V2-V7 0.62758768 V5-V2 0.34853485 V7-V4 0.644554
V3-V1 1.78056535 V5-V3 0.19086282 V7-V5 0.568872
V3-V2 1.06580594 V5-V4 0.26808846 V7-V6 0.752357
Table 5. Indirect influence of nodes
Node Indirect influence of node
V1 1.029092034
V2 0.433614
V3 1.372588226
V4 2.024577818
V5 0.277702385
V6 0.900212124
V7 0.813851167

Journal of Global Information ManagementVolume 29 • Issue 4 • July-August 2021
105
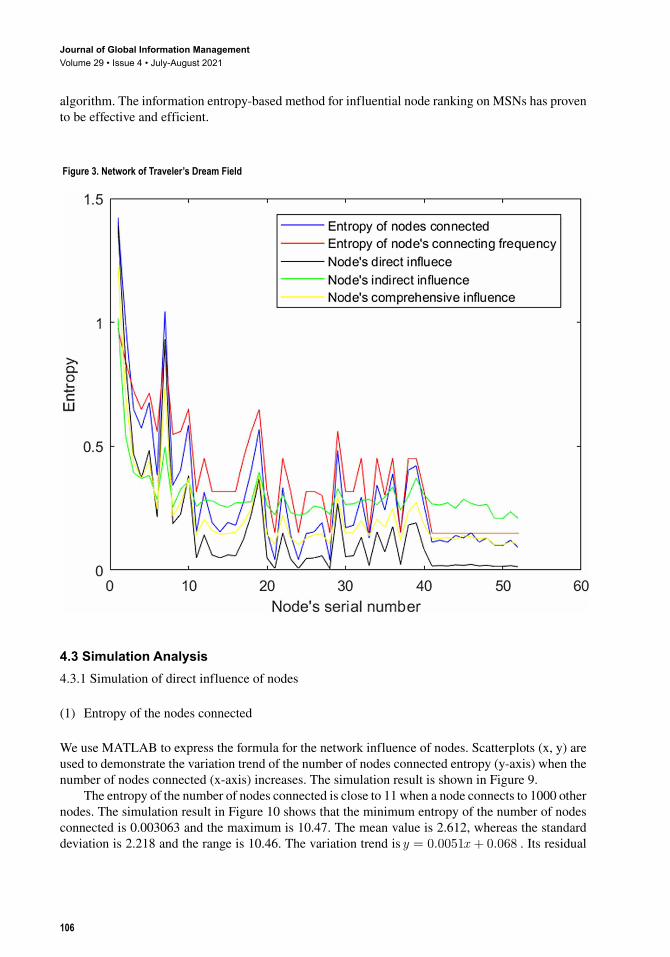
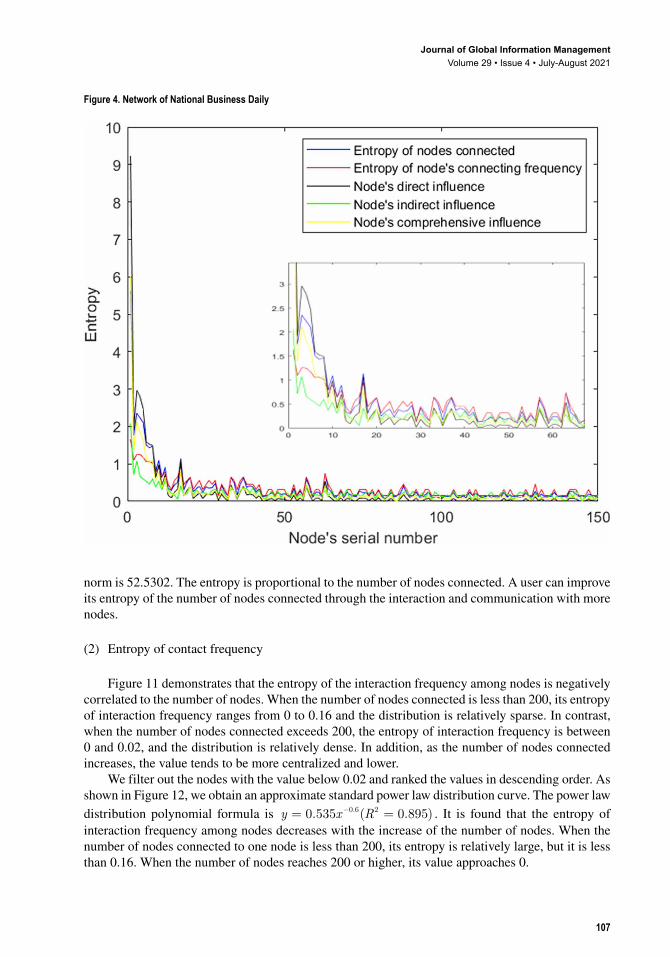
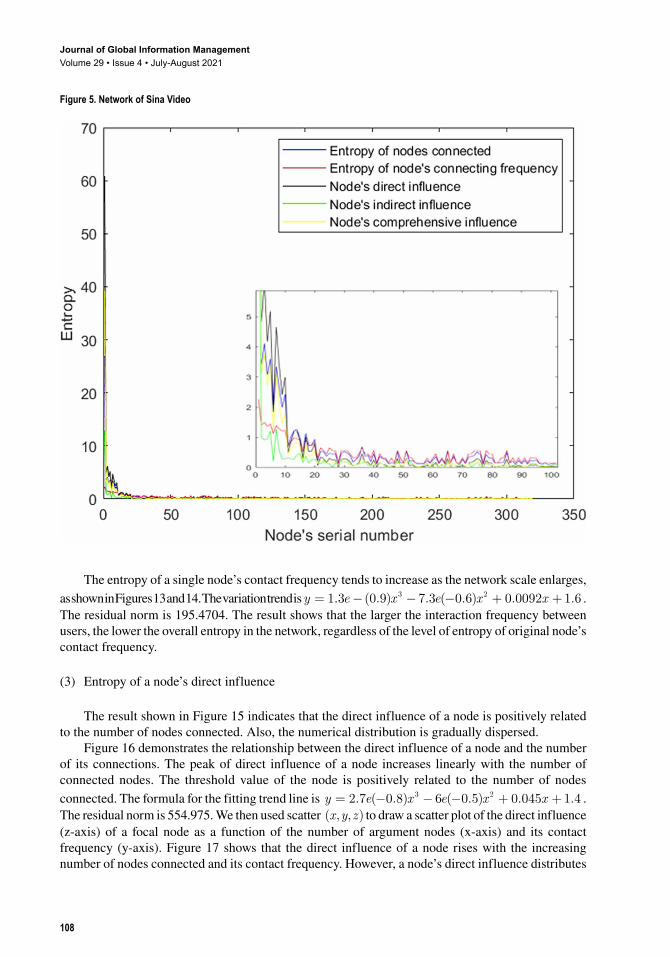
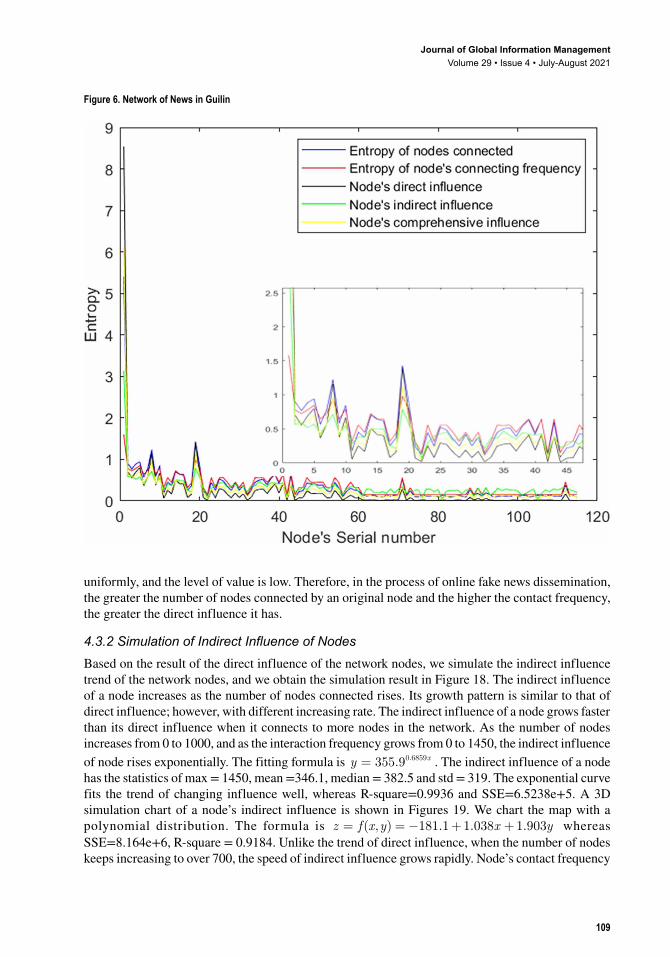
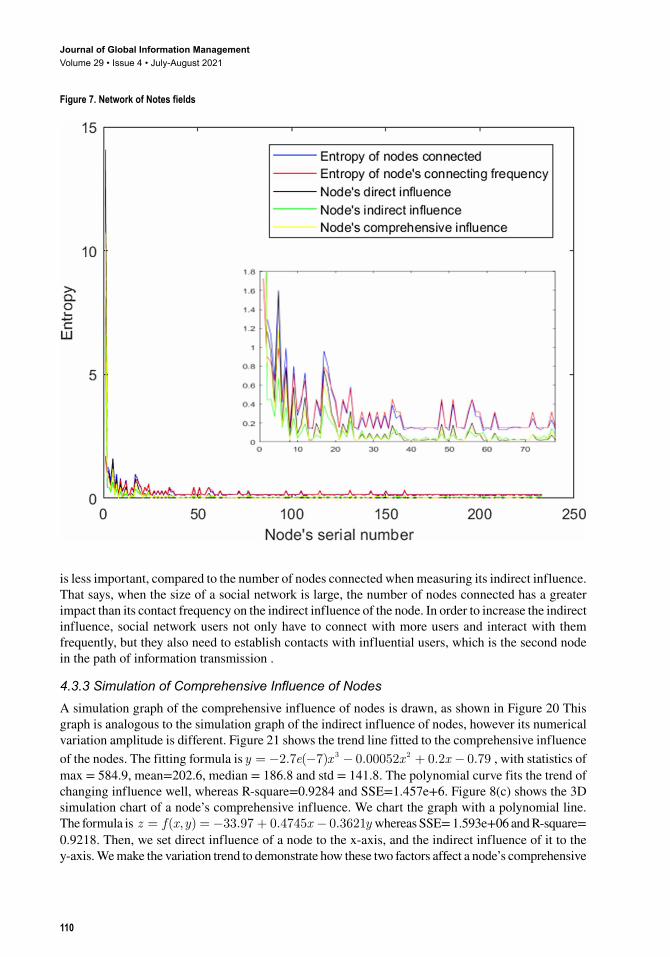
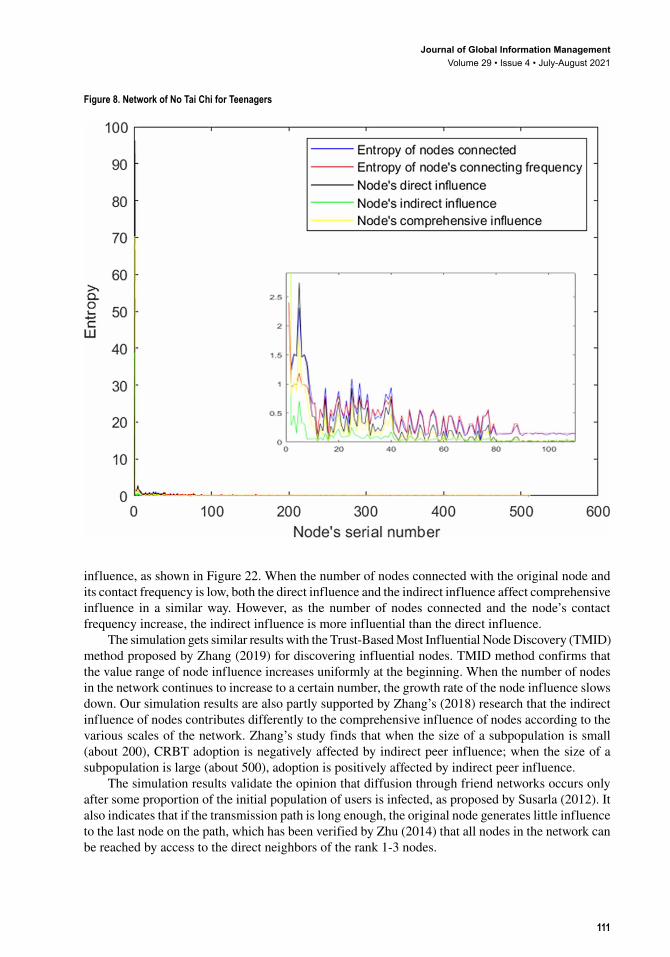
the network center are drawn and could be seen in Figure 3. The six bloggers are ‘Traveler’s Dream Field’ (52 users participating in the discussion and 153 directed edges),‘National Business Daily’(115 nodes and 353 edges), ‘Sina Video’ (150 nodes and 466 edges), ‘News in Guilin’ (233 nodes and 398 edges), ‘Notes Fields’ (513 nodes and 1155 edges) and ‘No Tai Chi for Teenagers’ (593 nodes and 1356 edges). Users are ranked based on their degree, from high to low. The serial number 1 is the blogger. Usually, the user with the first serial number has the highest degree of influence, and the user with the last serial number has the lowest degree of influence. Based on our model for influential nodes ranking, the influence of users in these six networks is calculated.
The results reveal that the network influence of a central node is positively correlated to the size of the network. For example, the number of forwards and comments on blog posted by ‘Traveler’s Dream Field’ is low, resulting in a low influence of the blogger, at 1.5. ‘No Tai Chi for Teenagers” is the most influential blogger (approximately 100) with the most forwards and comments. When the network size is around 150 users, the influence of the blogger is about 9. When the network size is around 250, the influence of the blogger is close to 15. When the network size is around 350, the influence of the blogger exceeds 60. The larger the scale of the network, the higher the overall influence of the blogger.
The network influence of a focal node is not solely positively correlated with its entropy of the nodes connected. A user with high entropy usually has a greater influence. However, the influence of the user with high entropy is not necessarily greater than those with relatively low entropy. On one hand, although a node connects to other nodes in low numbers, it interacts with them frequently, it still can hold a high influence. On the other hand, if a node extends many long transmission paths which have many other nodes on those paths, it tends to have a high indirect influence, although its direct influence may be low. The influence distribution of a node is concentrated when the entropy of the nodes connected on the network is low, as shown in Figure 3. The influence distribution is scattered when the entropy of number of nodes connected varies greatly, as shown in Figures 4, Figure 5, Figure 6, Figure 7, and Figure 8.
While the nodes randomly choose their neighbors, the important nodes in the network ranked by the model proposed in this paper are quite similar to the results of degree, betweenness, closeness, and spreadrank proposed by Zhu (2014). The value of a node’s comprehensive influence based on information entropy and its spreadrank based on continuous-time Markov chain, both correlate closely with the degree of the nodes. This also verifies Susarla’s (2012) hypothesis that a channel’s centrality in the local friend network has a positive impact on the rate of diffusion in the later stages of the process of diffusion. Centrality analysis only considers the direct influence of node, including in-degree and out-degree algorithm. However, it fails to take the indirect influence of a node on social networks in to account. Peng’s (2017) research finds that the influence spread of the entropy-based algorithm increases more quickly than that of the random algorithm and that of the degree-based
Table 6. Comprehensive influence of nodes
Node Direct influence Indirect influence Comprehensive influence
V1 0.799077 1.029092 0.902584
V2 0.20371 0.433614 0.307167
V3 1.676467 1.3725882 1.539721
V4 2.871516 2.0245778 2.490394
V5 0.138513 0.2777024 0.201148
V6 0.783418 0.9002121 0.835975
V7 0.727607 0.8138512 0.766417
Journal of Global Information ManagementVolume 29 • Issue 4 • July-August 2021
106
algorithm. The information entropy-based method for influential node ranking on MSNs has proven to be effective and efficient.
4.3 Simulation Analysis4.3.1 Simulation of direct influence of nodes
(1) Entropy of the nodes connected
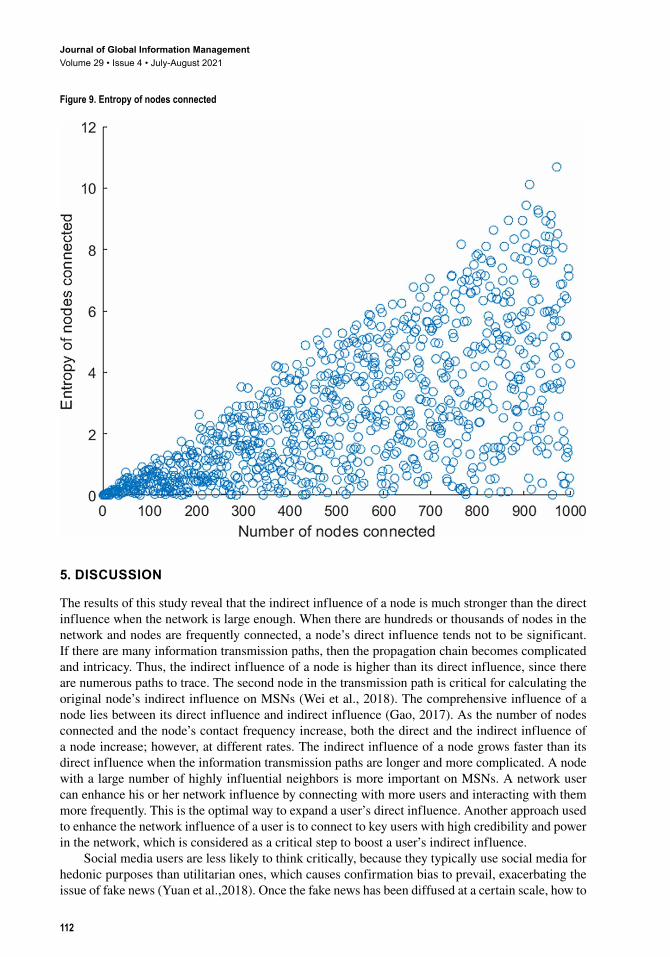
We use MATLAB to express the formula for the network influence of nodes. Scatterplots (x, y) are used to demonstrate the variation trend of the number of nodes connected entropy (y-axis) when the number of nodes connected (x-axis) increases. The simulation result is shown in Figure 9.
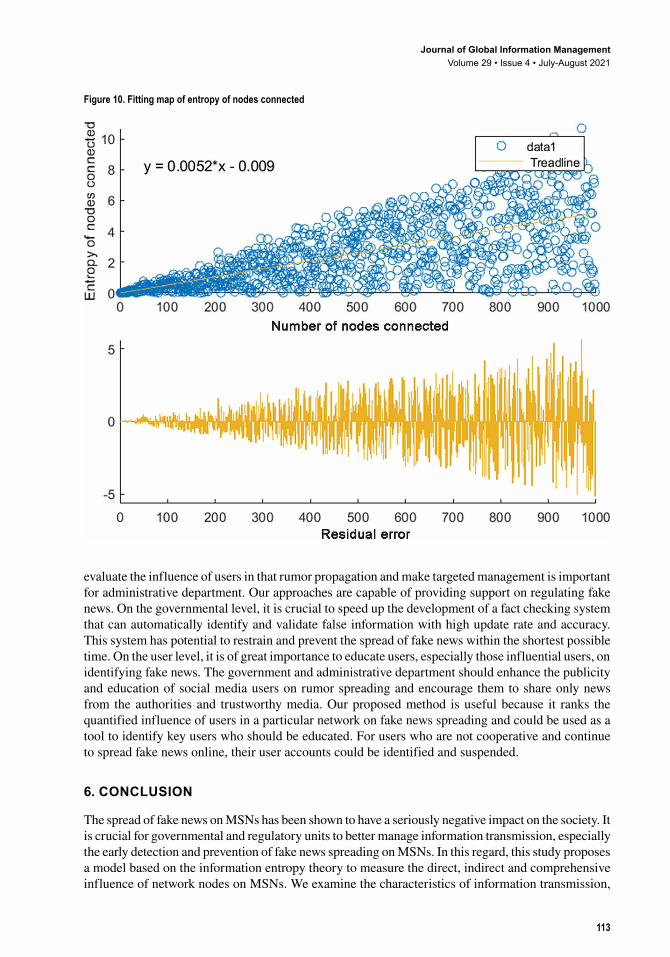
The entropy of the number of nodes connected is close to 11 when a node connects to 1000 other nodes. The simulation result in Figure 10 shows that the minimum entropy of the number of nodes connected is 0.003063 and the maximum is 10.47. The mean value is 2.612, whereas the standard deviation is 2.218 and the range is 10.46. The variation trend isy x= +0 0051 0 068. . . Its residual
Figure 3. Network of Traveler’s Dream Field
Journal of Global Information ManagementVolume 29 • Issue 4 • July-August 2021
107
norm is 52.5302. The entropy is proportional to the number of nodes connected. A user can improve its entropy of the number of nodes connected through the interaction and communication with more nodes.
(2) Entropy of contact frequency
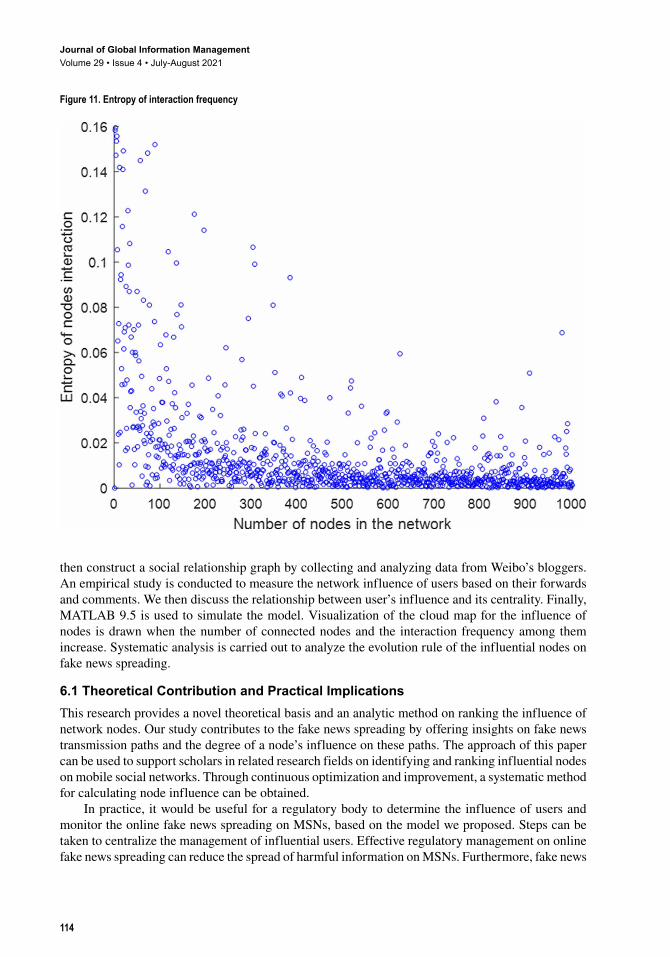
Figure 11 demonstrates that the entropy of the interaction frequency among nodes is negatively correlated to the number of nodes. When the number of nodes connected is less than 200, its entropy of interaction frequency ranges from 0 to 0.16 and the distribution is relatively sparse. In contrast, when the number of nodes connected exceeds 200, the entropy of interaction frequency is between 0 and 0.02, and the distribution is relatively dense. In addition, as the number of nodes connected increases, the value tends to be more centralized and lower.
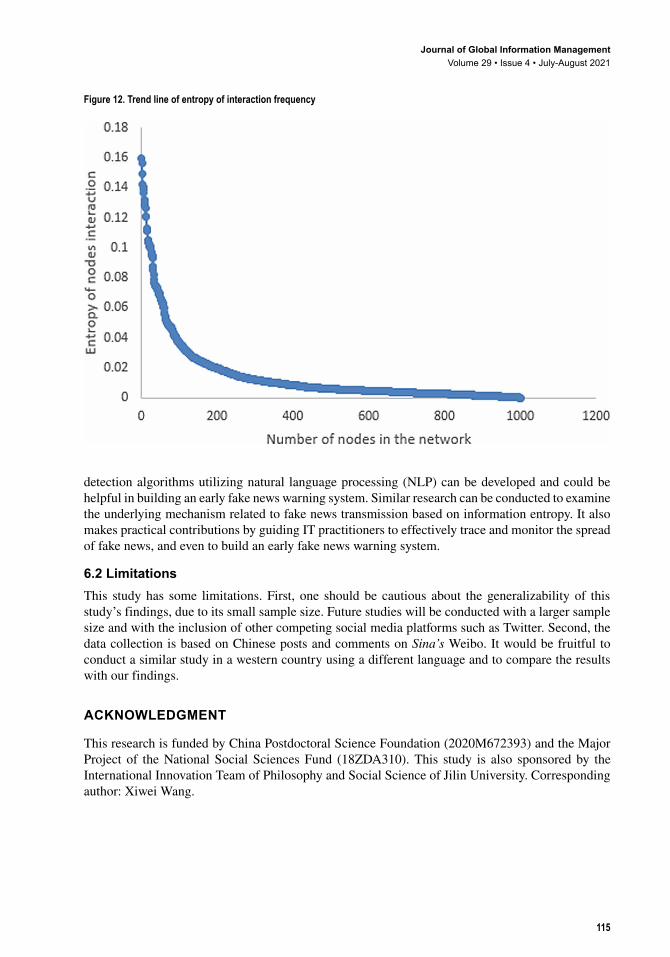
We filter out the nodes with the value below 0.02 and ranked the values in descending order. As shown in Figure 12, we obtain an approximate standard power law distribution curve. The power law distribution polynomial formula is y x R= =−0 535 0 8950 6 2. ( . ). . It is found that the entropy of interaction frequency among nodes decreases with the increase of the number of nodes. When the number of nodes connected to one node is less than 200, its entropy is relatively large, but it is less than 0.16. When the number of nodes reaches 200 or higher, its value approaches 0.
Figure 4. Network of National Business Daily
Journal of Global Information ManagementVolume 29 • Issue 4 • July-August 2021
108
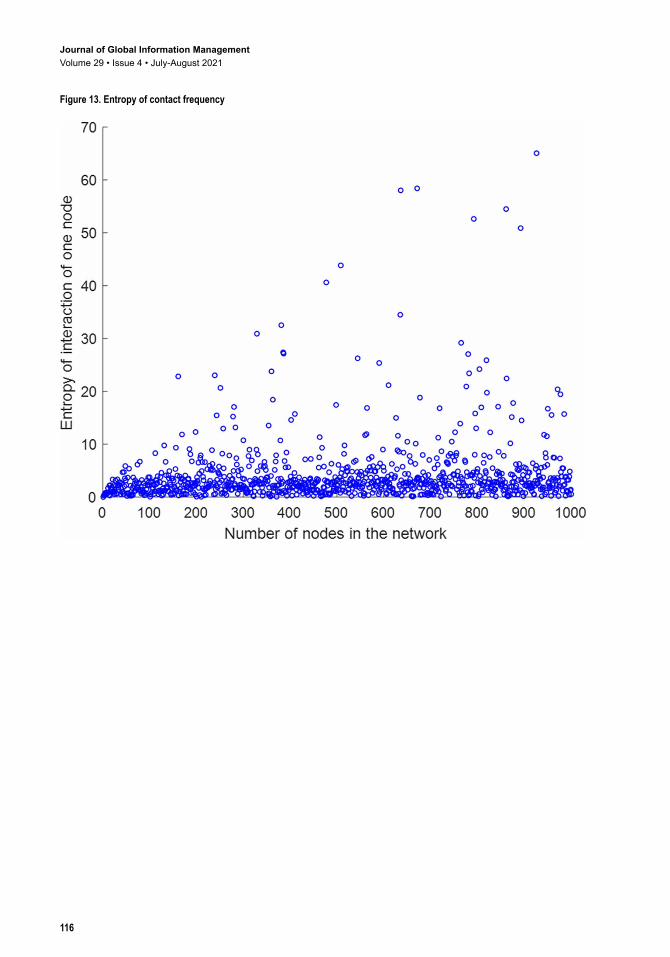
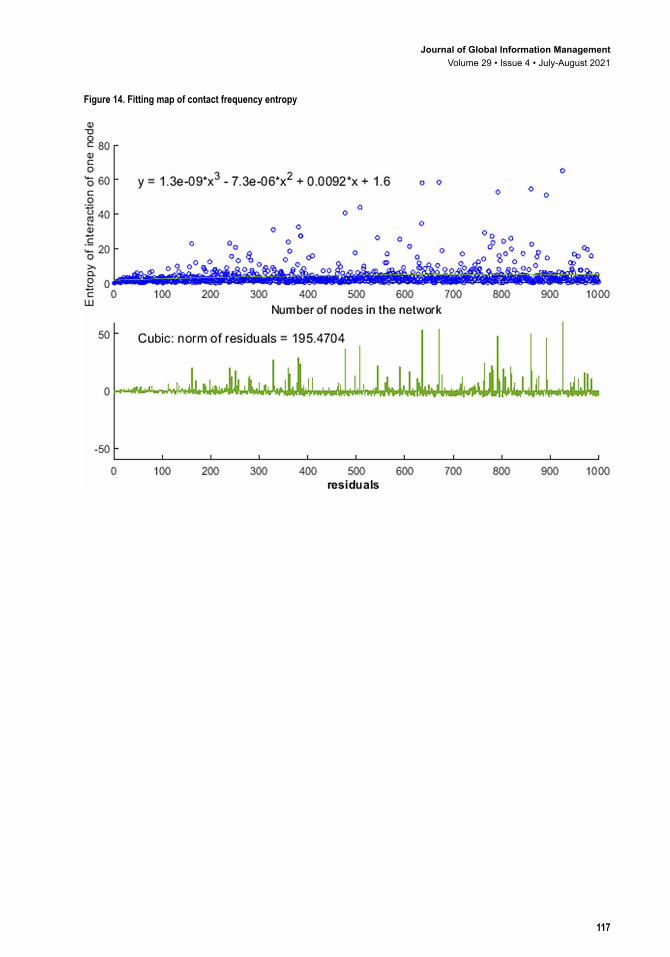
The entropy of a single node’s contact frequency tends to increase as the network scale enlarges, as shown in Figures 13 and 14. The variation trend isy e x e x x= − − − + +1 3 0 9 7 3 0 6 0 0092 1 63 2. ( . ) . ( . ) . . . The residual norm is 195.4704. The result shows that the larger the interaction frequency between users, the lower the overall entropy in the network, regardless of the level of entropy of original node’s contact frequency.
(3) Entropy of a node’s direct influence
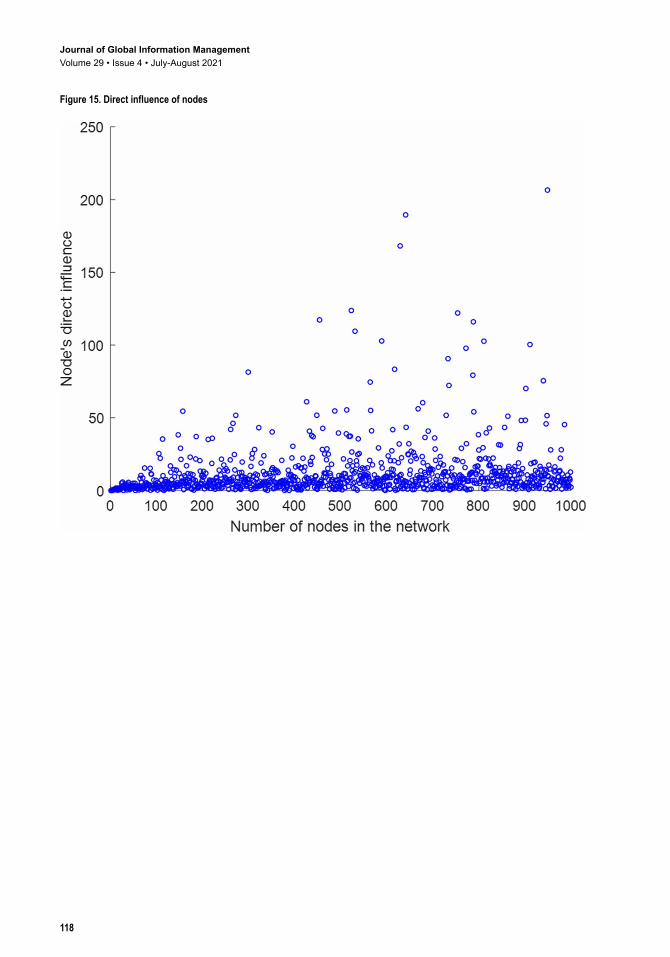
The result shown in Figure 15 indicates that the direct influence of a node is positively related to the number of nodes connected. Also, the numerical distribution is gradually dispersed.
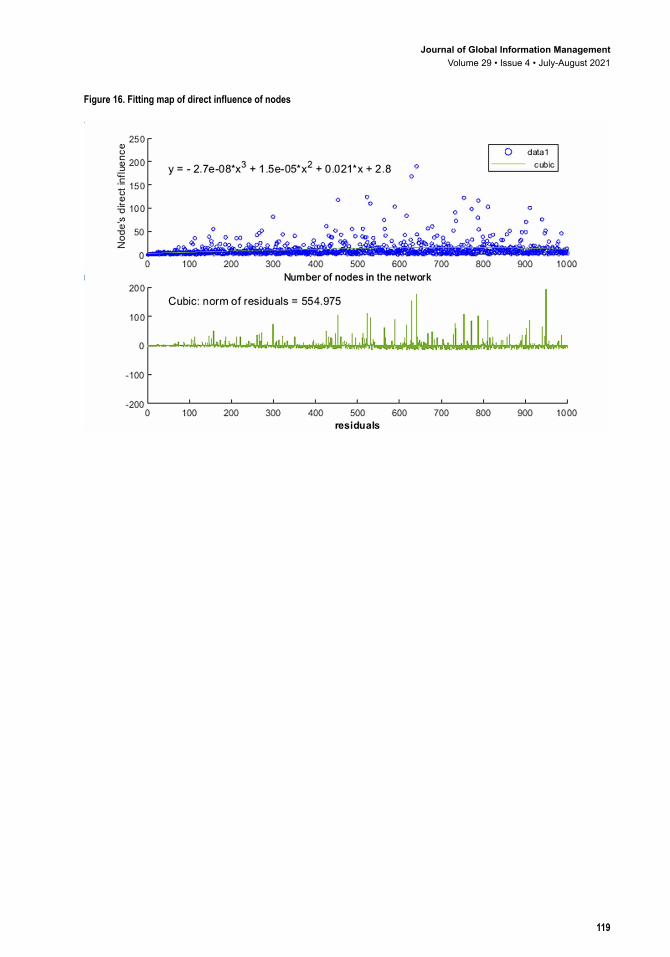
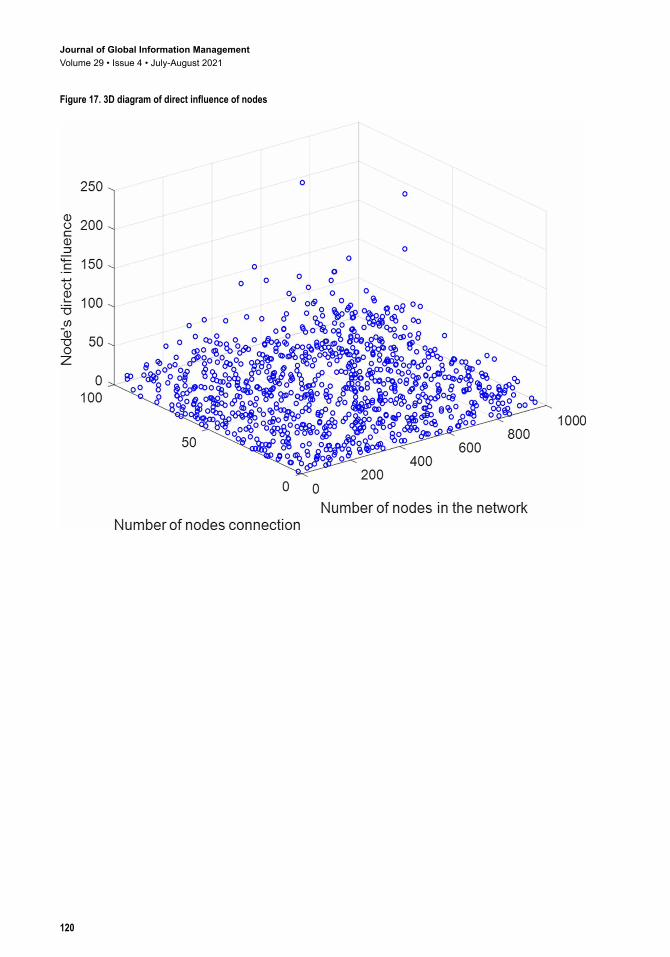
Figure 16 demonstrates the relationship between the direct influence of a node and the number of its connections. The peak of direct influence of a node increases linearly with the number of connected nodes. The threshold value of the node is positively related to the number of nodes connected. The formula for the fitting trend line is y e x e x x= − − − + +2 7 0 8 6 0 5 0 045 1 43 2. ( . ) ( . ) . . . The residual norm is 554.975. We then used scatter ( , , )x y z to draw a scatter plot of the direct influence (z-axis) of a focal node as a function of the number of argument nodes (x-axis) and its contact frequency (y-axis). Figure 17 shows that the direct influence of a node rises with the increasing number of nodes connected and its contact frequency. However, a node’s direct influence distributes
Figure 5. Network of Sina Video
Journal of Global Information ManagementVolume 29 • Issue 4 • July-August 2021
109
uniformly, and the level of value is low. Therefore, in the process of online fake news dissemination, the greater the number of nodes connected by an original node and the higher the contact frequency, the greater the direct influence it has.
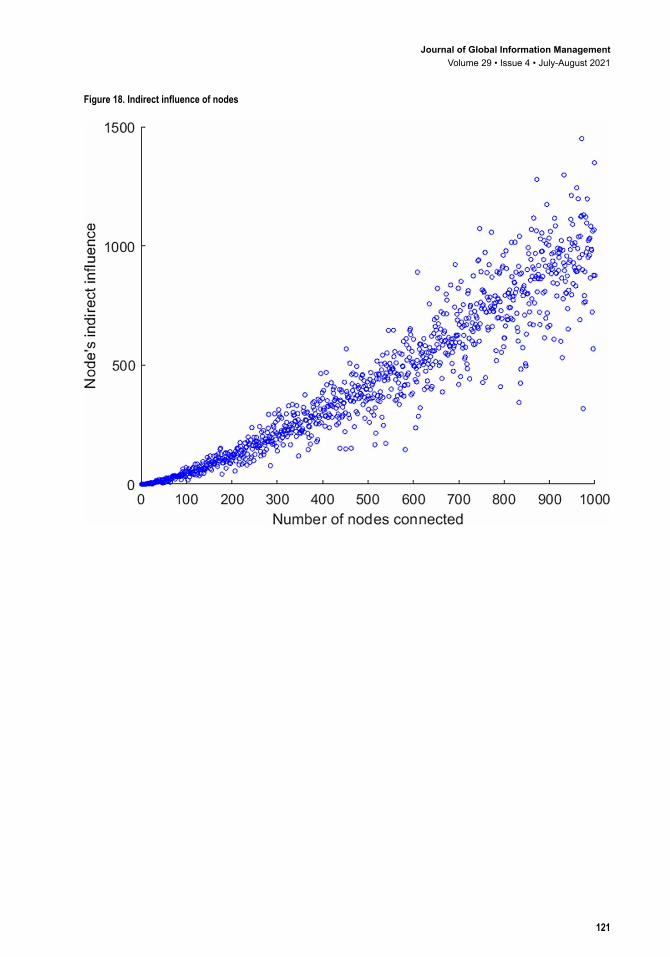
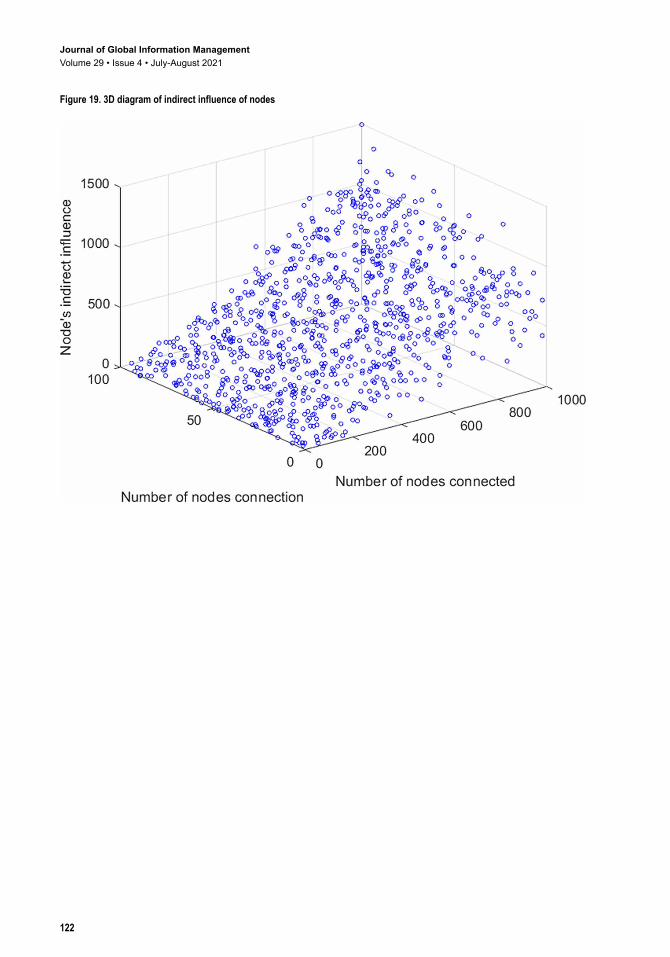
4.3.2 Simulation of Indirect Influence of NodesBased on the result of the direct influence of the network nodes, we simulate the indirect influence trend of the network nodes, and we obtain the simulation result in Figure 18. The indirect influence of a node increases as the number of nodes connected rises. Its growth pattern is similar to that of direct influence; however, with different increasing rate. The indirect influence of a node grows faster than its direct influence when it connects to more nodes in the network. As the number of nodes increases from 0 to 1000, and as the interaction frequency grows from 0 to 1450, the indirect influence of node rises exponentially. The fitting formula is y x= 355 90 6859. . . The indirect influence of a node has the statistics of max = 1450, mean =346.1, median = 382.5 and std = 319. The exponential curve fits the trend of changing influence well, whereas R-square=0.9936 and SSE=6.5238e+5. A 3D simulation chart of a node’s indirect influence is shown in Figures 19. We chart the map with a polynomial distribution. The formula is z f x y x y= = − + +( , ) . . .181 1 1 038 1 903 whereas SSE=8.164e+6, R-square = 0.9184. Unlike the trend of direct influence, when the number of nodes keeps increasing to over 700, the speed of indirect influence grows rapidly. Node’s contact frequency
Figure 6. Network of News in Guilin
Journal of Global Information ManagementVolume 29 • Issue 4 • July-August 2021
110
is less important, compared to the number of nodes connected when measuring its indirect influence. That says, when the size of a social network is large, the number of nodes connected has a greater impact than its contact frequency on the indirect influence of the node. In order to increase the indirect influence, social network users not only have to connect with more users and interact with them frequently, but they also need to establish contacts with influential users, which is the second node in the path of information transmission .
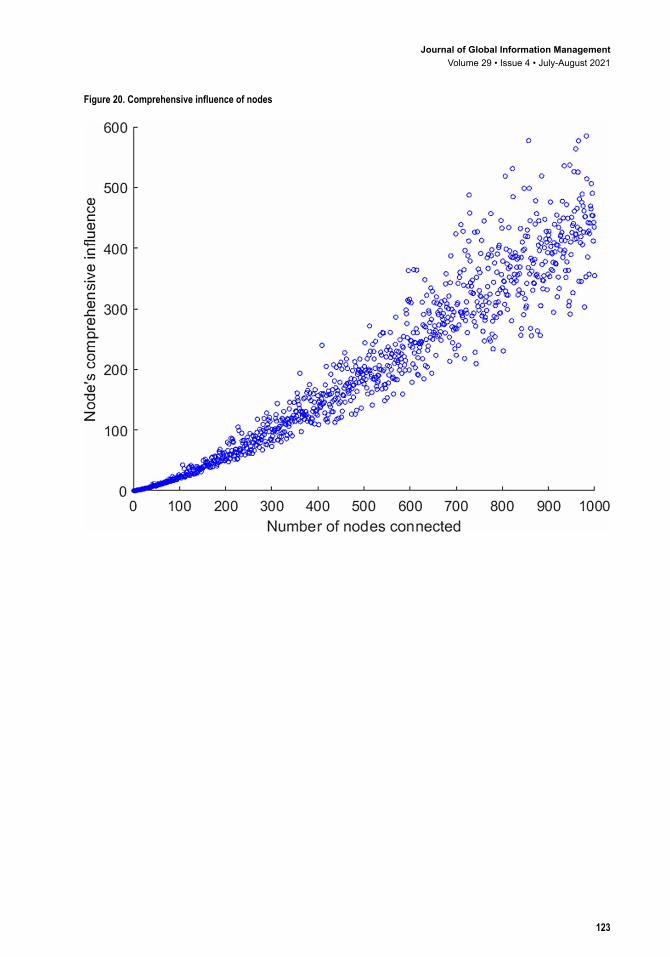
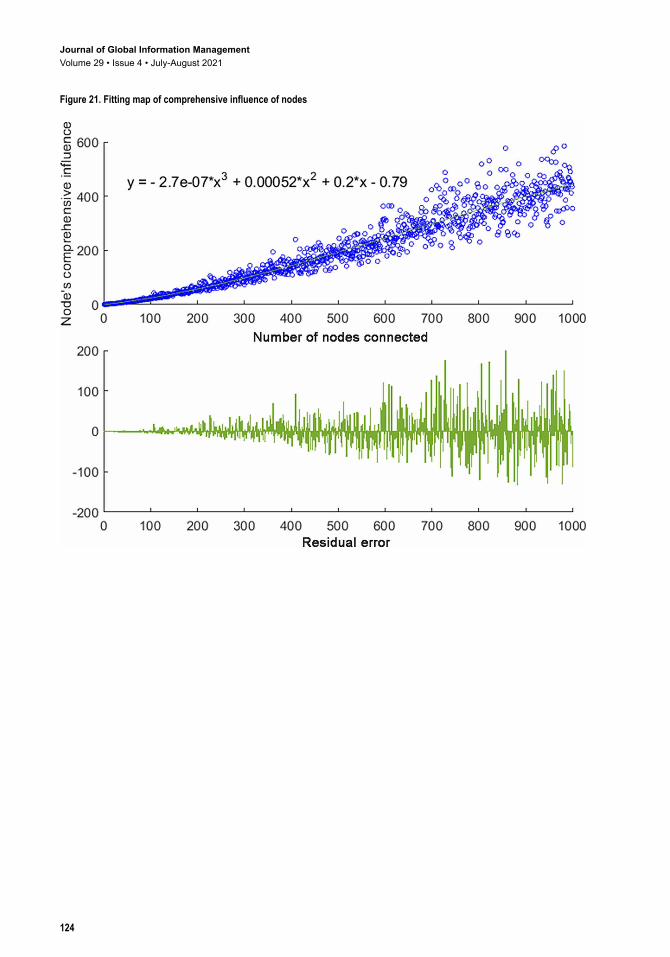
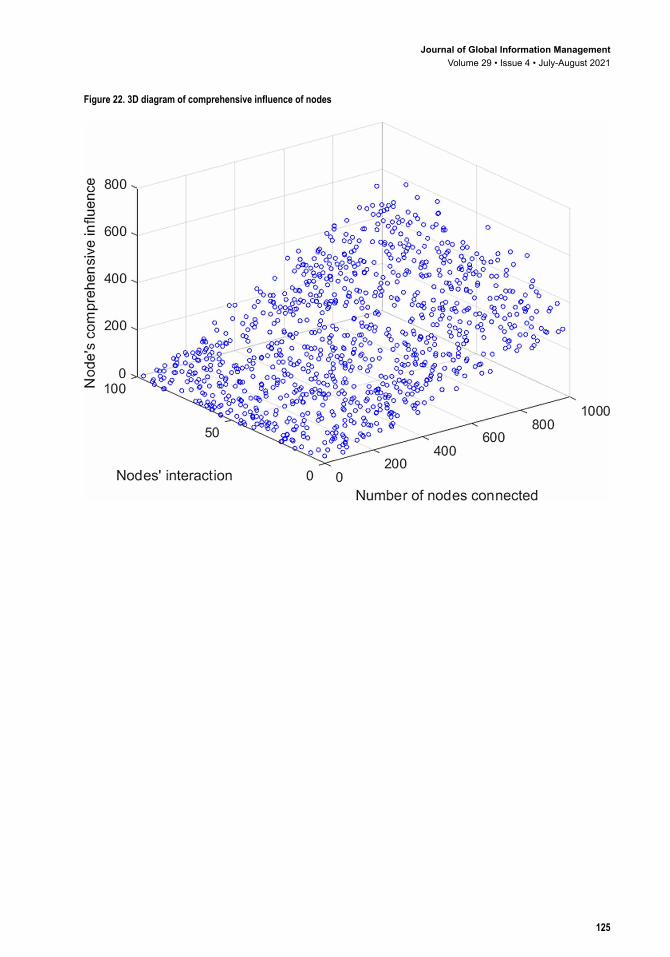
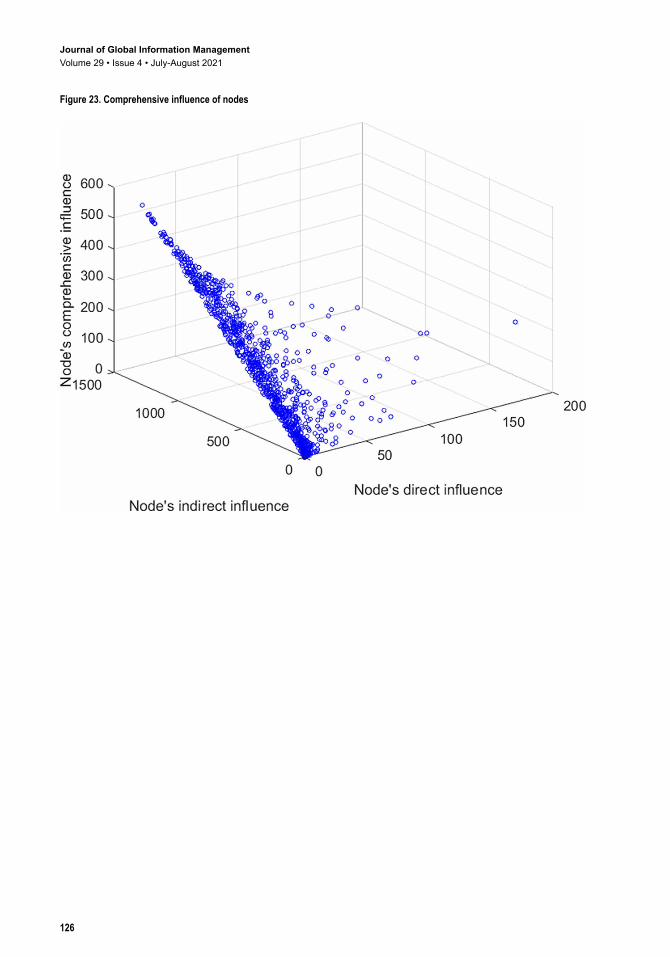
4.3.3 Simulation of Comprehensive Influence of NodesA simulation graph of the comprehensive influence of nodes is drawn, as shown in Figure 20 This graph is analogous to the simulation graph of the indirect influence of nodes, however its numerical variation amplitude is different. Figure 21 shows the trend line fitted to the comprehensive influence of the nodes. The fitting formula isy e x x x= − − − + −2 7 7 0 00052 0 2 0 793 2. ( ) . . . , with statistics of max = 584.9, mean=202.6, median = 186.8 and std = 141.8. The polynomial curve fits the trend of changing influence well, whereas R-square=0.9284 and SSE=1.457e+6. Figure 8(c) shows the 3D simulation chart of a node’s comprehensive influence. We chart the graph with a polynomial line. The formula is z f x y x y= = − + −( , ) . . .33 97 0 4745 0 3621 whereas SSE= 1.593e+06 and R-square= 0.9218. Then, we set direct influence of a node to the x-axis, and the indirect influence of it to the y-axis. We make the variation trend to demonstrate how these two factors affect a node’s comprehensive
Figure 7. Network of Notes fields
Journal of Global Information ManagementVolume 29 • Issue 4 • July-August 2021
111
influence, as shown in Figure 22. When the number of nodes connected with the original node and its contact frequency is low, both the direct influence and the indirect influence affect comprehensive influence in a similar way. However, as the number of nodes connected and the node’s contact frequency increase, the indirect influence is more influential than the direct influence.
The simulation gets similar results with the Trust-Based Most Influential Node Discovery (TMID) method proposed by Zhang (2019) for discovering influential nodes. TMID method confirms that the value range of node influence increases uniformly at the beginning. When the number of nodes in the network continues to increase to a certain number, the growth rate of the node influence slows down. Our simulation results are also partly supported by Zhang’s (2018) research that the indirect influence of nodes contributes differently to the comprehensive influence of nodes according to the various scales of the network. Zhang’s study finds that when the size of a subpopulation is small (about 200), CRBT adoption is negatively affected by indirect peer influence; when the size of a subpopulation is large (about 500), adoption is positively affected by indirect peer influence.
The simulation results validate the opinion that diffusion through friend networks occurs only after some proportion of the initial population of users is infected, as proposed by Susarla (2012). It also indicates that if the transmission path is long enough, the original node generates little influence to the last node on the path, which has been verified by Zhu (2014) that all nodes in the network can be reached by access to the direct neighbors of the rank 1-3 nodes.
Figure 8. Network of No Tai Chi for Teenagers
Journal of Global Information ManagementVolume 29 • Issue 4 • July-August 2021
112
5. dISCUSSIoN
The results of this study reveal that the indirect influence of a node is much stronger than the direct influence when the network is large enough. When there are hundreds or thousands of nodes in the network and nodes are frequently connected, a node’s direct influence tends not to be significant. If there are many information transmission paths, then the propagation chain becomes complicated and intricacy. Thus, the indirect influence of a node is higher than its direct influence, since there are numerous paths to trace. The second node in the transmission path is critical for calculating the original node’s indirect influence on MSNs (Wei et al., 2018). The comprehensive influence of a node lies between its direct influence and indirect influence (Gao, 2017). As the number of nodes connected and the node’s contact frequency increase, both the direct and the indirect influence of a node increase; however, at different rates. The indirect influence of a node grows faster than its direct influence when the information transmission paths are longer and more complicated. A node with a large number of highly influential neighbors is more important on MSNs. A network user can enhance his or her network influence by connecting with more users and interacting with them more frequently. This is the optimal way to expand a user’s direct influence. Another approach used to enhance the network influence of a user is to connect to key users with high credibility and power in the network, which is considered as a critical step to boost a user’s indirect influence.
Social media users are less likely to think critically, because they typically use social media for hedonic purposes than utilitarian ones, which causes confirmation bias to prevail, exacerbating the issue of fake news (Yuan et al.,2018). Once the fake news has been diffused at a certain scale, how to
Figure 9. Entropy of nodes connected
Journal of Global Information ManagementVolume 29 • Issue 4 • July-August 2021
113
evaluate the influence of users in that rumor propagation and make targeted management is important for administrative department. Our approaches are capable of providing support on regulating fake news. On the governmental level, it is crucial to speed up the development of a fact checking system that can automatically identify and validate false information with high update rate and accuracy. This system has potential to restrain and prevent the spread of fake news within the shortest possible time. On the user level, it is of great importance to educate users, especially those influential users, on identifying fake news. The government and administrative department should enhance the publicity and education of social media users on rumor spreading and encourage them to share only news from the authorities and trustworthy media. Our proposed method is useful because it ranks the quantified influence of users in a particular network on fake news spreading and could be used as a tool to identify key users who should be educated. For users who are not cooperative and continue to spread fake news online, their user accounts could be identified and suspended.
6. CoNCLUSIoN
The spread of fake news on MSNs has been shown to have a seriously negative impact on the society. It is crucial for governmental and regulatory units to better manage information transmission, especially the early detection and prevention of fake news spreading on MSNs. In this regard, this study proposes a model based on the information entropy theory to measure the direct, indirect and comprehensive influence of network nodes on MSNs. We examine the characteristics of information transmission,
Figure 10. Fitting map of entropy of nodes connected
Journal of Global Information ManagementVolume 29 • Issue 4 • July-August 2021
114
then construct a social relationship graph by collecting and analyzing data from Weibo’s bloggers. An empirical study is conducted to measure the network influence of users based on their forwards and comments. We then discuss the relationship between user’s influence and its centrality. Finally, MATLAB 9.5 is used to simulate the model. Visualization of the cloud map for the influence of nodes is drawn when the number of connected nodes and the interaction frequency among them increase. Systematic analysis is carried out to analyze the evolution rule of the influential nodes on fake news spreading.
6.1 Theoretical Contribution and Practical ImplicationsThis research provides a novel theoretical basis and an analytic method on ranking the influence of network nodes. Our study contributes to the fake news spreading by offering insights on fake news transmission paths and the degree of a node’s influence on these paths. The approach of this paper can be used to support scholars in related research fields on identifying and ranking influential nodes on mobile social networks. Through continuous optimization and improvement, a systematic method for calculating node influence can be obtained.
In practice, it would be useful for a regulatory body to determine the influence of users and monitor the online fake news spreading on MSNs, based on the model we proposed. Steps can be taken to centralize the management of influential users. Effective regulatory management on online fake news spreading can reduce the spread of harmful information on MSNs. Furthermore, fake news
Figure 11. Entropy of interaction frequency
Journal of Global Information ManagementVolume 29 • Issue 4 • July-August 2021
115
detection algorithms utilizing natural language processing (NLP) can be developed and could be helpful in building an early fake news warning system. Similar research can be conducted to examine the underlying mechanism related to fake news transmission based on information entropy. It also makes practical contributions by guiding IT practitioners to effectively trace and monitor the spread of fake news, and even to build an early fake news warning system.
6.2 LimitationsThis study has some limitations. First, one should be cautious about the generalizability of this study’s findings, due to its small sample size. Future studies will be conducted with a larger sample size and with the inclusion of other competing social media platforms such as Twitter. Second, the data collection is based on Chinese posts and comments on Sina’s Weibo. It would be fruitful to conduct a similar study in a western country using a different language and to compare the results with our findings.
ACKNowLedGMeNT
This research is funded by China Postdoctoral Science Foundation (2020M672393) and the Major Project of the National Social Sciences Fund (18ZDA310). This study is also sponsored by the International Innovation Team of Philosophy and Social Science of Jilin University. Corresponding author: Xiwei Wang.
Figure 12. Trend line of entropy of interaction frequency
Journal of Global Information ManagementVolume 29 • Issue 4 • July-August 2021
116
Figure 13. Entropy of contact frequency
Journal of Global Information ManagementVolume 29 • Issue 4 • July-August 2021
117
Figure 14. Fitting map of contact frequency entropy
Journal of Global Information ManagementVolume 29 • Issue 4 • July-August 2021
118
Figure 15. Direct influence of nodes
Journal of Global Information ManagementVolume 29 • Issue 4 • July-August 2021
119
Figure 16. Fitting map of direct influence of nodes
Journal of Global Information ManagementVolume 29 • Issue 4 • July-August 2021
120
Figure 17. 3D diagram of direct influence of nodes
Journal of Global Information ManagementVolume 29 • Issue 4 • July-August 2021
121
Figure 18. Indirect influence of nodes
Journal of Global Information ManagementVolume 29 • Issue 4 • July-August 2021
122
Figure 19. 3D diagram of indirect influence of nodes
Journal of Global Information ManagementVolume 29 • Issue 4 • July-August 2021
123
Figure 20. Comprehensive influence of nodes
Journal of Global Information ManagementVolume 29 • Issue 4 • July-August 2021
124
Figure 21. Fitting map of comprehensive influence of nodes
Journal of Global Information ManagementVolume 29 • Issue 4 • July-August 2021
125
Figure 22. 3D diagram of comprehensive influence of nodes
Journal of Global Information ManagementVolume 29 • Issue 4 • July-August 2021
126
Figure 23. Comprehensive influence of nodes

Journal of Global Information ManagementVolume 29 • Issue 4 • July-August 2021
127
ReFeReNCeS
Alkhodair, S. A., Ding, S. H., Fung, B. C., & Liu, J. (2020). Detecting breaking news rumors of emerging topics in social media. Information Processing & Management, 57(2), 102018. doi:10.1016/j.ipm.2019.02.016
Atif, Y., Al-Falahi, K., Wangchuk, T., & Lindström, B. (2019). A fuzzy logic approach to influence maximization in social networks. Journal of Ambient Intelligence and Humanized Computing, 11(6), 2435–2451. doi:10.1007/s12652-019-01286-2
Beni, H. A., & Bouyer, A. (2020). TI-SC: Top-k influential nodes selection based on community detection and scoring criteria in social networks. Journal of Ambient Intelligence and Humanized Computing, 11(11), 4889–4908. Advance online publication. doi:10.1007/s12652-020-01760-2
Blaszczyk, M. B. (2017). Consistency in social network position over changing environments in a seasonally breeding primate. Behavioral Ecology and Sociobiology, 72(1), 1–13.
Bondielli, A., & Marcelloni, F. (2019). A survey on fake news and rumour detection techniques. Information Sciences, 497, 38–55. doi:10.1016/j.ins.2019.05.035
Chen, J., Xu, F., Ding, B., Wu, N., Shen, Z., & Zhang, L. (2019). Performance analysis of radiation and electricity yield in a photovoltaic panel integrated greenhouse using the radiation and thermal models. Computers and Electronics in Agriculture, 164, 104904. doi:10.1016/j.compag.2019.104904
Chen, X., Guo, J.-F., Liu, F.-C., & Zhang, C.-Y. (2017). Study on similarity based on connection degree in social network. Cluster Computing, 20(1), 167–178. doi:10.1007/s10586-017-0743-5
Chen, Y., Wu, K., Chen, X., Tang, C., & Zhu, Q. (2014). An entropy-based uncertainty measurement approach in neighborhood systems. Information Sciences, 279, 239–250. doi:10.1016/j.ins.2014.03.117
Chua, A. Y., & Banerjee, S. (2018). Intentions to trust and share online health rumors: An experiment with medical professionals. Computers in Human Behavior, 87, 1–9. doi:10.1016/j.chb.2018.05.021
Dong, X., Lian, Y., & Liu, Y. (2018). Small and multi-peak nonlinear time series forecasting using a hybrid back propagation neural network. Information Sciences, 424, 39–54. doi:10.1016/j.ins.2017.09.067
Fang, B., Zheng, Z., Ye, Q., & Goes, P. B. (2019). Social influence and monetization of freemium social games. Journal of Management Information Systems, 36(3), 730–754. doi:10.1080/07421222.2019.1628878
Fei, L., Zhang, Q., & Deng, Y. (2018). Identifying influential nodes in complex networks based on the inverse-square law. Physica A, 512, 1044–1059. doi:10.1016/j.physa.2018.08.135
Ferreira, P., Telang, R., & Matos, M. G. D. (2019). Effect of friends’ churn on consumer behavior in mobile networks. Journal of Management Information Systems, 36(2), 355–390. doi:10.1080/07421222.2019.1598683
Freelon, D., Bossetta, M., Wells, C., Lukito, J., Xia, Y., & Adams, K. (2020). Black trolls matter: Racial and ideological asymmetries in social media disinformation. Social Science Computer Review. Advance online publication. doi:10.1177/0894439320914853
Gao, L., Liu, L., & Feng, Y. (2017). Factors affecting individual level ERP assimilation in a social network perspective. Journal of Global Information Management, 25(3), 21–39. doi:10.4018/JGIM.2017070102
Gao, S., Zhang, Z., Su, S., & Zia, M. A. (2018). Multi-role event organization in social networks. Information Sciences, 447, 229–243. doi:10.1016/j.ins.2018.03.017
Guo, J., Zhang, W., Fan, W., & Li, W. (2018). Combining geographical and social influences with deep learning for personalized point-of-interest recommendation. Journal of Management Information Systems, 35(4), 1121–1153. doi:10.1080/07421222.2018.1523564
Hosseini-Pozveh, M., Zamanifar, K., & Naghsh-Nilchi, A. R. (2016). A community-based approach to identify the most influential nodes in social networks. Journal of Information Science, 43(2), 204–220. doi:10.1177/0165551515621005
Hsu, C., Lin, J., & Chiang, H. (2013). The effects of blogger recommendations on customers’online shopping intentions. Internet Research, 23(1), 69–88. doi:10.1108/10662241311295782

Journal of Global Information ManagementVolume 29 • Issue 4 • July-August 2021
128
Humprecht, E. (2018). Where ‘fake news’ flourishes: A comparison across four Western democracies. Information Communication and Society, 22(13), 1973–1988. doi:10.1080/1369118X.2018.1474241
Jain, L., & Katarya, R. (2019). Discover opinion leader in online social network using firefly algorithm. Expert Systems with Applications, 122, 1–15. doi:10.1016/j.eswa.2018.12.043
Kauffman, R. J., & Weber, T. A. (2019). Special section: Social influence and networked business interaction. Journal of Management Information Systems, 36(4), 1040–1042. doi:10.1080/07421222.2019.1661086
Khomami, M. M., Rezvanian, A., Meybodi, M. R., & Bagheri, A. (2020). CFIN: A community-based algorithm for finding influential nodes in complex social networks. The Journal of Supercomputing. Advance online publication. doi:10.1007/s11227-020-03355-2
Kim, A., & Dennis, A. R. (2019). Says who? The effects of presentation format and source rating on fake news in social media. Management Information Systems Quarterly, 43(3), 1025–1039. doi:10.25300/MISQ/2019/15188
Kim, A., Moravec, P. L., & Dennis, A. R. (2019). Combating fake news on social media with source ratings: The effects of user and expert reputation ratings. Journal of Management Information Systems, 36(3), 931–968. doi:10.1080/07421222.2019.1628921
Knight, E., & Tsoukas, H. (2018). When fiction Trumps truth: What ‘post-truth’ and ‘alternative facts’ mean for management studies. Organization Studies, 40(2), 183–197. doi:10.1177/0170840618814557
Lin, H. C., Bruning, P. F., & Swarna, H. (2018). Using online opinion leaders to promote the hedonic and utilitarian value of products and services. Business Horizons, 61(3), 431–442. doi:10.1016/j.bushor.2018.01.010
Liu, Y., Gu, Z., Ko, T. H., & Liu, J. (2020). Identifying key opinion leaders in social media via modality-consistent harmonized discriminant embedding. IEEE Transactions on Cybernetics, 50(2), 717–728. doi:10.1109/TCYB.2018.2871765 PMID:30307887
Ma, Q., & Ma, J. (2017). A robust method to discover influential users in social networks. Soft Computing, 23(4), 1283–1295. doi:10.1007/s00500-017-2847-5
Mahyar, H., Hasheminezhad, R., Ghalebi K, E., Nazemian, A., Grosu, R., Movaghar, A., & Rabiee, H. R. (2018). Compressive sensing of high betweenness centrality nodes in networks. Physica A, 497, 166–184. doi:10.1016/j.physa.2017.12.145
Maji, G., Namtirtha, A., Dutta, A., & Malta, M. C. (2020). Influential spreaders identification in complex networks with improved k-shell hybrid method. Expert Systems with Applications, 144, 113092. doi:10.1016/j.eswa.2019.113092
Moravec, P., Minas, R., & Dennis, A. R. (2019). Fake news on social media: people believe what they want to believe when it makes no sense at All. SSRN Electronic Journal, 43(4), 1343–1360.
Ni, Y., Shi, Q., & Wei, Z. (2017). Optimizing influence diffusion in a social network with fuzzy costs for targeting nodes. Journal of Ambient Intelligence and Humanized Computing, 8(5), 819–826. doi:10.1007/s12652-017-0552-y
Peng, S., Yang, A., Cao, L., Yu, S., & Xie, D. (2017). Social influence modeling using information theory in mobile social networks. Information Sciences, 379, 146–159. doi:10.1016/j.ins.2016.08.023
Rapti, A., Tsichlas, K., Sioutas, S., & Tzimas, G. (2018). Correction to: Virus propagation: threshold conditions for multiple profile networks. Knowledge and Information Systems, 60(2), 1163–1164. doi:10.1007/s10115-018-1277-8
Riquelme, F., Gonzalez-Cantergiani, P., Hans, D., Villarroel, R., & Munoz, R. (2019). Identifying opinion leaders on social networks through milestones definition. IEEE Access : Practical Innovations, Open Solutions, 7, 75670–75677. doi:10.1109/ACCESS.2019.2922155
Rosenthal, S. (2014). Detecting influencers in social media discussions. XRDS: Crossroads. The ACM Magazine for Students, 21(1), 40–45.
Sangam, R. S., & Om, H. (2015). The k-modes Algorithm with Entropy Based Similarity Coefficient. Procedia Computer Science, 50, 93–98. doi:10.1016/j.procs.2015.04.066
Journal of Global Information ManagementVolume 29 • Issue 4 • July-August 2021
129
Shannon, C. E. (1948). A mathematical theory of communication. The Bell System Technical Journal, 27(4), 379–423. doi:10.1002/j.1538-7305.1948.tb01338.x
Sisodia, D. S., Verma, S., & Vyas, O. P. (2016). Augmented intuitive dissimilarity metric for clustering of Web user sessions. Journal of Information Science, 43(4), 480–491. doi:10.1177/0165551516648259
Su, W., Xu, X., Li, Y., Martínez-López, F. J., & Li, L. (2018). Technological innovation. A case study of mobile internet information technology applications in community management. Journal of Global Information Management, 26(2), 193–203. doi:10.4018/JGIM.2018040109
Susarla, A., Oh, J.-H., & Tan, Y. (2012). Social networks and the diffusion of user-generated content: Evidence from YouTube. Information Systems Research, 23(1), 23–41. doi:10.1287/isre.1100.0339
Susarla, A., Oh, J.-H., & Tan, Y. (2016). Influentials, imitables, or susceptibles? virality and word-of-mouth conversations in online social networks. Journal of Management Information Systems, 33(1), 139–170. doi:10.1080/07421222.2016.1172454
Syn, S. Y., & Oh, S. (2015). Why do social network site users share information on Facebook and Twitter? Journal of Information Science, 41(5), 553–569. doi:10.1177/0165551515585717
Tulu, M. M., Hou, R., & Younas, T. (2018). Identifying influential nodes based on community structure to speed up the dissemination of information in complex network. IEEE Access : Practical Innovations, Open Solutions, 6, 7390–7401. doi:10.1109/ACCESS.2018.2794324
Vosoughi, S., Roy, D., & Aral, S. (2018). The spread of true and false news online. Science, 359(6380), 1146–1151. doi:10.1126/science.aap9559 PMID:29590045
Wang, Q., Yang, X., & Xi, W. (2018). Effects of group arguments on rumor belief and transmission in online communities: An information cascade and group polarization perspective. Information & Management, 55(4), 441–449. doi:10.1016/j.im.2017.10.004
Wang, S., Zhang, Y., Wang, H., Huang, Z., Wang, X., & Jiang, T. (2017). Large scale measurement and analytics on social groups of device-to-device sharing in mobile social networks. Mobile Networks and Applications, 23(2), 203–215. doi:10.1007/s11036-017-0927-5
Wang, X., Zhao, D., Yang, M., Duan, L., Xiang, M. M., & Guo, Q. (2017). Public opinion dissemination on mobile internet- a case of Ebola. Information Discovery and Delivery, 45(2), 87–100. doi:10.1108/IDD-02-2017-0013
Wei, H., Pan, Z., Hu, G., Zhang, L., Yang, H., Li, X., & Zhou, X. (2018). Identifying influential nodes based on network representation learning in complex networks. PLoS One, 13(7), 1–13. doi:10.1371/journal.pone.0200091 PMID:29985931
Wen, T., Pelusi, D., & Deng, Y. (2020). Vital spreaders identification in complex networks with multi-local dimension. Knowledge-Based Systems, 195, 105717. doi:10.1016/j.knosys.2020.105717
Wu, T., Liu, X., & Liu, F. (2018). An interval type-2 fuzzy TOPSIS model for large scale group decision making problems with social network information. Information Sciences, 432, 392–410. doi:10.1016/j.ins.2017.12.006
Xiao, L., Wang, S., & Mei, G. (2020). Efficient parallel algorithm for detecting influential nodes in large biological networks on the Graphics Processing Unit. Future Generation Computer Systems, 106, 1–13. doi:10.1016/j.future.2019.12.038
Xu, K., Wang, F., Wang, H., & Yang, B. (2020). Detecting fake news over online social media via domain reputations and content understanding. Tsinghua Science and Technology, 25(1), 20–27. doi:10.26599/TST.2018.9010139
Xu, Q., Su, Z., Xu, Z., Fang, D., & Han, B. (2016). Analysis to reveal evolution and topological features of a real mobile social network. Peer-to-Peer Networking and Applications, 10(6), 1344–1353. doi:10.1007/s12083-016-0494-8
Yu, Y., Yu, G., Li, T., Man, Q., & Chen, Q. (2020). Quantitative characterization and identification of the company-related disinformation channel among media. IEEE Access : Practical Innovations, Open Solutions, 8, 29196–29204. doi:10.1109/ACCESS.2020.2971727

Journal of Global Information ManagementVolume 29 • Issue 4 • July-August 2021
130
Yuan, X., Chu, K., & Cai, S. (2018). When is information quality more important? Journal of Global Information Management, 26(2), 204–232. doi:10.4018/JGIM.2018040110
Zareie, A., & Sheikhahmadi, A. (2018). A hierarchical approach for influential node ranking in complex social networks. Expert Systems with Applications, 93, 200–211. doi:10.1016/j.eswa.2017.10.018
Zareie, A., Sheikhahmadi, A., Jalili, M., & Fasaei, M. S. (2020). Finding influential nodes in social networks based on neighborhood correlation coefficient. Knowledge-Based Systems, 194, 105580. doi:10.1016/j.knosys.2020.105580
Zhang, B., Pavlou, P. A., & Krishnan, R. (2018). On direct vs. indirect peer influence in large social networks. Information Systems Research, 29(2), 292–314. doi:10.1287/isre.2017.0753
Zhang, B., Zhang, L., Mu, C., Zhao, Q., Song, Q., & Hong, X. (2019). A most influential node group discovery method for influence maximization in social networks: A trust-based perspective. Data & Knowledge Engineering, 121, 71–87. doi:10.1016/j.datak.2019.05.001
Zhang, X., & Ghorbani, A. A. (2020). An overview of online fake news: Characterization, detection, and discussion. Information Processing & Management, 57(2), 102025. doi:10.1016/j.ipm.2019.03.004
Zhao, J., Zhang, Z., Han, C., & Zhou, Z. (2014). Complement information entropy for uncertainty measure in fuzzy rough set and its applications. Soft Computing, 19(7), 1997–2010. doi:10.1007/s00500-014-1387-5
Zhao, L., Yin, J., & Song, Y. (2016). An exploration of rumor combating behavior on social media in the context of social crises. Computers in Human Behavior, 58, 25–36. doi:10.1016/j.chb.2015.11.054
Zhong, L.-F., Shang, M.-S., Chen, X.-L., & Cai, S.-M. (2018). Identifying the influential nodes via eigen-centrality from the differences and similarities of structure. Physica A, 510, 77–82. doi:10.1016/j.physa.2018.06.115
Zhu, T., Wang, B., Wu, B., & Zhu, C. (2014). Maximizing the spread of influence ranking in social networks. Information Sciences, 278, 535–544. doi:10.1016/j.ins.2014.03.070
Yunfei Xing is a post doctor in School Of Information Management, Central China Normal University, Wuhan, China. Her research interests include networking, social media, fake news, data mining and information propagation. She is the corresponding author of this article.
Xiwei Wang is a professor in Jilin University, Changchun, China. Her research interests include big data, data mining, social media and information ecology.
Feng-Kwei Wang is a distinguished professor at Chinese Culture University and a fellow of Asia-Pacific Industrial Analysis Association in Taiwan. Since 1989, Dr. Wang was a chief designer and directed various system development projects in network-based information systems in the US. Before moving back to Taiwan in September 2004, he held a faculty position at University of Missouri – Columbia. During his industrial tenure of 8 years in Taiwan, he served as the group general manager of the Madenform International Group, a health management company, and the executive director of ITRI College, Industrial Technology Research Institute (ITRI). Dr. Wang has been interested in the applications of multimedia and network technologies to enhance human learning and business performance. He is currently an executive coach and corporate consultant. His clients include chairmen of public listed companies and entrepreneurs of technology start-ups in Taiwan. His primary research and teaching areas at Chinese Culture University include technology innovation, business development and leadership development.
Wu He is an Associate Professor of Information Technology at Old Dominion University, Norfolk, VA, USA. His research interests include Data Mining, Information Security & Privacy, Social Media, Knowledge Management and Computing Education. His research has been funded by NSF, NSA, NASA and other organizations. He has published over 80 journal articles in such outlets as Information & Management, Journal of the Association for Information Science and Technology, International Journal of Information Management, and IEEE Transactions on Industry Informatics.
Haowu Chang is an M.S. candidate at Jilin University. His research interests are fungus sRNA function, data mining, machine learning, and bioinformatics.