Embed Size (px)
Citation preview

C.P. No. 935
MINISTRY OF TECHNOLOGY
AERONAUTICAL RESEARCH COUNCIL
CURREN J PAPERS
Random and Systematic Factors in the Scatkr of Creep Data
BY
K. F A. Wdles
LONDON: HER MAJESTY’S STATIONERY OFFICE 1967
PRICE 16s Od NET

,
-
C.P. No. 9350
Rmulom and Systematic Factors in the Scatter af Creep Data
-By- K. F. A. Walles
The study of soatter in oreep is faoilltated by using a previously
developed formula to provide mean values of creep properties. Soatter
oan then be determined not oriiy from the relatively Pew sets of tests
repeated under identioal oonditlons, but also from the far more numerous
sets of tests performed under different conditions. Earlier studies
suggested that scatter wss, to a first approximation, distributed aooording
to the Gaussian normal error form.
In the present study, it has boon found that the distributions
'are often multimodal, and oan be resolved into two or more component
distributions eaoh of whioh is Gaussian. Multimodal distributions show
regularities in that, for a given oomposition, the standard deviation in
temperature and. the mean spacing in temperature between oomponenta is the
ssme in each oomponont distribution and in each oast.
The presant study of Nlmonios SO, 8oA and 90, and of I&12-NB
alloy supports the previous agroemont of the formula with experimental data in finer detail and further validates the form& as a means of
extrapolation. Multimodal scatter is identified as a problem of
prnotioal oonoern.
----------------------------------------
*Replaces N.G.T.E. NT.601 - A.R.C.28 326.
-2-
CONTENTS
1 .o
2.0
3.0
4.0
Introduction
1.1 1.2
1.3
1.4
Creep formula Previous comparison of individual sets of data with formula Frevlous comparison of data from several casts of a single material with the formula - common family Scope of present Note
Expression end analysis of scatter
2.1 Ghoice of variables 2.2 Resolution of creep curves 2.3 Homogeneous sets of data studied 2.4 GraphIcal presentatron of the drstributlon of
scatter within a homogeneous set 2.5 Method of enalyslng the scatter distributron
mrthin a homogeneous set 2.6 Common value of standard deviatron for a single
homogeneous set 2.7 Deviations of each mode of a drstributlon
Further regularities observed in scatter, illustrated from rupture data
3.1 Regular relations between different casts of a single alloy
3.2 Effect of stress end temperature on scatter
More extensive analysis of results
4.1
4.2
4.3
4.4
Four sets of rupture data for a Brrtlsh 18-12-M, steel
4.1.1 Distribution of multiple modes over stress and temperature m three of the four sets
Greep and rupture data for Nimoruc 80 and Nomonic 80A
4.2.1 Detarls of lndlvldual casts 4.2.2 Distributron of multrple modes over stress
and temperature
Creep and rupture data for Nmonic 90
4.3.1 Details of Individual casts 4.3.2 Distributron of multiple modes over stress
and temperature
Single extensrve set of rupture data for 18-12-X% steel
pafse
7
7 8
8
9
9
9 11 11 11
12
12
13
13
13
14
15
15
15
16
::
17
18 18
78
-3-
CONTENTS (cont'd)
5.0 Discussion
::: Comparison with previous analyses Possible further regularities
;:; Apparently discrepant data Summary of results
6.0 Conclusion
References
No. -
I
II
III
Iv
v
VI
VII
VIII
Ix
X
XI
TABLES
Title
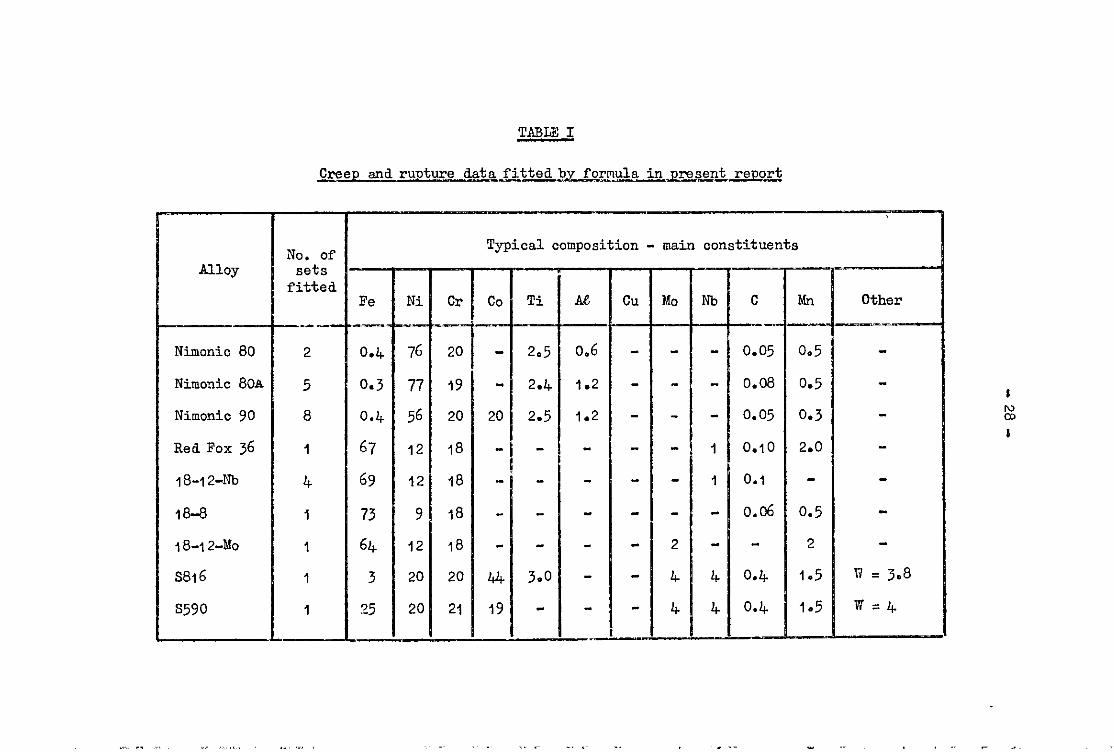
Creep and rupture data fitted by formula in present report
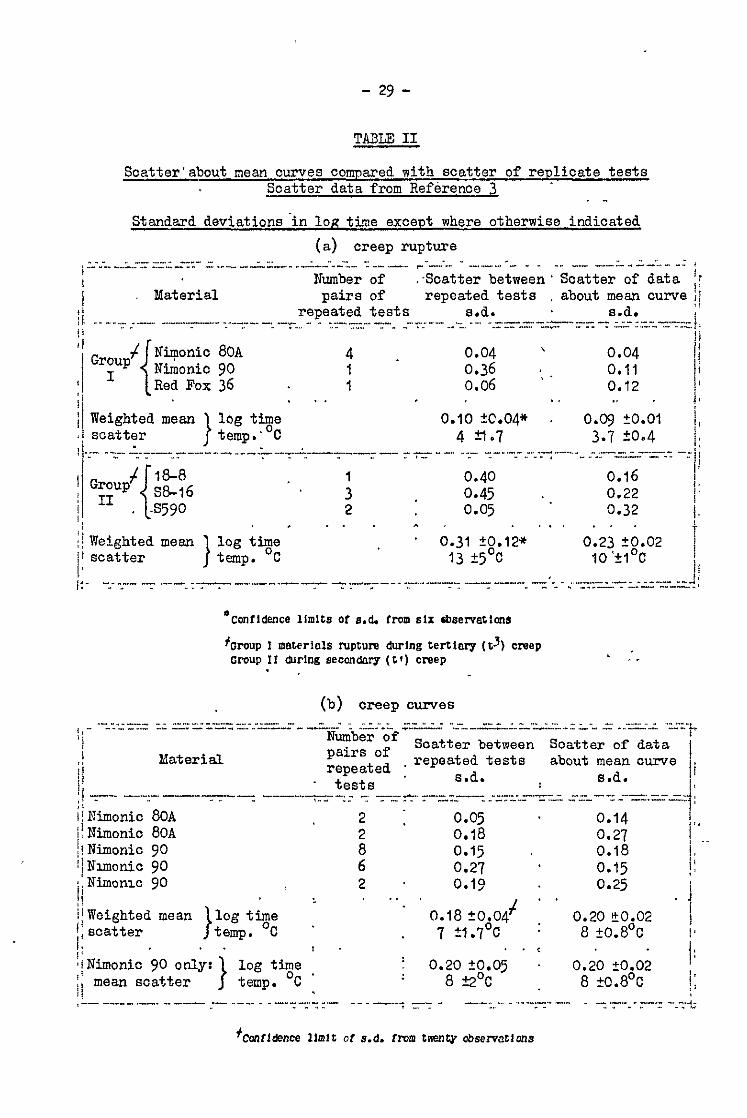
Scatter about mean curves compared with scatter of replicate tests
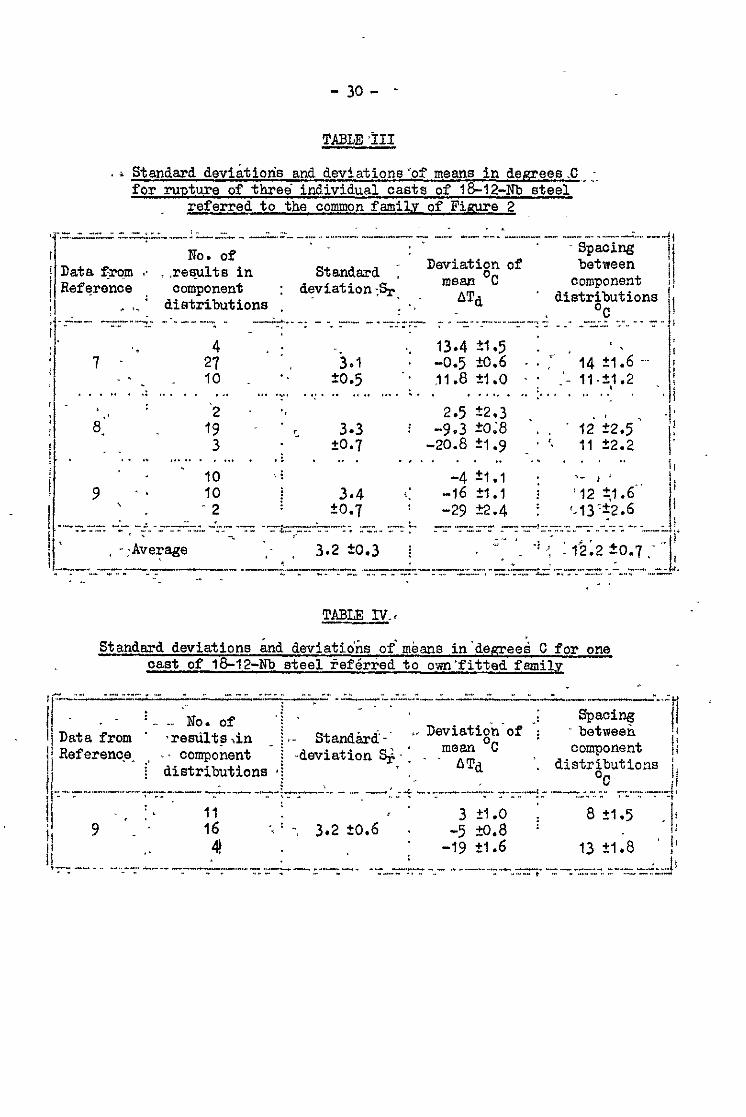
Standard deviations and deviations of means in degrees C for rupture of three individual casts of 18-12-K% steel referred to the common family of Figure 2
c Standardrdeviations andsdeviations of mesns in degrees C for one cast of 18-12-i% steel referred to own fitted family
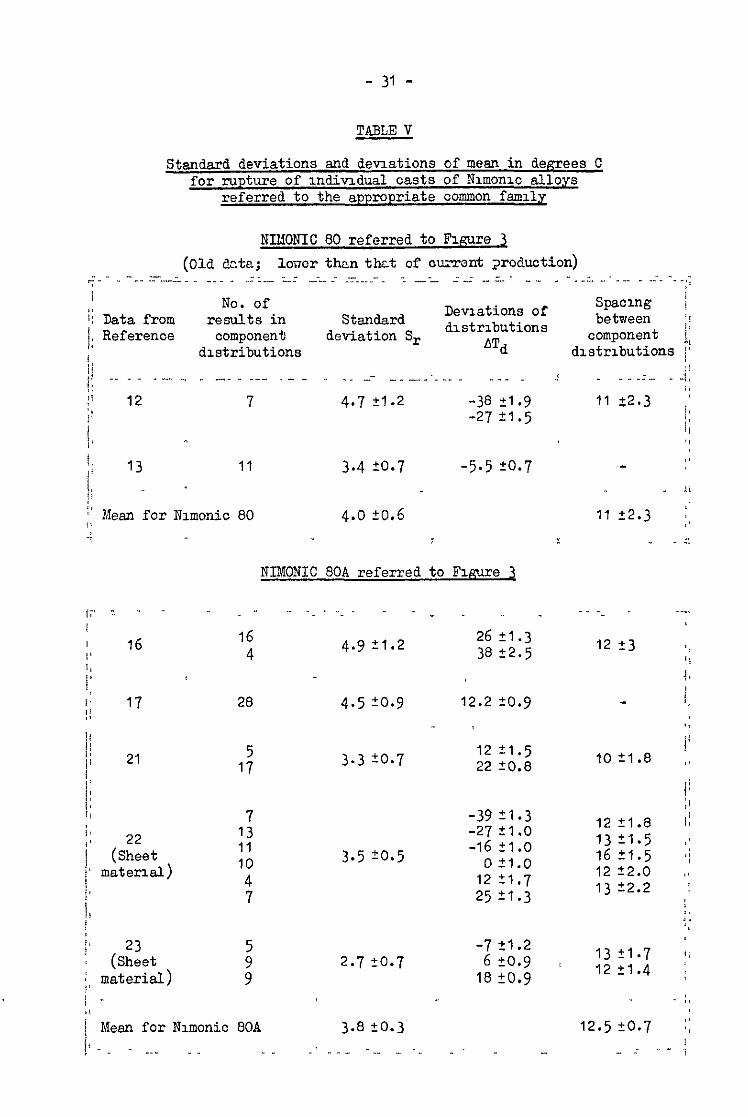
Standard deviations and deviations of mean in degrees C for rupture of individual casts of Nimonio alloys referred to the appropriate common family
Standard deviations and deviations of means in degrees C for creep of individual casts of Nimonid 80, referred to appropriate common families
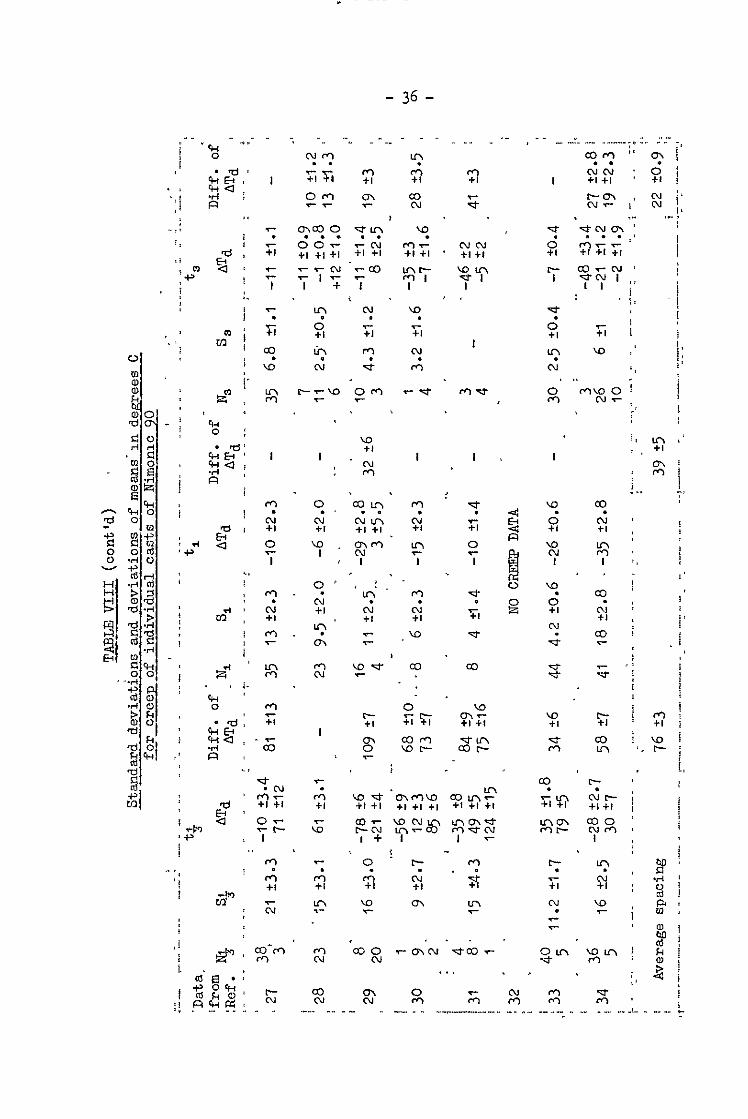
Standard deviations and deviations of means in degrees C for creep of individual casts of Nimonic 808
Standard deviations and deviations of means in degrees C for creep of individual casts of Nimonio 90
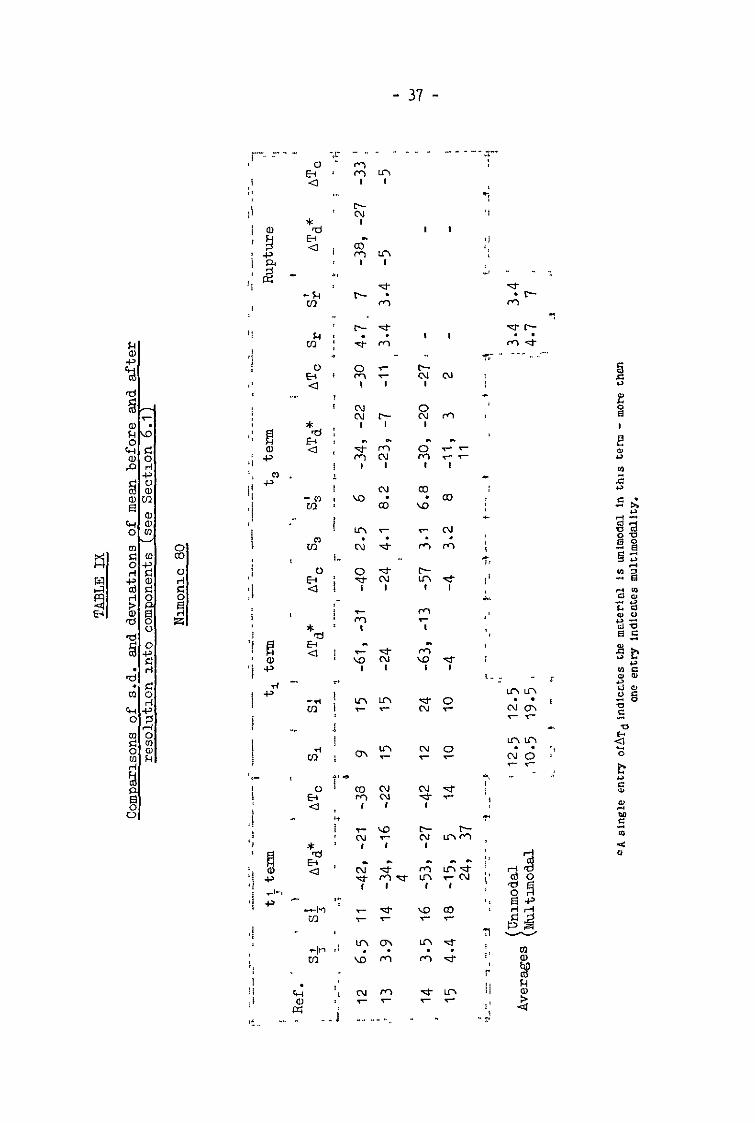
Comparisons of s.d. and deviations of mean before and after resolution into components, Nimonic 80. (Qx Section 6.1)
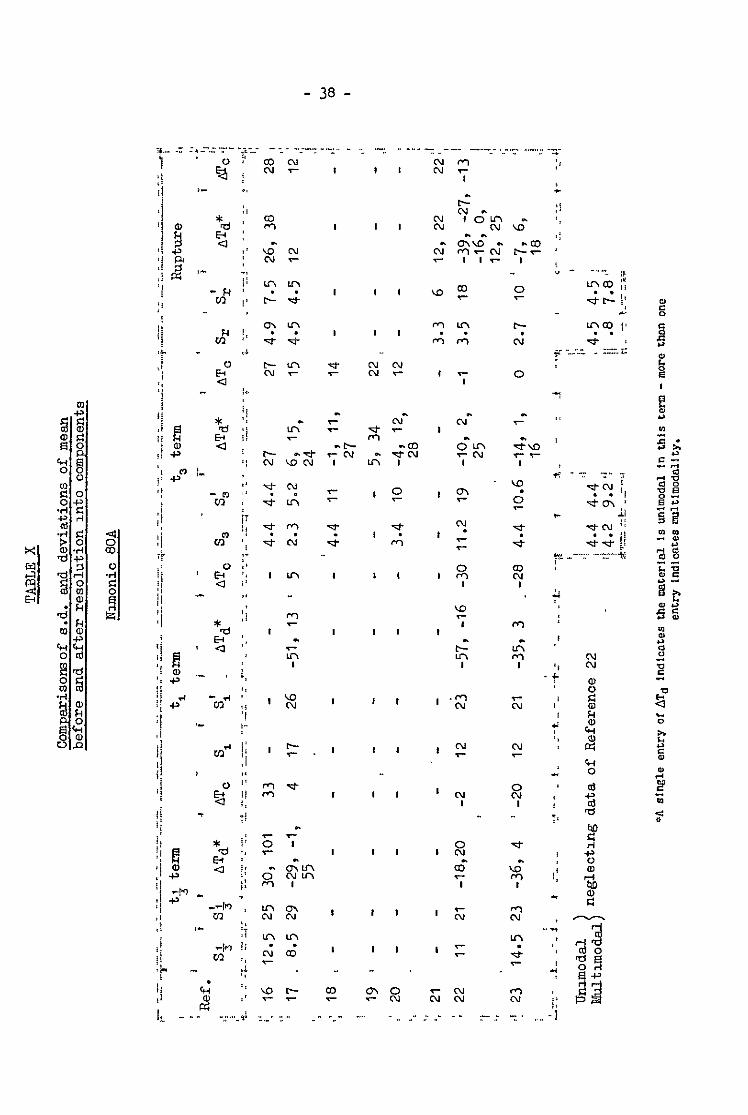
Comparisons of s.d. and deviations of mean before end after resolution into components, Ntionic 80.
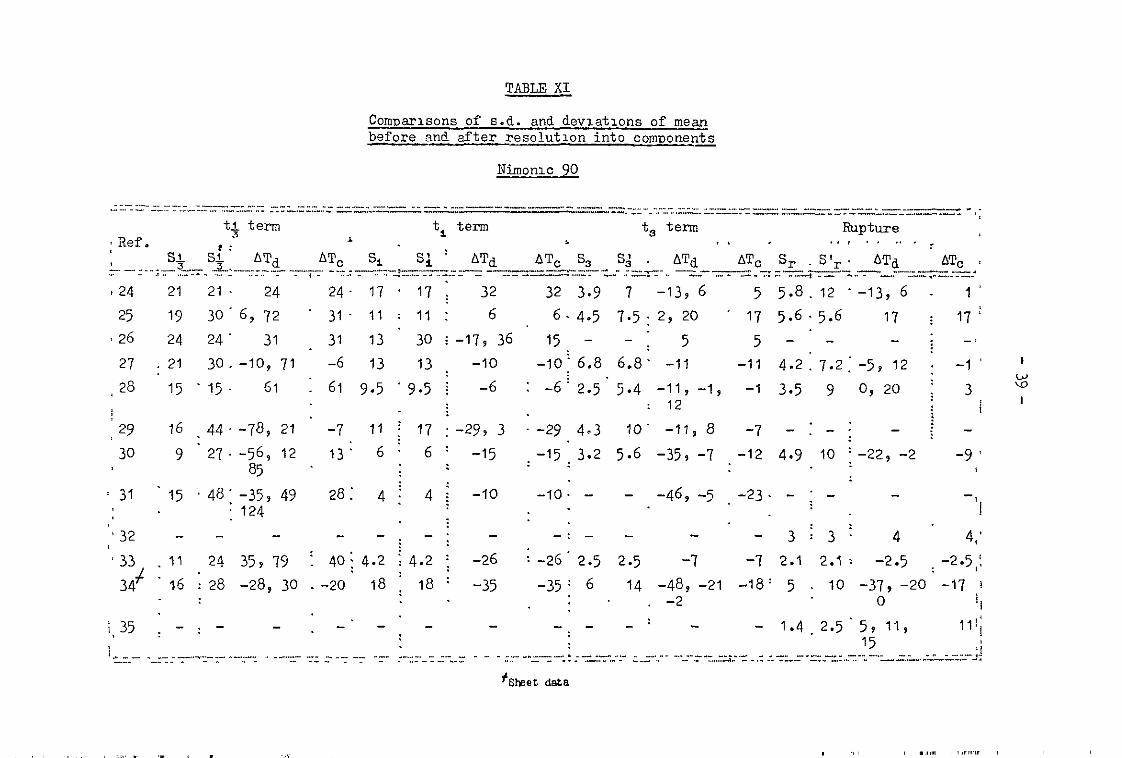
Comparisons of 8.d. and deviations of mean before and after resolution into components - Nimonic 90
19 20 21 21
22
23
20
29
30
30
31
33
34
35
37
38
39
-4-
FOR. No.
1
G
74 B
8A, B
9
10
11
IIA
12
12A, B
Title
List of symbols
Method. for resolving a multimodal distribution into : its components
Title
Sample of evidence indicating scatter in extrapolation to be no greater then in direct fitting
Common family for rupture of I&12-i% steel
Common family for rupture of Eimonic SO and Nimonxc SOA
Common family for rupture of Nimonic 90
Sample creep rupture graph suggesting scatter. more uniform in log time than log stress or stress
.- - 'a) Eksmple Qf scatter data showing substantially normal distribution .
&le of data‘showing bimodal distribution. - .
Example of data showing appksntly irregular scatter
Scheme of regularities in a group of sets for a I single alloy
Standard deviation of Nimoniorupture data versus date of testing t . I, ,
- , Rupture data far single cast of 18-12-M, steel showing effect of stress end temperature on, scatter , r
Ogive of scatter in,Figure 11 i ..
Rupture data including replicate test results for single cast of 18-12-MO steel .
Ogives of scatter in Fignre'l2' '-
E%E
40
43
Fig. No.
13
13A
14
14A
15
15A
16
17
18
19
20
21
22
23
24
25
26
-5-
ILLUSTRATIONS (cont'd)
Title
Rupture data for single cast of 18-12-Nb steel (Reference 8)
Ogive of scatter in Figure 13
Rupture data for single cast of I&12-Nb in form of superheater tube
Ogive of scatter in Figure 14
Rupture data of Reference 9 for 18-124% in form of steam tube
Ogive of scatter in figure 15
Common log stress'versus log t.;fsmily for Nimonics 80 and SOA
Common log stress versus log t, family for Nimonics 80 and BOA
Common log stress versus log tc family for Nimonics 80 end 80A
Common log stress versus log t, family for Nimonics 80 and SOA
Distribution of scatter in creep and rupture times for one cast of Nimonic 80 about common families
Diagrammatic summary of scatter of Nimonios 80, 80A about commcn families
Common log stress versus log t+ family for Nimonic 90
Common log stress versus log tl family for Nimonio 90
Common log stress versus log ta family for Nimonio 90
Common log stress versus log t, family for Nimonic 90
Distribution of scatter in creep snd rupture times for one cast of Nimonio 90 about common families

Fig. No.
27
28
29
30
31
32
33
34
35
36 Final division into five components
-6-
ILLUSTEUTIONS (cont'd)
Title
Diagrammatic summary of scatter of Nlmonic 90 about common fenllies
s.d. of Nlmonlc 90 creep versus date of testing
Nimonio 90 rupture data for five casts indicating distribution of trlmodal creep in bar
Nlmonic 80-80A rupture data for four casts indioat- mg distribution of trimodal creep in bar
Overall standard deviations of Nlmonic 80A end 90 rupture data versus date of testing
First example - direct plot of scatter data
First example - initial divlsion of &ta into components
Second example - direct plot of scatter &ta
Second example - initial division into two components
1 .o Introduction
A ltited study of the scatter of experimental creep data was previously made3 in order to assess the fit of a creep formula proposed by A. ~rshsm~,2A and to establish the validity of the formula as a means of extrapolatron on a statistacal basis. This study suggested some interest- ing regularities end its extensaons to cover a wider range of material in greater detaal was undertaken. The results, summarised in Reference 36, sre described in detail in the present Paper.
1 .I Creep formula
The creep formula proposed on the basis of experimental widence end general considerations by A. Grshsmlr2A represents creep strain E as the sum .?f a number of power law terms in stress U, time t, end temperature T thus:
. ...(l)
where the time-temperature parameter @ in each term takes the form*
@r = t(T’ - T)-a’ when T’ > T
r r
cr
% = t(T - TG)” when T > Tf
The exponents k and p are taken from the sequences:
k = ..+, 1, 3, ..*
F/k = 1, 2, 4, 8, 16 . . .
while the quantities C end T’ are constants for a particular sample of material, being evaluated by fitting Equation (1) to the experzmental data. F’rom this formula, curves of log strain versus log time, log stress versus log time end log time versus temperature can readily be calculated. The formula can also be used2 to represent rupture data. When the constants have been chosen to give the closest fit to a set of experamental data, the
OThe parmeWr $b In the first farm, with T’ > T, wBs proposed* to represent the observed lncPXme8
with temperature 01 the slope (a log t/aT) of 8ome log time VOWS tempWstUIP graphs. 8o lncrea~e
not represented by other parometers. It vm convenient to use 19 In t& secrnd form for those
other graphs whose slope decreased with CemperatUm. In this second form It Is 1ndlstIngulshable
fn procflce fmm the Dam parameter t exp i-Q/,).
-0-
family of curves - described below as a fitted family - is considered to represent the mean properties of the material.
1.2 Previous comparison of individual sets of data with formula
In previous work, comparisons of fitted curves with experimental creep curves and their cross-plots indicated agreement to within the apparent scatter for 164 out cf 178 sets of data referring to 50 different materials e.g., Nimonic alloys, stainless and low alloy steels and aluminium alloys. The remaining 14 sets are considered in Section 5.3. Much of this work was reported in Reference 28 but some of the more recent com- parisons have not been reported.
For the few sets of data for which replicate tests were available a more precise indication of the agreement of the formula with results was obtained by a numerical comparison of the overall scatter of experimental points with the scatter of replicate tests. For this purpose the scatter was assumed to be Gaussian in log time and the comparison was made between the respective standard deviations. (The assumption is examined in detail in Section 2.1 below.)
The standard deviations, of which a sample is shown in Table II, agreed t
3 within their statistical confidence limits. The comparison was
extended ~4 to tests of extrapolation, in which formula 1 was fitted to short time experimental data only snd then compared with long time data. Figure 1 taken from Reference 3 is a sample of the results which show that scatter in the extrapolated region is no greater then in the directly fitted regxon.
In these analyses however some relatively small anomalies were noted which suggested that scatter was not simply Gaussian. For exsmple, the scatter ogives A and C in Figure 1 appesr to have a non-Gaussian tarl. Such anomalies could not be effectively studied from replicate data alone, since there was too little of it. However, the agreement between the scatter determined from fitted curves snd from replicate tests justified the use for this purpose of data containing no replicate tests, and so the range of materials and test conditions for which scatter could be studied was considerably increased.
1.3 Previous comparison of data from several casts of a single material with the formula - common family
Detailed comparisons between different casts of a single alloy were made possible by the observation that when Equatron (1) was individually fitted to the data for different casts of any one Nimonic alloy, the fitted curves did not appear to differ significantly in shape, and it appeared possible to refer the data for all casts to a common family of fitted curves. Common families were therefore constructed by trial for all the alloys for which adequate data was readily available, namely 18-12-i% steel, Nimonic 80, Nimonic SOA, Nimonic 90. Common families of log stress versus log time curves for rupture of the four alloys are presented In Figures 2 to 4; the corresponding families relating to the creep curves of the last three are in Figures 16 to 18 and 22 to 24.
-9-
While the common family may be considered to represent approximately the mean properties of the casts examined, no special attempt NBS made t0 find the precise mean of casts, smce the family is used essentially as a datum to which each cast is separately referred. As a datum, it was expected to represent closely the trend of properties with stress and temperature, since it was generally derived from several hundred test results; as a mean of casts it had little statistical signifiCsnce because of the small number (3 to 9) of casts from which results were drawn.
It appeared that the data for eny one east could be related to the corresponding common curve (whether for a component of creep or for rupture) merely by an overall displacement AT in temperature (where AT0 is the mean of the deviations of individual poin%s from the common curve). The scatter about the displaced common family as measured by the standard deviation was no greater than the standard deviation about a family fitted individually to the particular set of data.
A few points were discrepant whether referred to the common or the individual1 fitted family, and were provisionally attributed (Reference 3 Section 5.2 7 to multimodal creep.
These earlier comparisons of scatter have not been presented in detail because they are largely superseded by the results of the present study, but they served to establish the common families shown in figures 2 to 4, both as representing the mean properties of a material and as a promising basis for detailed analysis of scatter.
1.4 Scope of present Note
The present report examines the results of the previous work in greater detail by means of a detailed study of scatter and its departures from a simple Gaussian form. It considers 26 casts of the four alloys mentioned above together with a single cast of IS-12-MO steel. Each cast of the four was compared with the appropriate common family, but for lS-12-Me steel only the individually fitted family for the single cast was available. The study has both indicated regularities in the scatter and provided additional evidence of the agreement of the scatter from fitted curves with that from replicate tests. The agreement of formula 1 with experimental data and the validity of common families are thereby supported more closely.
2.0 Expression and analysis of scatter
In the previous studies, scatter (cf. Section 2.2) was assumed without detailed study to be both uniform in log time snd distributed according to the Gaussian law. Moreover, no distinction was made between the different stages of creep. It is now appropriate to examine these assumptions in some detail.
2.1 Choice of variables
When three of the experimental variables - stress, strain, time and 0 temperature - are specified, the deviation of experimental points from the
fitted Curves can be expressed in terms of the fourth veriable. If the
- 10 -
deviation is to be uniform, the fourth variable must be chosen so that, for the widest possible range of data, its average deviation is independent of the values of the other three.
It is desirable to use a common measure for creep curves and for rupture, hence the quantities stress, time, and temperature are to be preferred to strain. A choice is also possible between the absolute detia- tion 6x and the relative deviation 6x/x or 6(log x). The range of stress end time is suffioiently large to reveal srgnificent differences between absolute and relative deviations, but the range of temperature is much smeller. Hence a choice must be made between five quantities which may be
6t 6a denoted St, SC, ST, y, 7 b A cursory examination of creep data is
sufficient to reject St, since, for example, a deviation of 10 hr would be far too large for tests of 10 hr duration or less, but far too small for
tests of 10,000 hr. A choice between 6a; F, and $involves some study
of the more extensive sets of data e.g., that in Figure 5. This data, for the creep rupture behaviour of S.590 alloy, has been fitted with a family of curves, and the deviations of individual points from the curves measured, in terms of each quantity. The data has been arbitrarily divided into five regions covermg the stresses I.1 to 4.5, 4.6 to 11.1, Il.2 to 22, 23 to 31, 32 to 45 t.s.i. In each region the algebraic sum of the deviations was substantially zero (confirming that the curves represented average pro- perties), but the deviations averaged without regard to sign varied from one stress range to another, see inset Table in Figure 5. Inspection of the Table indicates a systematic change with stress for'both Spend SO/C, but
the variations of $ are not systematic and sre small enough to be
statistically insignificant: thus the scatter in these data may be oon-
6t sidered uniform in - t or in 6(lag tame). The final choice between log time
end temperature is less easily made, since according to the formula
a1orrt = _ 20 aT
c 1 T’ - T
. ...(2)
end this ratio does not change rapidly unless the testing temperature T approaches T'. In the present report the set of data in Reference 25 is the only one that provides definitive evidence. In this set teats at 1000°C are only 16OC from the T': this data favours a constant deviation in temperature. None of the other sets of data deny it.
Thus in the analysis that follows, deviations in temperature are generally reported. As data for replicate tests is more immediately avail- able in terms of log time, it has for convenience been plotted in this wsy. From Equation (2), since replicate tests are all at the same temperature, the ratio between deviations in log time end deviations in temperature is constant.
- 11 -
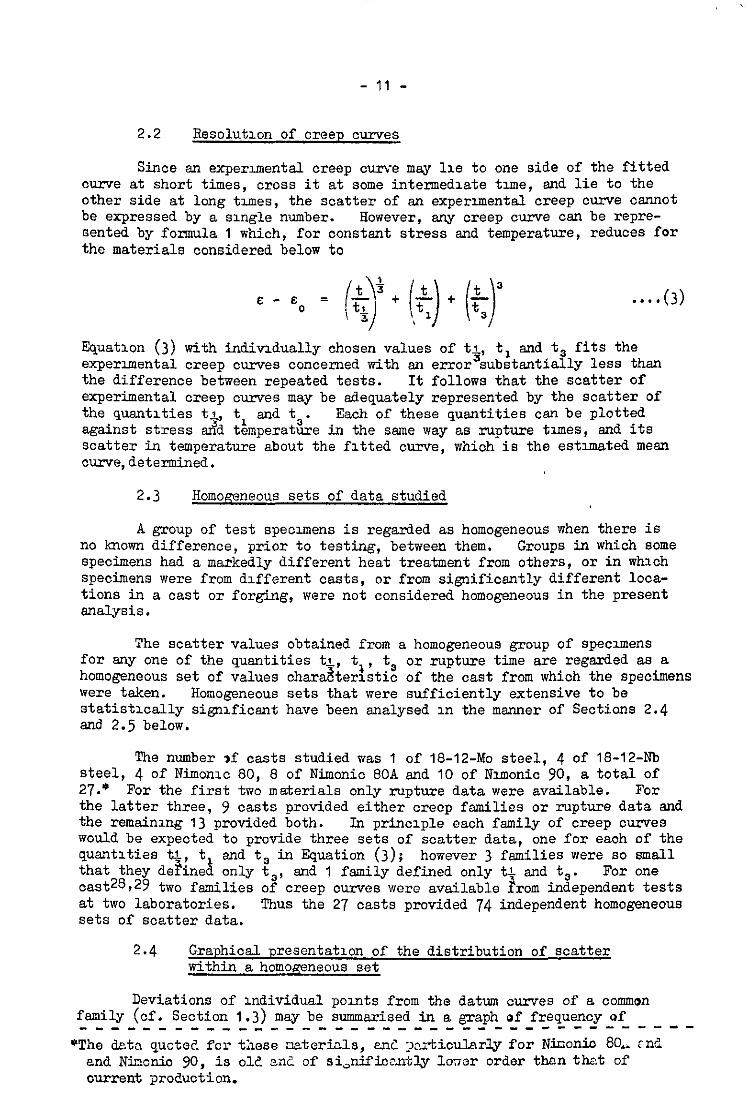
2.2 Resolution of creep curves
Since an experimental creep curve may lie to one side of the fitted curve at short times, cross it at some intermediate time, and lie to the other side at long times, the scatter of an experimental creep curve cannot be expressed by a single number. However, any creep curve can be repre- sented by formula 1 which, for constant stress and temperature, reduces for the materials considered below to
. ...(3)
Equation (3) with individually chosen values of t+ t, and t, fits the experimental creep curves concerned with an error substantially less than the difference between repeated tests. It follows that the scatter of experimental creep curves may be adequately represented by the scatter of the quantities t+, tl and ts. Each of these quantities csn be plotted against stress and temperature in the same way as rupture times, end its scatter in temperature about the fitted curve, which is the estimated mean curve, determined.
2.3 Homogeneous sets of data studied
A group of test specimens is regarded as homogeneous when there is no known difference , prior to testing, between them. Groups in which some specimens had a markedly different heat treatment from others, or in which specimens were from different casts, or from significantly different loca- tions in a cast or forging, were not considered homogeneous in the present analysis.
The scatter values obtained from a homogeneous group of specimens for sny one of the quantities tl, t t or rupture time are regarded as a homogeneous set of values chara&e&& of the cast from whioh the specimens were taken. Homogeneous sets that were sufficiently extensive to be statistxally significant have been analysed in the manner of Sections 2.4 and 2.5 below.
The number ,f casts studied was 1 of 18-12-MO steel, 4 of 18-12-m steel, 4 of Nimonic 80, 8 of Nimonic 806 and 10 of Nimonic 90, a total of 27.. For the first two materials only rupture data were available. For the latter three, 9 casts provided either creep families or rupture data and the remaining 13 provided both. In principle each family of creep curves would be expected to provide three sets of scatter data, one for each of the quantities ti, t, and t, in Equation (3); however 3 families were so small that they de?ined only t and 1 family defined only ti and t,. For one oast28,29 two families oa’creep curves were available ?rom independent tests at two laboratories. Thus the 27 casts provided 74 independent homogeneous sets of scatter data.
2.4 Graphical presentation of the distribution of scatter within a homomneous set
Deviations of individual points from the datum curves of a common family (cf. Section 1.3) may be summarised in a graph of frequency af -----_--____-_---_---------------------
‘The data quoted for these natcrials, ad ~~zti.cul.arly for Ninonic 80., snd and Nimonio 90, is old and of si,nificantly lo;iar order than that of ourrent groduotion.
- 12 -
occurrence of deviation versus magnitude of deviation in the form of a histogram Figure 6A in which the scale of deviation is divided. into intervals of arbitrary width, and all values within an interval are represented by a single ordinate of frequency.
An alternative presentation as a graph of cumulative frequency ageinst deviation in the form of en ogive Figure 6B which is effectively the integral of the histogram. It is however convenient for subsequent cal- culations to use arithmetic probability scales e.g., in Figure 6C, upon whach a Gausslen distribution is represented by a straight line whose slope is proportional to the standard deviation. In the particular application of this method here used (AppendixII), it is not necessary to divide the data into intervals, since each point on the ogive can be plotted at its observed deviation. The method is more efficient for small samples of data.
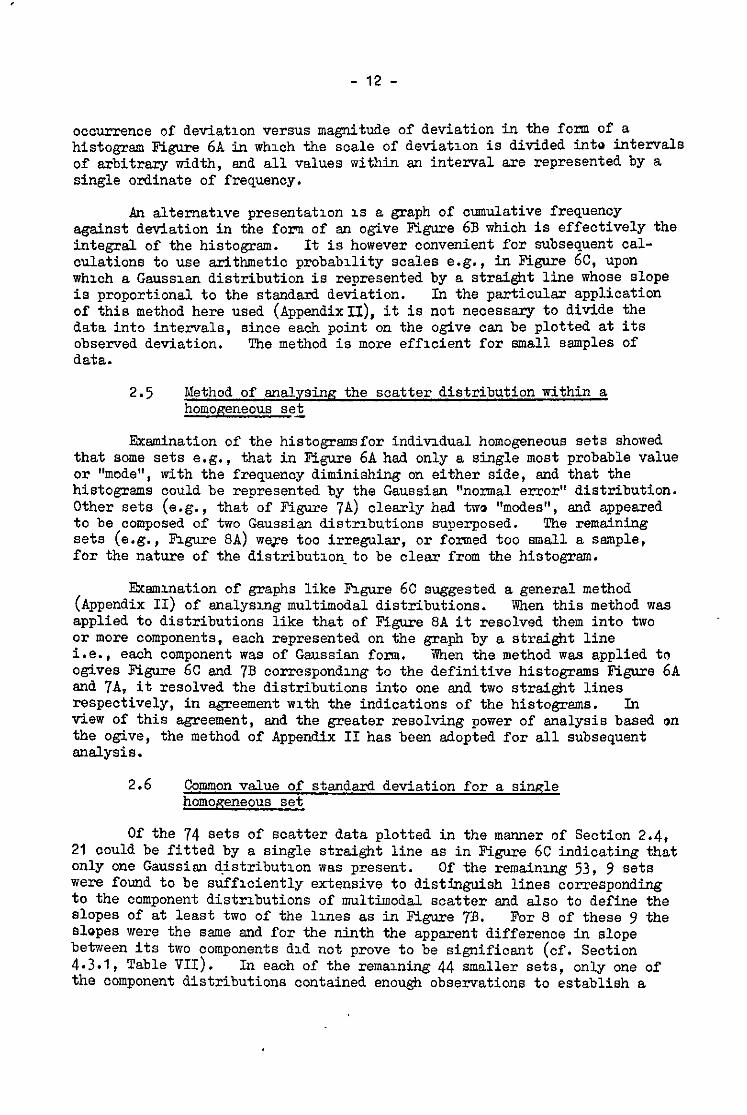
2.5 Method of analysing the scatter distribution within a homogeneous se2
Examination of the histogremefor individual homogeneous sets showed that some sets e.g., that in Figure 6A had only a single most probable value or "mode", with the frequency diminishing on either side, and that the histogrems could be represented by the Gaussian "normal error" distribution. Other sets (e.g., that of Figure 7A) clearly had two "modes", and appeared to be composed of two Gaussian distributions superposed. sets (e.g.,
The remaining figure SA) were too irregular, or formed too small a sample,
for the nature of the distribution-to be clear from the histogram.
Exemznation of graphs like figure 6G suggested a general method (Appendix II) of enalysrng multimodal distributions. '#hen this method was applied to distributions like that of Figure SA it resolved them into two or more components, each represented on the graph by a straight line i.e., eaoh component was of Gaussian form. iKen the method was applied to ogives Figure 6C end 723 corresponding to the definitive histograms Figure 6A end 7A, it resolved the distributions into one end two straight lines respectively, in agreement with the indications of the histogrems. In view of this agreement, and the greater resolving power of analysis based on the ogive, the method of Appendix II has been adopted for all subsequent analysis.
2.6 Gommon value of standard deviation for a single homogeneous set
Of the 74 sets of scatter data plotted in the manner of Section 2.4, 21 could be fitted by a single straight line as in Figure 6C indicating that only one Gaussian distribution was present. Of the remaining 53, 9 sets were found to be sufficiently extensive to distinguish lines corresponding to the component distributions of multimodal scatter and also to define the slopes of at least two of the lmes as in Figure 7B. For 0 of these 9 the slopes were the same and for the ninth the apparent difference in slope between its two components did not prove to be significant (cf. Section 4.3.1, Table VII). In each of the remanin@; 44 smaller sets, only one of the component distributions contained enough observations to establish a
- 13 -
slope, but the slope was accepted by the points for the remaining component or components of the set.
Thus, for each set of data, whether for rupture or for the tl, t, or t, component of creep in any one of the 27 casts examined, the stsn&d deviations of all components appeared to be the same.
Each of the terms in Equation (3) was assumed to have a different standard deviation, as also was the time to rupture: the separate values are conveniently denoted SL S,, Se and Sr,. Observed values of these quantities given in Tables'b to VIII, range from 1*4'C to 24'C.
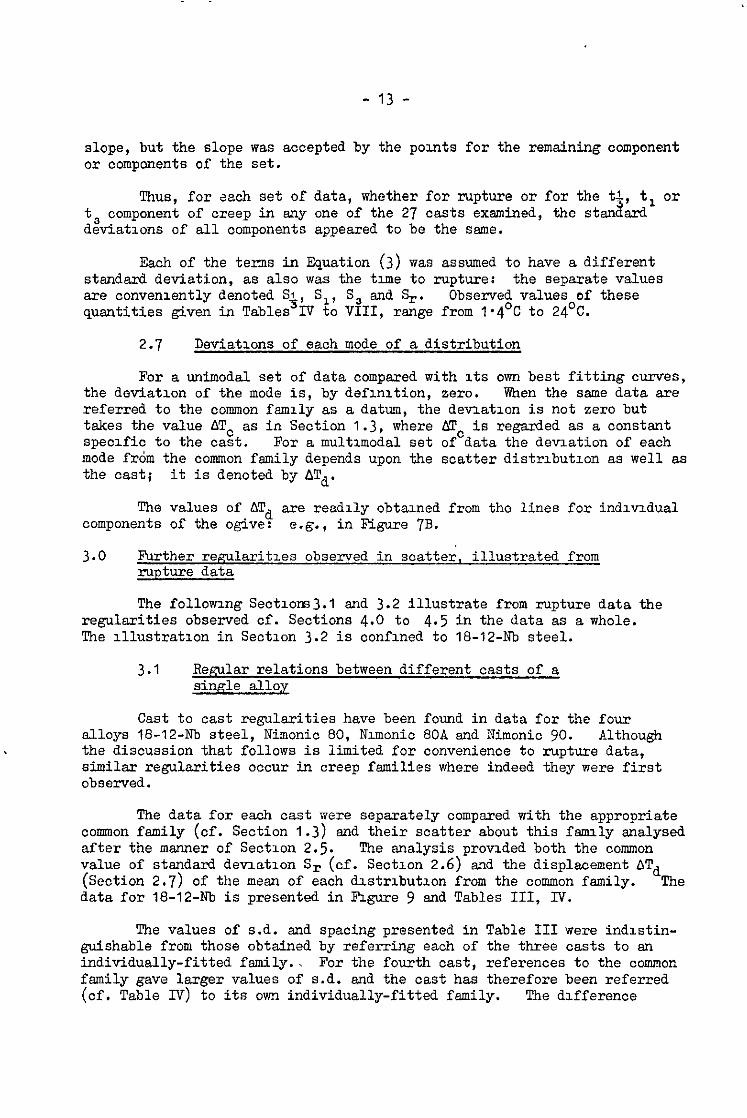
2.7 Deviations of each mode of a distribution
For a unimodal set of data compared with its own best fitting curves, the deviation of the mode is, by definition, zero. Vihen the same data are referred to the common family as a datum, the deviation is not zero but takes the value ATT, as in Section 1.3, where flc is regarded as a constant specific to the cast. For a multimodal set of data the deviation of each mode from the common family depends upon the scatter distribution as well as the cast; it is denoted by ATd.
The values of ATd are readily obtained from the lines for individual components of the ogive: e.g., in Figure 7B.
3.0 Further regularities observed in scatter, illustrated from rupture data
The following Sectlons3.1 and 3.2 illustrate from rupture data the regularities observed cf. Sections 4.0 to 4.5 in the data as a whole. The illustration in Section 3.2 is confined to 18-12-I% steel.
3.1 Regular relations between different casts of a single alloy
Cast to cast regularities have been found in data for the four alloys IB-12-Nb steel, Nimonic SO, Nimonio SOA and Nimonic 90. Although the discussion that follows is limited for convenience to rupture data, similar regularities occur in creep families where indeed they were first observed.
The data for each cast were separately compared with the appropriate common family (of. Section 1.3) and their scatter about this fsmily analysed after the manner of Section 2.5. The analysis provided both the common value of standard deviation Sr (cf. Section 2.6) and the displacement ATd (Section 2.7) of the mean of each distribution from the common family. The data for 18-12-Nb is presented in Figure 9 and Tables III, IV.
The values of s.d. and spacing presented in Table III were indistin- guishable from those obtained by referring each of the three casts to an individually-fitted family.. For the fourth cast, references to the common family gave larger values of s.d. and the cast has therefore been referred (cf. Table IV) to its own individually-fitted family. The difference

- 14 - ,
between the fourth cast end the other three is attributed in Section 4.1 to a large difference in heat treatment that was observedlo to change both metallographic structure and creep properties.
In the three Nlmonic alloys the heat treatment variations were less marked, and all sets for eaoh could be satisfactorily referred to their common family (see Sections 4.2 and 4.3).
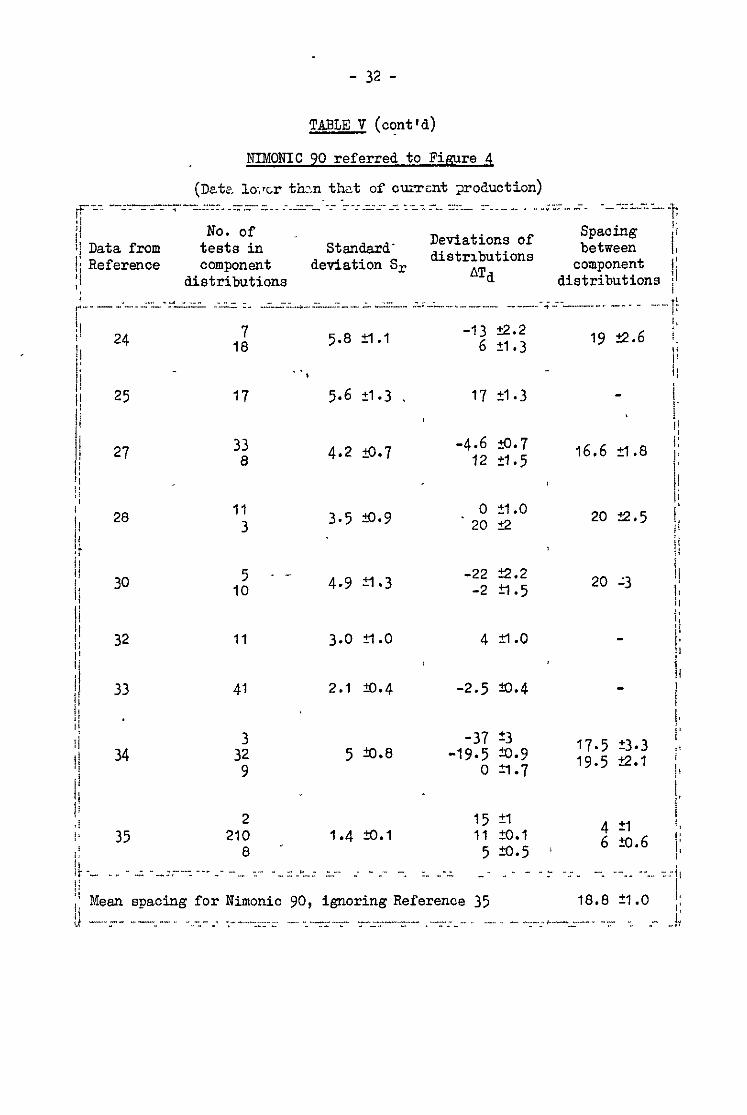
For each of the four alloys, Tables III and V show that the different casts had the same spacing between the component distribution to within the estimated confidence limits. The standard deviations Sr of Nimonrcs 808 and 90 varied systematically cf. Figure IO with date of testing (e.g., for Nimonic 90 from 5.8 tl.l'C in 1951 to 1.4 20.l°C in 1963), but corresponding evidence for 18-12-I% steel and Nzmonic 80 was not available because the several casts were tested at about the same time. At sny one time the s.d. does not seem to vary between one cast and another, or between one testing laboratory and another.
Some of the values of Sr relate to ununodal data (denoted U in Figure IO) others to multimodal (M) data - it is apparent that both fit the same curve to within the confidence limits. The relative numbers of test specimens falling into one distribution rather than another appeared to vary from cast to cast, but different casts were tested under somewhat different stresses and temperatures. Since (cf. Section 3.2) the relative numbers also vary with stress snd temperature, the limited data available was not sufficient to establish that the variation would still occur if different casts had been tested under the same conditions.
3.2 Effect of stress end temperature on scatter
Where as in Figure 9.the several component distributions barely over- lap, each individual point ten be assigned with reasonable confidence to one distribution or another. Ekperimental points in the log stress versus log time graph oan be coded to indicate to which distribution they belong. For example, in Figure 11, which presents the rupture data analysed at the top of Figure 9, experimental points falling into the low-temperature component- distribution of Figure 9 are denoted by filled circles, those in the inter- mediate component by half-filled, and those in the high temperature component by open circles.
Mgure 11 which relates to 18-12-Nb steel shows rather clearly en effect which can also be discerned (Sections 4.2.2 snd 4.3.2) in the other alloys. The proportion of low, medium and high points varies with stress and temperature: in particular, points for the low temperature component occupy a wedge-shaped region around 10 t.s.i., with points for the high temperature component around Its boundary.
For any one osmponent, the displacement of individual points from the family of curves does not vary systematically with either stress or tempera- ture, as is readily seen by inspection of the intermediate temperature points whose mean displacement is almost aero: these half-filled points are seen to scatter randomly about tne curves. The absence of any systematic trend with stress or temperature within a component is further evidence of the validity of the oommon femily.
- 15 -
4.0 More extensive analysis of results
This section continues the discussion of Section 3.0 on ruptUre data in greater detail, end extends-it to the corresponding features of creep data. Specific features shown by individual alloys and casts are briefly discussed.
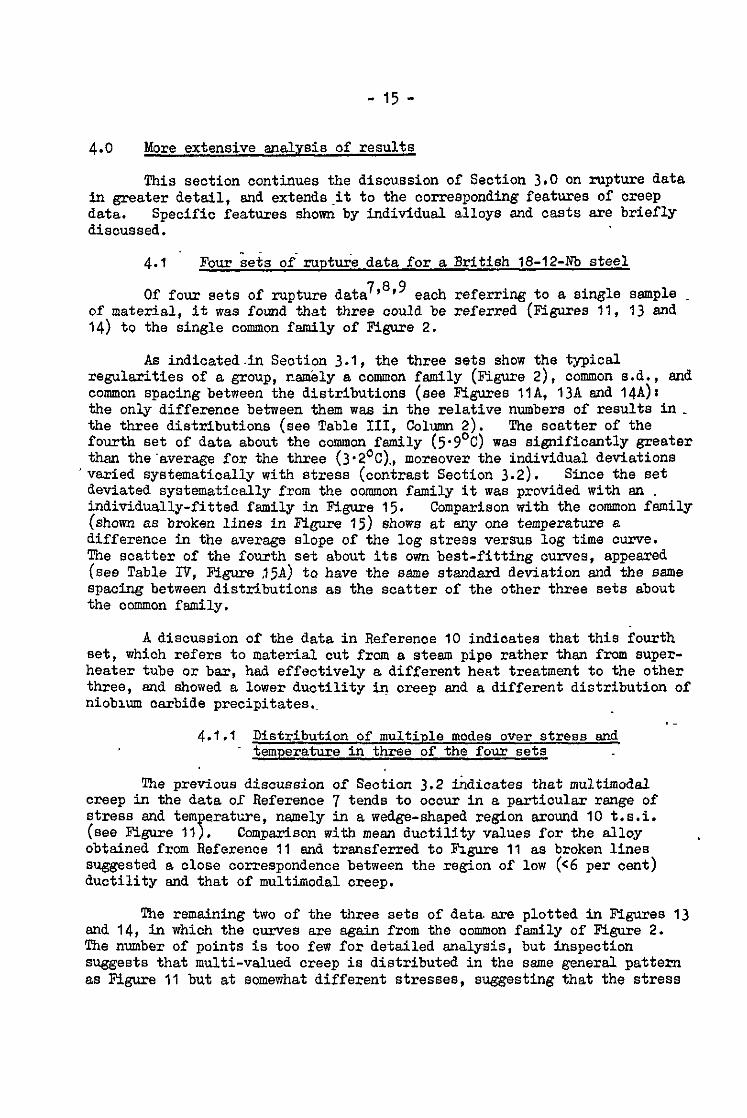
4.1 Four sets of rupture data for a British 18-12-h% steel
7,899 Of four sets of rupture data each referring to a single sample of material, it was found that three could be referred (Figures 11, 13 end 14) to the single common family of Figure 2.
As indicated in Section 3.1, the three sets show the typical regularities of a group, namely a common family (Figure 2), common s-d., and common spacing between the distributions (see Figures IIA, 13A and 14A): the only difference between them was in the relative numbers of results in- the three distributions (see Table III, Column 2). The scatter of the fourth set of data about the common family (5.9’C) was signifioantly greater then the’average for the three (3*2OC)., moreover the individual deviations varied systematically with stress (contrast Section 3.2). Since the set deviated systematically from the common family it was provided with sn . individually-fitted family in Figure 15, Comparison with the common family (shown as broken lines in Figure 15) shows at any one temperature a difference in the average slope of the log stress versus log time curve. The scatter of the fourth set about its own best-fitting ourves, appeared (see Table IV, Figure 15A) to have the seme standard deviation and the 881138 spacing between distributions as the scatter of the other three sets about the common family.
A discussion of the data in Reference 10 indioates that this fourth set, which refers to material cut from a steam pipe rather than from super- heater tube or bar, had effectively a different heat treatment to the other three, and showed a Lower ductility in creep and a different distribution of niobium oarbide precipitates.~
4.f.l Distribution of multiple modes over stress end temperature in three of the four sets
The previous discussion of Section 3.2 indicates that multimodal creep in the data of Reference 7 tends to occur in a particular range of stress end ten erature, namely in a wedge-shaped region around 10 t.s.i. (see Figure 11 P. Comparison with mesn ductility values for the alloy , obtained from Reference 11 and transferred to Figure 11 as broken lines suggested a close correspondence between the region of low (<6 per cent) ductility and that of multimodal creep.
The remaining two of the three sets of data eze plotted in Figures 13 and 14, in which the curves are again from the common family of Figure 2. The number of points is too few for detailed analysis, but inspection suggests that multi-valued creep is distributed in the seme general pattern as Figure 11 but at somewhat different stresses, suggesting that the stress
- 16 -
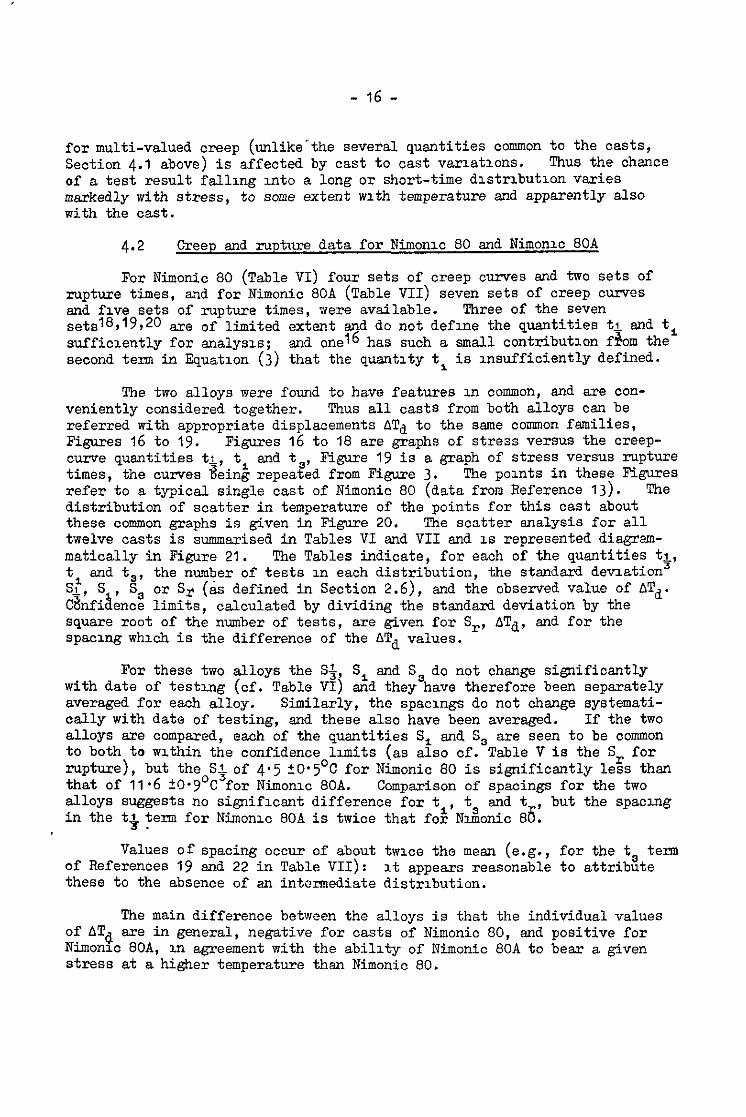
for multi-valued creep (unlike'the several quantities common to the casts, Section 4.1 above) is affected by cast to cast variations. Thus the chance of a test result falling into a long or short-time distribution varies markedly with stress, to some extent with temperature and apparently also with the cast.
4.2 Creep end rupture data for Nimonlc 80 and Nimonic 80A
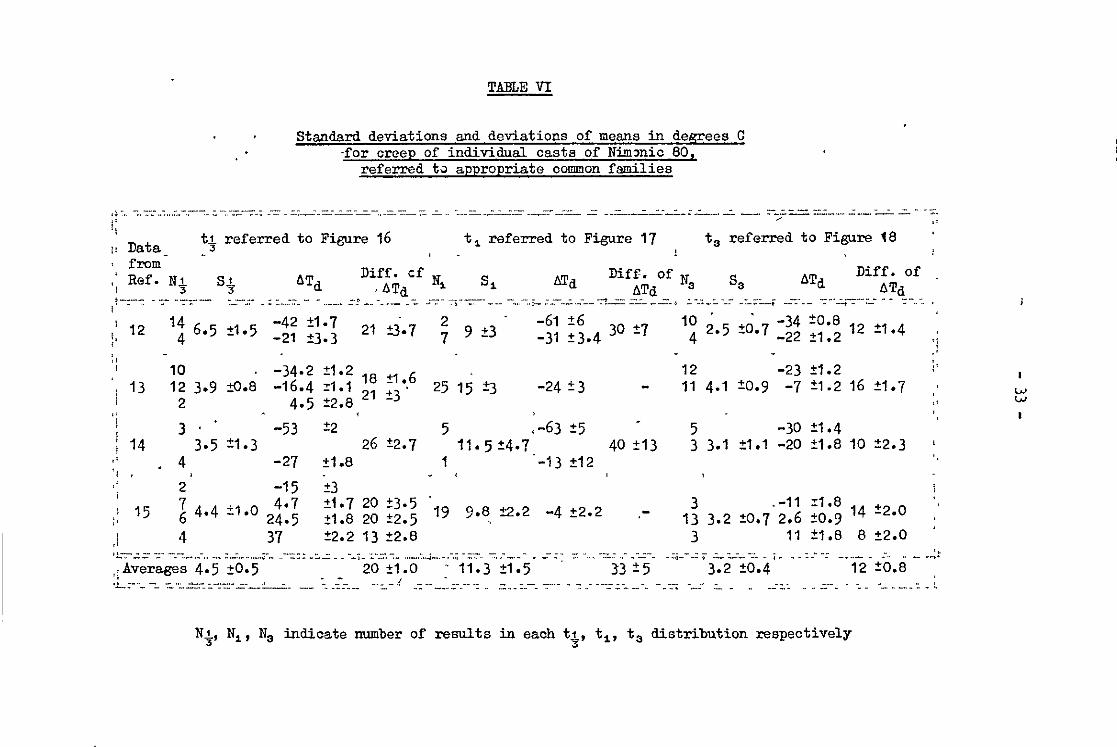
For Nimonic 80 (Table VI) four sets of creep curves end two sets of rupture times, aed for Nimonic 80A (Table VII) seven sets of creep curves and five sets of rupture times, were available. Three of the seven sets18,19,20 are of limited extent and do not define the quantities tl and t, sufficiently for analysis; end one16 has such a small contribution fibm the second term in Equation (3) that the quantity ti is insufficiently defined.
The two alloys were found to have features in common, and ace con- veniently considered together. Thus all casts from both alloys can be referred with appropriate displacements ATd to the ssme common families, Figures 16 to 19. Figures 16 to IS are graphs of stress versus the creep- curve quantities tl, t and ts, Figure 19 is a graph of stress versus rupture times, the curves Beink repeated from Figure 3. The points in these Figures refer to a typical single cast of Nimonic SO (data from Reference 13). The distribution of scatter in temperature of the points for this cast about these common graphs is given in Figure 20. The scatter analysis for all twelve casts is summarised in Tables VI and VII end is represented diagram- matically in Figure 21. The Tables indioate, for each of the quantities tl, t and t,, d, s
the number of tests in each distribution, the standard deviation3 S or Sr (as defined in Section 2.6), and the observed value of ATd.
C&fi%nc~ limits, calculated by dividing the standard deviation by the square root of the number of tests, are given for S,, ATd, and for the spacrng which is the difference of the ATd values.
For these two alloys the S+, S, and Ss do not change significantly with date of testing (cf. Table VI) and they have therefore been separately averaged for each alloy. Similarly, the spacings do not change systemati- cally with date of testing, and these also have been averaged. If the two alloys are compared, each of the qusntities S, end. S, are seen to be common to both ta wrthin the confidence limits (as also cf. Table V is the S, for rupture), but the SL of 4-5 +0*5'C for Nimonic 80 is significantly less than that of Il.6 tO*g°C3for Nimonic 80A. Comparison of spacings for the two alloys suggests no significant difference for ti, ts and t , but the spacing in the t; ten for Nimonic 80A is twice that for Nlmonic 86.
Values of spacing occur of about twice the mean (e.g., for the t, term of References 19 end 22 in Table VII): it appears reasonable to attribute these to the absence of en intermediate distribution.
The main difference between the alloys is that the individual values of ATd are in general, negative for casts of Nimonic 80, and positive for Nimonic 80A, in agreement with the ability of Nimonic 80A to bear a given stress at a higher temperature than Nimonic 80.

- 17 -
4.2.1 Details of individual casts
For the four casts of Nimonic 80 ncne of the 14 individual values of s.d. or 15 values of rpaclng deviated from the mesn by more than their 95 per cent confidence limits, snd most were within the 64 per cent confidence limits: it thus appears that the four casts had both common values of SL S 1, Ss and Sr and ccmmon values of the corresponding.spacings. 3'
For Nimonic 80A however, cne value of standard deviation for the ts term (Ss = 11.2 Y-3) fell above the 99.99 per cent confidence limits and one (Ss = 2.3 ?O*A)foll bolowftKmr.5efonner set of data refers to sheet material. The larger scatter of this sheet data may correspond to an early stage in sheet manufacture, since a subsequent set of sheet data23 has a normal value of s.d., namely 4-4 +0*9'C; no reason csn be offered for the low s.d. snd low value of spacing in the bar data of Reference 17.
As in Section 3.1 no significant difference is found between the standard deviation of a unimodal set and an individual distribution of a multimodal set.
4.2.2 Distribution of multiple modes over stress and temperature
NC single set of bar data for Nimonics 80 and 80A (nor cf. Section 4.3.2 for Nimonic 90) defines a region of multimodal behaviour as clearly as the set of data for 18-12-Nb steel in Figure 11. The available rupture data for Nimonics 80 snd BOA bar has therefore been aggregated in Figure 30, and compared with the common graph. Each cast is identified by a tag while the three distributions are identified, as in Figure 11, by filled circles for the low ATd, half-filled for the medium ATd, and open for the high ATd distribution. Since in Table V no more than two distributions were in each sample of bar material (contrast Table IV), the most numerous
present
distribution has been taken as the medium ATd distribution.
The displacement AT If attention is given to t pi
is a function of cast as well as of distribution. e proportion of points that are either filled or
open this is seen to be greatest in the region between 16 and 28 t.s.i. at temperatures between 600 and 700°C i.e., a similar stress range but a lower temperature to the region observed (Section 4.3.2) in Nimonic 90. The dis- t^ribution of-multiple values in the two sets of sheet data is more complex snd cannot be fully resolved from the evidence at present available, and so it has not been reported here.
4.3 Creep and rupture data for Nimonic 90
Most of the discussion of Section 4.2 above applies also to Nimonic 90, for which nine sets of rupture data and ten sets of creep curves were considered. The common graphs are presented in Figures 22 to 25, the experimental points referring to the data of Reference 27. The scatter data for this cast is shown in Figure 26; the scatter of all 11 casts is summarised in Figure 27. The S+, S, and S, decrease systematically with date of testing (see Table VIII and Figure 28). With two exceptions noted in Sections 4.3.1 the s.d. of the various casts whether unimodal or
,
- 18 -
multimodal. do not deviate by more than the 95 per cent confidence limit from the line of s.d. versus date of testing in Figure 28; similarly the spacings deviate no further from their respective means. The mean values of spacing are significantly different from those for Nimonics 80 and 80A.
4.3.1 Details of individual casts
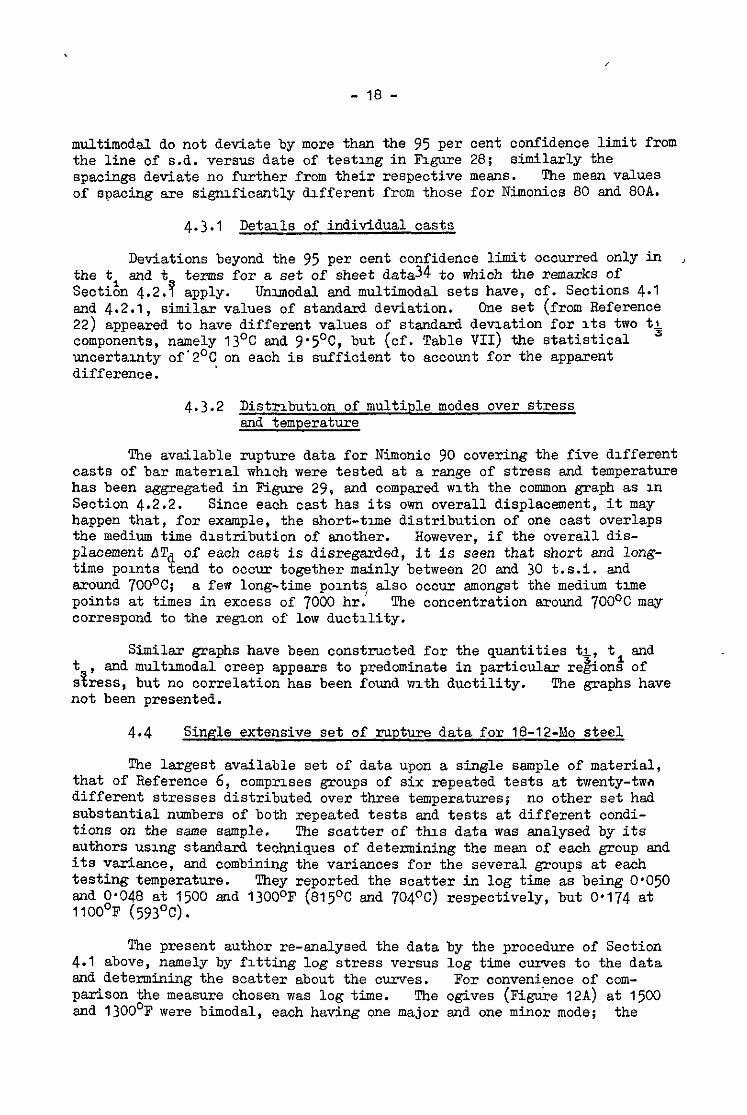
Deviations beyond the 95 per cent confidence limit occurred only in the t and t terms for a set of sheet data34 to which the remarks of Sect& 4.2.7 apply. Unrmodal and multimodal sets have, cf. Sections 4.1 and 4.2.1, similar values of standard deviation. One set (from Reference 22) appeared to have different values of standard deviation for its two t& components, namely 13'C and 9*5OC, but (cf. Table VII) the statistical uncertainty of'2OC on each is sufficient to account for the apparent difference. '
4.3.2 Distribution of multiale modes over stress end temperature
The available rupture data for Nimonic 90 covering the five different casts of bar material which were tested at a range of stress and temperature has been aggregated in Mgure 29, and compared with the common graph as in Section 4.2.2. Since each cast has its own overall displacement, it may happen that, for example, the short-time distribution of one cast overlaps the medium time distribution of another. However, if the overall dis- placement ATd of each cast is disregszded, it is seen that short and long- time points tend to occur together mainly between 20 and 30 t.s.i. and around 7OOOC; points at times
a few long-time pomts, also occur amongst the medium time in excess of 7000 hr. The concentration around 700°C may
correspond to the region of low ductility.
I9
Similar graphs have been constructed for the quantities t$? tl and and multrmodal creep appears to predominate in particular regrons of
s ress, but no correlation has been found rmth ductility. The graphs have not been presented.
4.4 Single extensive set of rupture data for lb12-MO steel
The lergest available set of data upon a single sample of material, that of Reference 6, comprises groups of six repeated tests at twenty-two different stresses distributed over three temperatures; no other set had substantial numbers of both repeated tests end tests at different condi- tions on the same sample. The scatter of this data was analysed by its authors using standard techniques of determining the mean of each group and its variance, and combining the variances for the several groups at each testing temperature. They reported the scatter in log time as being OS050 and 0.048 at 1500 and 1300°F (815OC and 704oC) respectively, but 0.174 at IlOO'F (593'C).
The present author re-analysed the data by the procedure of Section 4.1 above, namely by fatting log stress versus log time curves to the data and determining the scatter about the Curves. For convenience of oom- psrison the measure chosen was log time. The ogives (Fig&e 12A) at 1500 and 13OO'F were bimodal, each having one major and one minor mode; the
- 19 -
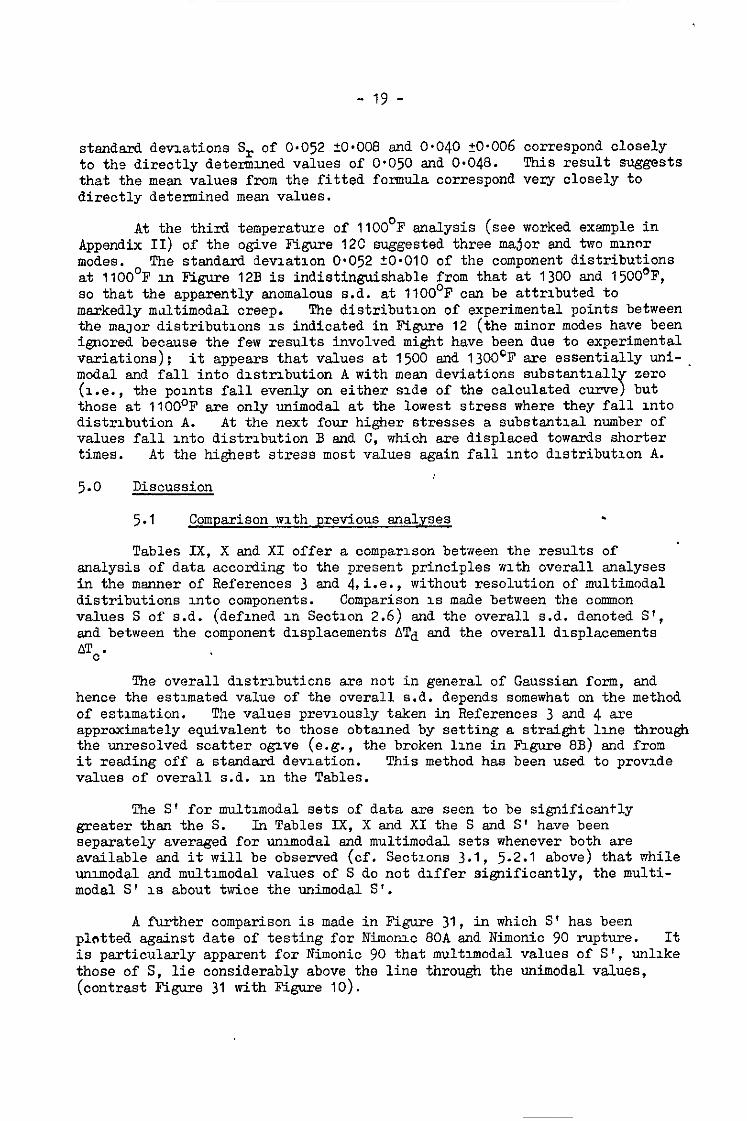
standard deviations Sr of O-052 +O*OOS and 0.040 +0.006 correspond closely to the directly determined values of 0.050 and 0*048. This result suggests that the mean values from the fitted formula correspond very closely to directly determined mean values.
At the third temperature of 1100'F analysis (see worked example in Appendix II) of the ogive Figure 12C suggested three major and two minor modes. The standard deviation O-052 ?O-010 of the component distributions at 1100'F in Figure 12B is indistinguishable from that at 1300 and 1500oF, so that the apparently anomalous s.d. at 1100'F can be attributed to markedly mdtimodal creep. The distribution of experimental points between the maJor distributions is indicated in Figure 12 (the minor modes have been ignored because the few results involved might have been due to experimental variations); it appears that values at 1500 and 1300'F are essentially uni-. modal and fall into distrrbution A with mean deviations substantially zero ( 1.e., the points fall evenly on either side of the calculated curve) but those at IIOO'F are only unimodal at the lowest stress where they fall into distribution A. At the next four higher stresses a substantial number of values fall into distrrbution B and C, which are displaced towards shorter times. At the highest stress most values again fall into distribution A.
I 5.0 Discussion
5.1 Comparison with previous analyses .
Tables IX, X and XI offer a comparison betiteen the results of analysis of data according to the present principles with overall analyses in the msnner of References 3 and 4,i.e., without resolution of multimodal distributions into components. Comparison is made between the common values S of s.d. (defined in Section 2.6) and the overall s.d. denoted S', and between the component displacements ATd and the overall displacements ATo.
The overall distributions are not in general of Gaussian form, and hence the estimated value of the overall s.d. depends somewhat on the method of estimation. The values previously taken in References 3 and 4 are approximately equivalent to those obtained by setting a straight line through the unresolved scatter ogxve (e.g., the broken lane in Figure SB) and from it reading off a standard deviation. This method has been used to provide values of overall s.d. in the Tables.
The S' for multimodal sets of data are seen to be significantly greater then the S. In Tables IX, X and XI the S and S' have been separately averaged for unimodal and multimodal sets whenever both are available and it will be observed (cf. Sections 3.1, 5.2.1 above) that while unlmodal and multimodal values of S do not differ significantly, the multi- modal S' is about twice the unimodal S'.
A further comparison is made in Figure 31, in which S' has been plotted against date of testing for Nimonic BOA and Nimonic 90 rupture. It is particularly apparent for Nimonic 90 that multimodal values of S', unlike those of S, lie considerably above the line through the u&nodal values, (contrast Figure 31 with Figure 10).
- 20 -
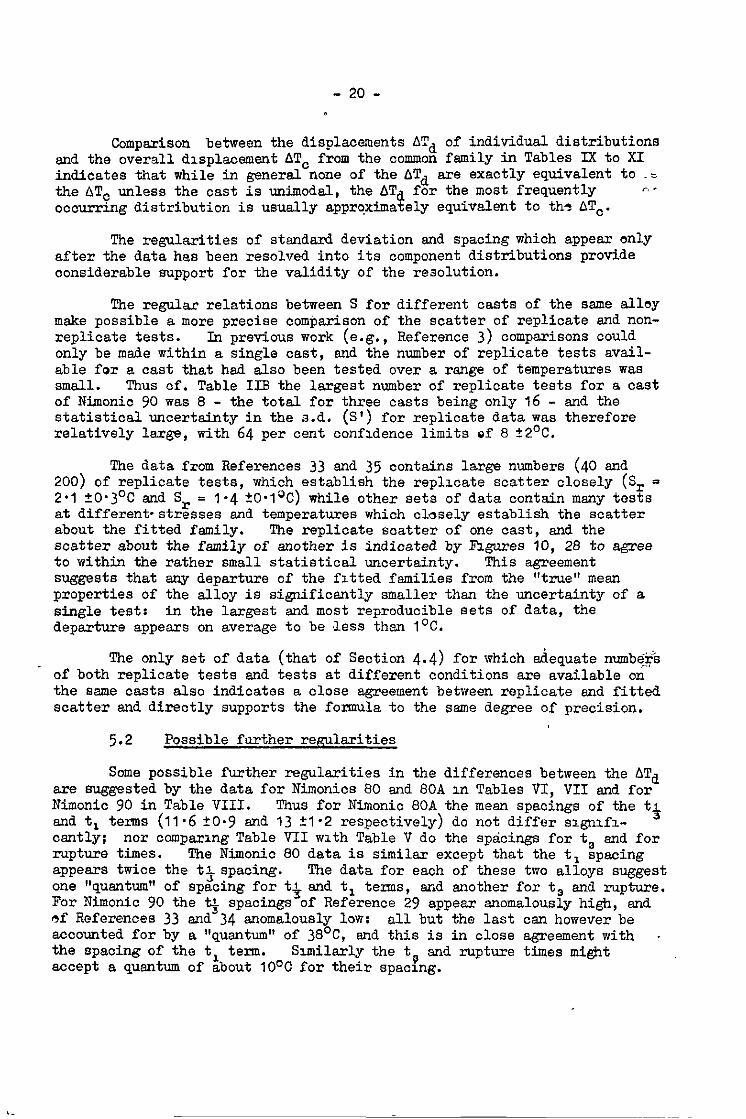
Comparison between the displacements ATd of individual distributions and the overall displacement AT, from the common family in Tables IX to XI indicates that while in general none of the ATd are exactly equivalent to .Z the AT, unless the cast is unimodal, the ATd for the most frequently c+ occurring distribution is usually approximately equivalent to the AT,.
The regularities of standard deviation and spacing which appear only after the data has been resolved into its component distributions provide considerable support for the validity of the resolution.
The regular relations between S for different casts of the same alley make possible a more precise comparison of the scatter of replicate snd non- replicate tests. In previous work (e.g., Reference 3) comparisons could only be made within a single cast, and the number of replicate tests avail- able for a cast that had also been tested over a range of temperatures was small. Thus cf. Table IIB the largest number of replicate tests for a cast of Nimonic 90 was 8 - the total for three casts being only 16 - and the statistical uncertainty in the s.d. (S') for replicate data was therefore relatively large, with 64 per cent confzdence limits of 8 t2'C.
The data from References 33 and 35 contains large numbers (40 and 200) of replicate tests, which establish the replicate scatter closely (Sr = 2.1 +0*3'C and Sr = 1.4 +O*loC) while other sets of data contain many tests at different-stresses and temperatures which closely establish the scatter about the fitted family. The replicate scatter of one cast, and the scatter about the family of another is indicated by figures 10, 28 to agree to within the rather small statistical uncertainty. This agreement suggests that any departure of the fitted families from the "true" mean properties of the alloy is significantly smaller then the uncertainty of a single test: in the largest end most reproducible sets of data, the departure appears on average to be ,less than I'C.
The only set of data (that of Section 4.4) for which adequate numbe$s of both replicate tests and tests at different conditions are available on the same casts also indicates a close agreement between replicate and fitted scatter and directly supports the formula to the same degree of precision.
5.2 Possible further regularities
Some possible further regularities in the differences between the ATd are suggested by the data for Nimonics 80 and 80A in Tables VI, VII and for Nimonic 90 in Table VIII. Thus for Nimonic 80A the mean spacings of the t+ and t, terms (11.6 to.9 and 13 +I*2 respectively) do not differ signifi- csnt1y; nor comparing Table VII with Table V do the spacings for t, and for rupture times. The Nimonic 80 data is similar except that the t, spacing appears twice the t$ spacing. The data for each of these two alloys suggest one "quantum" of spacing for t$ end t, texms, end another for t, and rupture. For Nimonic 90 the t+ spacings of Reference 29 appear anomalously high, and ef References 33 and 34 anomalously low: all but the last csn however be accounted for by a "qusntum" of 3S°C, and this is in close agreement with . the spacing of the t, term. Similarly the te and rupture times might accept a quantum of about 10°C for their spacing.
- 21 -
The evidence thus suggests the possibility of further regularities in the scatter of expermental data, but is not adequate to establish them.
5.3 Appasentlv discrepant data
The 14 sets of data to vphich Equation (1) could not be directly applied included several sets tested over such a wide range of temperature that metallurgical changes are either known to occur (e.g., from ferrite to austenite in FV.448 around SOO'C) or may be suspected. All 14 sets of data could be fitted up to the stage of log time versus temperature crossplots, but one of the crossplots showed either a discontinuity or a change of slope at some critical temperature. Thus e.g., for FV.448 data covering a range of 500 to 1000°C the rupture crossplot for slope -$ had a marked disconti- nuity at 800°C, with en entirely different value of C and T' above the discontinuity to that below it. There was apparently no discontinuity in the other crossplots.
In all 14 sets, if the data were divided into parts at the discon- tinuity, each of the parts could be fitted to within the estimated scatter by the formula.
It is possible that the discontinuities involving change of C and T' may be multimodal creep in a more extreme form, but data presently available appears inadequate to confirm or deny the possibility. .
5.4 Summary of results
For the four alloys I&12-Nb, Nimonio SO, Nimonic 80A and Nimonic 90 the agreement of Equation (1) with experimental data has been confirmed to within the confidence limits of the present scatter analysis; for the best sets of rupture data, these limits do not exceed ?l°C. The validity of common families has been confirmed to the same degree of accuracy - the only cast (one of IS-124%) for which a common family was not appropriate was one which had been given a markedly different heat-treatment to the others. Scatter has been evaluated, and the form of its distribution shown to be ' basically Gaussian, but generally with more than one mode. Resolution has been made of multimodal distributions into their components. The quantities defining the scatter have displayed regularities, in that to within con- fidence limits the standard deviation of a component distribution appears to be common both to all distributions in a cast and, at any one time, to all casts of an alloy, (it tends to diminish from earlier to later casts presumably as the alloy is developed); also the spacing between distri- butions is common to all distributions end all casts. The regularities apply equally to rupture data and to the three terms of Equation (3) into which families of creep curves may be resolved.
Hence the common family, and the spacing between distributions, appear to be properties of the alloy, and the standard deviation to be typical of the alloy at a particular date; the deviation AT of a parti- cular cast from the common family is a specific property of t he cast. The relative number of tests falling into one distribution rather then sncther varies wrth stress and temperature; there appear to be certmn regions of stress and temperature where multimodal creep is common, others where it is
- 22 -
not. The limited information available suggests that regionsof multimodal creep correspond to regions of low ductility snd of unsatisfactory behatiour in service. The relative numbers appear to vary from cast to cast. from this connection of multimodality (with both unusually long, and
Apart
unusually short, rupture times) with ductility troughs, no clear correlation was found between the time to rupture snd the strain at rupture.
Although supporting evidence for other alloys would be desirable, it appears probable that the creep properties of-m alloy could be.eoonomically established by testing a single cast over-a wide range of stress and tempera- ture, thus establishing a representative family of curves, followed by determination of the mean displacement ATd for individual casts by a few tests of short duration. The tests that establish the family should also establish the current standard deviation.end the spacing between distri- butions, together with the presence and probable location of multimodal creep regions. They generally need not extend to the same length as the service life, since it would appear 3 that an adequate defined set of creep data can be extrapolated without significent.error by up to IO/l in time. The mean properties of any one cast are then obtained by displacing the representative family by the amount ATd.
If design stresses fall outside any multimodal regions, the displaced representative family and the standard deviation may be-used to calculate stresses and temperatures for a given chance of failure: if however they fall within such regions, not only must the mean properties be referred to the lowest-temperature distribution, but also a risk of premature failure should be allowed for.
6.0 Conclusion
The regularities observed in the scatter of^creep and creep-rupture data have proved amenable to sn analysis similar to that previously used to estimate mean properties. The previously derived creep formula is found to represent mesn creep properties for Nimonics 80, 80A and 90, and for 18-12-N!J steel, to well within the statistical uncertainty of a single test. Its use for extrapolation has been supported to within uncertainties of similar magnitude. Analysis by meens'of.the.formula has been shown‘to provide . reliable values of stsndsrd doviation without replicate tests and to indicate the presence or absence of multimodal creep. It is apparent that the individual properties of several casts of any one of these alloys could have been determined by extensive tests on a single cast to establish the common family, together with brief calibration tests on each of the others to determine its individual displacement, ATd. Limited studies of other Nimonic alloys suggest that common families may be equally valid for these also, and there is no apparent reason why such families should not be used for stainless and low steels when the compositions and heat treatments are adequately controlled.
For alloys for which common families prove valid, it appears that - design information can be obtained, with only a moderate testing effort, in sufficient detail to specify the entire course of the creep curve and its scatter and thus provide a basis for detailed mechanical design.
It is hoped that this study of creep data and its regularities may also provide some guidance to the alloy developer.

- 23 -
FfEFEREI'EES
&. Author(s).
I A. Graham
2 A. Graham
2A K. F. A. Walles A. Graham
3 K. F. A. Wallos A. Graham
4 K. F. A. Walles A. Graham
5 N. J. Grant A. G. Bucklln
6 F. Garofalo R. W. Whitmore W. F. Domis F. von Gemmingen
7 H. W. Rirkby R. J. Truman
a K. L. Irvin0 J. D. Murray F. B. Pickering
9 E. A. Jenkinson M. F. Day A. I. Smith L. M. T. Hopkin
Title. etc.
Phenomenological theories of oreep "The Engineer" 8th and 15th February, 1952.
Regularities in creep and hot-fatigue data, Part I, A.R.C. Current Paper - CP.379, December, j956.
Regularities in creep and hot-fatigue data, Part II, A.R.C. Current Paper - CP.380, Deoember, 1956.
On the extrapolation and scatter of oroep data, A.R.C. Current Paper - cP.680, 1961.
!rn analysis of data from the 1960 Dusseldorf Conference on creep and of rehted data. Unpublished work at N.G.T.E.
On the extrapolation of short-time stress rupture &ta Trans. A.S.M. Vol. 42, p.720, 1950.
Crcop and creep rupture relationship in nn austenitic stainless steel Trans. Met. Sm., AIME Vol. 221, p.310 April, 1961.
Further data on the elevated temperature behaviour of l&84% type austenitia steel. Paper presented at Dusseldorf Confcrenae 1960.
The effect of heat-treatment and niorostructure on the high temperature ductility of l&Cr-12-Ni-1Nh steels. Journal Iron and Steel Inst. October, 1960.
The long-term oreep properties of an 18-C~12-M-INb steel steem pipe and superheater tube. Journal Iron and Steel Inst., p.1011. December, 1962.

- UC-
RBF~C3S (cant’ a)
&
IO
11
12
13
14
15
16
f&h& ---..
R. J. Trumn
V. H. Bailey N. G. Gemxll H. 8. Kirkby J. D. ohm-ay E. A. Jenkinson A. I. Snith
Dxxxssion, Structurd. processes in creep p.348 Synposum of Iron end Steal Institute and the Institute of Metals, London MEW, 1961
Creep properties of austenitxc nic- kel chrotiuzx steels containmg nloblun Proc.1.Mech.E. Vol. 171, 1957, p.911
Natmnal Physical Creep data on en early heat OK2 of Laboratory Niuonio 80
R. '2. Rdley G. R. Tremain
International Nickel (Mona)
K.,P; A. Falles L. $rshon
R. X..Ridley B. S..ii. Iim
'G. R. Tre~izm
17
18
Intcrnetxonal Nickel (li~ncl) _ ‘
International Nickel (EIond)
19 Intornet~onal Nickel (Nod)
20 Int.xnationd. Nmkcl (Mend)
21 C. G. i:ebstcr
Title, etc.
Private comunication
1, summy of the creep and fatiye properties of a supply of Ninonic 80 at 600, 650, 700 .d. 750'~ N.P.L. Engmeering Division No. 471/50
Creep data upon heet MRL of Ninonic 80. Private commnication
Unpublished i4.O.A. Report.
The creep properties of Ninonic 6Oii at 700, 750 and 815'C and the fatque properties at 75O'C for perlocls up to 2000 hours N.P.L. Engineering Division No. 477/51
Creep data upon heat 288 of Ninonic 8OA. Private commnicntion
Creep data upon a heat iiRM of Nimonx 802%. Private cormunmat~on
Creep data upon a heat XRP of Ninonic 8011. Frlvate comunicatmn
Creep sata upon n heat hM of Ninonio 80~:. Private comunication
Rcplicetc rupture tests on Ninonic 80~. Private commnication
- 25 -
I’.lEZNCES (cord’ d) -----
J&b
22
23
24
25 R. a. Ridley
26
27
28
29
30
31
32 E. G. Webster
33
34
E. G. -iebster
A. K. Cruden il. A. Potter
!.uthoa --
A. K. Cruden Ii. ri. potter
Joseph Lucas Research Laboratories
R. li. Rldley B. S. E7. Mann G. R. Tremaln
International Nickel (Ftond)
InternatIonal Nuke1 (Mona)
InternatIonal sxkel (Mot-d)
K. F. A. lialles B. Banner
Bristol Aero-Engmes
A. Gr&m
G. J. Bctes
Tltlo et0 -A--..%
The creep propertxs of Nxnonlc 80 in sheet form. Joseph Lucas Research Laboratories. Report No. B45,929, 1960
Creep properties of another sample of Nlmonic 80. Private communication
The creep and fatlye properties of Nimonic 90 at 700, 750 and 815’C 1l.P.L. high temperature mechanical propertles sectlon HT.3/51
The creep propertles of Nimonlc 90 bar material at 850, 900, 950 &d I OOO’C for periods up to 1000 hours N.P.L. high temperature mechanical propertxes section HT.35/53
Creep data upon heat IF'9 of Nlmonlc 90. Private communw.ation
Creep data upon heat FFK of Nlmonlc 90. Private communxatlon
Creep data upon heat ABDA of Nmonic 90. Private communication
U:~~2lishod iu.0.A. Report.
Unpubluhed data upon Nlmonx 90
An analysu of the scatter in creep of an alloy of Nlmonlc 90 type N.G.T.E. Report No. R.231. A.R.C.21 108 March, 1959
Repluate rupture tests on Nlmonic 90. Private communication
Creep tests on Nimonu 90 material A.I.D. Test Report No. 11.3127
The creep properties of Nimonic 90 in sheet form Joseph Lucas Research Laboratories Report No. B.45,964, 1960
- 26 -
No.
35
36 ' . -,K. F: .A. ReJles
RFFERENCES (cont'd)
Title, etc.
Repeated rupture tests on Nimonic 90 Private communication
Random and systematic factors in the scatter of creep data. N.G.T.E. ~oport No. ~280. July, 1966.

I
Alloy
~
Nimonic 80
Nimonic 80X
Nimonic 90
Red Fox 36
I 8-12-i%
la-8
I a-1 ~-MO
S816
s590
TABLE1
&eep and rupture dato fittedby formula in present rep&
No. of sets
fitted
--A -
2
5
a
1
4
1
1
1
1
.,,“, “,. ,,,,,, ,.,/ ,,, ,L,,, . ,I,
-
Fs -~
0.4
0.3
0.4
67
69
73
64
3
25
-
Typical composition - main constituents
0.6
1.2
1.2
- -
- -
- -
44 3.0
19 -
-
CU
-
-
- 29 -
TA3LE II
Scatter’about mean curves comared with scatter of replicate tests Scatter data from Reference 3 -
Standard deviations in 10~ time except where otherwise indicated
(4 creep rupture ..- . I-..-. -.- - . . i .- . . . --““. ._ --“.- . . _ ___ _-_-_. ..z---_.11- t _- -_ ““-_.._-_. - . .._.” -.. _ . .” . ..__ -.-G.-Z.--L.. -1 8
I Number of . -Scatter between t Scatter of data j: I Material pairs of
,/ repeated tests about mean curve i/
ii !I
_. _ _ ‘f .‘____ . . ..-..---.- ‘. ._._ _-. -. ...,~?Pe.?..~!! ..+Ets. -.-.- me.rvY t4*--..- .: ---.- ..-?-d! ..- ..“.-..._ ! . . .__ . ” _ . . _____-. -_ _ . . . _.- ..-- I .-..“!a Ii
4. 0.04 ' 0.04 1 0.36 : . 0.11
. I 0.06 0.12
' ' ' . ' :' " ' 0.10 +c.o4* o.og +0.01 4 5-l
!i..- . ..- .L.--- ----_.- "-- ___. ̂ -___.__ L-.--- ._-__- _ -- "-" ..- -11-- .-.--I----.. 3.7 to.4
.- . _ _ _ " _ . . , - --_--.- ------- -;/; _. . . -._-. - . .
0.40 0.16 0.45 . . 0.22 //
2 0.05 0.32 'I
is . . . . . I. . . . . . . :
!j Weighted mean
i: scatter I
log time temp. Oc
. 0.31 kO.12" 13 t5Oc
0.23 20.02 / IO '?lOC '/
it- _-'_ . I: '.-. .- "_. ..-- .-.-.- -- _.._- -.-.- - ..-- -;--" .~..-'-.-_" --- "--..-._ . . ." _ _ .-17:-:.x?? z.E.2 -LT..~.-z a
fwo”P I materio1s NPt”l-2 dlmng tertkry (9) creep IImup II during seco”cmy (C’) creep
. . . f 1
(b) creep curves . . . . . . .._- _” ” -.....- --__._.-- . . / _ _..._.._ _- -.--.- -._. “-.--- -..;--’ : __._ __.“. ._ ._... _.. T”-._.” ..- ..z;-1.2--~~~“..; I...” .z: . .-XL..;: -_ *--*
II Number of -“i Scatter between Scatter of data
,i Ikterial pairs of repeated tests about mean curve i I/ repeated :
j! ‘T--. . tests 5.d. 8.d. /i
.---.- -----7 ._.. --.--.-:_ .̂ - _.- _. ‘7 _.--:y r .-=- I--.y “.e~~m.m~--:yL: u:.M~-.M-‘-. ̂ .--.-. -_ ij h’imonic 80~ 2 : 0.05 . 0.14
1:
jl Nimonio 80A ?I
0.18 0.27 i! Nimonic 90 i 0.18 !f Nlmonic 90
0.15 ( 6 0.27 . 0.15
j; :'
ii Nimonlc 90 2. 0.19 . 0.25 I Ij .
ii Weighted mean >
log time / . . . 1
I: scatter Oc . 0.18 eo.04 0.20 HO.02 .
II . . tfmp* , . 7 tl.7°C . 8 +0.8'c !/
!lNimonic 90 only: . .< . f:
” mean scatter log time
iI > 0.20 to.02
temp. OC ’ 0.20 kO.05
8?2'c . 8 to.8'~ I- :a
/.._-.._.__ “--. . .- .-- .-- .-__. .“z-.“.~I- __.-._: ~.l _ --- . . “‘“.‘I_ ---. _ _I .-” . -.- _. - _ . . . . . I ..,o
+c0nridence mic 0r 8.d. rmm cmnw ob~e~~c~0n.9
-3o- -
TABLE?11
.i Standard deviation's and deviations'of means in demees.C_.: for rupture of three individual casts of 1%12-KY steel
referred to the common family of Fimre 2 I. (.-r&.:-A; .rr.+ __--_. . ..--.:.,- _ ---I _.". . .I .1.1 -_-11 - I.-
1 -.- I-'-.-..T - -.._ _. .---L -..i(
I No. of Spacing Deviation of Ii
i Data f:rom I. , ,refglts in between 1 Reference
Standard 1 component : deviation+, mean OC component II
L S? ' diMxibutiona . ' distributions !' _ . . ATd *I / --Le. w.e...-"".;. . . .-.-.. "_ _ --..c ..__ -. _ . OC -.-. _. __.---- 1' ., . _. _..I_ ~ _ _ ...-- _ . ..I v--.z-:- " . . .._". _" . . -".. --.- -" I'
‘j., ': 13.4 51.5 : j -0.5 20.6 - . ." 14 ,;:6 --
. . . . . . . :: . . .
to.5 .' 11.8 +i.o . . _- 11.?,I.2 . . , . ,. . ,. . .* . .
-e--e.. .-I--i- .----. -.-_ - --:'Tf--- ."^ .-.-..-.w.2- ___-. - -. . -_ __ _ _ . . . . ^ L.
TABLE N.c
Standard deviations and deviations of means in.degreek C for one cast of I&12-Nb steel deferred to orn'fittsd femi1.y:
- 31 -
TABLEV
Standard deviations and deviations Gf mean in degrees C for rupture of lndivldual casts of Nlmonlc alloys
referred to the appropriate common fsmlly
NIUONIC 80 referred to Fwure 3
(Old data; lomr th2.n thct of cuz-rent Iroduction) -;.- . -..L-.-..-w.. __. . .;I.- :.r -.-.- .-r ._.. -. -. -.I_ :..c ..z-. __ _ -..z. _--.. . .'.-..:; / No. of /I Data from
Spaolng / results in standard
Deviations of
/, Reference between ;j
component deviation S, dlstrxbutions ATd
component I I* distributions distributions i' ji /j -- . . -.- ., . .-. . ._- . . - _ .; __ . __” :_ . . . . . _ . :
81 12 7 4.7 Cl.2 -38 21.9 1: -27 r1.5
1, 1, 1% 13 11 3.4 20.7 -5.5 zo.7
I 1;
Mean for Nlmonic 80 4.0 20.6
/, material) I I' I I/ I j,
(23 Sheet j, material) / _ ,/
NIMONIC BOA referred to Figure 2
_ . .
16 4
4.9 21.2 26 t1.3 38 "2.5
28
5 17
7 13 11 IO 4 7
9' 9
4.5 50.9 12.2 -20.9
3.3 $0.7 12 '1.5 22 kO.0
3.5 20.5
-39 21.3 -27 21.0 -16 51.0
0 21.0 12 il.7 25 ~1.3
2.7 to.7 -67 iK 18 ;0:9
j Mean for Nlmonic 8OA 3.8 20.3
j/ _ , . - . . . . . .
17 22.3
. .
12 23
10 +I .8
12 il.8 13 ?I.5 16 '1.5 12 k2.0 13 22.2
13 t1.7 12 k1.4
12.5 to.7
_ ; -. ,
- 32 -
TABLE V (cqnt'd)
NIMONIC 90 referred to Figure 4
(Date lo;v,r thzn th2.t of ourrcnt production)
:: /I I’ No. of Deviations of Spacing !l :i Data fMm tests in Standard' distributions between Is jj Reference component deviation Sr
ATd component I!
1: distributions distributions j'
j! 7 h 24 18 5.8 21.1
I I
/I 25 17 5.6 il.3 .
!j
i, II // 30
ji Ii !/ 32
;j 33 iI
jl fj ’
;/ 34
J ‘I I: :! !/ 35 j!
33 8 4.2 33.7
11 3 3.5 20.9
5 - 10 4.9 -4.3
11
41
3: 9
3.0 3.0
2.1 Loo.4
5 23.8
1.4 3.1
-13 32.2 6 21.3
17 t1.3
-4.6 to.7 12 21.5
0 t1.0 . 20 Y
-22 2.2 -2 5.5
4 A.0
-2.5 a.4
-37 23 -19.5 a.9
0 3.7
15 ?I 11 20.1
5 to.5
j/
19 22.6 !/ /: I/
i. i 1: i:
16.6 t1.s I>
20 2.5 // !I I/
20 ~3 /!
i; i: i!
j:
17.5 t3.3 f 19.5 32.1
11
I :' I
43 6 to.6 ji
" b -.“.“- Meen -- spacing _-. for .
I--_.
Nimonic .,------. :.I ---ITT-; 90, ignoring _ __ Reference _ .‘--~_“-““. 35 ̂-“. I_ ._l(_l-.l
--:-. c.-vL”“--. 18.8 5.0 “. .- _, 1; 1:
TAJ3LE VI
. * Standard deviations and deviations of means in degrees C . . .for creep of individual casts of Nimmic SO,
referred ts appropriate common families
is referred to Figure 16 :/ Data- -3 t, referred to Figure 17 ts referred to Figure (8
I / from ,: Ref. N* S$ ATd
Diff. cf , AT& Nl Sl md
Diff. of N ATd e
s Diff. of 3 ATd A% - . __ . . . . . _ . . _ _ _. , _ _ _ __ _ _ ..-;7.- - ..__ =:-.- .___ .: ;T-T*--z---. -----;..;=-.;...---4_=;LL__7. _ _^__ -----; .-z-.- :-'-:(-z--z- -- T'
.
'; 1;: 1;:; ii.7 ; :/ 12 6.5 tl.5 21 9 23 -61 +6 /' -31 t3.4 3o 27
:I 10 . -34.2 21.2
*/ 13 12 3.9 i0.8 -16.4 11.1 ,8 5,6 .
- 2 4*5
+2*8<21
?3 25 I5 + -3 -24 t3
/a ^ 3
. - ’ / -53 5
I-63 '5 14 3.5 21.3 +2 26 22.7 11'5'4.7.-,) 40 213
I/ .4 -27 +I.8 1 ~,2
': - < 8’ -15 23
;/ 15 4.4 21.0 24m5 4.7 t1.7 21.8 20 20 t3.5 22.5 j9 9.8 92.2 -4 22.2 ,-
>! 4 37 22.2 13 22.8 ,:II'2z _' .-._ . __2_-_ .- I---.j-- .-:.: .:;. .^.._ --j- _ ._ __ --.-.&..-z. -;:. :;-: _ ;;: z -..-:>I _- :z-. .: ,;Averages 4.5 20.5 _ _ 20 ?I,.0 : 11.3 21.5 33 +5
10’ . 4 2.5 20.7 :;; ;y*", 12 z1.4 .
12 -23 kl.2 II 4.1 20.9 -7 +1.2 16 21.7
5 -30 21.4 3 3.1 21.1 -20 kl.8 IO 22.3
13 3.2 to.7.;:: :A:; I4 +2ao 11 5.8 8 22.0
N+ 3, Ne indicate number of results in each t+, tl, t, distribution respectively
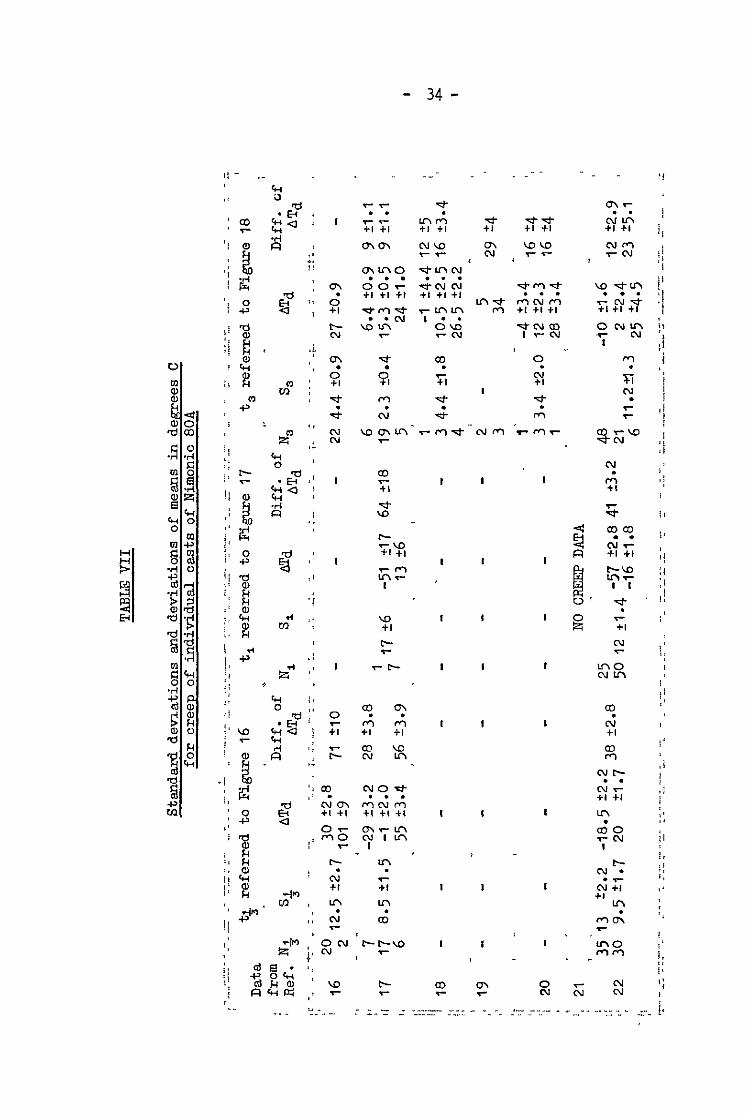
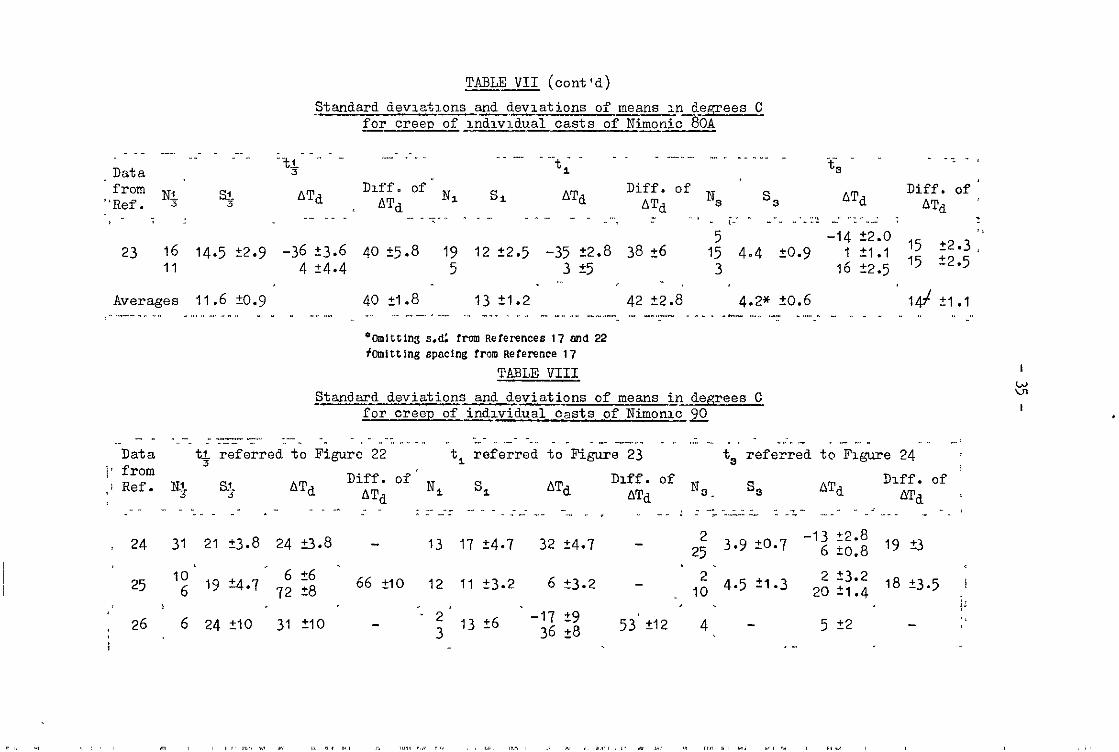
TABLE VII (cont'd) -- J%andard devlatlons and deviations of means In degrees C
for creep ofpdlvldual casts ofNimonic%bA
:“+‘ -_ - .__- _-_. _.” ^^. _ . . .^_“_. ._ _ ___“_ ”
t 1 __ _ _
ts - -z-e
/Data from & Dlff. of.
"Ref. 3 s?j A%
. ATd Nl S1 ATa
Diff. of N s ATd
Diff. of' A% s 3 ATd
23 16 14.5 22.9 -36 $3.6 40 25.8 19 12 k2.5 -35 22.8 38 +6 1: 4e4 20.9
%>
-'; ;;'~ 15 ~2.3,
11 4 t4.4 5 3 ?5 3 16 t2:5 15 22.5
. I -. I
Averages 11.6 kO.9 40 Cl.8 13 t1.2 42 k2.8 4.2* 20.6 Id ?I .l . . . . . ^_ . . . . . . . . .- . . -- ,._. . . _.. . . . . . _. . . .._. "_ - - .-_^" . . . . .c- . . . .- .-. " . . . - . . . .
'Ocmltcing 6.d: from References 17 and 22 tomitc1ng spacmg iron Reference 1,
TABLE VIII
Standard deviations and deviations of means in_degrees C for creep of individual casts of Nimonlc s
-- - -_-. ..----.. ..- _- :: . . . . t+ referred-tb J&we 22
^ .
'-Data . . ..- _ _. __.___ . _ 2 _ _ .
‘t, G&d toTFigure 23 .--. - ._ . . _
i' from t, referred tn Figure 24.' w-9
,: Ref. N+ S$ ATd Diff. of' N s
ATd Dlff. of N
SS ATd Dlff. of
ATd f I A% 0. Al'& *
a 24 31 21 C3.8 24 k3.8 - 13 17 24.7 32 t4.7 - 2; 3.9 20.7 -'Z $1; 19 t3
. * 25 '; 19 24.7 6 +'
72 28 66 Tao 12 11 23.2 6 $3.2 - -I 2‘ 4.5 3.3 2i i:$ 48 10 '3.5 ,‘ .
-17 t9
ii
- - :* ~ 26 6 24 ZlO 31 210 .: 1326 36 +8 53,512 4 5 - +2
.-
- 36 -
. . .
‘;:
G
cum . . Ti Ti ‘;
I
I
,!
/ m ! +I
‘_ “,
- 37 -
L
c :! ‘/
ThBLE XI
Comwrlsons of s.d. and devlatlons of mean before and after resolution into components --
Nimonx 3
24 21 21. 24 24
25 19 30'6, 72 . 31
26 24 24' 31 3' . 21 . 21 30. -10, 71 -6
28 15 15. 61 : 61
. 29 16 : 44.-78, 21 -1
30 9 27. -56, 12 13 a5 .
17 . 17 ; 32 32
11 : 11 f 6 6
. . 13 30 i -17s 36 15
13 13 -10 -10
9.5 . 9.5 ; -6 : -6
11 ; II j-29, 3 : -29 6: 6:
-15 .-I5
3.9 7 -13s 6
4.5 7.5 1 2, 20
- -
6.8 6.8'
5
-II
2.5'5.4 -11, -I~ : 12
4*3 IO' -11, 8
3.2 5.6 -359 -7
5 5.8
17 5.6
5 -
-11 4.2
-1 3.5
-7 -
-12 4.9
12 . -13, 6 ' I
5.6 17 ; 17 '
7.2:~5, 12 ; -1 ’ ’
9 0,20 : 3
-. - i -
10 ; -22> -2 -9
. ' 31 15 . 4a'-35s 49 28: 4; 4; -10 -10. - - I ; 124
-46,-5.-23.-i- - -3 . . .
. . . -: - <'32 - - - - - : : -:- - 313: 4 4,' . .
. . . : t . 0 iI
i,35 1 . .
- : - .- - - - - -: - - 1.4.2.5‘5, II, II!;
i.._- 15
. .-. _I -- "__ . .-.._-.- _-.. --..- "_ - ._ -.. -zz.-A- _I- ..a ____ .~:-. 1 -.... =. 1- ._-.- . .-.= I .~~ L.._ ‘_ 'L-' I..: I.-‘I-:--..= - - __ ^_ _ __ . ____ _ _ :- _ __ _ ..:::r . .1 I.T:-.~_'~~-~I- -
f sheet daza
: , , , , ~ , “ “ , , . , .T . % . , . , , I . , , , , , , , , , , , 11 , , #

S.ymbol
E
C
o-
t
T
T’
k
Fitted family
- 40 -
APPEIUJIX I
List of symbols
Definition
Natural strain = loge e/e,: e uivalent to englneerlng strain (A - Lo) 7 8, up to about 5 per cent A and lo are current and original lengths of test section of specimen.
Constant in each term of formula, but different from term to term.
Natural stress a L/A, where L is the load and A the current cross- sectional area. Approximately equal to engineering stress L/A, where & is original area, up to 5 per cent strain.
kxponent of stress. Takes predeter- mined values defined by the series
f = 1, 2, 4 . . . 2".
A time temperature parameter, defined as
6 = t(T' - T)-so (T' > T) or
+ = t(T - T')e' (T > T').
Time.
Temperature of testing.
Reference temperature, constant in any one term but different in different terms.
Exponent of $J or of t. Takes values from sequence. . . . 3, 1, 3, . . .
A series of curves calculated from Equation (1) after the constants have been chosen to fit a set of experi- mental data. Commonly curves of log stress versus log time for several different values of temperature.
Units
Non-dimensional - per cent
Complex but gener- ally irrelevant.
t.s.1. or p.s.i.
Non-dimensional.
Seconds or hours.
Seconds or hours.
Oc.
Non-dimensional.
s.vmbol
Common family
AT,
Homogeneous set of data
Multimodal
Component distribution
Sl
- 41 -
AP?EXTIX I (cont'd)
Definition
A family of curves that has been fitted, not to a single set of data, but to a number of different sets of ' data for the same alloy.
Units
Average displacement of data for a single cast from common family.
OC.
Data obtained by testing a group of specimens for which there is no known difference pro.or to testing - e.g., specimens from the same cast taken at random (cf. Section 2.3).
Having several peaks with regions of lesser probability between them.
Set of scatter values which conforms to the Gaussian law, extracted by analysis from a multimodal distribution.
Mean deviation of a component distri- bution from the common family.
Standard deviation for single component distribution of rupture data.
log time or 'C.
Standard deviation for single component distribution of
t ' ( ) q term of Equation (3).
Standard deviation for single component distribution of
term of Equation (3).
Standard deviation for single component distribution of
erm of Equation (3).
which the term ttf of Seconds or hours.
Equation (3) contributes a constant arbitrary strain (typically 0.1 per cent) to the overall strain.

- 42 -
AI'FENDIX I (cont'd)
Definition
t19 t, Corresponding times for terms Seconds or hours.
CO A component of strain whloh does not vary slgnlfxently with time. Commonly used either
Non-dunensional.
S’
(a) for any "plastic" strain on loading loadxng not accounted for by the time dependent terms, or
(b) for correcting any error m the estimated elastic strain on loadmg.
Apparent standard deviation obtalned Log t or T'C. by fitting Gausslan law to multimodal data without prior resolutxon into component distributions,
- 43 -
APPEIVDIX II
Method for resolving a multimodal distribution mto 1ts components
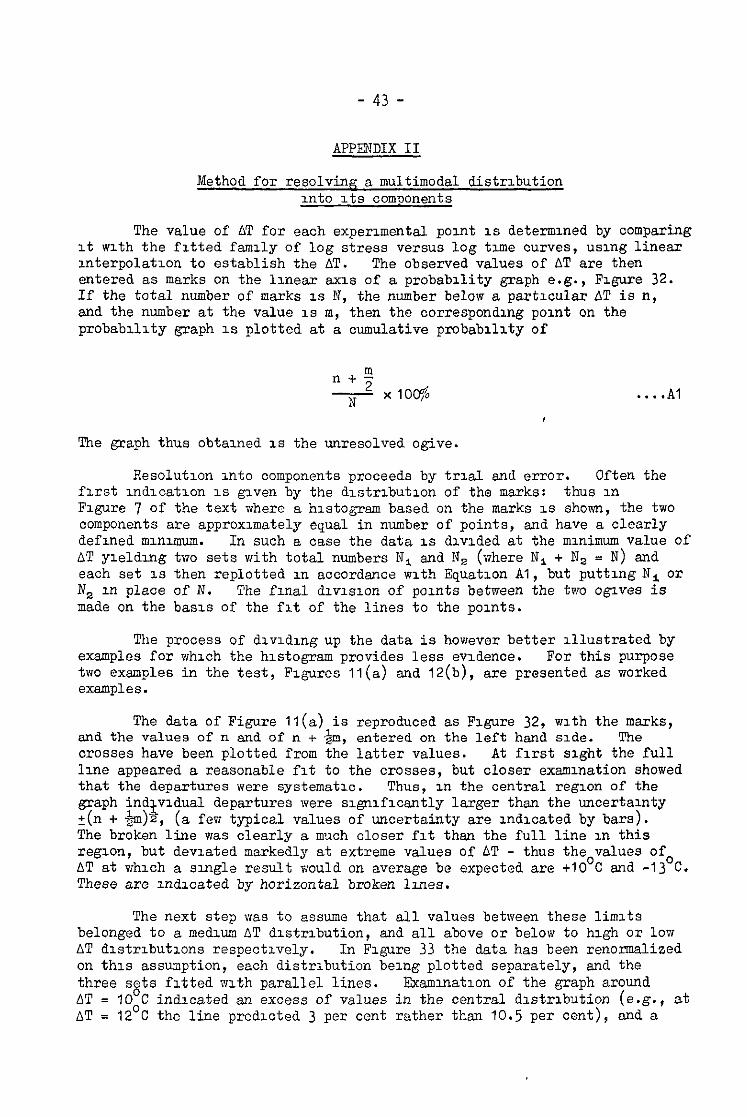
The value of AT for each experimental point is determined by comparing it with the fitted family of log stress versus log time curves, using linear interpolation to establish the AT. The observed values of AT are then entered as marks on the linear exis of a probability graph e.g., Figure 32. If the total number of marks 1s N, the number below a partrcular AT is n, and the number at the value is m, then the corresponding point on the probability graph is plotted at a cumulative probability of
n+m 2 x100$ N
The graph thus obtained is the unresolved ogive.
. . ..A1
Resolution into components proceeds by trial end error. Often the first indication IS given by the distribution of the marks: thus in Figure 7 of the text where a histogram based on the marks is shown, the two components are approximately equal in number of points, end have a clearly defined minimum. In such a case the data 1s divided at the minimum value of AT yielding two sets with total numbers N, and N, (where N, + Ns = N) and each set is then replotted in accordance with Equation Al, but putting N, or N, in place of N. The final division of points between the two ogives is made on the basis of the fit of the lines to the points.
The process of dividing up the data is however better illustrated by examples for which the histogram provides less evidence. For this purpose two examples in the test, Figures II(a) end 12(b), are presented as worked examples.
The data of Figure II(a) is reproduced as Figure 32, with the marks, and the values of n and of n + &m, entered on the left hand side. The crosses have been plotted from the latter values. At first sight the full line appeared a reasonable fit to the crosses, but closer examination showed that the departures were systematic. Thus, in the central region of the graph indtvidual departures were significantly larger then the uncertainty ?(n + $m)%, (a few typical values of uncertainty are indicated by bars). The broken line was clearly a mlach closer fit than the full line in this region, but deviated markedly at extreme values of AT - thus the values of AT at which a single result would on average be expected are +lO'C and -13'C. These are indicated by horizontal broken lanes.
The next step was to assume that all values between these limits belonged to a medium AT distribution, and all above or below to high or low AT distributions respectively. In Figure 33 the data has been renormalized on this assumption, each distribution being plotted separately, and the three sets fitted 711th parallel lines. Examination of the graph around AT = IO'C indicated an excess of values in the central distribution (e.g., at AT = 12'C the line predicted 3 per cent rather then 10.5 per cent), and a
-- 44 - .
deficit in the low AT distribution: a similar effect was found around +S'C. A further approximation was therefore made in which the dividing lines between distributrons were brought closer together, and thus by successive approximation the graph of figure II(a) was obtained.
The other example, that of Figure 12(b) replotted as Figure 34, is interesting because of the unusually large number of distributions involved. The unresolved ogzve does not at first sight deviate far from a straight line, but the distrrbution of marks 1s unusual in that there is en absence Of values around A log t = 0.15 just where they would be expected to be most numerous. The corresponding histogram, if plotted, would show a minimum where a maximum would be expected. The data was therefore divided Into two distributrons, but divlsron of the data at this value of log t provides (figure 35) distributions which are clearly not of Gaussian form. Each was therefore further analysed with the results shown in Figure 12(b) and Figure 36.
The degree of division of a drstribution that can be considered mesn- ingful depends not only on the magnrtude of the deviatrons of the pornts from the straaght lines, but also on the statistical uncertainty of each point. Thus in figure 36 it can be seen that the residual discrepancies are not significant, whereas the dlsorepsncies in Figure 34 although apparently no greater are [email protected]. These considerations were used to determine the degree of resolution appropriate to each set of'data - their general correctness can best be assessed by the correlations to whrch they lead.
Determination of standard deviations
The quantity S' (Sectron 5.1) was determined from the line through the unresolved distribution, as the difference in the AT for 50 per cent end for 17 per cent cumulative frequency. Thus in figure 32 S' = -1.5 - (-9.5) = SO'S, and in Figure 34 S' = -0.19 - (-0.41) = 0.22 in log time. The S were Similarly obtained from one of the parallel lines through the resolved distribution. Thus m Egure 36 the S was -0.032 - (-0.100) = 0.068 in log' time.

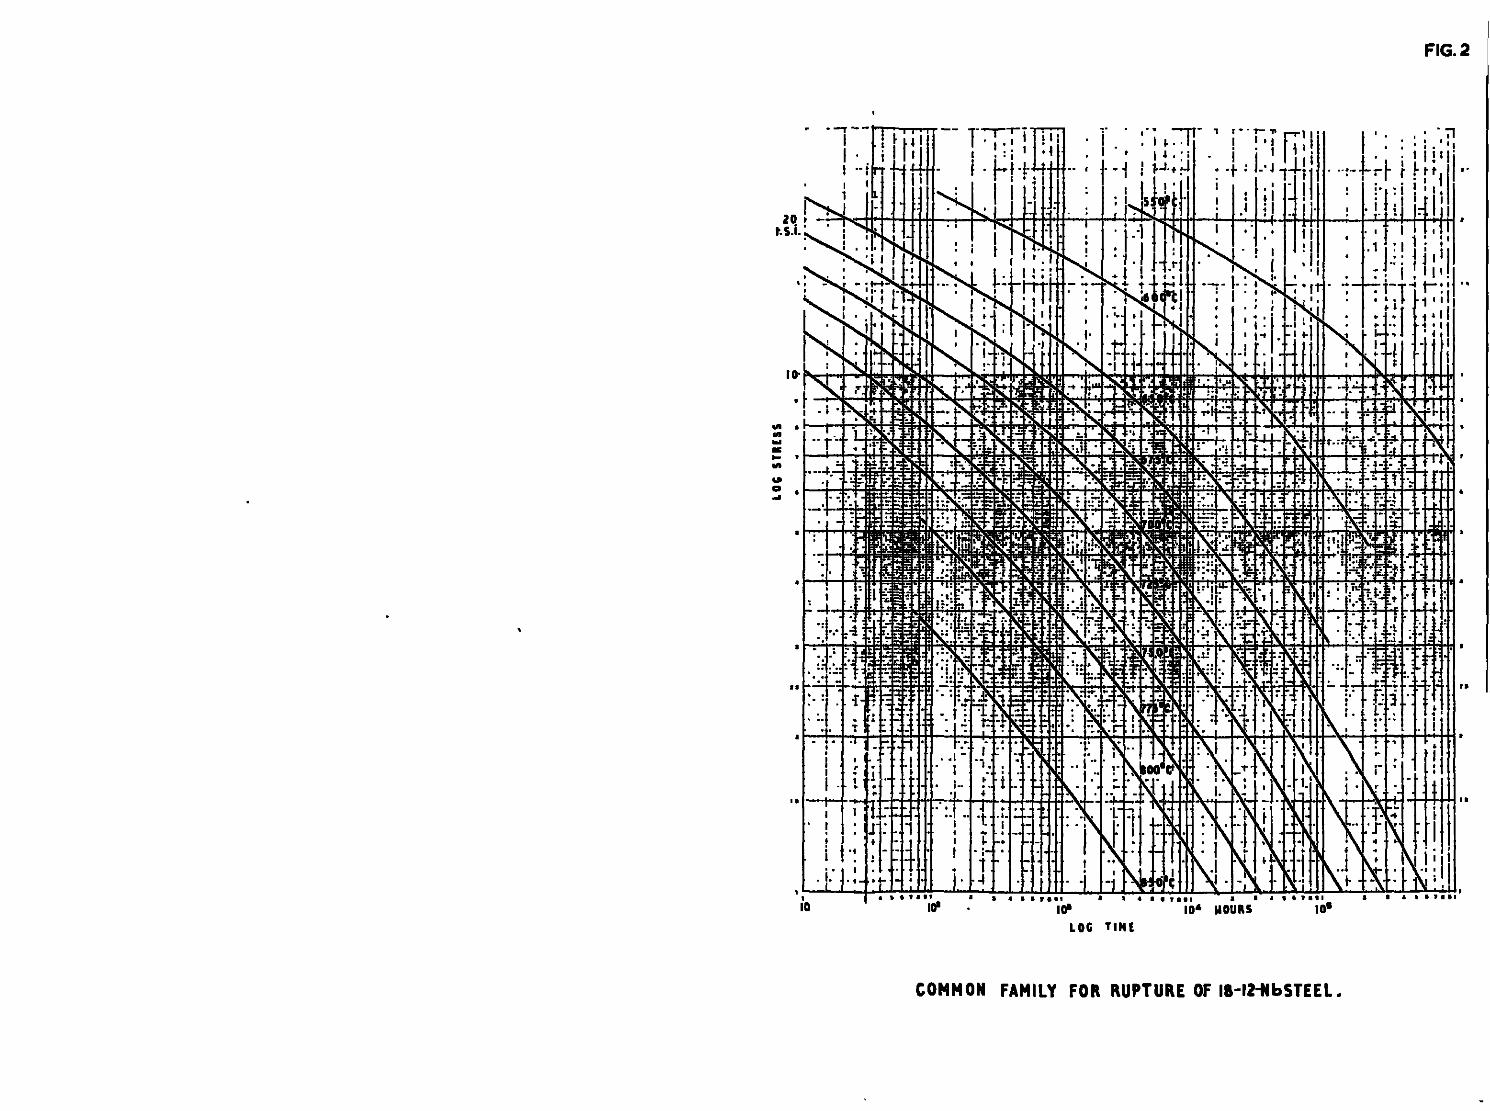
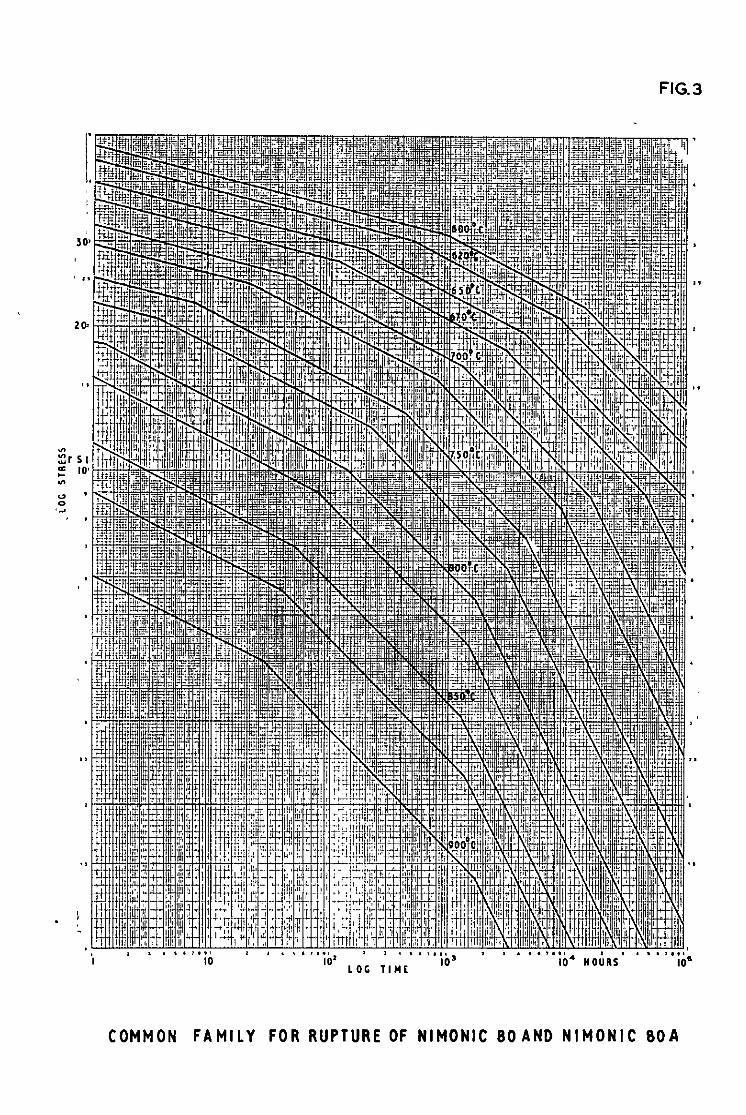
FIG.3
COMMON FAMILY FOR RUPTURE OF NIMONIC 80AND NIMONIC BOA
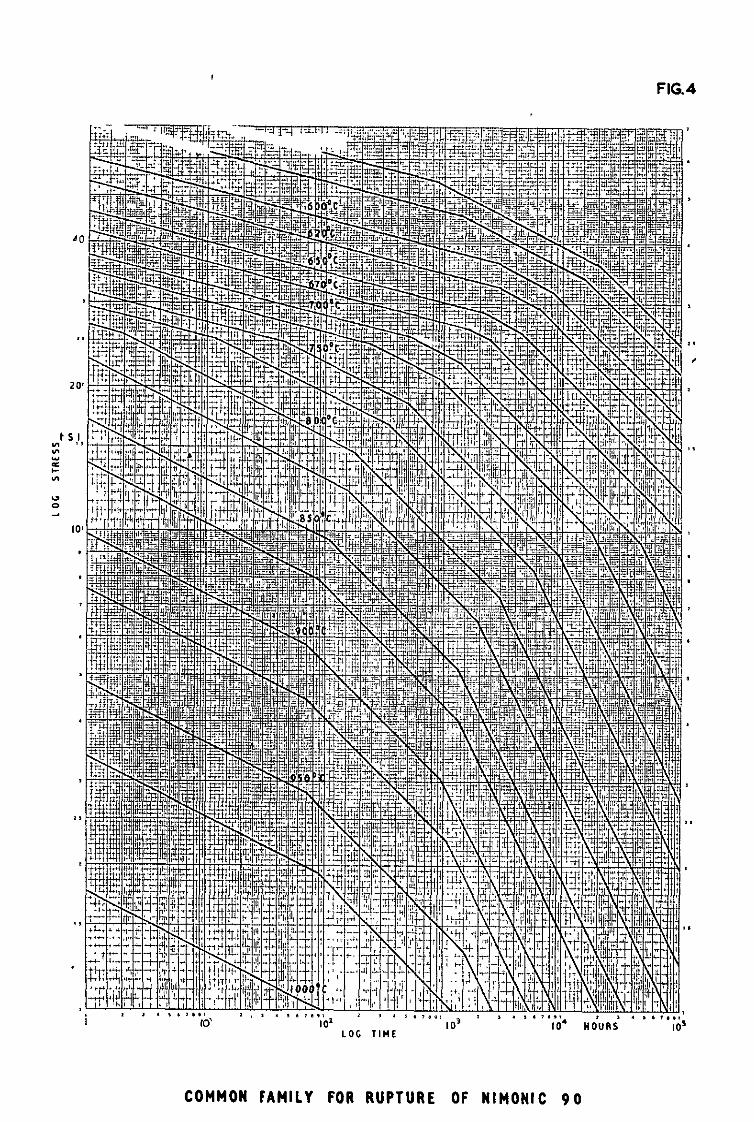
COMMON FAMILY FOR RUPTURE OF NIMONIC 90
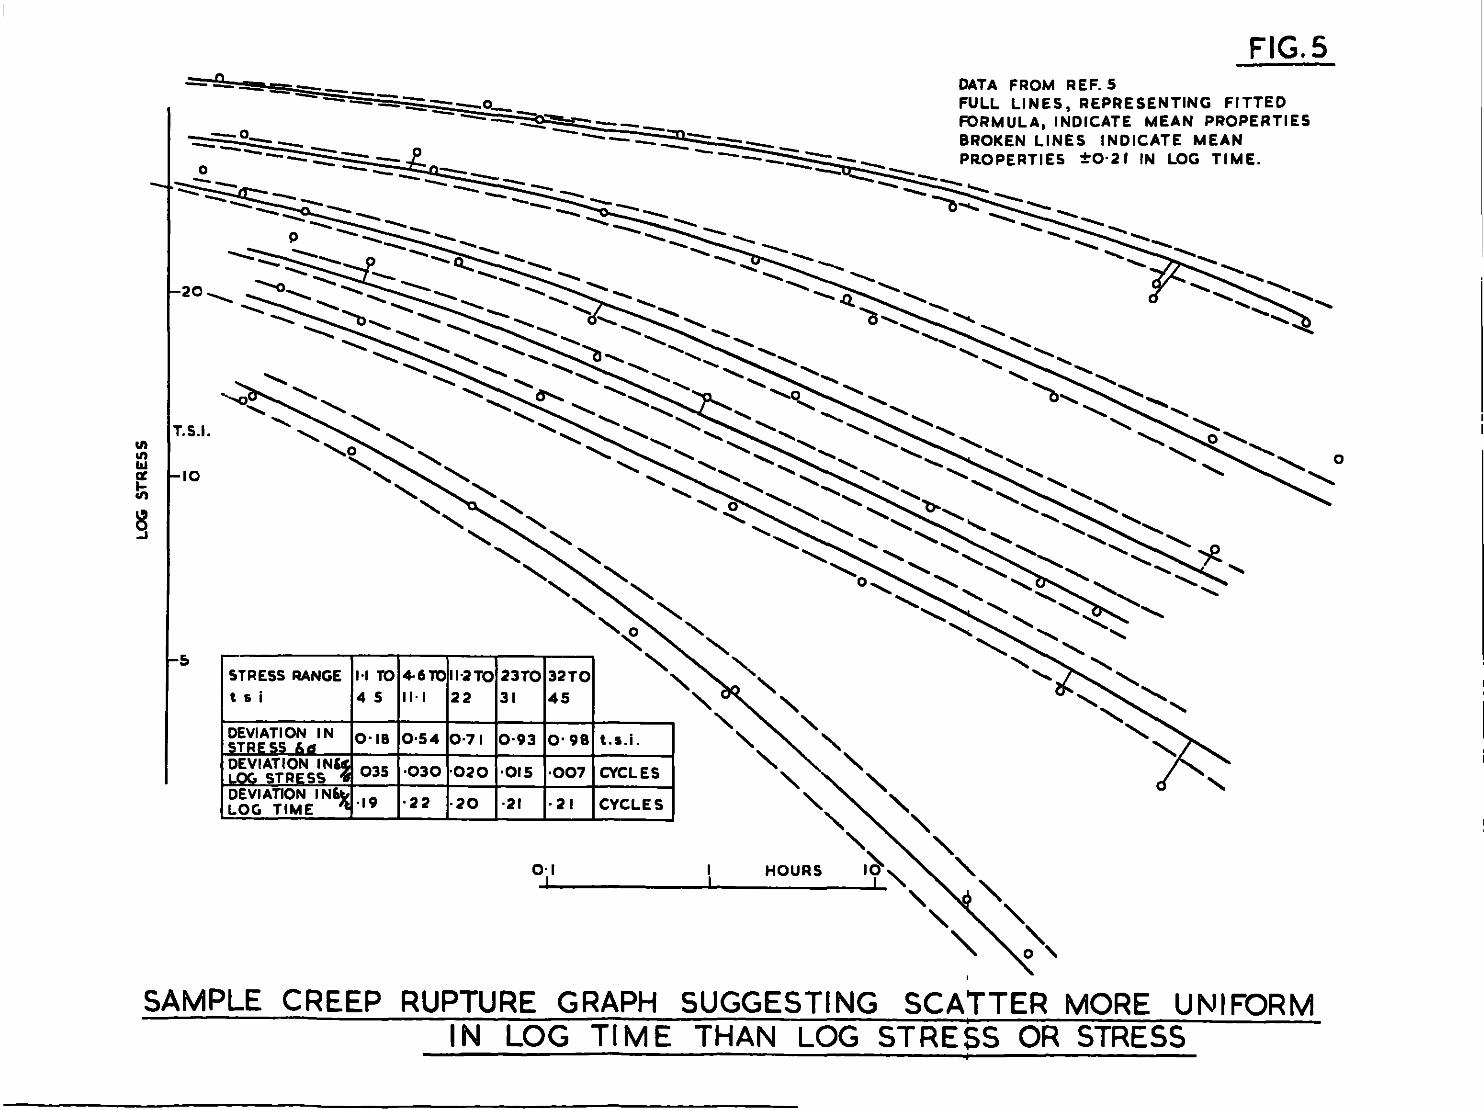
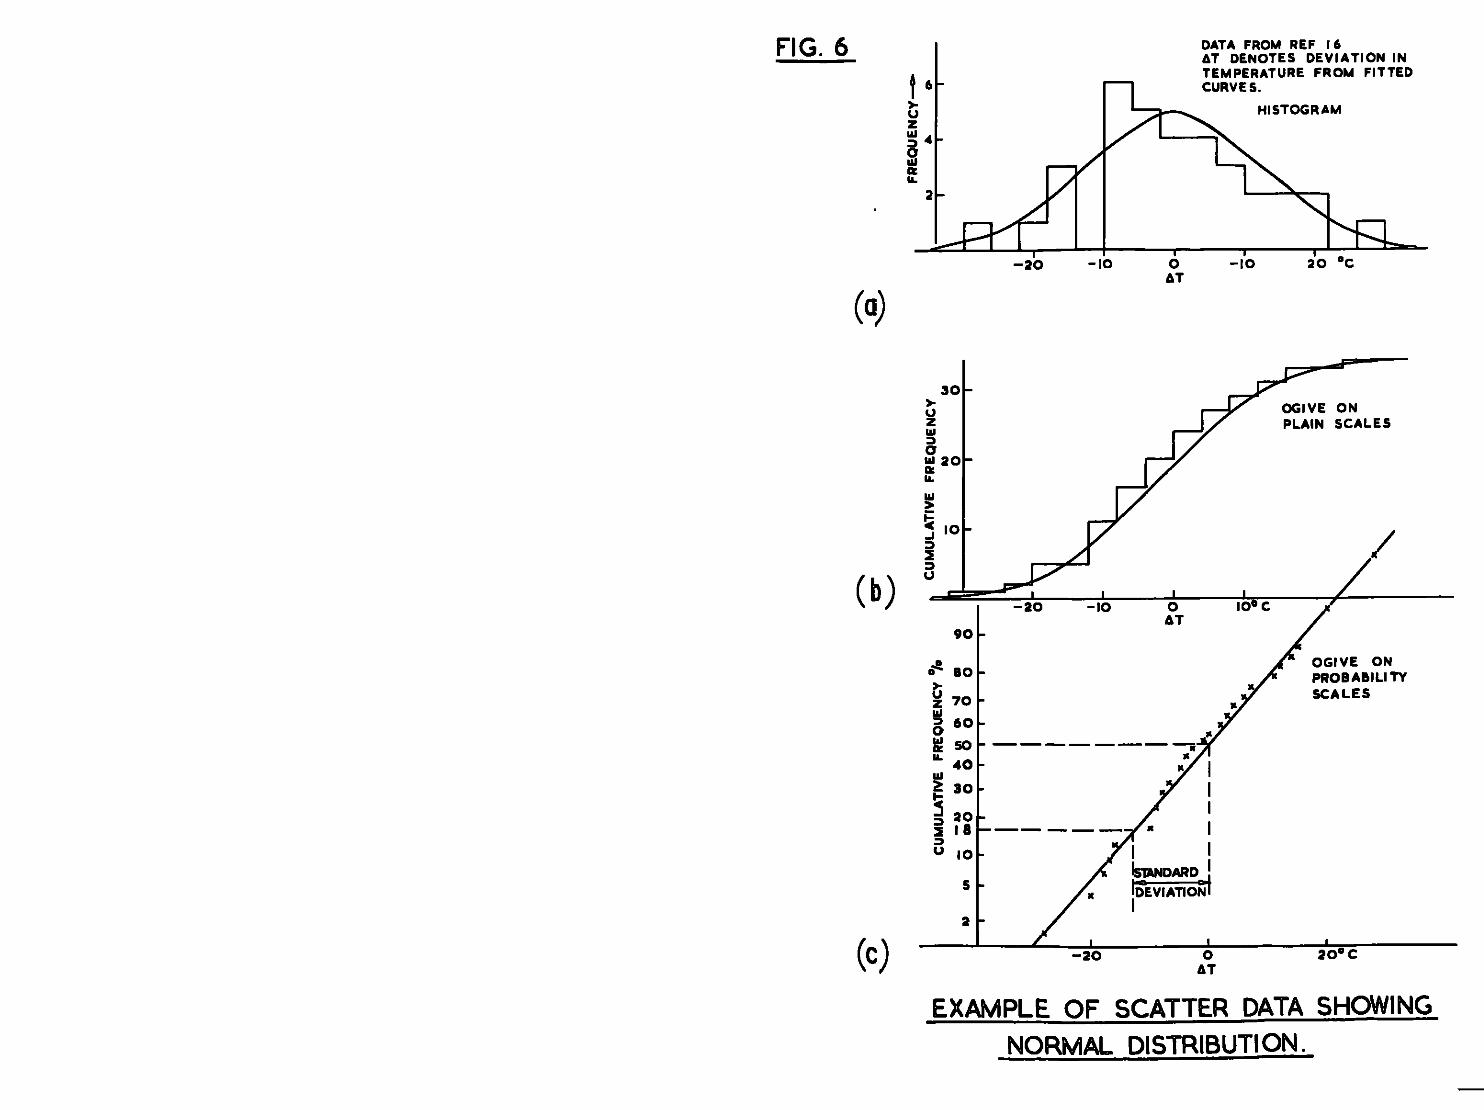
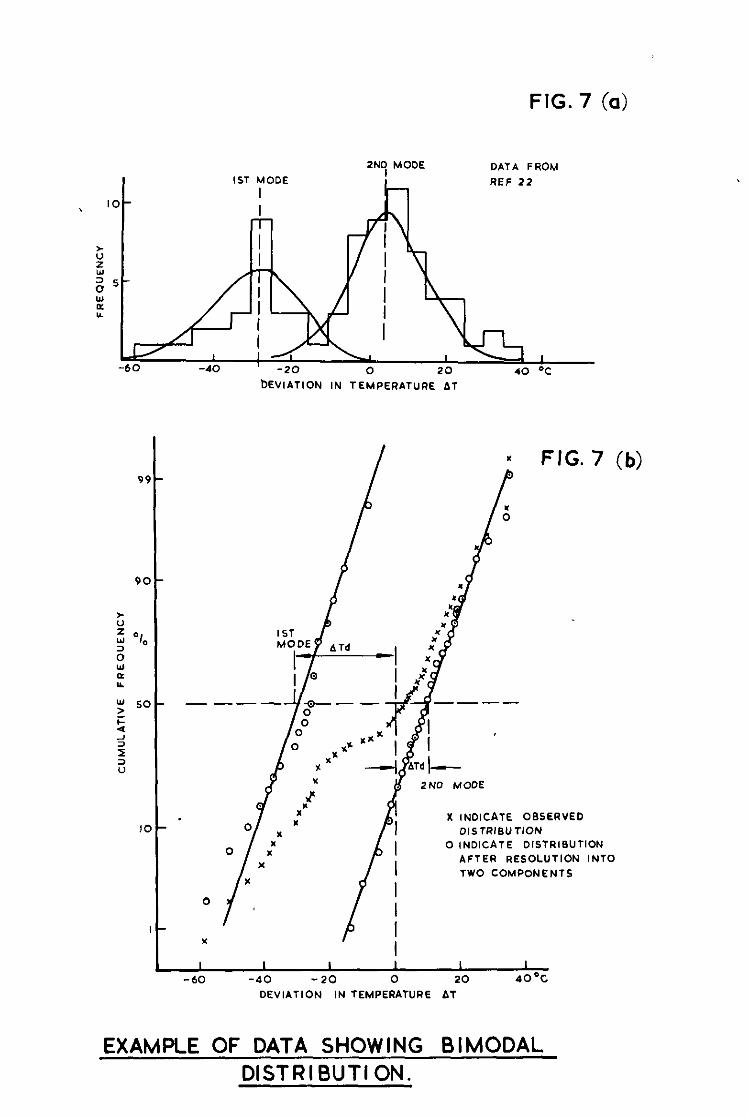
FIG. 7 (a>
‘“9 MODE DATA FROM
I 1s.T MODE I REF 22
bEVlAtlON IN TEMPERATURE AT
I FIG. 7
X INDICATE OBSERVED D,STR,B”T,ON
0 INDICATE DlStRlBUTlON
AFTER RESOLUTION INTO
TWO COMPONENTS
I I I I I I
-60 -40 -20 0 20 400-z
DEVIATION IN TEMPERATURE bt
EXAMPLE OF DATA SHOWING BIMODAL DISTRI BUTI ON.
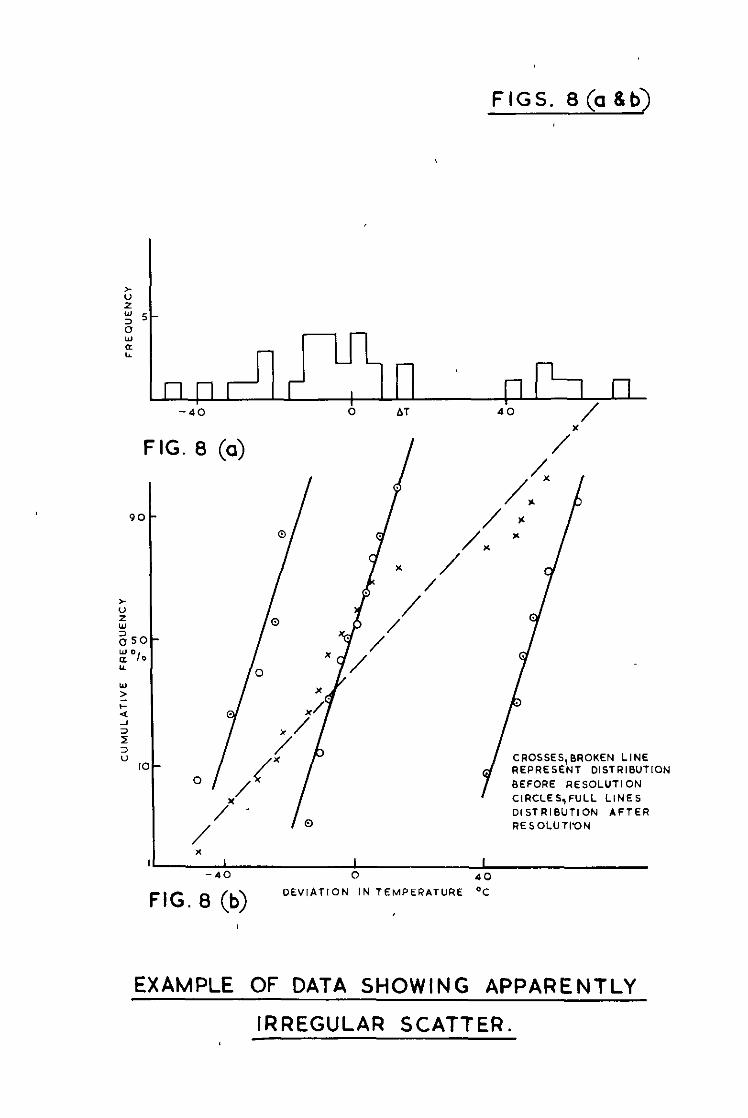
FIGS. 8 (a Sb)
6
$5 2 w
E
I -- nmn J--L rn IIl!lI I I I I I I I I I I I I
u -40 0 61 40
./
FIG / /
I
I CIRCCES,F”LL LINES DISTRIBUTION AFTER
0 RESOLUTION
I I I -40 0 40
FIG. 8 (b) DEVIATION IN TEMPERATURE “C
EXAMPLE OF DATA SHOWING APPARENTLY
ION
IRREGULAR SCATTER.
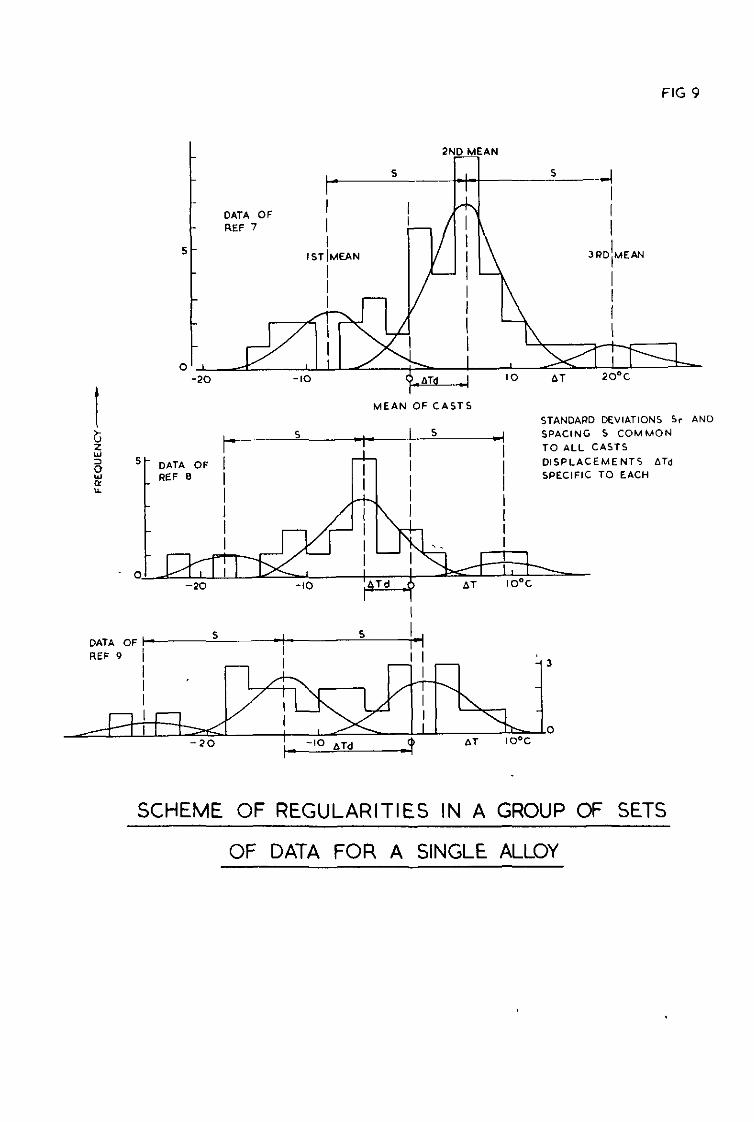
FIG 9
2ND MEAN
vA+-.-LJ
DATA OF
:, 5 a
5L DATA OF FfEF 0
MEAN OF CASTS STANDARD DEVIATIONS Sr AND
5 s SPACING S COMMON I
h
TO ALL CASTS
DISPLACEMENTS AT., SPECIFIC TO EACH
DATA OF 1 S S
I i~EF 9 / i i 1
SCHEME OF REGULARITIES IN A GROUP OF SETS
OF DATA FOR A SINGLE ALLOY
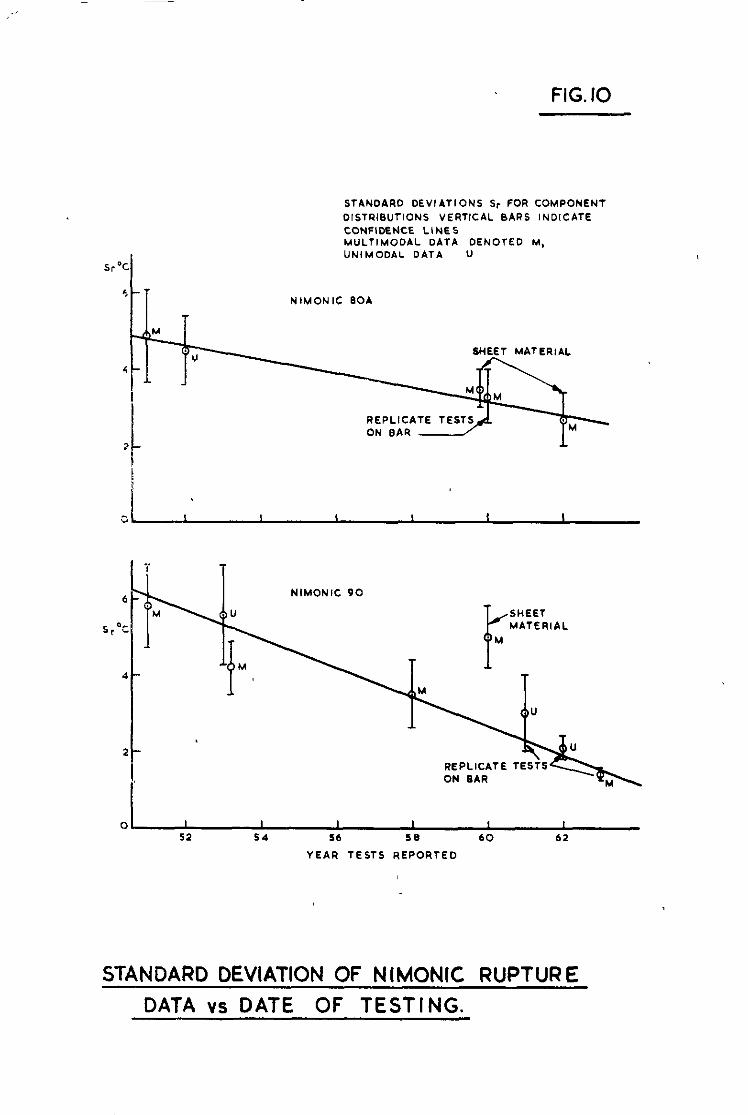
FIG. IO
SYQC
5 c 1
STANDARD DEVIATIONS sr FOR COMPONENT
DISTRI0”TIONS VERTICAL BARS INDlCATE CONFIDENCE LlNES hl”LT,,.,ODAL DATA DENOTED M, “NIMODAL DATA U
NIMONIC 001
STANDARD DEVIATION OF N tMONlC RUPTURE
DATA vs DATE OF TESTING.
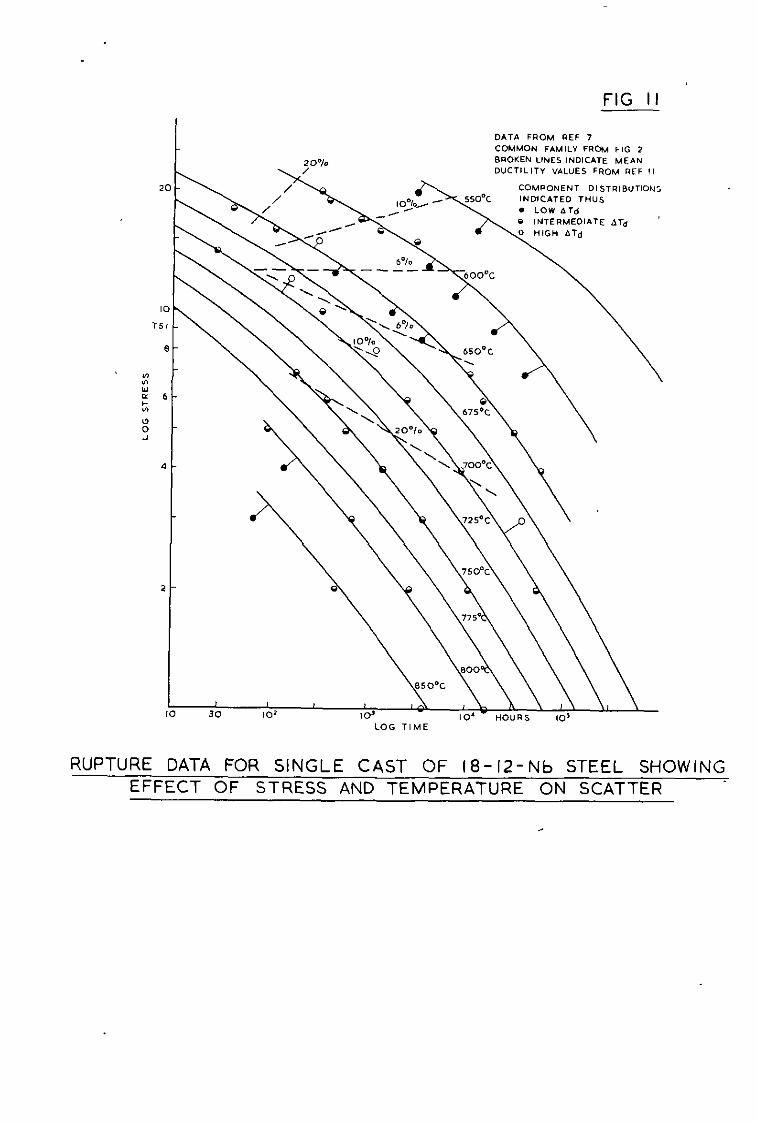
RUPTURE DATA FOR SINGLE CAST OF 18-12-Nb STEEL SHOWING EFFECT OF STRESS AND TEMPERATURE ON SCATTER
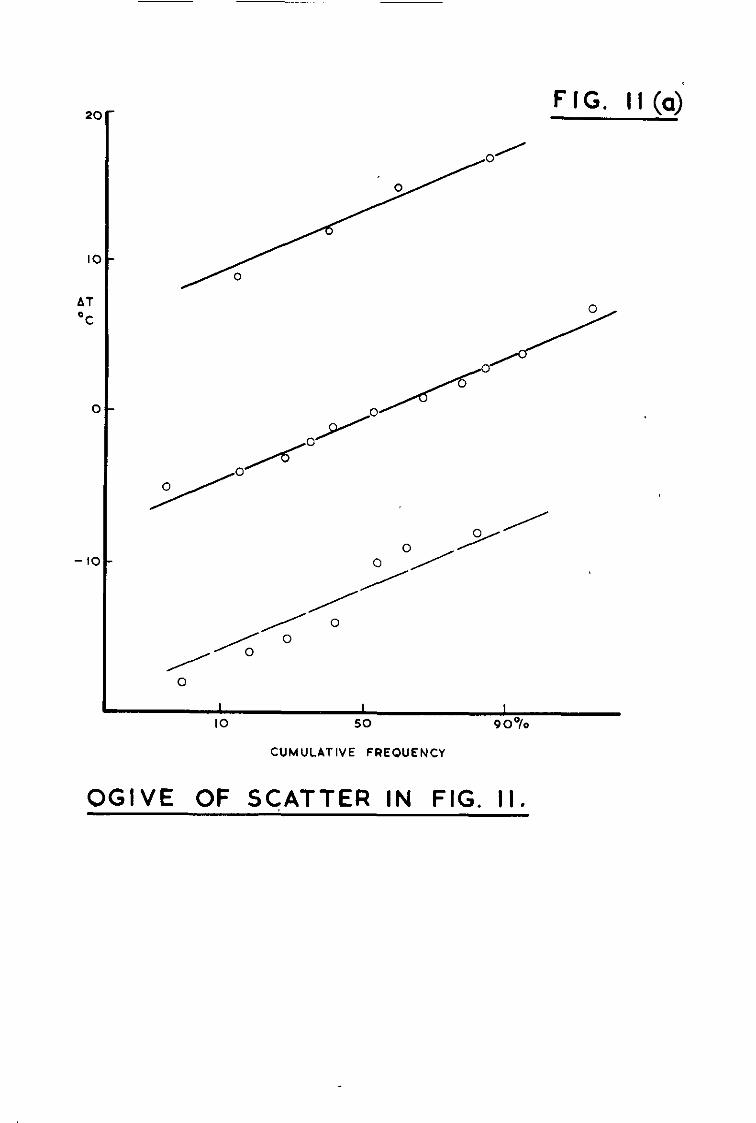
2
I
Al
OC
- I’
FIG. II (aj
1 I I IO 50 V 0%
CUMULATIVE FREOUENCY
OGIVE OF SCATTER IN FIG. II.
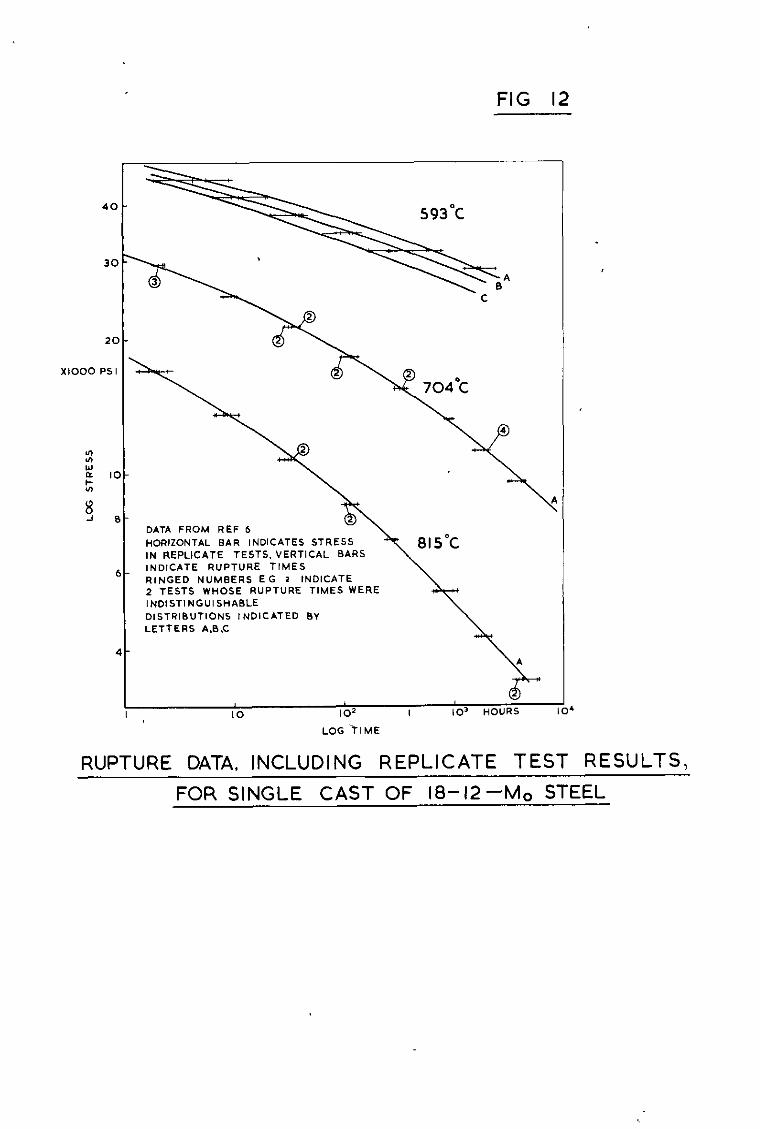
FIG 12
RUPTURE DATA, INCLUDING REPLICATE TEST RESULTS,
FOR SINGLE CAST OF 18-12 -M. STEEL
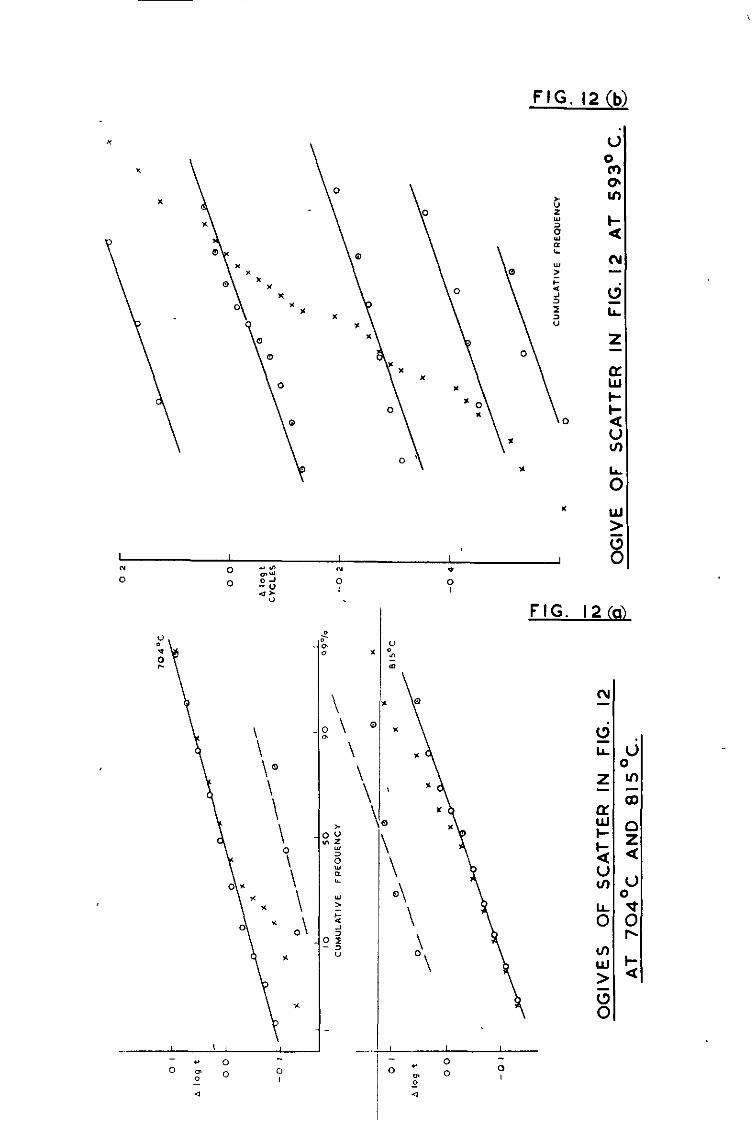
FIG. 12 (b>
L
\Q
\
-
FIG. 12(a)

FIG 13
RUPTURE DATA FOR SINGLE CAST OF 18-12-Nb STEEL (REF. 8)
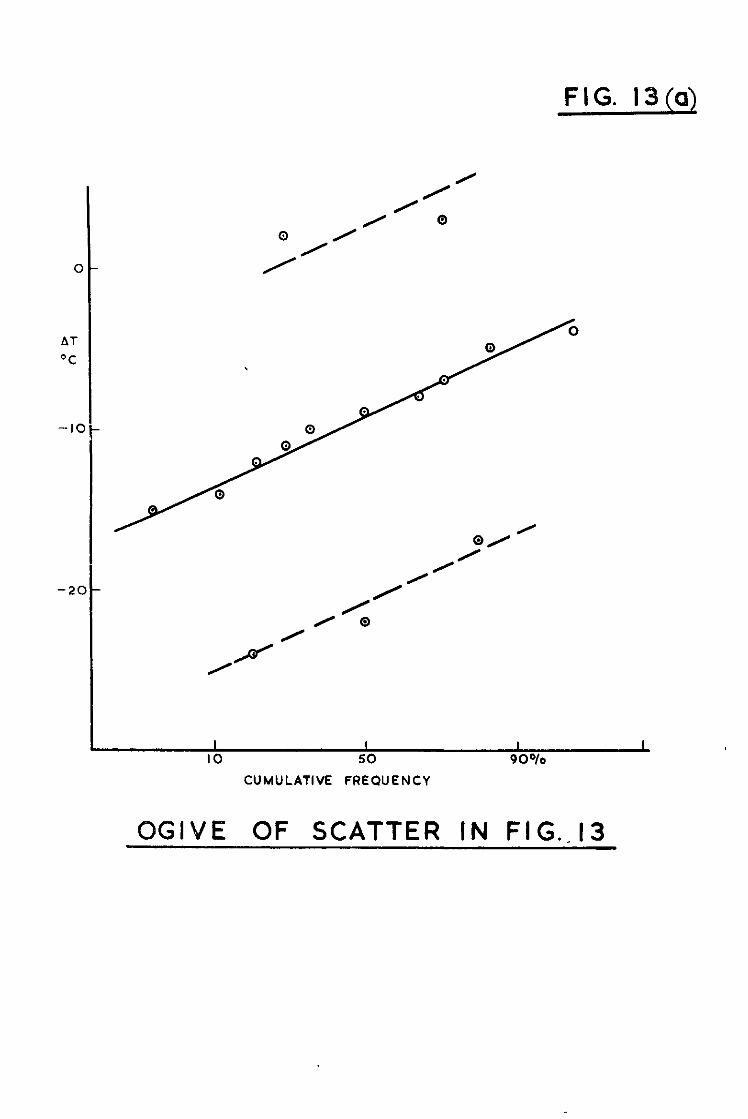
CUMULATIVE FREQUENCY
OGIVE OF SCATTER IN FlGJ3

.
FIG 14
RUPTURE DATA FOR SINGLE CAST OF 18-12-Nb STEEL IN FORM OF SUPER HEATER TUBE
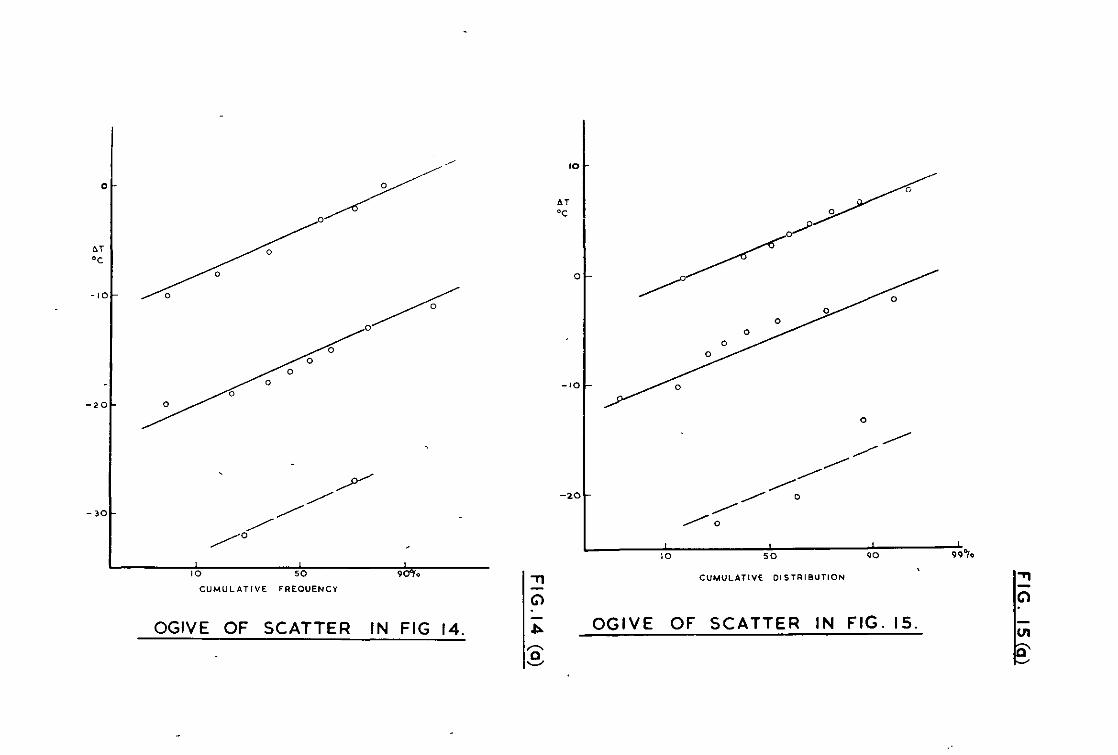
-2
-3
OGIVE OF SCATTER IN FIG 14.
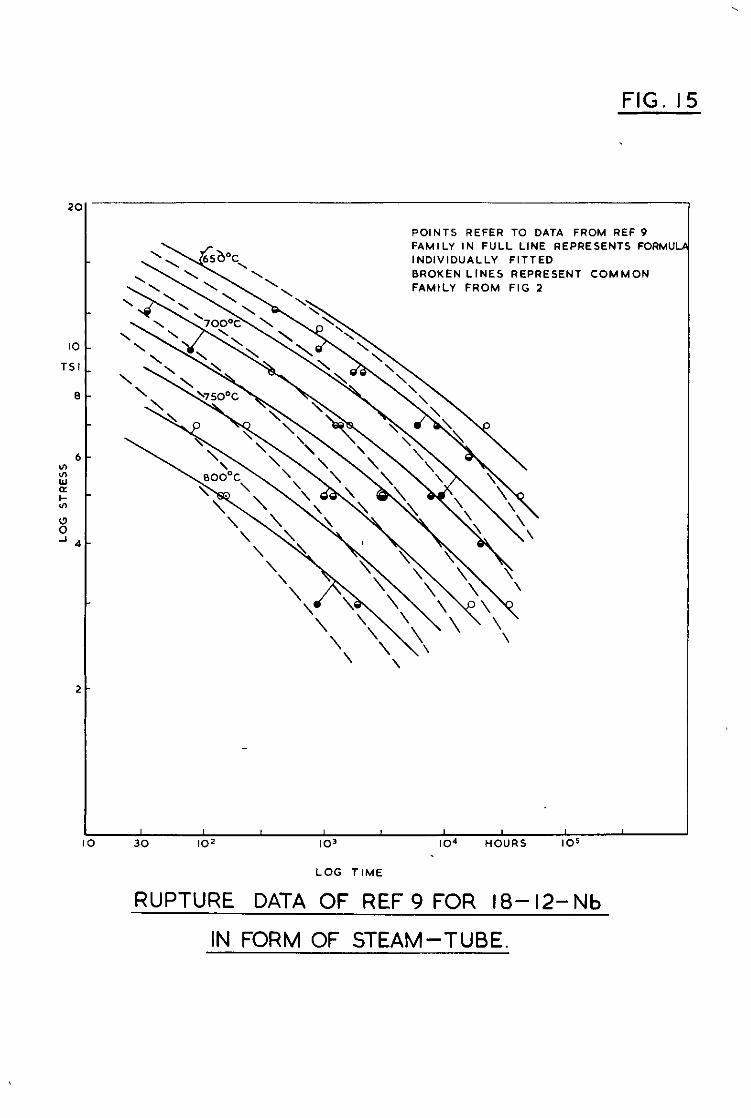
.
FIG. 15
POINTS REFER TO DATA FROM REF 9
FAMILY IN FULL LINE REPRESENTS FOR,.,“,. INDIVIDUALLY FITTED
BROKEN LINES REPRESENT COMMON
FAMILY FROM FIG 2
’ ‘1 \ \ ‘\ \ \ ‘7oyc \ \
\ \ \ ‘\ \ \ \ ‘\ ’ ’ ‘\
\ ‘1 \
\ \ ‘750% \ ‘1,
\\
\ \ \ ’
\ ’
\\
‘, ‘1 ‘\ \ \
\ \ \ \ ’
BOOY \ \ ‘\ \ \ ‘1 \
\ \’ ‘1. \ ‘\ ‘, ‘, \ ‘,
Y:. \\ \\ \ .\ \ \\ \ \ \ \\ ) ‘1 y\ \ ’ \ \ ‘\ ‘\ w \ ’ \ \ ‘\ \ 1, ‘, 1 \ \ \ \” \ ‘\\ ’ \ I 1
30 IO’ IO’ 104 HOURS 105
LOG TIME
RUPTURE DATA OF REF 9 FOR 18-12-Nb
IN FORM OF STEAM-TUBE.
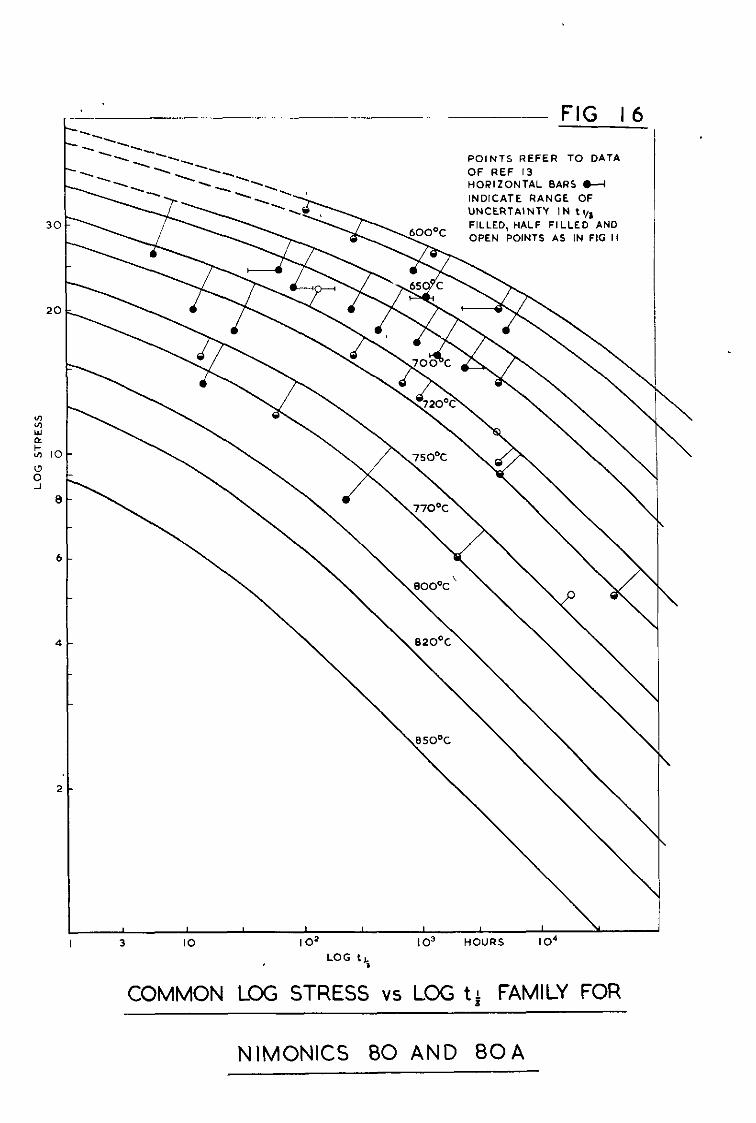
- , FIG 16
POINTS REFER TO DATA OF REF 13 HORIZONTAL BARS H
INDICATE RANGE OF UNCERTAlNTY IN t y,
FILLED, HALF FILLED AND OPEN POINTS AS IN FIG II
.
I-
.
3-
I
3 IO IO’ 109 HOVRS IO’
LOG ,L 1
COMMON LOG STRESS vs LOG ti FAMILY FOR
NIMONICS 80 AND 80A
\
\
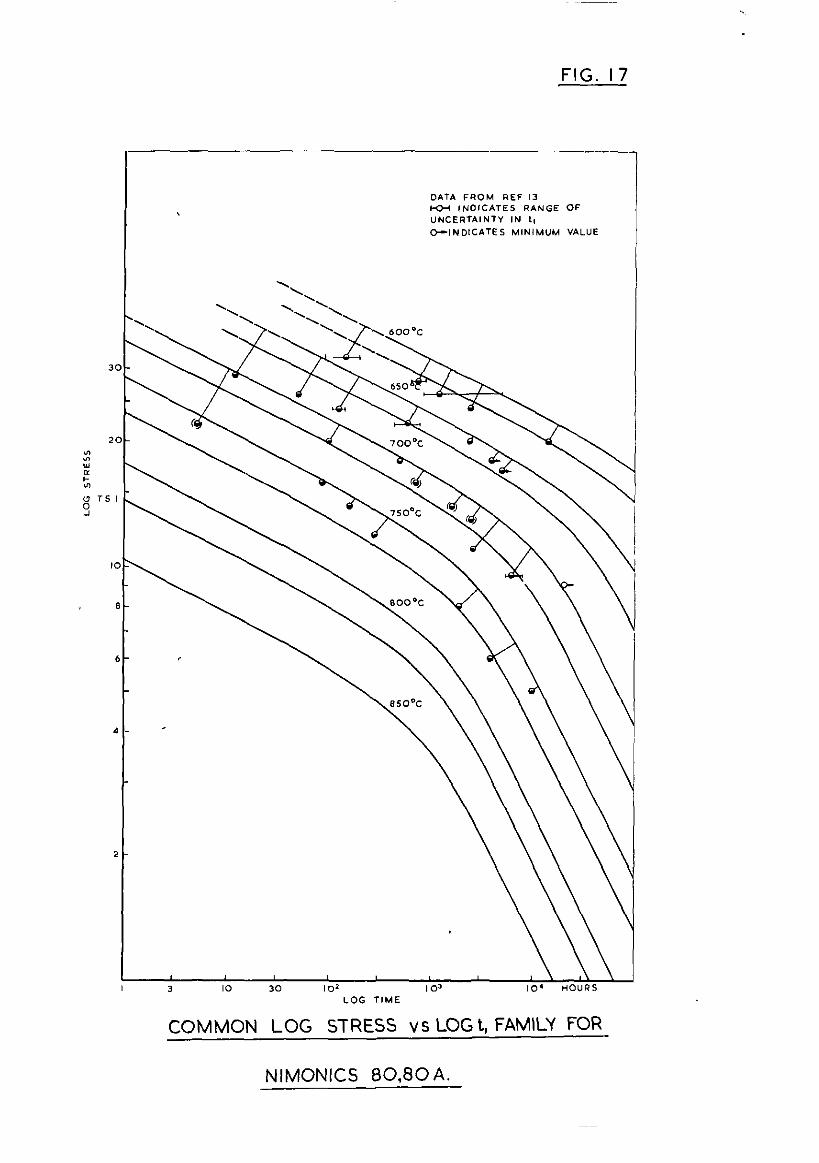
FIG. 17
I \ \ \ \\ \\
.\ \\ I 3 ICI 30 1-2 \ \ / IVY ,a, IO’ “OURS LOG TIME
COMMON LOG STRESS vs LOG t, FAMILY FOR
NIMONICS 80,8OA.
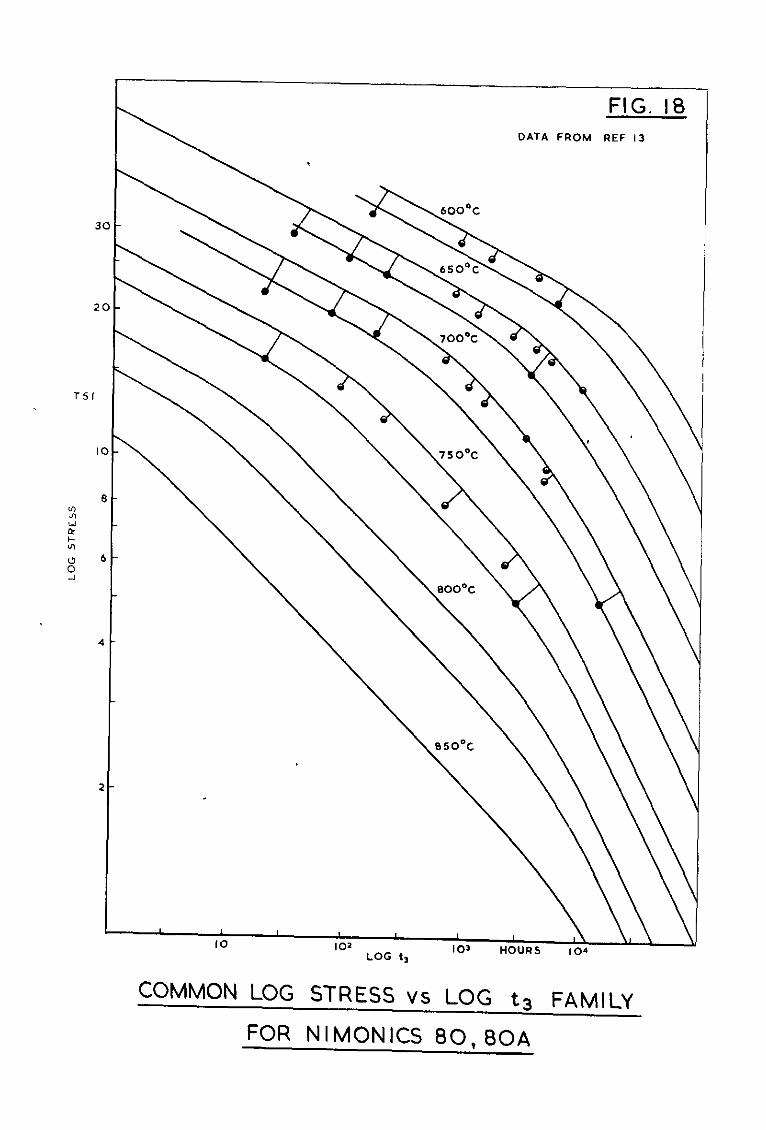
FIG. 18 DATA FROM REF 13
COMMON LOG STRESS vs LOG t3 FAMILY
FOR NIMONICS 80,80A
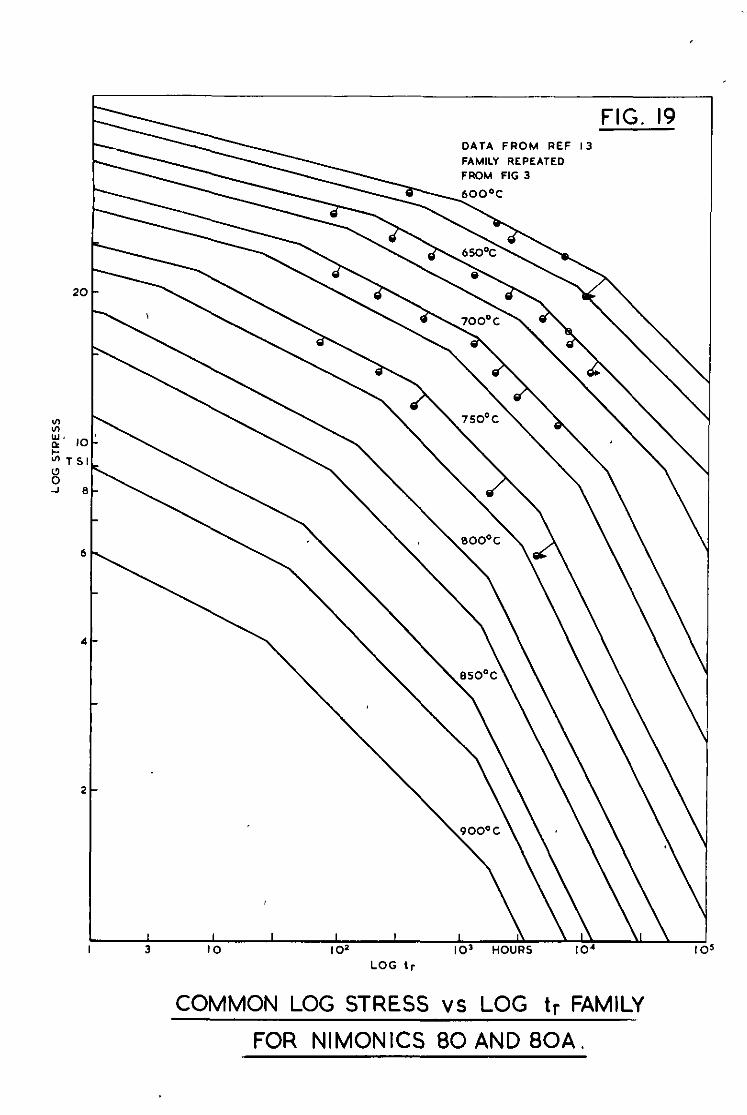
FIG. 19 DATA FROM REF 13
FAMILY REPEATED
FROM FIG 3
LOG lr
COMMON LOG STRESS VS LOG tr FAMILY
FOR NIMONICS 80 AND 80A.
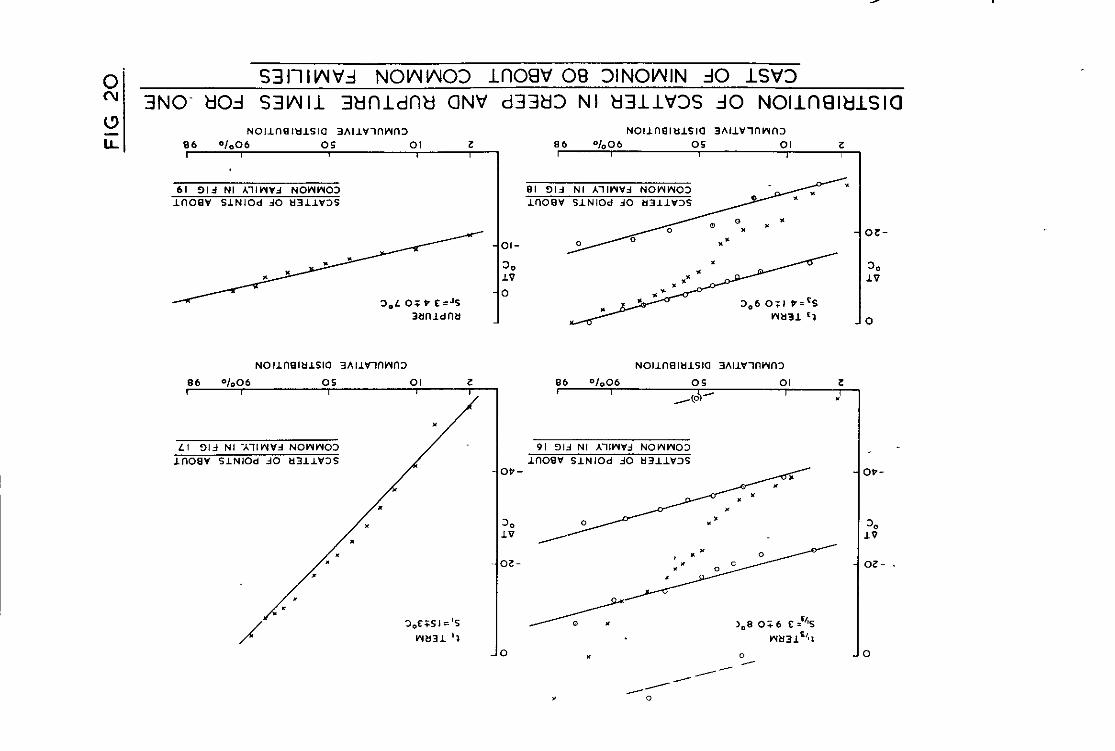
z’ I S3llIWVzl NOWWO3 li-IO9V 08 3lNOWIN JO ISif’3
3NO- tfOj S3WIl 3klf7ldrltl CINV d33t13 NI kl311KX JO NOllfI~l~lSl~
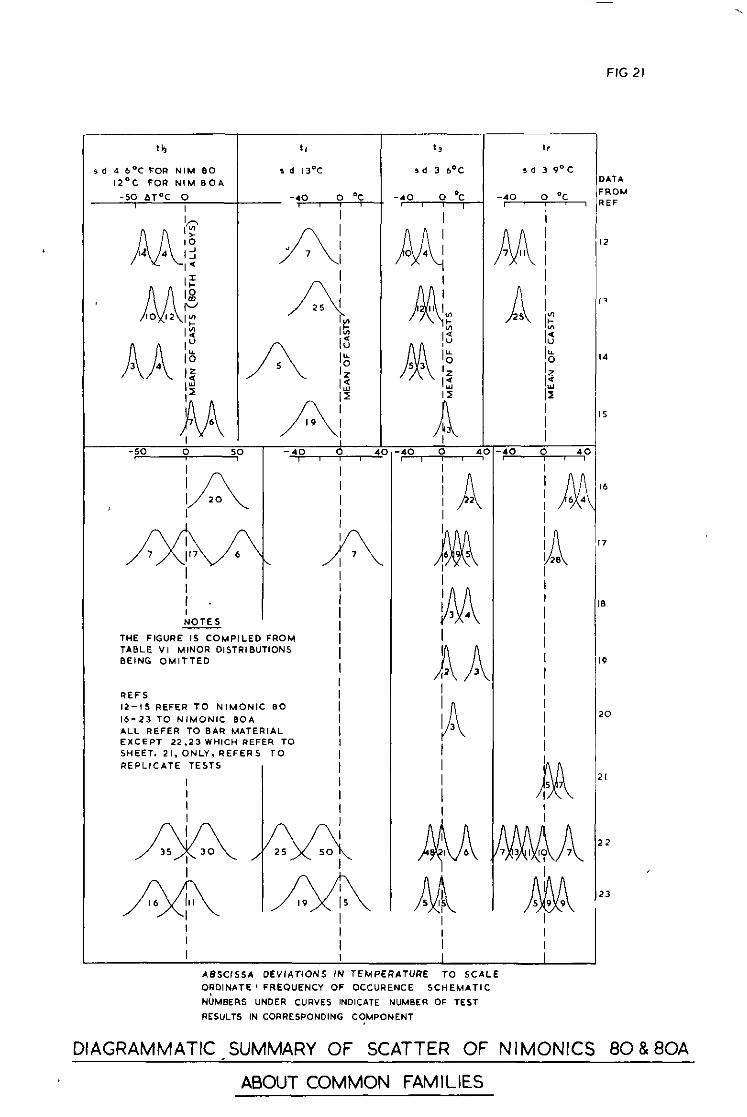
FIG 21
\ 7
\
y3, 9 .
-
K--
0
I I
G
I
n I5
I
DIAGRAMMATIC SUMMARY OF SCATTER OF NIMONICS 80&8OA
ABOUT COMMON FAMILIES

,-
,.
>-
)-
3-
5-
L-
COMMON LOG STRESS vs LOG tg FAMILY FOR NIMONIC 90
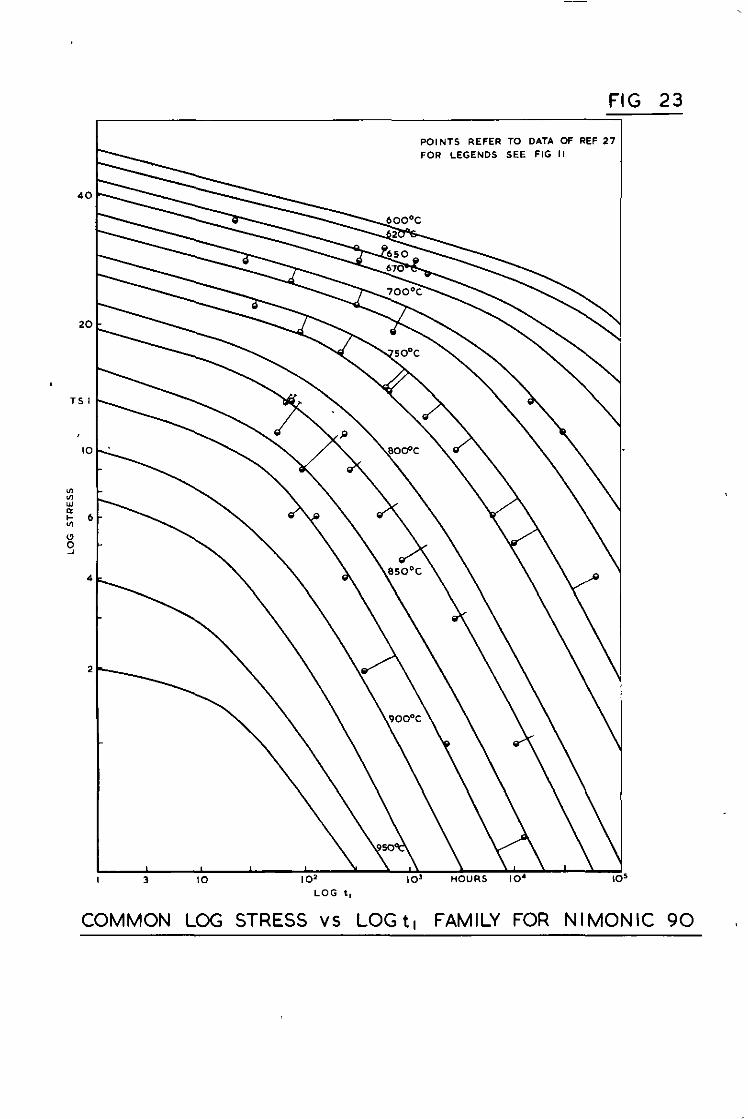
FIG 23
COMMON LOG STRESS vs LOG tl FAMILY FOR NI MONIC 90 <
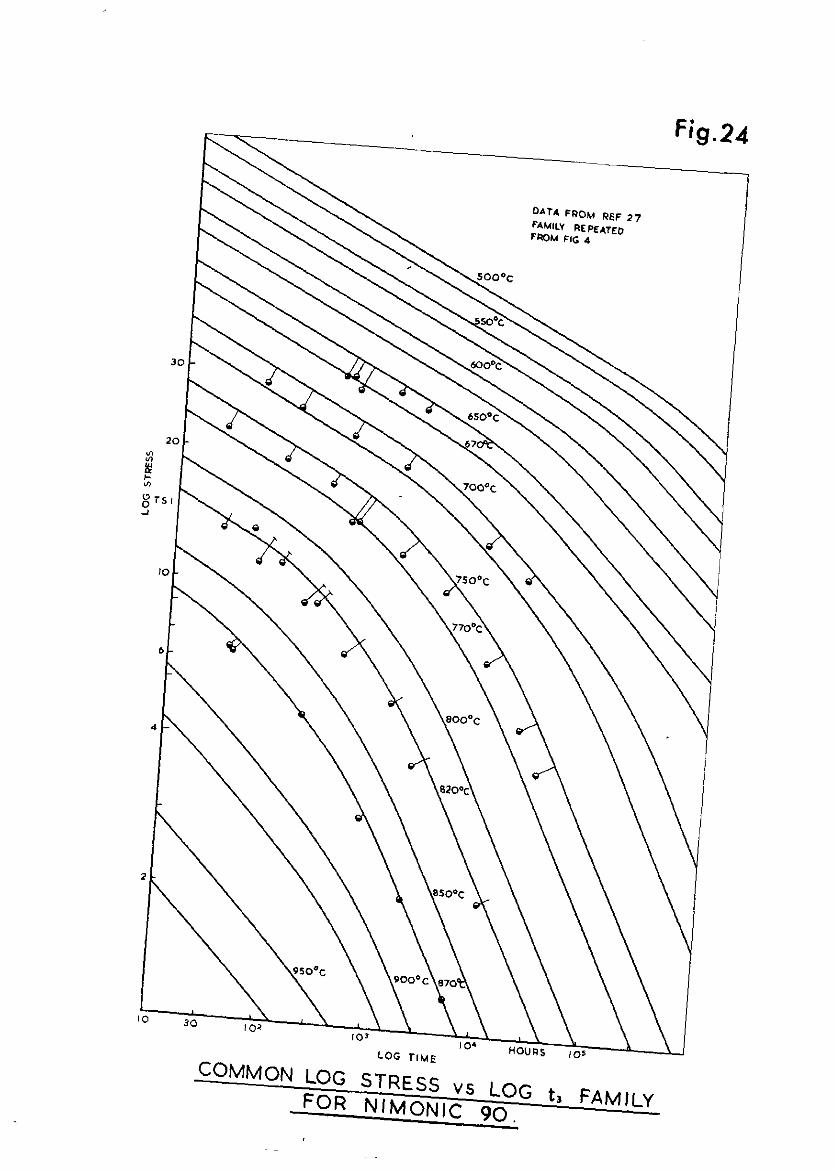
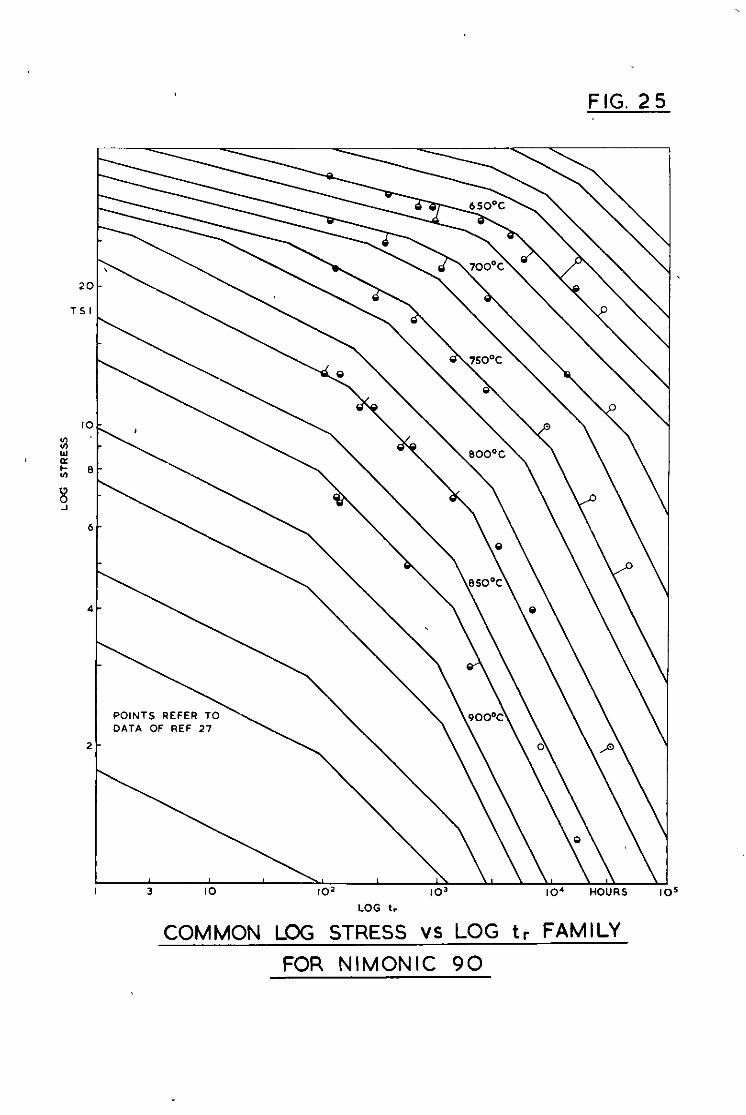
FIG. 25
LOG tr
COMMON LOG STRESS VS LOG t r FAMILY
FOR NIMONIC 90
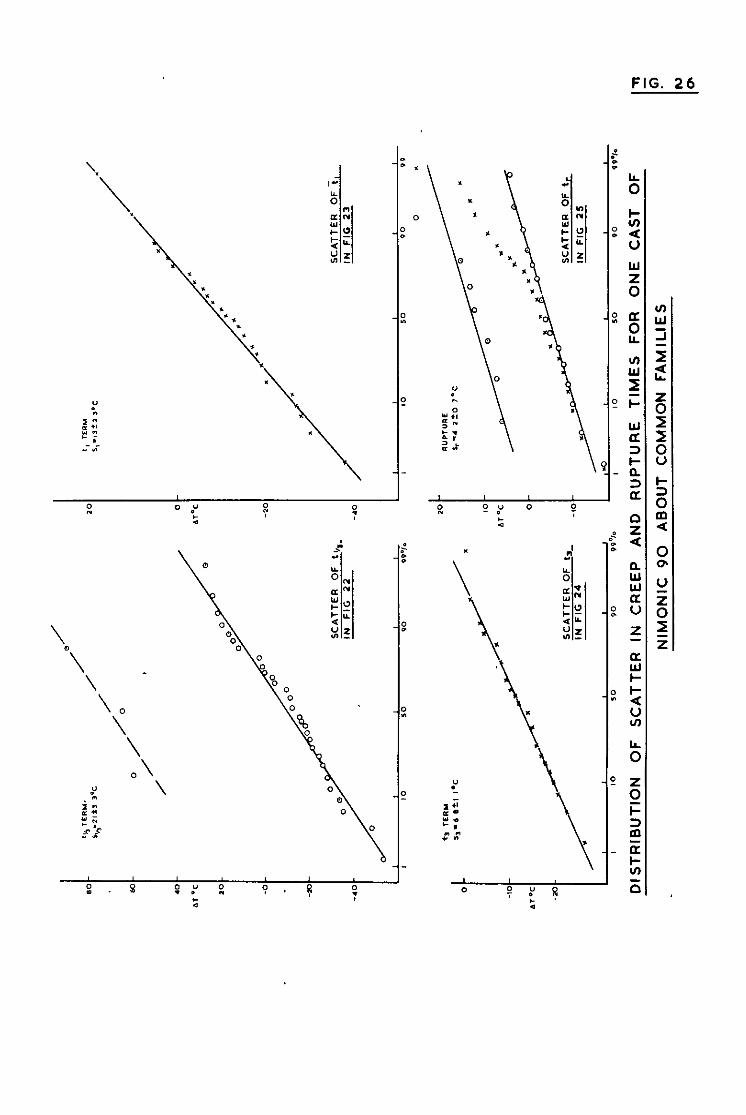
FIG. 26
L
0

FIG27
L
,
n
JJ
-
.
25
17
26
DIAGRAMMATIC SUMMARY OF SCATTER OF NIMONIC 90
ABOUT COMMON FAMILIES
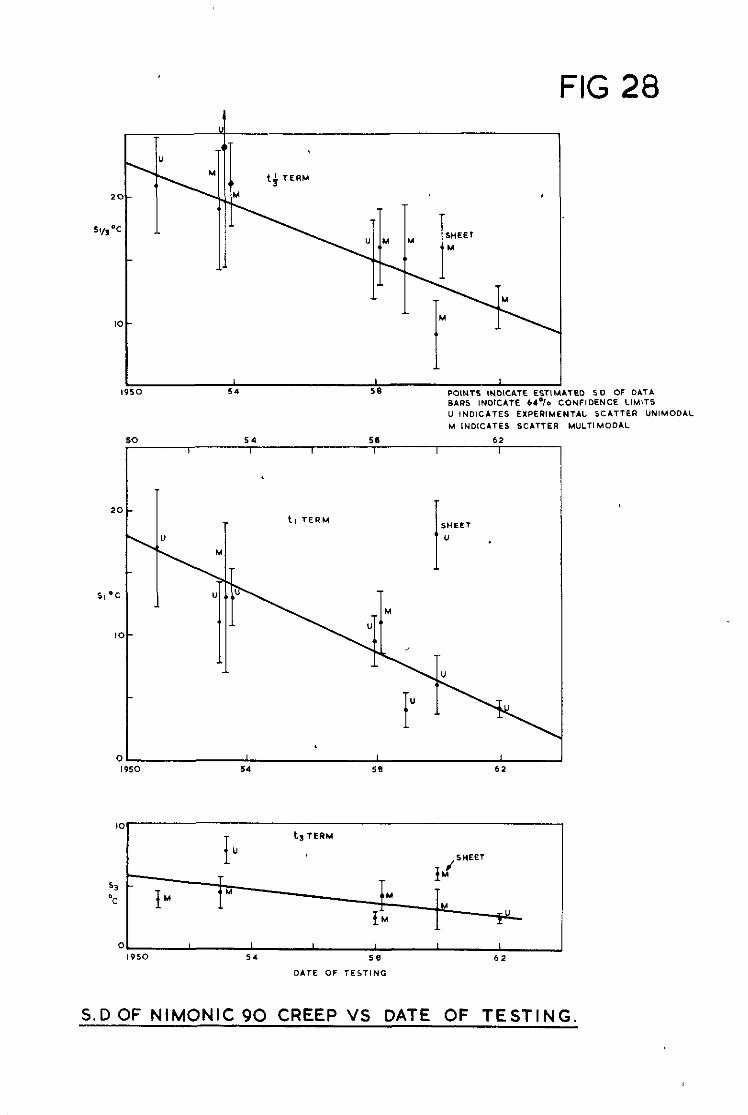
FIG 28
S.D OF NIMONIC 90 CREEP VS DATE OF TESTING.
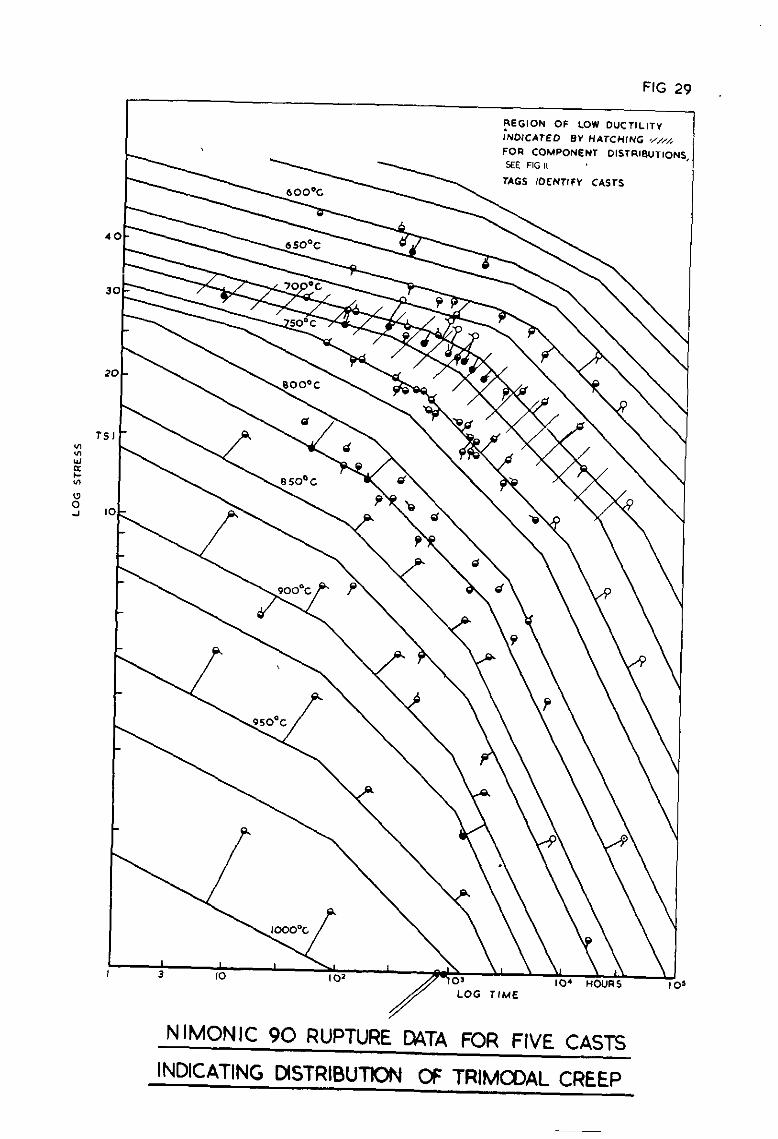
FIG 29
PEGION OF LOW D”CTlL,Ty INDICATED BY HATCHING “,,4
40 30 1
\ 30- \ ‘51 - \
10 - \
\
\
\
NhIONIC 90 RUPTURE DATA FOR FIVE CASTS
INDICATING DISTRIBUTION OF TRIMODAL CREEP
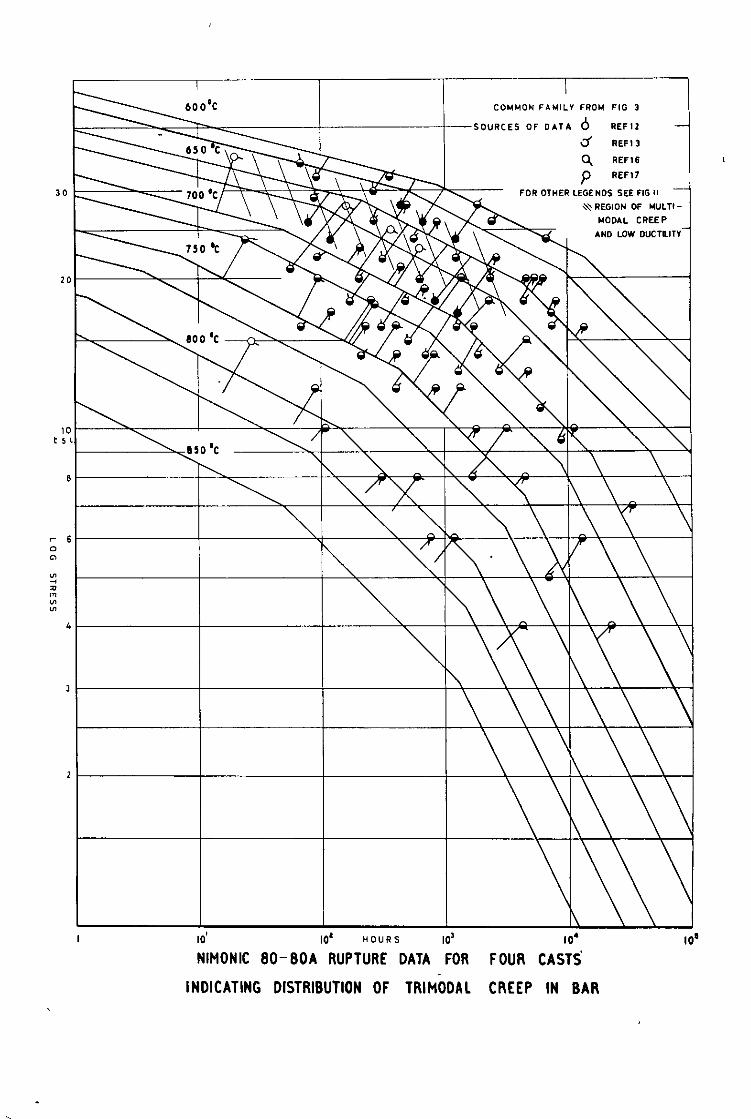
6
4
3
IO' "OURS IO'
NIMONIC BO-80A RUPTURE DATA FOR FOUR CASTS
INDICATING DISTRIBUTION OF TRIMbDAL CREEP IN BAR
. .
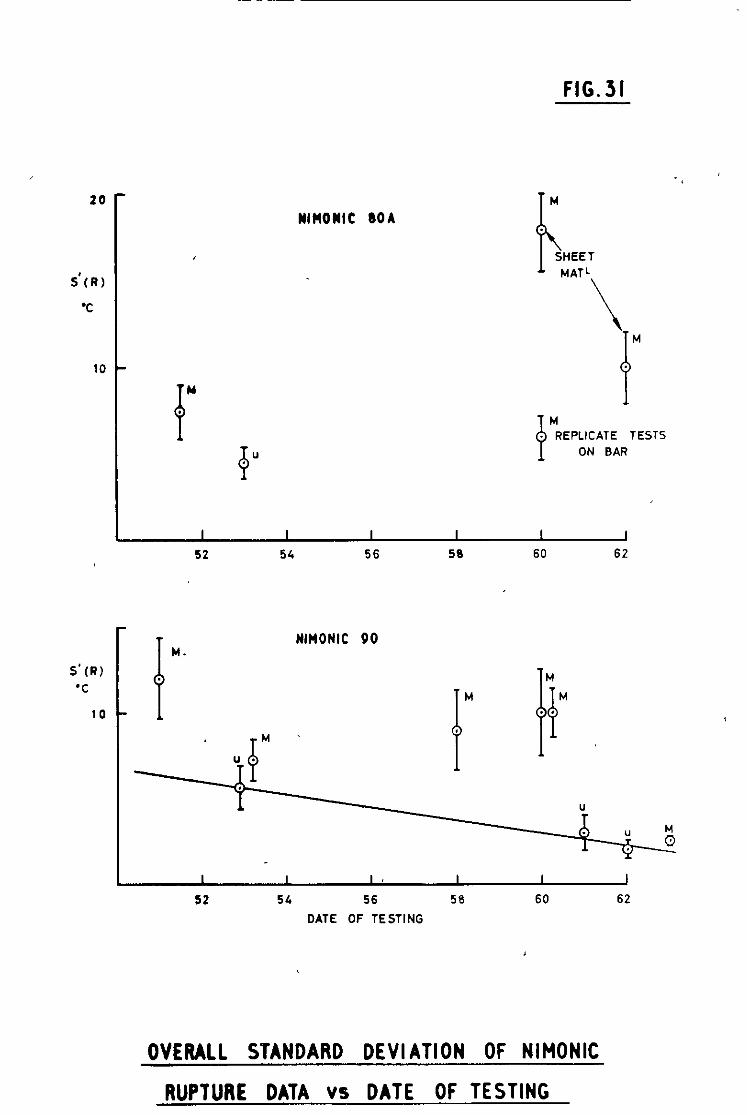
FIG.31
20
S’(R)
‘C
10
S’(R) ‘C
10
P Y
NlnONlC 8OA
Q ” P
M . REPLICATE TESTS
ON BAR
52
NIMONIC 90
52 54 56 56 60 62
DATE OF TESTING
OVERALL STANDARD DEVIATION OF NIMONIC
RUPTURE DATA vs DATE OF TESTING

FIG 32
- 38 x.5
FIRST EXAMPLE-DIRECT PLOT OF SCATTER DATA
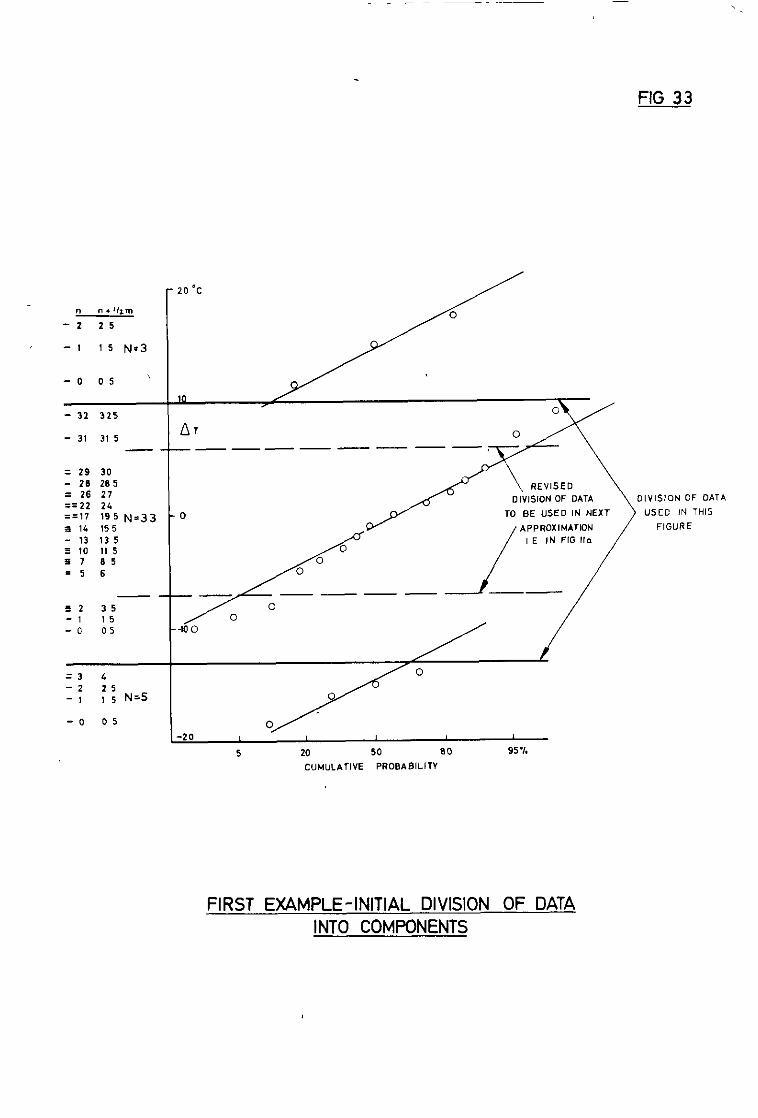
FIG 33
- I I5 Ns3
-005 ’
- 32 325
- 3, 3, 5 AT
___---- ----,
: 29 30 - 28 285
FIRST EXAMPLE-INITIAL DIVISION OF DATA INTO COMPONENTS
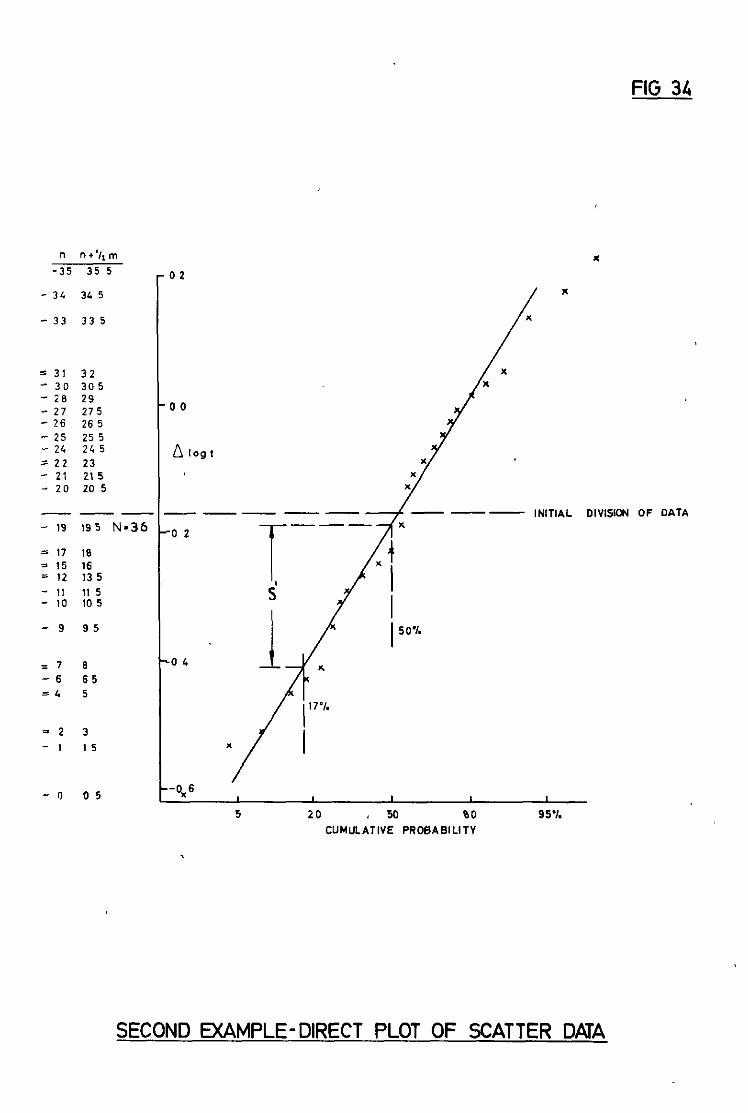
FIG 34
n n+‘/,m
-35 35 5
-34 345
-33 335
= 31 32 - 30 305 -2s 29 - 27 275 -26 265
-25 255 -24 245
-22 23 - 21 21 5 -20 205
---
- 19 195 N*36
= 17 18 -15 16 = 12 135
- ,I 11 5 -10 10s
-9 95
CT 8
-6 65
=4 5
=2 3
-1 15
-0 05
I---- --- INITIAL OIW!
‘0 2
,a 4
36 1 I 1
5 20 ,M 00 95%
CUMULATIVE PROBABILITY
OF DATA
SECOND EXAMPLE-DIRECT PLOT OF SCATTER DAJA
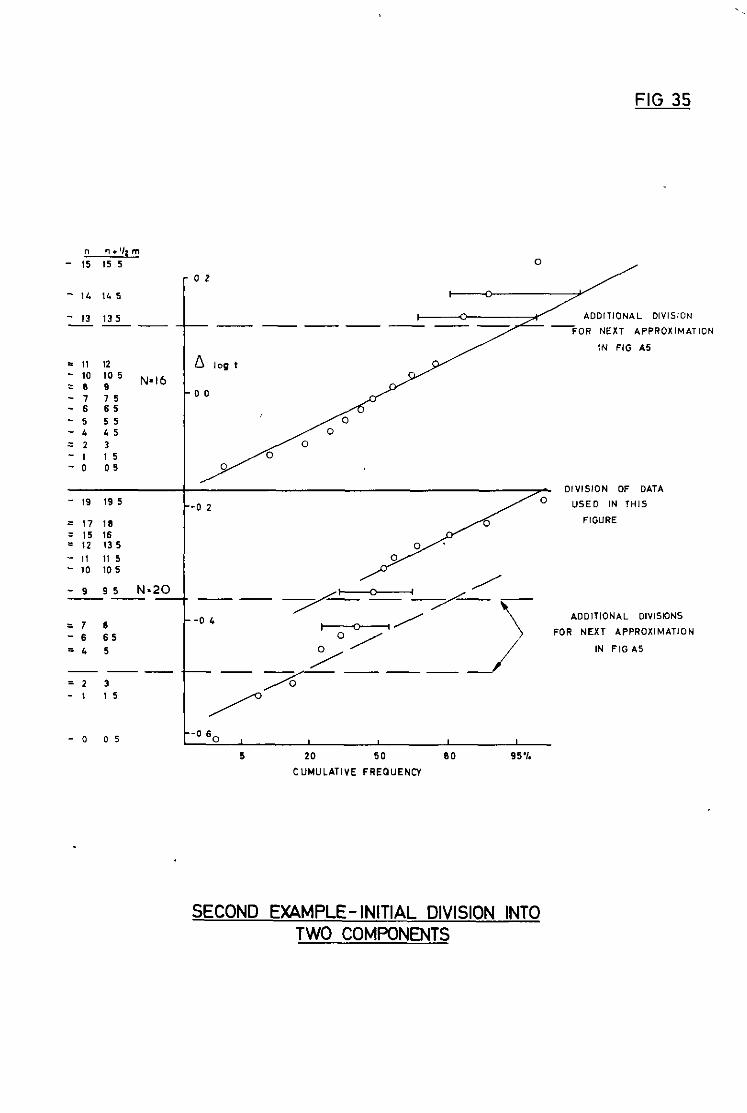
FIG 35
”
/
SECOND EXAMPLE- INITIAL DIVISION INTO TWO COMPONENTS
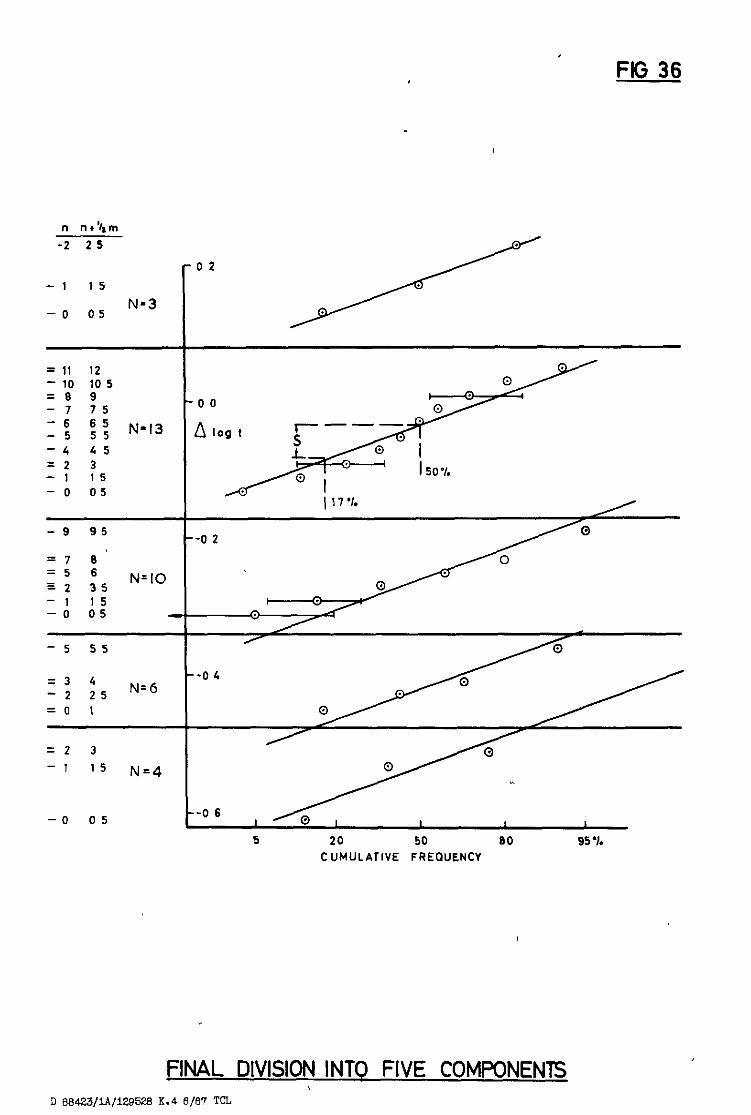
FIG 36
-7 75 ruu
=e 9 L ^ ^
-6 65 -5 55 N-13 IAlo,t
-4 45
Zl 2 3 15
-0 05
-9 95 --0 2
=7 e =5 6
a-2 35 N= IO
-1 15 -0 05
-5 55
=3 4
t
-0 4 -2 25
N=6
=o 1
=2 3
-1 15 N=4
-0 05
5 20 50 BO 95 %
CUMULATIVE FREQUENCY
FINAL DIVISION INTO FIVE COMPONENTS

C.P. No. 935
0 Crown copynghf 1967
Prmted and pubhshed by HER MAJESTY’S STATIONERY OFFICE
To be purchased from 49 High Holborn, London w c 1 423 Oxford Street, London w 1 13~ Castle Street, Edmburgh 2
109 St Mary Street, Cardiff Brazennose Street, Manchester 2
50 Farfax Street, Bristol 1 35 Smallbrook, Rmgway, Blrmmgham 5
7 - I I Linenhall Street, Belfast 2 or through any bookseller
Printed in England
C.P. No. 935 S 0 Code No. 23-9017-3s