Embed Size (px)
Citation preview
8/8/2019 Rancho Palos Verdes Oct '10 Report
http://slidepdf.com/reader/full/rancho-palos-verdes-oct-10-report 1/21
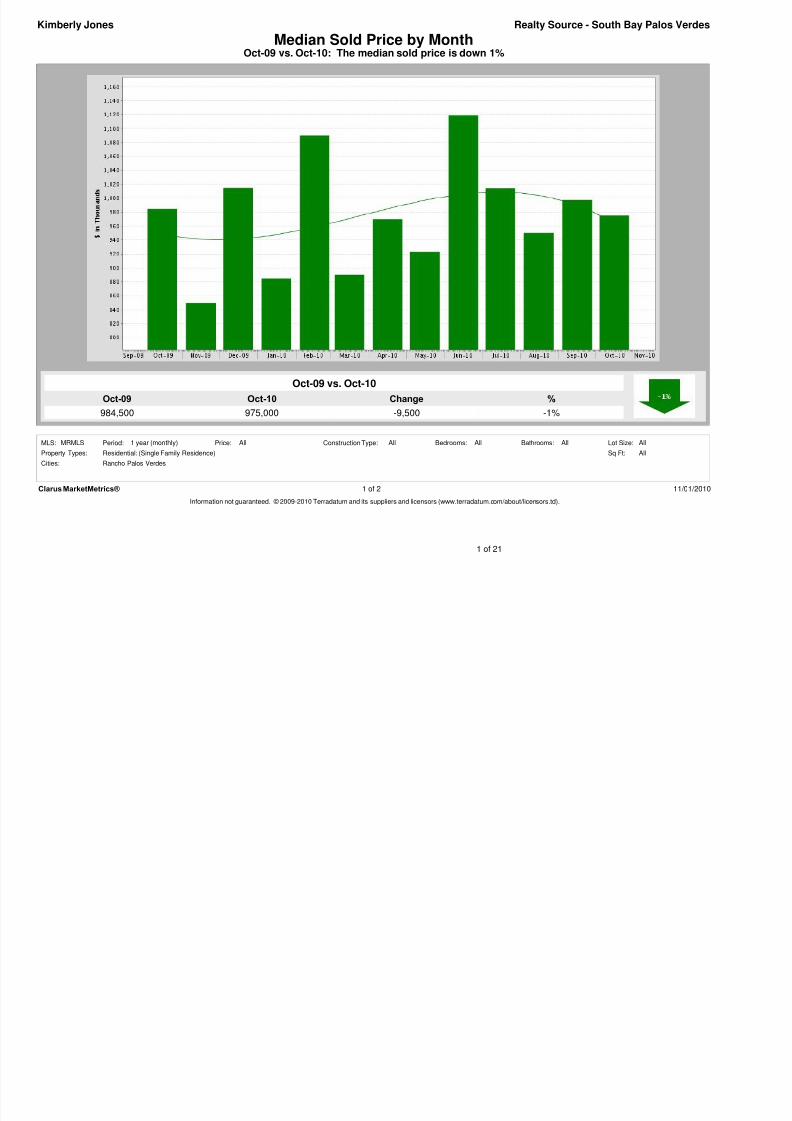
Oct-10
975,000
Oct-09
984,500
%
-1%
Change
-9,500
Oct-09 vs. Oct-10: The median sold price is down 1%Median Sold Price by Month
Realty Source - South Bay Palos Verdes
Oct-09 vs. Oct-10
Kimberly Jones
Clarus MarketMetrics® 1 of 2 11/01/2010
Information not guaranteed. © 2009-2010 Terradatum and its suppliers and licensors (www.terradatum.com/about/licensors.td).
AllBathrooms:MLS: AllAll
Sq Ft:
Rancho Palos Verdes
Residential: (Single Family Residence)
Period: All All
Property Types:
Cities:
All
Construction Type:Price: Lot Size:Bedrooms:1 year (monthly)MRMLS
1 of 21
8/8/2019 Rancho Palos Verdes Oct '10 Report
http://slidepdf.com/reader/full/rancho-palos-verdes-oct-10-report 2/21
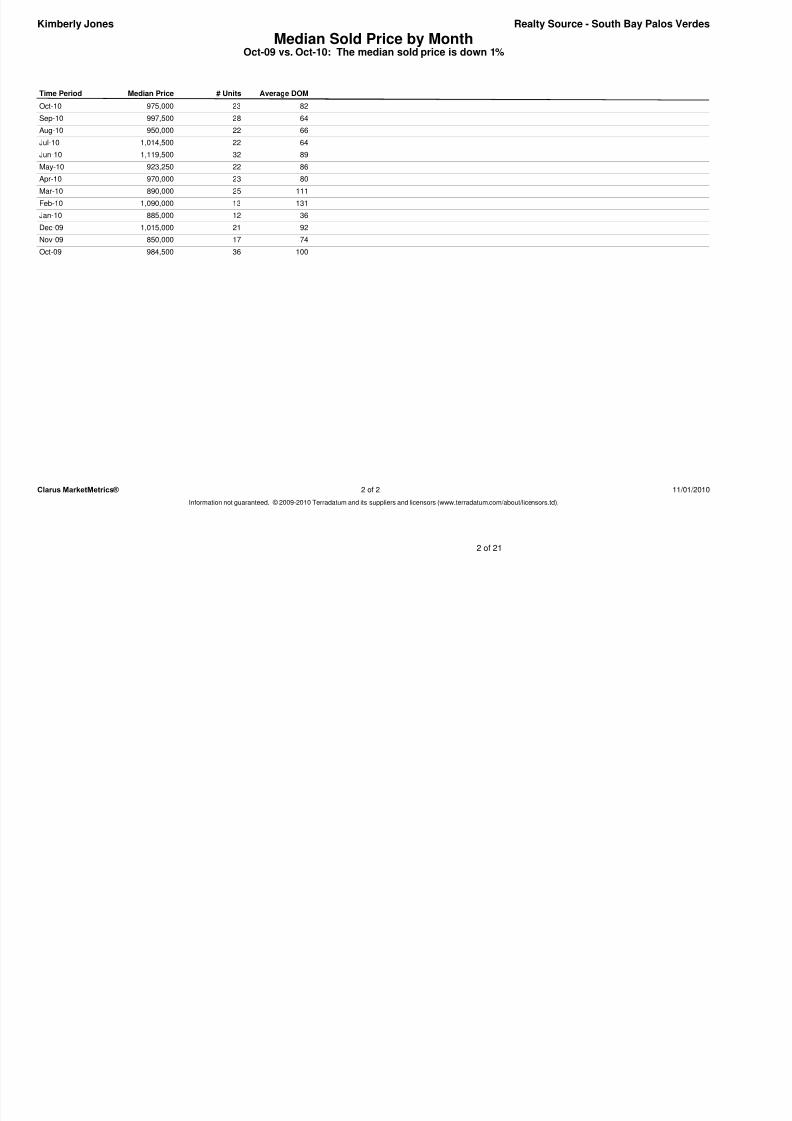
Median Sold Price by MonthOct-09 vs. Oct-10: The median sold price is down 1%
Realty Source - South Bay Palos VerdesKimberly Jones
Time Period Median Price # Units Average DOMOct-10 975,000 23 82
Sep-10 997,500 28 64
Aug-10 950,000 22 66
Jul-10 1,014,500 22 64
Jun-10 1,119,500 32 89
May-10 923,250 22 86
Apr-10 970,000 23 80
Mar-10 890,000 25 111Feb-10 1,090,000 13 131
Jan-10 885,000 12 36
Dec-09 1,015,000 21 92
Nov-09 850,000 17 74
Oct-09 984,500 36 100
Clarus MarketMetrics® 2 of 2 11/01/2010
Information not guaranteed. © 2009-2010 Terradatum and its suppliers and licensors (www.terradatum.com/about/licensors.td).
2 of 21
8/8/2019 Rancho Palos Verdes Oct '10 Report
http://slidepdf.com/reader/full/rancho-palos-verdes-oct-10-report 3/21
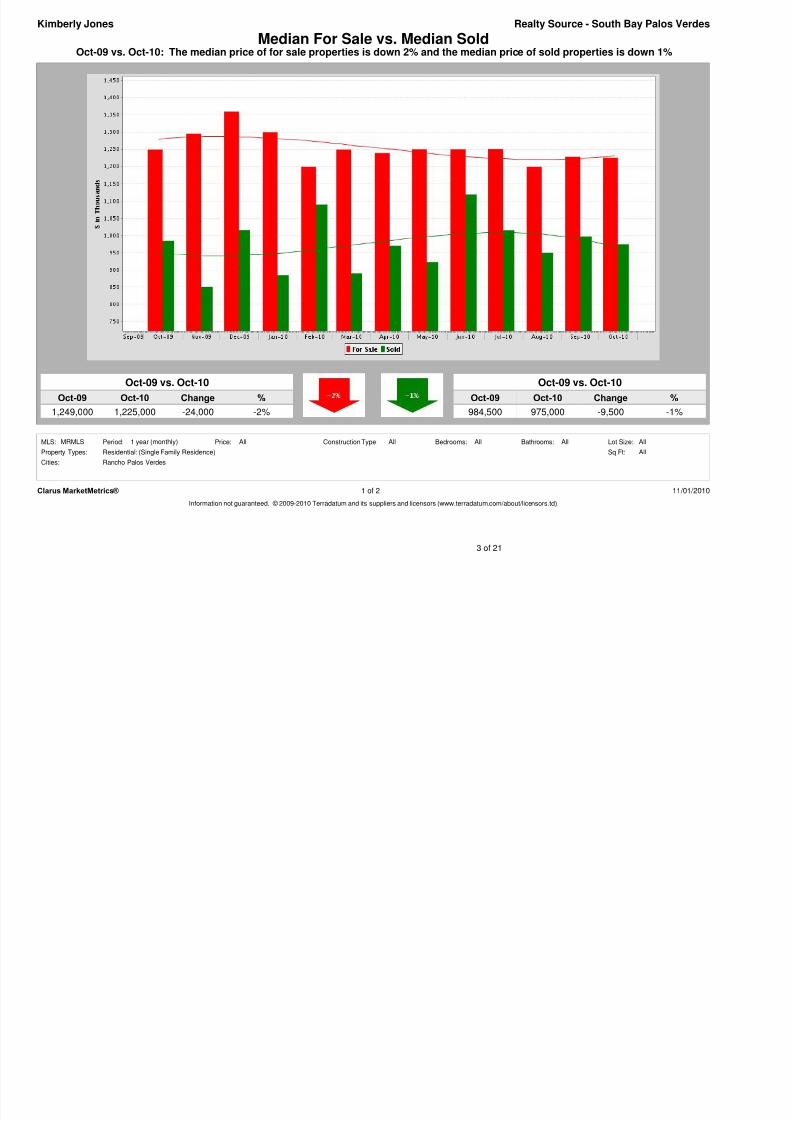
Oct-09 vs. Oct-10: The median price of for sale properties is down 2% and the median price of sold properties is down 1%
Realty Source - South Bay Palos Verdes
Oct-09 vs. Oct-10
1,249,000 -2%
Kimberly Jones
1,225,000
Oct-10
Median For Sale vs. Median Sold
ChangeOct-09 %
-24,000
Oct-09 Oct-10 %
984,500 -1%
Oct-09 vs. Oct-10
975,000
Change
-9,500
Clarus MarketMetrics® 1 of 2 11/01/2010
Information not guaranteed. © 2009-2010 Terradatum and its suppliers and licensors (www.terradatum.com/about/licensors.td).
AllBathrooms:MLS: AllAll
Sq Ft:
Rancho Palos Verdes
Residential: (Single Family Residence)
Period: All All
Property Types:
Cities:
All
Construction Type:Price: Lot Size:Bedrooms:1 year (monthly)MRMLS
3 of 21
8/8/2019 Rancho Palos Verdes Oct '10 Report
http://slidepdf.com/reader/full/rancho-palos-verdes-oct-10-report 4/21
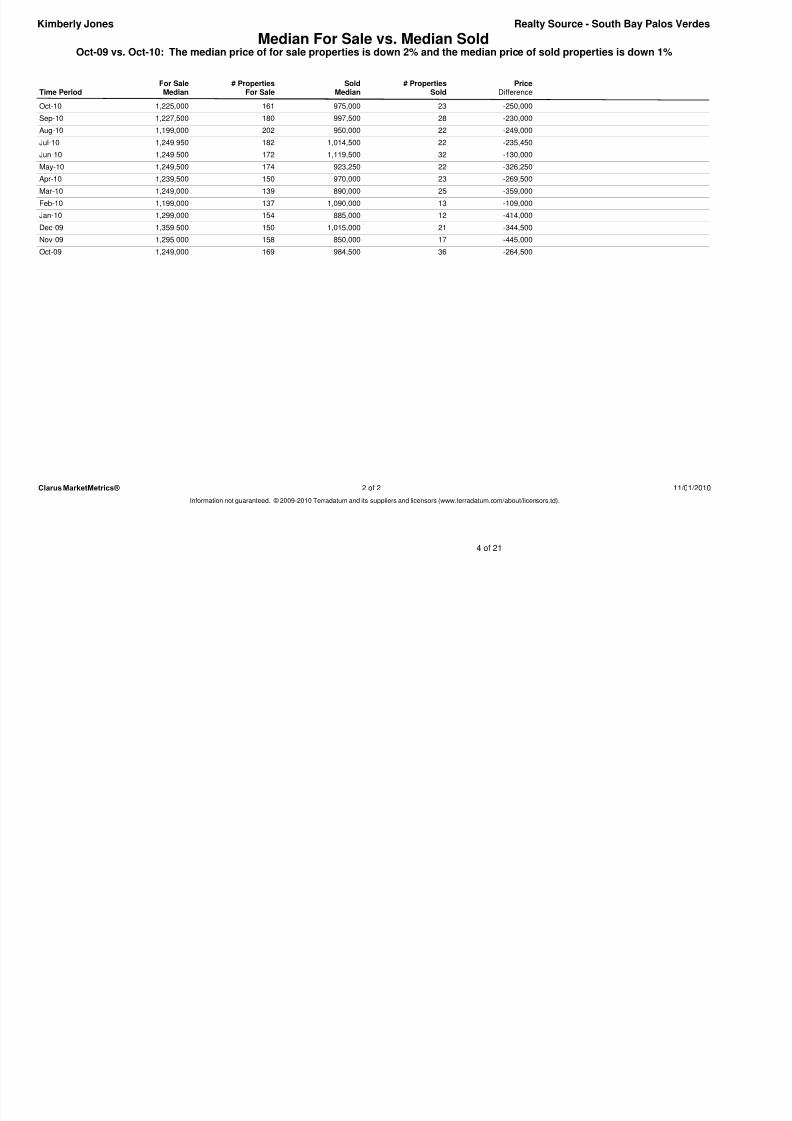
Median For Sale vs. Median SoldOct-09 vs. Oct-10: The median price of for sale properties is down 2% and the median price of sold properties is down 1%
Realty Source - South Bay Palos VerdesKimberly Jones
Time Period For SaleMedian SoldMedianFor Sale # Properties # PropertiesSold Price
Difference
Oct-10 161 231,225,000 975,000 -250,000
Sep-10 180 281,227,500 997,500 -230,000
Aug-10 202 221,199,000 950,000 -249,000
Jul-10 182 221,249,950 1,014,500 -235,450
Jun-10 172 321,249,500 1,119,500 -130,000
May-10 174 221,249,500 923,250 -326,250
Apr-10 150 231,239,500 970,000 -269,500
Mar-10 139 251,249,000 890,000 -359,000
Feb-10 137 131,199,000 1,090,000 -109,000
Jan-10 154 121,299,000 885,000 -414,000
Dec-09 150 211,359,500 1,015,000 -344,500
Nov-09 158 171,295,000 850,000 -445,000
Oct-09 169 361,249,000 984,500 -264,500
Clarus MarketMetrics®
Information not guaranteed. © 2009-2010 Terradatum and its suppliers and licensors (www.terradatum.com/about/licensors.td).
2 of 2 11/01/2010
4 of 21
8/8/2019 Rancho Palos Verdes Oct '10 Report
http://slidepdf.com/reader/full/rancho-palos-verdes-oct-10-report 5/21
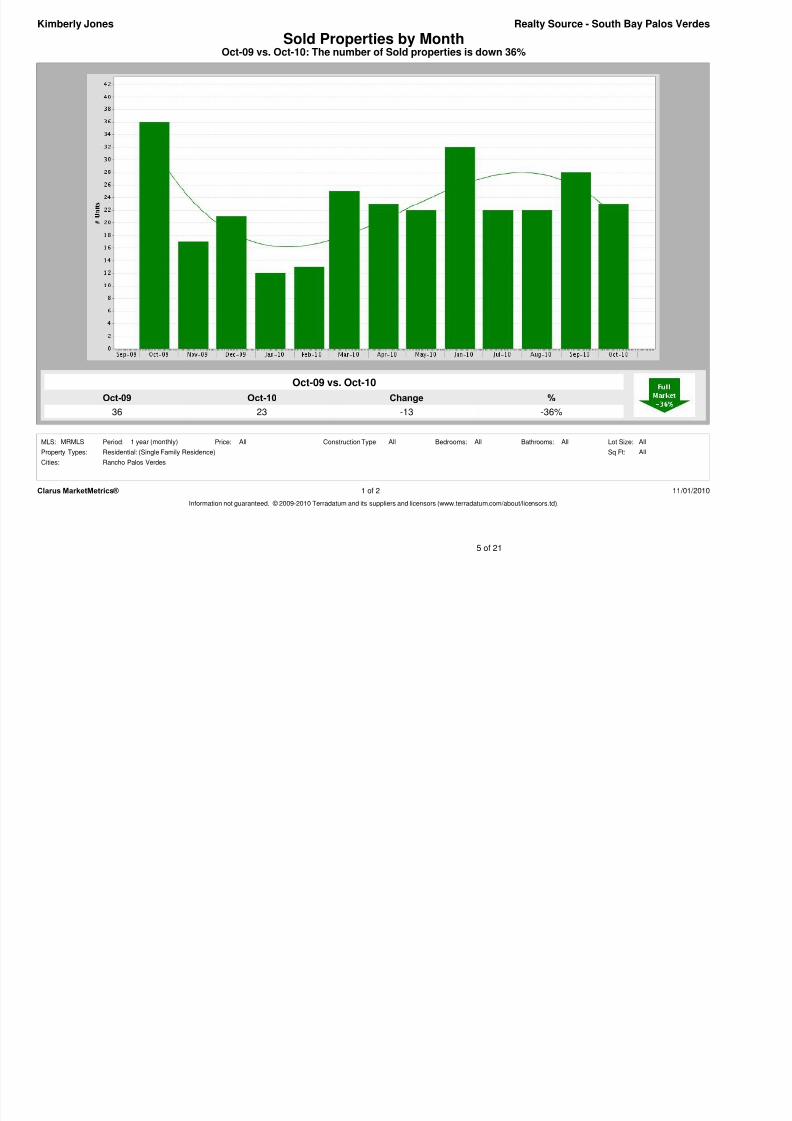
Oct-10
23
Oct-09
36
%
-36%
Change
-13
Oct-09 vs. Oct-10: The number of Sold properties is down 36%Sold Properties by Month
Realty Source - South Bay Palos Verdes
Oct-09 vs. Oct-10
Kimberly Jones
Clarus MarketMetrics® 1 of 2 11/01/2010
Information not guaranteed. © 2009-2010 Terradatum and its suppliers and licensors (www.terradatum.com/about/licensors.td).
AllBathrooms:MLS: AllAll
Sq Ft:
Rancho Palos Verdes
Residential: (Single Family Residence)
Period: All All
Property Types:
Cities:
All
Construction Type:Price: Lot Size:Bedrooms:1 year (monthly)MRMLS
5 of 21
8/8/2019 Rancho Palos Verdes Oct '10 Report
http://slidepdf.com/reader/full/rancho-palos-verdes-oct-10-report 6/21
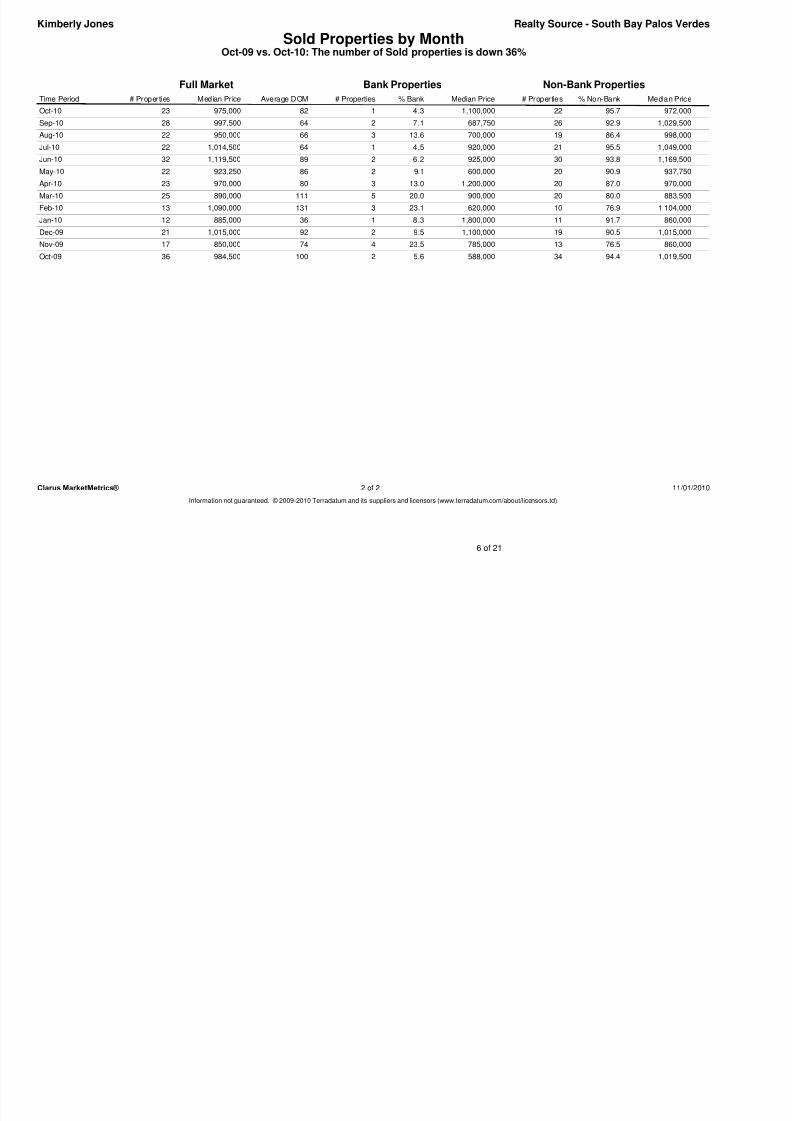
Sold Properties by MonthOct-09 vs. Oct-10: The number of Sold properties is down 36%
Realty Source - South Bay Palos VerdesKimberly Jones
Time Period
Full Market
# Properties Median Price Average DOM
Bank Properties
# Properties % Bank Median Price
Non-Bank Properties
# Properties % Non-Bank Median Price
Oct-10 975,00023 82 1 4.3 1,100,000 22 95.7 972,000
Sep-10 997,50028 64 2 7.1 687,750 26 92.9 1,029,500
Aug-10 950,00022 66 3 13.6 700,000 19 86.4 998,000
Jul-10 1,014,50022 64 1 4.5 920,000 21 95.5 1,049,000
Jun-10 1,119,50032 89 2 6.2 925,000 30 93.8 1,169,500
May-10 923,25022 86 2 9.1 600,000 20 90.9 937,750
Apr-10 970,00023 80 3 13.0 1,200,000 20 87.0 970,000
Mar-10 890,00025 111 5 20.0 900,000 20 80.0 883,500Feb-10 1,090,00013 131 3 23.1 620,000 10 76.9 1,104,000
Jan-10 885,00012 36 1 8.3 1,800,000 11 91.7 860,000
Dec-09 1,015,00021 92 2 9.5 1,100,000 19 90.5 1,015,000
Nov-09 850,00017 74 4 23.5 785,000 13 76.5 860,000
Oct-09 984,50036 100 2 5.6 588,000 34 94.4 1,019,500
Clarus MarketMetrics® 2 of 2 11/01/2010Information not guaranteed. © 2009-2010 Terradatum and its suppliers and licensors (www.terradatum.com/about/licensors.td).
6 of 21
8/8/2019 Rancho Palos Verdes Oct '10 Report
http://slidepdf.com/reader/full/rancho-palos-verdes-oct-10-report 7/21
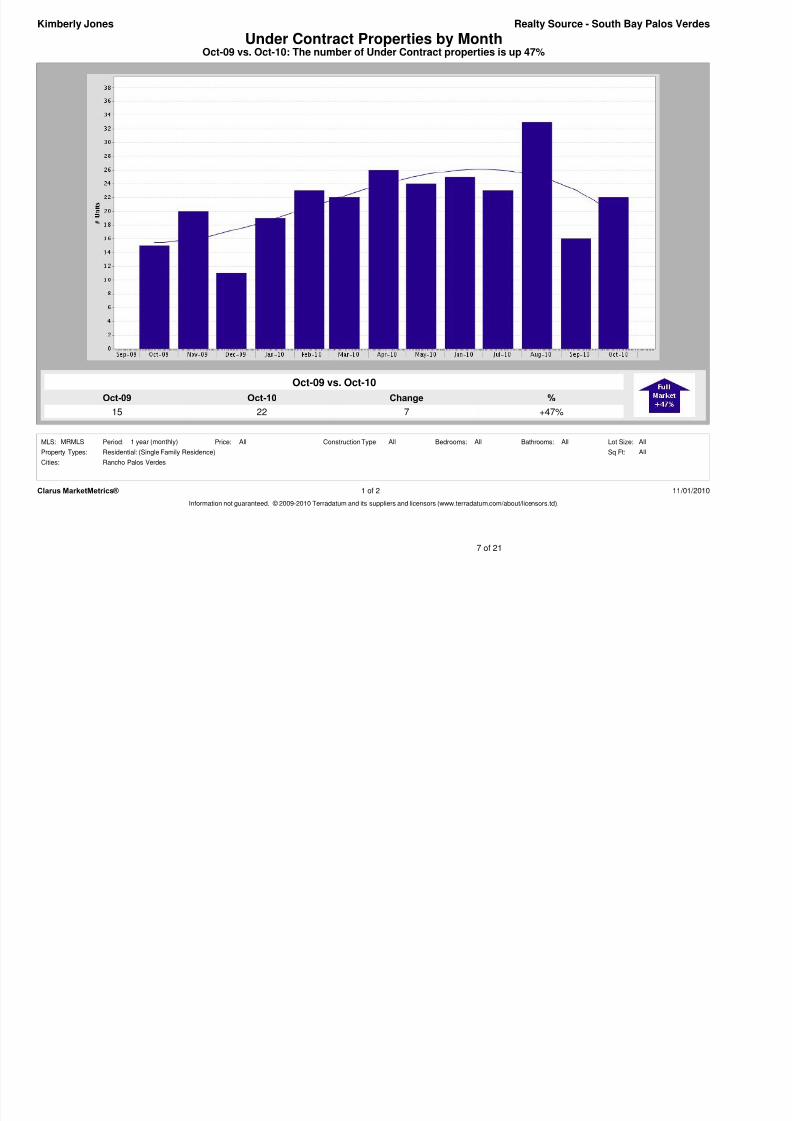
Oct-10
22
Oct-09
15
%
+47%
Change
7
Oct-09 vs. Oct-10: The number of Under Contract properties is up 47%Under Contract Properties by Month
Realty Source - South Bay Palos Verdes
Oct-09 vs. Oct-10
Kimberly Jones
Clarus MarketMetrics® 1 of 2 11/01/2010
Information not guaranteed. © 2009-2010 Terradatum and its suppliers and licensors (www.terradatum.com/about/licensors.td).
AllBathrooms:MLS: AllAll
Sq Ft:
Rancho Palos Verdes
Residential: (Single Family Residence)
Period: All All
Property Types:
Cities:
All
Construction Type:Price: Lot Size:Bedrooms:1 year (monthly)MRMLS
7 of 21
8/8/2019 Rancho Palos Verdes Oct '10 Report
http://slidepdf.com/reader/full/rancho-palos-verdes-oct-10-report 8/21
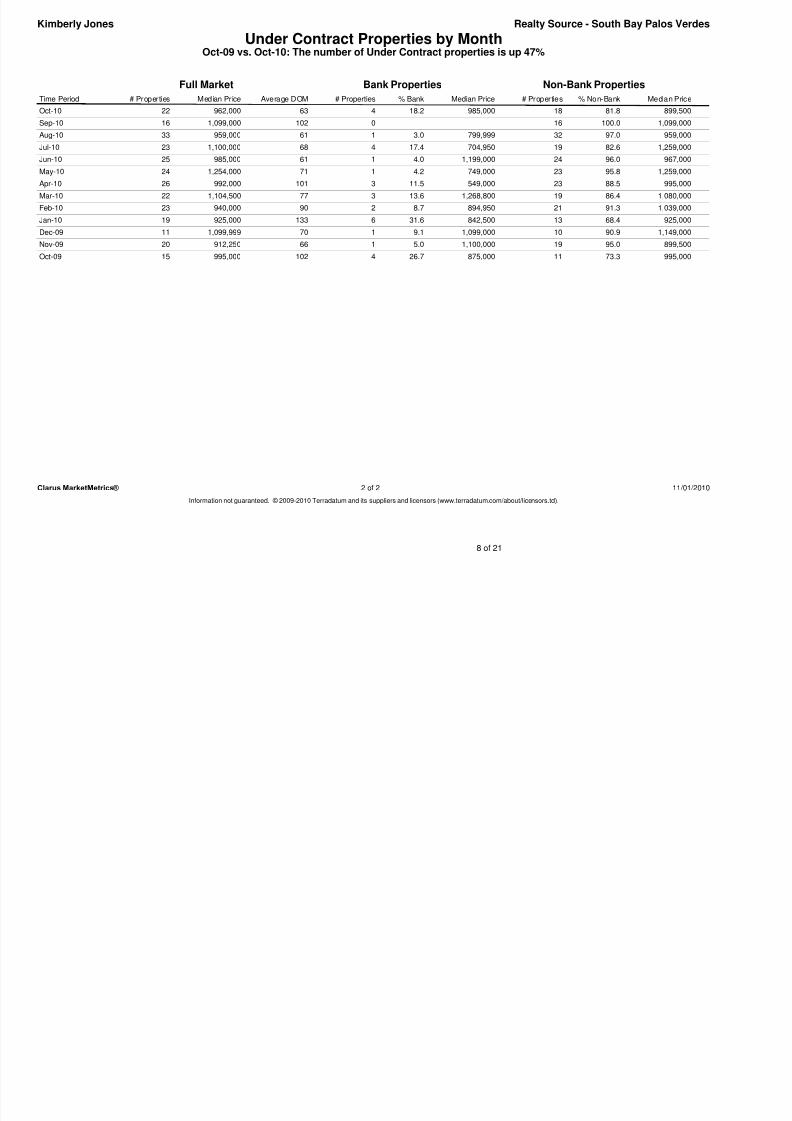
Under Contract Properties by MonthOct-09 vs. Oct-10: The number of Under Contract properties is up 47%
Realty Source - South Bay Palos VerdesKimberly Jones
Time Period
Full Market
# Properties Median Price Average DOM
Bank Properties
# Properties % Bank Median Price
Non-Bank Properties
# Properties % Non-Bank Median PriceOct-10 962,00022 63 899,50081.818985,00018.24
Sep-10 1,099,00016 102 1,099,000100.0160
Aug-10 959,00033 61 959,00097.032799,9993.01
Jul-10 1,100,00023 68 1,259,00082.619704,95017.44
Jun-10 985,00025 61 967,00096.0241,199,0004.01
May-10 1,254,00024 71 1,259,00095.823749,0004.21
Apr-10 992,00026 101 995,00088.523549,00011.53
Mar-10 1,104,50022 77 1,080,00086.4191,268,80013.63Feb-10 940,00023 90 1,039,00091.321894,9508.72
Jan-10 925,00019 133 925,00068.413842,50031.66
Dec-09 1,099,99911 70 1,149,00090.9101,099,0009.11
Nov-09 912,25020 66 899,50095.0191,100,0005.01
Oct-09 995,00015 102 995,00073.311875,00026.74
Clarus MarketMetrics® 2 of 2 11/01/2010Information not guaranteed. © 2009-2010 Terradatum and its suppliers and licensors (www.terradatum.com/about/licensors.td).
8 of 21
8/8/2019 Rancho Palos Verdes Oct '10 Report
http://slidepdf.com/reader/full/rancho-palos-verdes-oct-10-report 9/21
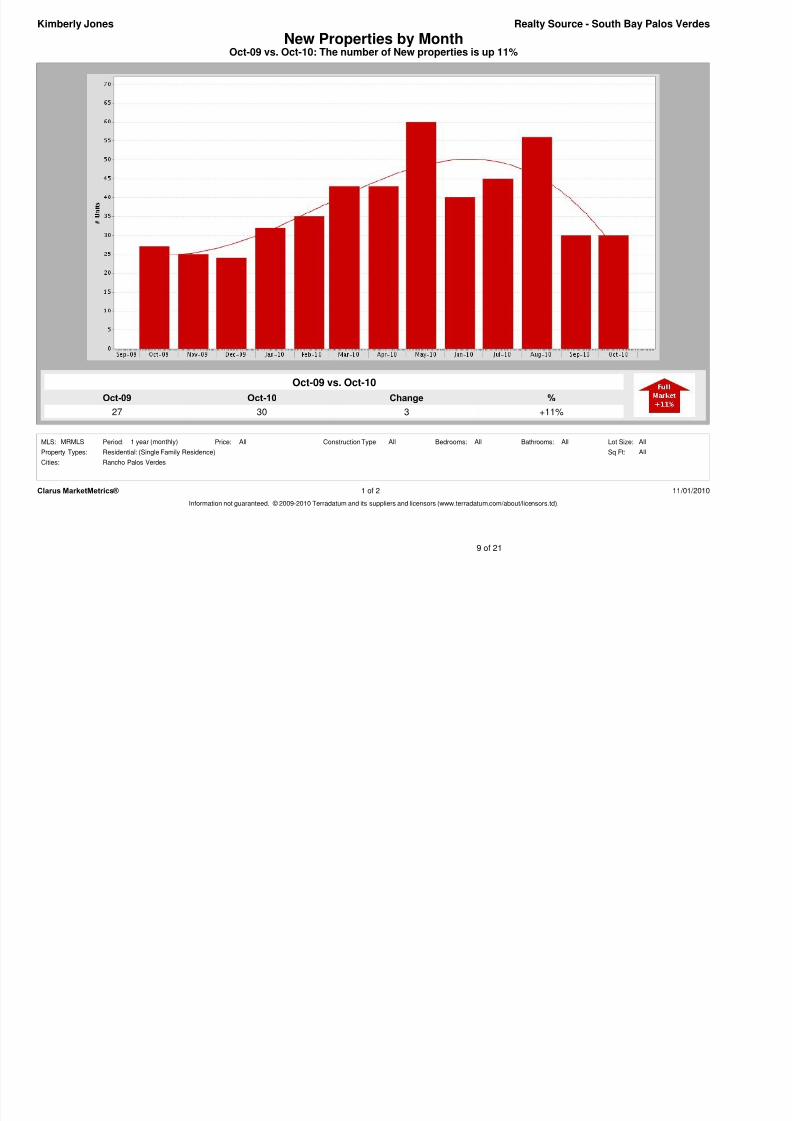
Oct-10
30
Oct-09
27
%
+11%
Change
3
Oct-09 vs. Oct-10: The number of New properties is up 11%New Properties by Month
Realty Source - South Bay Palos Verdes
Oct-09 vs. Oct-10
Kimberly Jones
Clarus MarketMetrics® 1 of 2 11/01/2010
Information not guaranteed. © 2009-2010 Terradatum and its suppliers and licensors (www.terradatum.com/about/licensors.td).
AllBathrooms:MLS: AllAll
Sq Ft:
Rancho Palos Verdes
Residential: (Single Family Residence)
Period: All All
Property Types:
Cities:
All
Construction Type:Price: Lot Size:Bedrooms:1 year (monthly)MRMLS
9 of 21
8/8/2019 Rancho Palos Verdes Oct '10 Report
http://slidepdf.com/reader/full/rancho-palos-verdes-oct-10-report 10/21
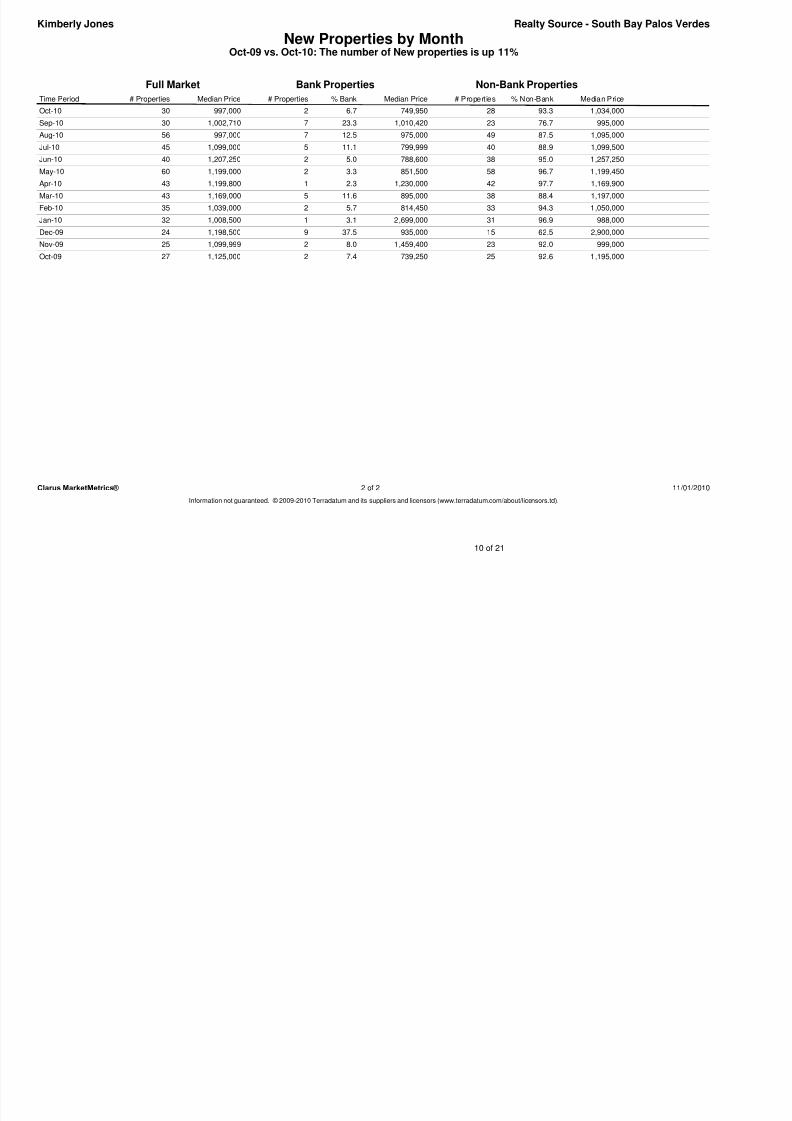
New Properties by MonthOct-09 vs. Oct-10: The number of New properties is up 11%
Realty Source - South Bay Palos VerdesKimberly Jones
Time Period # Properties
Full Market
Median Price
Bank Properties
# Properties % Bank Median Price
Non-Bank Properties
# Properties % Non-Bank Median PriceOct-10 997,00030 2 6.7 749,950 28 93.3 1,034,000
Sep-10 1,002,71030 7 23.3 1,010,420 23 76.7 995,000
Aug-10 997,00056 7 12.5 975,000 49 87.5 1,095,000
Jul-10 1,099,00045 5 11.1 799,999 40 88.9 1,099,500
Jun-10 1,207,25040 2 5.0 788,600 38 95.0 1,257,250
May-10 1,199,00060 2 3.3 851,500 58 96.7 1,199,450
Apr-10 1,199,80043 1 2.3 1,230,000 42 97.7 1,169,900
Mar-10 1,169,00043 5 11.6 895,000 38 88.4 1,197,000Feb-10 1,039,00035 2 5.7 814,450 33 94.3 1,050,000
Jan-10 1,008,50032 1 3.1 2,699,000 31 96.9 988,000
Dec-09 1,198,50024 9 37.5 935,000 15 62.5 2,900,000
Nov-09 1,099,99925 2 8.0 1,459,400 23 92.0 999,000
Oct-09 1,125,00027 2 7.4 739,250 25 92.6 1,195,000
Clarus MarketMetrics® 2 of 2 11/01/2010Information not guaranteed. © 2009-2010 Terradatum and its suppliers and licensors (www.terradatum.com/about/licensors.td).
10 of 21
8/8/2019 Rancho Palos Verdes Oct '10 Report
http://slidepdf.com/reader/full/rancho-palos-verdes-oct-10-report 11/21
Oct-10
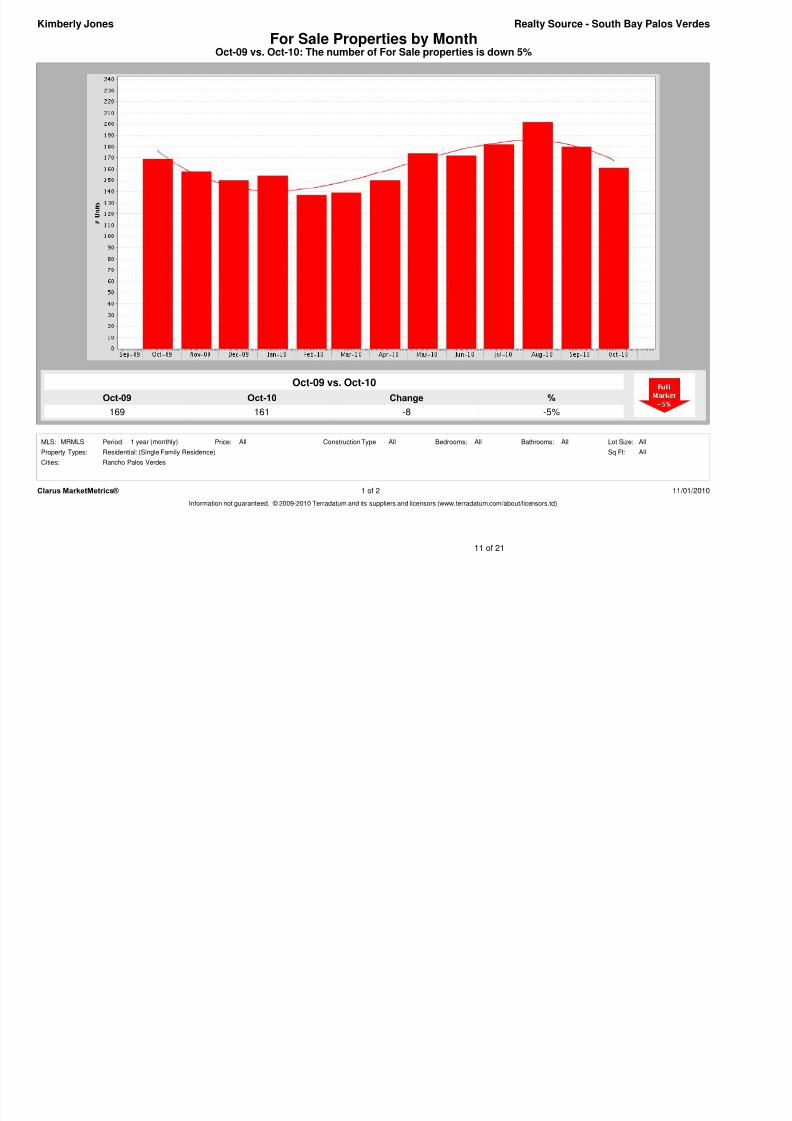
161
Oct-09
169
%
-5%
Change
-8
Oct-09 vs. Oct-10: The number of For Sale properties is down 5%For Sale Properties by Month
Realty Source - South Bay Palos Verdes
Oct-09 vs. Oct-10
Kimberly Jones
Clarus MarketMetrics® 1 of 2 11/01/2010
Information not guaranteed. © 2009-2010 Terradatum and its suppliers and licensors (www.terradatum.com/about/licensors.td).
AllBathrooms:MLS: AllAll
Sq Ft:
Rancho Palos Verdes
Residential: (Single Family Residence)
Period: All All
Property Types:
Cities:
All
Construction Type:Price: Lot Size:Bedrooms:1 year (monthly)MRMLS
11 of 21
8/8/2019 Rancho Palos Verdes Oct '10 Report
http://slidepdf.com/reader/full/rancho-palos-verdes-oct-10-report 12/21
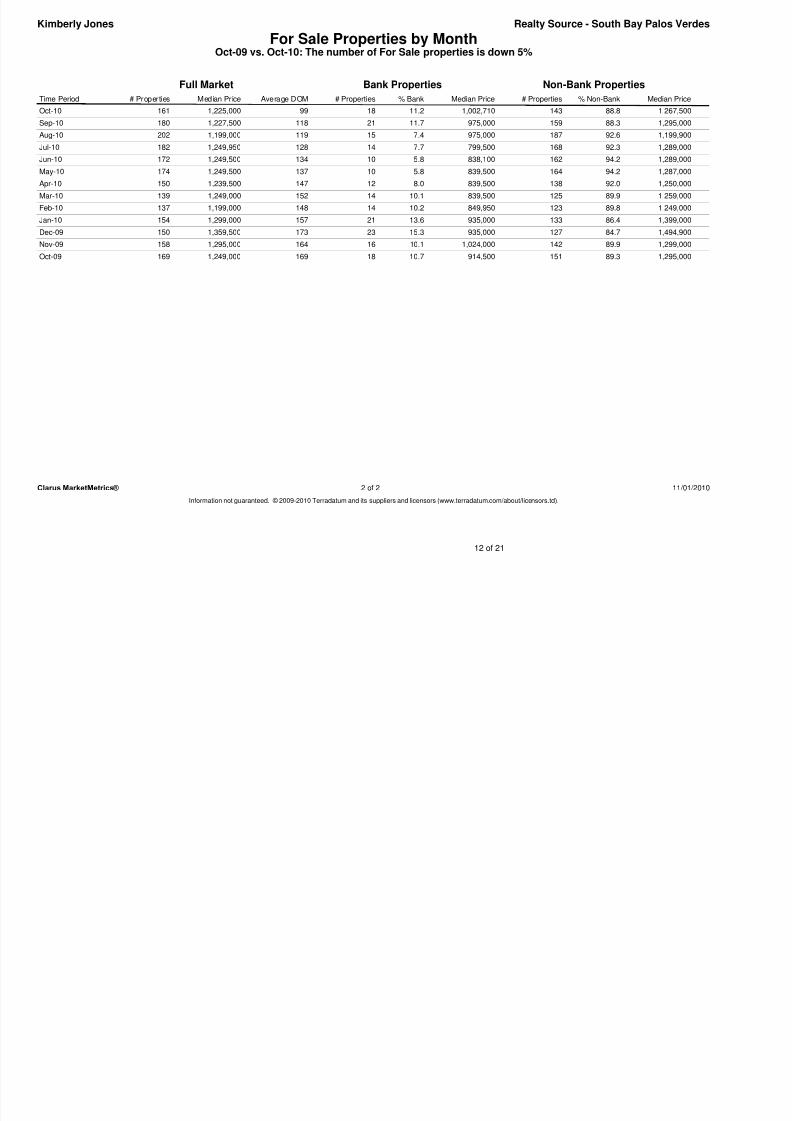
For Sale Properties by MonthOct-09 vs. Oct-10: The number of For Sale properties is down 5%
Realty Source - South Bay Palos VerdesKimberly Jones
# PropertiesTime Period
Full Market
# Properties Median Price Average DOM
Bank Properties Non-Bank Properties
% Bank Median Price # Properties % Non-Bank Median PriceOct-10 1,225,000161 99 18 11.2 1,002,710 143 88.8 1,267,500
Sep-10 1,227,500180 118 21 11.7 975,000 159 88.3 1,295,000
Aug-10 1,199,000202 119 15 7.4 975,000 187 92.6 1,199,900
Jul-10 1,249,950182 128 14 7.7 799,500 168 92.3 1,289,000
Jun-10 1,249,500172 134 10 5.8 838,100 162 94.2 1,289,000
May-10 1,249,500174 137 10 5.8 839,500 164 94.2 1,287,000
Apr-10 1,239,500150 147 12 8.0 839,500 138 92.0 1,250,000
Mar-10 1,249,000139 152 14 10.1 839,500 125 89.9 1,259,000Feb-10 1,199,000137 148 14 10.2 849,950 123 89.8 1,249,000
Jan-10 1,299,000154 157 21 13.6 935,000 133 86.4 1,399,000
Dec-09 1,359,500150 173 23 15.3 935,000 127 84.7 1,494,900
Nov-09 1,295,000158 164 16 10.1 1,024,000 142 89.9 1,299,000
Oct-09 1,249,000169 169 18 10.7 914,500 151 89.3 1,295,000
Clarus MarketMetrics® 2 of 2 11/01/2010Information not guaranteed. © 2009-2010 Terradatum and its suppliers and licensors (www.terradatum.com/about/licensors.td).
12 of 21
8/8/2019 Rancho Palos Verdes Oct '10 Report
http://slidepdf.com/reader/full/rancho-palos-verdes-oct-10-report 13/21
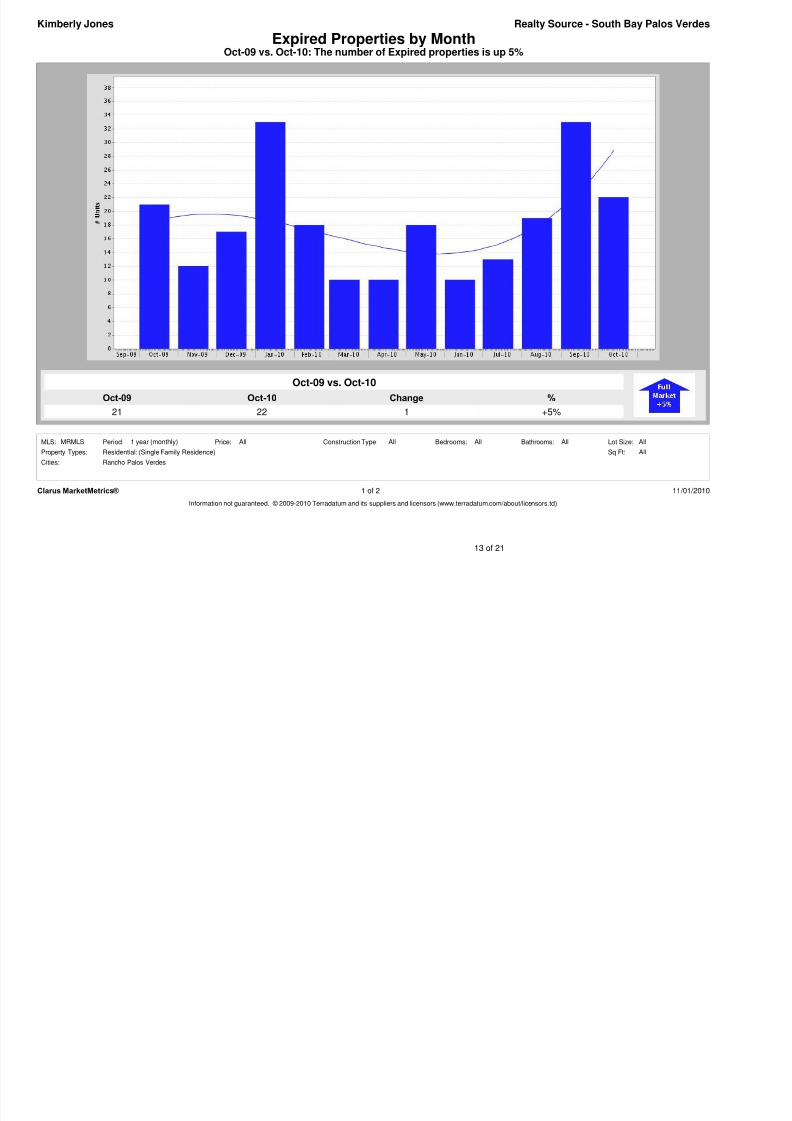
Oct-10
22
Oct-09
21
%
+5%
Change
1
Oct-09 vs. Oct-10: The number of Expired properties is up 5%Expired Properties by Month
Realty Source - South Bay Palos Verdes
Oct-09 vs. Oct-10
Kimberly Jones
Clarus MarketMetrics® 1 of 2 11/01/2010
Information not guaranteed. © 2009-2010 Terradatum and its suppliers and licensors (www.terradatum.com/about/licensors.td).
AllBathrooms:MLS: AllAll
Sq Ft:
Rancho Palos Verdes
Residential: (Single Family Residence)
Period: All All
Property Types:
Cities:
All
Construction Type:Price: Lot Size:Bedrooms:1 year (monthly)MRMLS
13 of 21
8/8/2019 Rancho Palos Verdes Oct '10 Report
http://slidepdf.com/reader/full/rancho-palos-verdes-oct-10-report 14/21
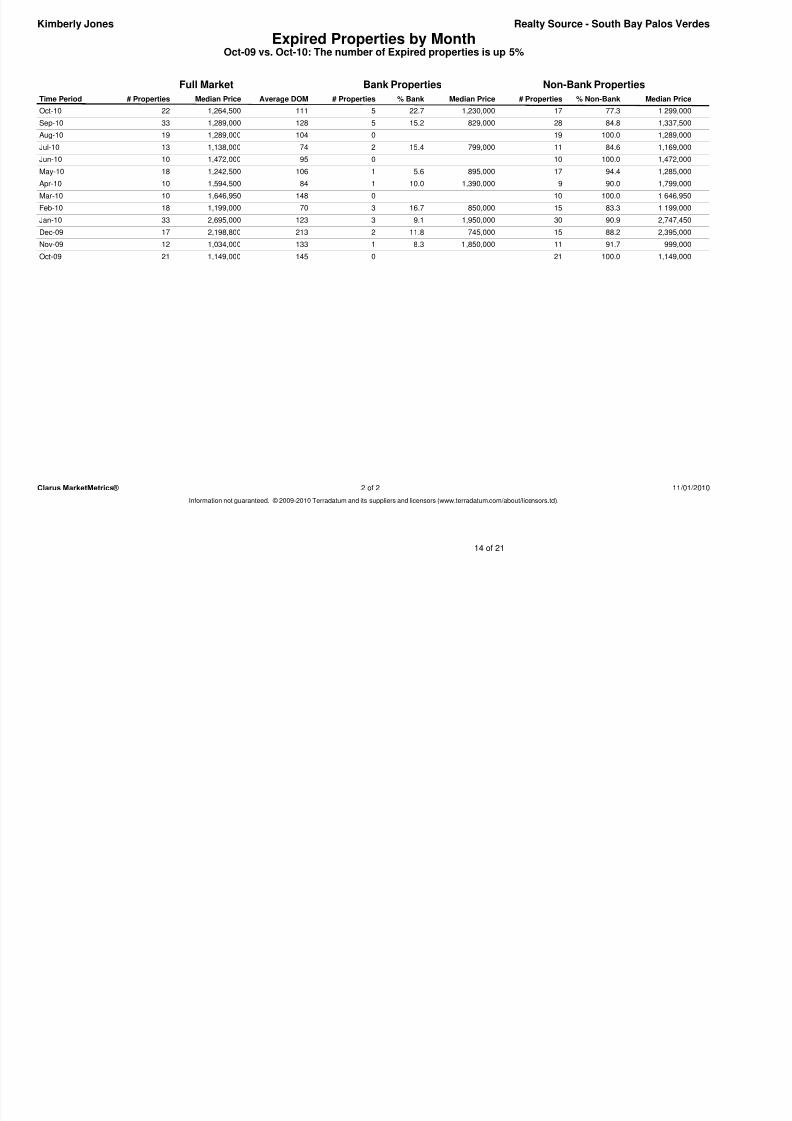
Expired Properties by MonthOct-09 vs. Oct-10: The number of Expired properties is up 5%
Realty Source - South Bay Palos VerdesKimberly Jones
Time Period Median Price# Properties Average DOM
Full Market
# Properties % Bank Median Price Median Price# Properties
Bank Properties
% Non-Bank
Non-Bank Properties
Oct-10 1,264,50022 111 5 22.7 1,230,000 17 77.3 1,299,000
Sep-10 1,289,00033 128 5 15.2 829,000 28 84.8 1,337,500
Aug-10 1,289,00019 104 0 19 100.0 1,289,000
Jul-10 1,138,00013 74 2 15.4 799,000 11 84.6 1,169,000
Jun-10 1,472,00010 95 0 10 100.0 1,472,000
May-10 1,242,50018 106 1 5.6 895,000 17 94.4 1,285,000
Apr-10 1,594,50010 84 1 10.0 1,390,000 9 90.0 1,799,000
Mar-10 1,646,95010 148 0 10 100.0 1,646,950Feb-10 1,199,00018 70 3 16.7 850,000 15 83.3 1,199,000
Jan-10 2,695,00033 123 3 9.1 1,950,000 30 90.9 2,747,450
Dec-09 2,198,80017 213 2 11.8 745,000 15 88.2 2,395,000
Nov-09 1,034,00012 133 1 8.3 1,850,000 11 91.7 999,000
Oct-09 1,149,00021 145 0 21 100.0 1,149,000
Clarus MarketMetrics® 2 of 2 11/01/2010Information not guaranteed. © 2009-2010 Terradatum and its suppliers and licensors (www.terradatum.com/about/licensors.td).
14 of 21
8/8/2019 Rancho Palos Verdes Oct '10 Report
http://slidepdf.com/reader/full/rancho-palos-verdes-oct-10-report 15/21
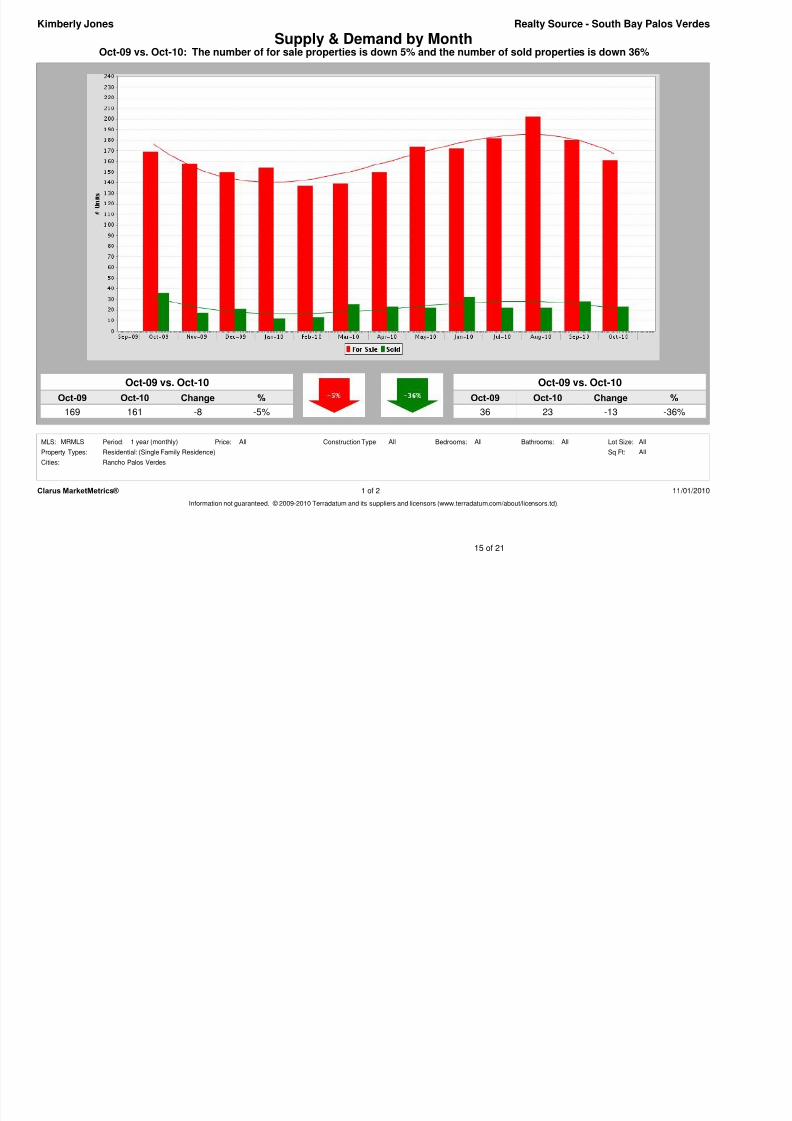
Oct-09 vs. Oct-10: The number of for sale properties is down 5% and the number of sold properties is down 36%
Realty Source - South Bay Palos Verdes
Oct-09 vs. Oct-10
169 -5%
Kimberly Jones
161
Oct-10
Supply & Demand by Month
ChangeOct-09 %
-8
Oct-09 Oct-10 %
36 -36%
Oct-09 vs. Oct-10
23
Change
-13
Clarus MarketMetrics® 1 of 2 11/01/2010Information not guaranteed. © 2009-2010 Terradatum and its suppliers and licensors (www.terradatum.com/about/licensors.td).
AllBathrooms:MLS: AllAll
Sq Ft:
Rancho Palos Verdes
Residential: (Single Family Residence)
Period: All All
Property Types:
Cities:
All
Construction Type:Price: Lot Size:Bedrooms:1 year (monthly)MRMLS
15 of 21
8/8/2019 Rancho Palos Verdes Oct '10 Report
http://slidepdf.com/reader/full/rancho-palos-verdes-oct-10-report 16/21
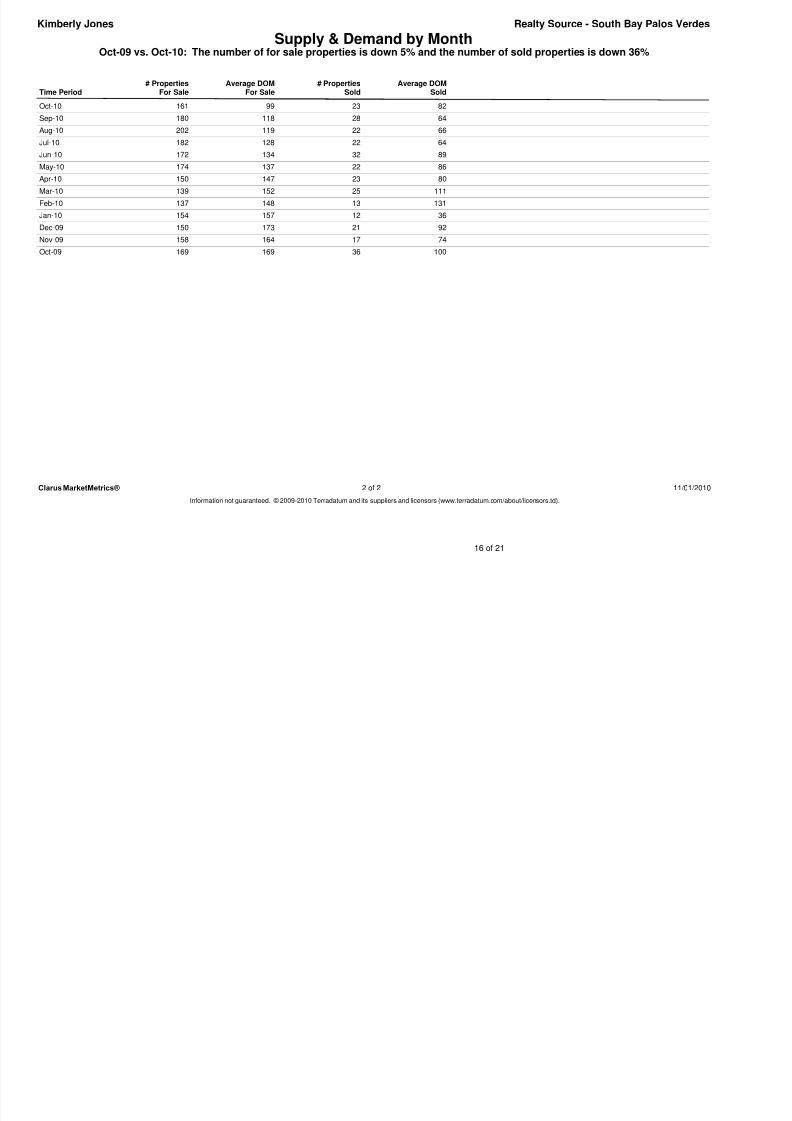
Supply & Demand by MonthOct-09 vs. Oct-10: The number of for sale properties is down 5% and the number of sold properties is down 36%
Kimberly Jones Realty Source - South Bay Palos Verdes
Time Period For SaleFor Sale SoldSold# Properties Average DOM Average DOM# Properties
Oct-10 99 82161 23
Sep-10 118 64180 28
Aug-10 119 66202 22
Jul-10 128 64182 22
Jun-10 134 89172 32
May-10 137 86174 22
Apr-10 147 80150 23
Mar-10 152 111139 25
Feb-10 148 131137 13
Jan-10 157 36154 12
Dec-09 173 92150 21
Nov-09 164 74158 17
Oct-09 169 100169 36
Clarus MarketMetrics® 2 of 2 11/01/2010Information not guaranteed. © 2009-2010 Terradatum and its suppliers and licensors (www.terradatum.com/about/licensors.td).
16 of 21
R lt S S th B P l V dKi b l J
8/8/2019 Rancho Palos Verdes Oct '10 Report
http://slidepdf.com/reader/full/rancho-palos-verdes-oct-10-report 17/21
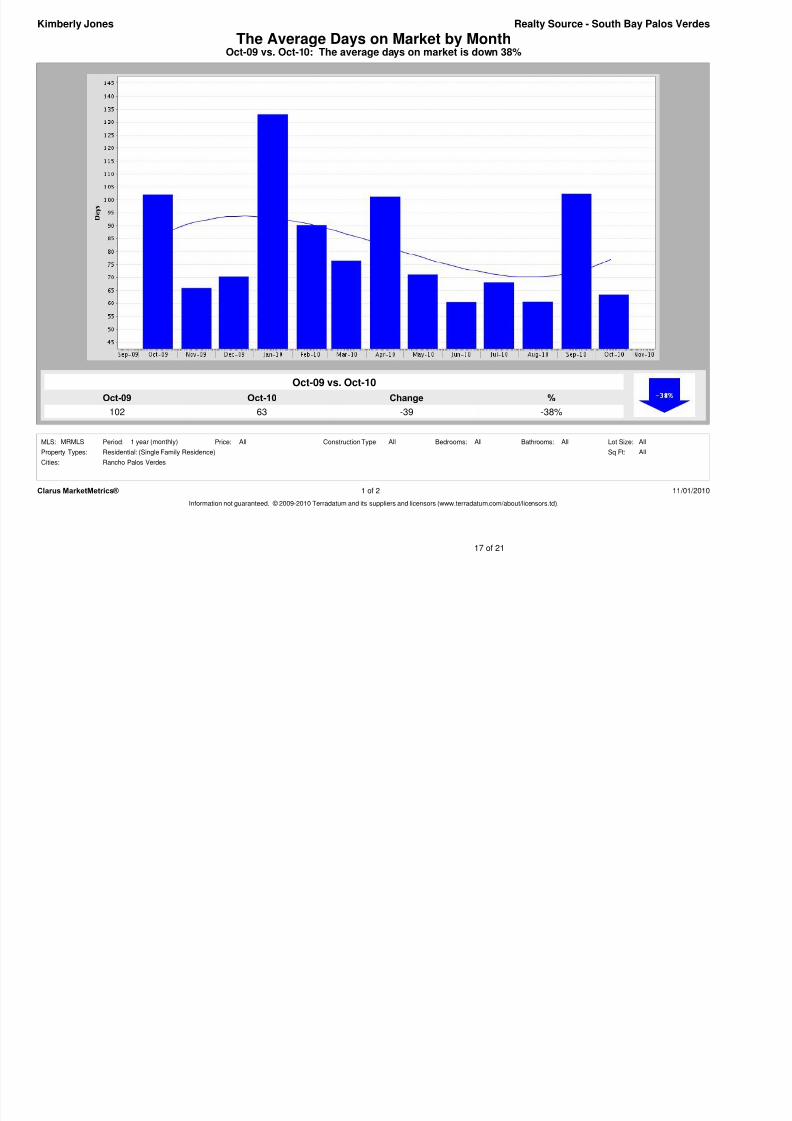
Oct-10
63
Oct-09
102
%
-38%
Change
-39
Oct-09 vs. Oct-10: The average days on market is down 38%The Average Days on Market by Month
Realty Source - South Bay Palos Verdes
Oct-09 vs. Oct-10
Kimberly Jones
Clarus MarketMetrics® 1 of 2 11/01/2010Information not guaranteed. © 2009-2010 Terradatum and its suppliers and licensors (www.terradatum.com/about/licensors.td).
AllBathrooms:MLS: AllAll
Sq Ft:
Rancho Palos Verdes
Residential: (Single Family Residence)
Period: All All
Property Types:
Cities:
All
Construction Type:Price: Lot Size:Bedrooms:1 year (monthly)MRMLS
17 of 21
Realty Source South Bay Palos VerdesKimberly Jones
8/8/2019 Rancho Palos Verdes Oct '10 Report
http://slidepdf.com/reader/full/rancho-palos-verdes-oct-10-report 18/21
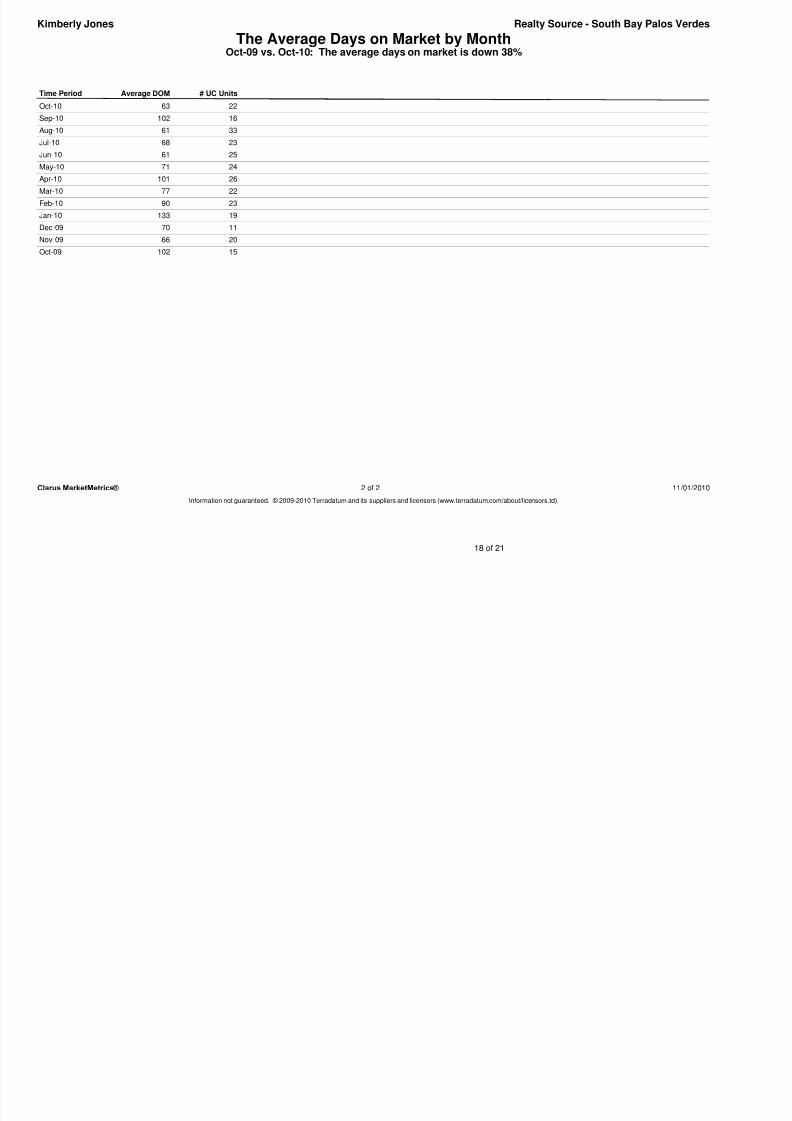
The Average Days on Market by MonthOct-09 vs. Oct-10: The average days on market is down 38%
Realty Source - South Bay Palos VerdesKimberly Jones
Time Period # UC UnitsAverage DOM
Oct-10 2263
Sep-10 16102
Aug-10 3361
Jul-10 2368
Jun-10 2561
May-10 2471
Apr-10 26101
Mar-10 2277
Feb-10 2390
Jan-10 19133
Dec-09 1170
Nov-09 2066
Oct-09 15102
Clarus MarketMetrics® 2 of 2 11/01/2010Information not guaranteed. © 2009-2010 Terradatum and its suppliers and licensors (www.terradatum.com/about/licensors.td).
18 of 21
Realty Source South Bay Palos VerdesKimberly Jones
8/8/2019 Rancho Palos Verdes Oct '10 Report
http://slidepdf.com/reader/full/rancho-palos-verdes-oct-10-report 19/21
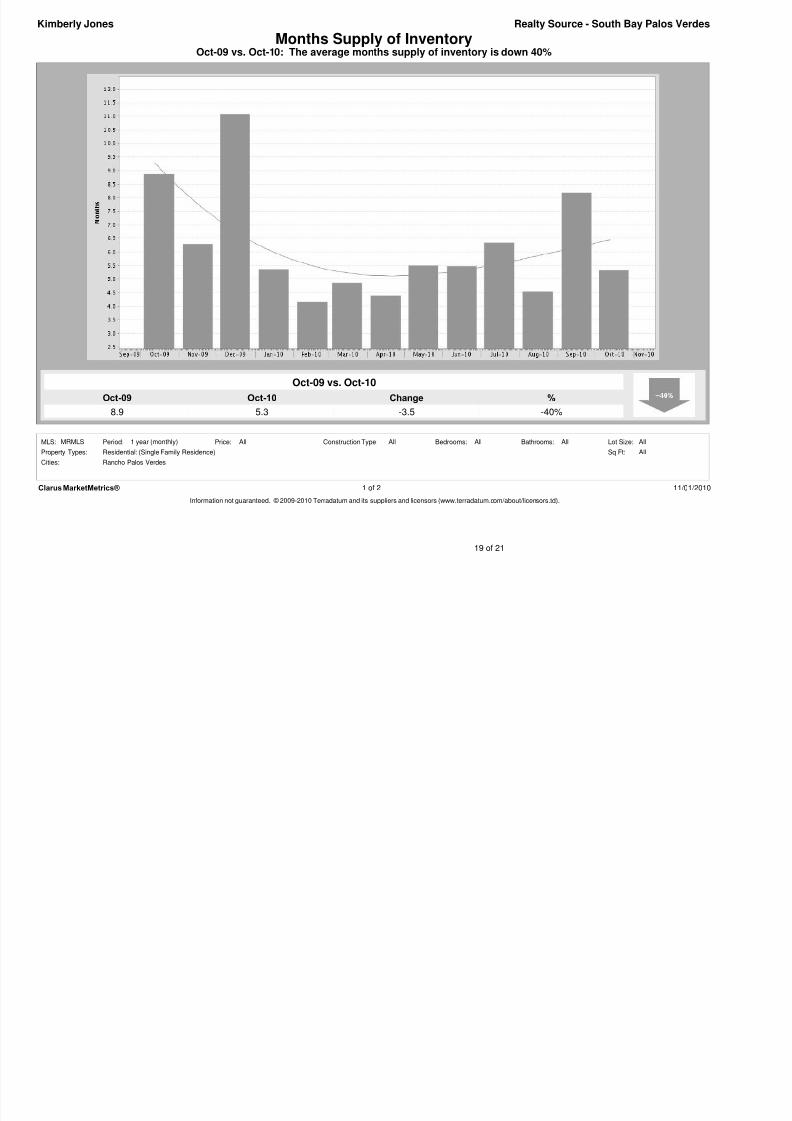
Oct-09 vs. Oct-10: The average months supply of inventory is down 40%
Realty Source - South Bay Palos Verdes
Oct-09 vs. Oct-10
8.9 -40%
Kimberly Jones
5.3
Oct-10
Months Supply of Inventory
ChangeOct-09 %
-3.5
Clarus MarketMetrics® 1 of 2 11/01/2010Information not guaranteed. © 2009-2010 Terradatum and its suppliers and licensors (www.terradatum.com/about/licensors.td).
AllBathrooms:MLS: AllAll
Sq Ft:
Rancho Palos Verdes
Residential: (Single Family Residence)
Period: All All
Property Types:
Cities:
All
Construction Type:Price: Lot Size:Bedrooms:1 year (monthly)MRMLS
19 of 21
Kimberly Jones Realty Source - South Bay Palos Verdes
8/8/2019 Rancho Palos Verdes Oct '10 Report
http://slidepdf.com/reader/full/rancho-palos-verdes-oct-10-report 20/21
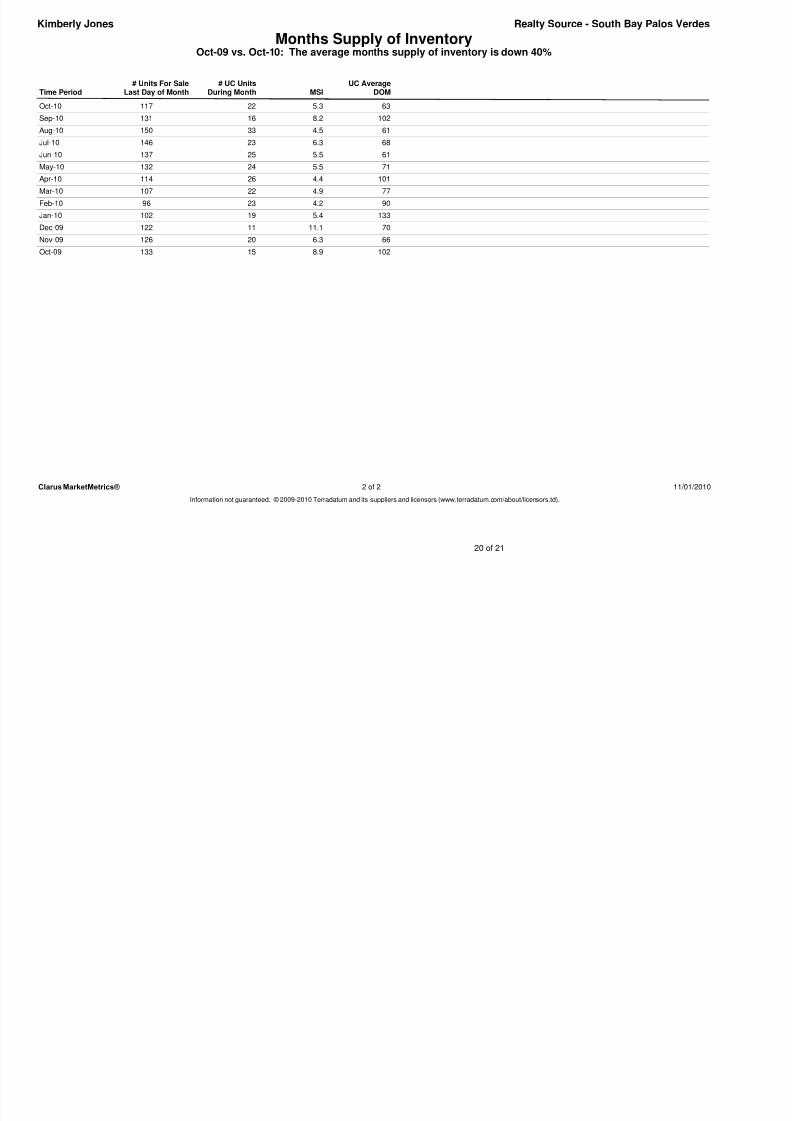
Months Supply of InventoryOct-09 vs. Oct-10: The average months supply of inventory is down 40%
Kimberly Jones Realty Source - South Bay Palos Verdes
Time Period During MonthLast Day of Month DOMMSI# Units For Sale # UC Units UC Average
Oct-10 22 63117 5.3
Sep-10 16 102131 8.2
Aug-10 33 61150 4.5
Jul-10 23 68146 6.3
Jun-10 25 61137 5.5
May-10 24 71132 5.5
Apr-10 26 101114 4.4
Mar-10 22 77107 4.9
Feb-10 23 9096 4.2
Jan-10 19 133102 5.4
Dec-09 11 70122 11.1
Nov-09 20 66126 6.3
Oct-09 15 102133 8.9
Clarus MarketMetrics® 2 of 2 11/01/2010
Information not guaranteed. © 2009-2010 Terradatum and its suppliers and licensors (www.terradatum.com/about/licensors.td).
20 of 21

8/8/2019 Rancho Palos Verdes Oct '10 Report
http://slidepdf.com/reader/full/rancho-palos-verdes-oct-10-report 21/21
11/01/2010Clarus MarketMetrics®
Information not guaranteed. © 2009-2010 Terradatum and its suppliers and licensors (www.terradatum.com/about/licensors.td).
Kimberly JonesRealty Source - South Bay Palos Verdes
Market Dynamics
21 of 21