Embed Size (px)
Citation preview

continued on page 6
for State & Local Government Fall 2015
Esri News
Few cities are ever prepared for a crisis such as a plane crash. But when a small, single-engine plane crashed into an empty field in Rancho Cucamonga, California, the city was able to imme-diately respond. Thanks to geographic information system (GIS) technology and the city’s commitment to act as a smarter community, staff responses to incidents, both routine and unexpected, have become more coordinated and effective. The ability to quickly react to events is a central part of Rancho Cucamonga’s operational philosophy. After years of using legacy workflows with paper notes and disjointed spreadsheets, city leader-ship embraced GIS technology as a way to become more informed, connected, and responsive. The city equipped its field employees with apps and data that could be accessed from mobile devices. Using apps like Collector for ArcGIS that pull data from the city’s ArcGIS Online portal, field staff can now document and log cases directly from the field. The city’s sidewalk inspection team uses Collector for ArcGIS on iPads to identify and repair damaged sidewalks. When staff members locate a damaged sidewalk during daily inspection, they check their mobile GIS app to see if the
Rancho Cucamonga Shines as Smarter, Responsive Community
Esri Software• Collector for ArcGIS• ArcGIS Online• ArcGIS API for JavaScript
sidewalk has already been flagged for repair. If it hasn’t, they use Collector for ArcGIS to add the incident to the map, document its condition, and upload a picture of the damage. The repair team then receives a notification and navigates to the sidewalk’s precise GPS location using the mobile GIS app. Teams now spend more time in the field identifying and repairing assets via a live map, and less time in the office searching for the next case. The city’s sidewalk inspection team is just one of several groups that now
capture and stream live data from the field. With fir department, police, and other city employees acting as live infor-mation sensors, the GIS team compiled data streams into a common portal. Using ArcGIS API for JavaScript, the team created the Team RC app, which provides a live operations dashboard for city personnel. From mobile devices or computers, staff can access layers of live data about sidewalk conditions; calls for fire service; and reports of speeding, downed trees, code violations, and more.
City leadership can quickly see recent calls for fire service as well as information about the responding fire crew.

2 Esri News for State & Local Government Fall 2015
Fall 2015
The information contained in this document is the exclusive property of Esri. This work is protected under United States copyright law and other international copyright treaties and conventions. Esri grants proposal recipient the right to internally redistribute this document to proposal recipient’s management and staff on a need-to-know basis, so long as proposal recipient does not remove or obscure any Esri or its licensors’ patent, copyright, trademark, or proprietary rights notices contained in or affixed to this document. No part of this work may be reproduced or transmitted to third parties (except for consultants under a confidentiality obligation who are involved in the proposal evaluation process) in any form or by any means, electronic or mechanical, including photocopying and recording, or by any information storage or retrieval system, except as expressly permitted in writing by Esri. All requests should be sent to Attention: Contracts and Legal Services Manager, Esri, 380 New York Street, Redlands, CA 92373-8100 USA.
The information contained in this document is subject to change without notice.
@esri.com, 3D Analyst, ACORN, Address Coder, ADF, AML, ArcAtlas, ArcCAD, ArcCatalog, ArcCOGO, ArcData, ArcDoc, ArcEdit, ArcEditor, ArcEurope, ArcExplorer, ArcExpress, ArcGIS, arcgis.com, ArcGlobe, ArcGrid, ArcIMS, ARC/INFO, ArcInfo, ArcInfo Librarian, ArcLessons, ArcLocation, ArcLogistics, ArcMap, ArcNetwork, ArcNews, ArcObjects, ArcOpen, ArcPad, ArcPlot, ArcPress, ArcPy, ArcQuest, ArcReader, ArcScan, ArcScene, ArcSchool, ArcScripts, ArcSDE, ArcSdl, ArcSketch, ArcStorm, ArcSurvey, ArcTIN, ArcToolbox, ArcTools, ArcUSA, ArcUser, ArcView, ArcVoyager, ArcWatch, ArcWeb, ArcWorld, ArcXML, Atlas GIS, AtlasWare, Avenue, BAO, Business Analyst, Business Analyst Online, BusinessMAP, CityEngine, Community, Community Analyst, CommunityInfo, Community Maps, Database Integrator, DBI Kit, EDN, Esri, esri.com, Esri—Team GIS, Esri—The GIS Company, Esri—The GIS People, Esri—The GIS Software Leader, FormEdit, GeoCollector, GeoEnrichment, GeoEvent, Geographic Design System, Geography Matters, Geography Network, geographynetwork.com, Geoloqi, GeoPlanner, Geoportal, Geotrigger, GIS by Esri, gis.com, GISData Server, GIS Day, gisday.com, GIS for Everyone, Insights, JTX, MapIt, Maplex, MapObjects, MapStudio, ModelBuilder, MOLE, MPS—Atlas, PLTS, Rent-a-Tech, SDE, SML, Sourcebook•America, SpatiaLABS, Spatial Database Engine, Story Map Countdown, Story Map Journal, Story Map Playlist, Story Map Shortlist, Story Map Spyglass, Story Map Swipe, Story Map Tabbed, Story Map Tour, StreetMap, Tapestry, the ARC/INFO logo, the ArcGIS Explorer logo, the ArcGIS logo, the ArcPad logo, the Esri globe logo, the Esri Press logo, The Geographic Advantage, The Geographic Approach, the GIS Day logo, the MapIt logo, The World’s Leading Desktop GIS, Water Writes, and Your Personal Geographic Information System are trademarks, service marks, or registered marks of Esri in the United States, the European Community, or certain other jurisdictions. CityEngine is a registered trademark of Esri R&D Center Zurich AG and is distributed under license by Esri.
Other companies and products or services mentioned herein may be trademarks, service marks, or registered marks of their respective mark owners.
Esri News for State & Local Government is a publication of the State and Local Government Solutions Group of Esri.To contact the Esri Desktop Order Center, call 1-800-447-9778 within the United States or 909-793-2853, ext. 1-1235, outside the United States.
Visit the Esri website at esri.com.
View Esri News for State & Local Government online at esri.com/statelocalnews, or scan the QR Code below with your smartphone.
Advertise with UsE-mail [email protected].
Submit ContentTo submit articles for publication in Esri News for State & Local Government, contact Christopher Thomas at [email protected] or Robby Deming at [email protected].
Manage Your SubscriptionTo subscribe, unsubscribe, or make changes to your Esri subscriptions, please go to esri.com/updates.
If outside the United States, please contact your international distributor to subscribe, unsubscribe, or change your address. For a directory of distributors, visit esri.com/distributors.
Circulation ServicesFor back issues, missed issues, and other circulation services, e-mail [email protected]; call 909-793-2853, ext. 2778; or fax 909-798-0560.
Contents1 Rancho Cucamonga Shines as Smarter, Responsive
Community
3 Every Gallon Counts
6 A Simple and Ultrarugged Solution for Collecting GIS Field Data
7 Executives Discuss Smart Communities Solutions
10 GIS Empowers Community Engagement
12 Land Records Investigation Gets Bionic Upgrade in Minnesota
14 Getting the Results You Want from GIS
Copyright © 2015 Esri.All rights reserved. Printed in the United States of America.

3Fall 2015 esri.com/localgov
In parched California, where water regulations have understandably become more stringent, public works departments are starting to map ir-rigation data to better evaluate water expenditure—no guesswork allowed. Because the first prerequisite of smart mapping is having data that’s worth expressing visually, the Fontana Public Works Department (FPWD) decided to investigate its citywide sprinkler network, visiting each meter, valve, and nozzle to properly record its associated informa-tion. That data would then be converted into a GIS model and displayed in maps to inform Fontana’s irrigation manage-ment decisions. After eight years of meticulous data hygiene, Fontana now has full command over its water output by mapping sprin-kler performance.
Feeding LucityEstablished during the Eisenhower administration, Fontana’s irrigation network has been modified as the city’s turf area has grown. Because those physi-cal changes weren’t always accurately recorded in the field, errors gradually accumulated in the city’s database. That erroneous representation of the city’s
Every Gallon CountsSmart Mapping Optimizes Civic Irrigation in Fontana, California
Esri Technology• ArcGIS for Desktop• ArcGIS Online
water network made it impossible to generate a useful picture for study and response. Rogelio Matta, senior adminis-trative analyst for FPWD, knew that civic irrigation could be better understood if the back-end information was fixed and then fed into Lucity, the department’s maintenance management system. “Lucity interfaces with ArcGIS for map-ping our department data [e.g., streets, fleets, parks] and allows us to communi-cate tabular information visually,” says Matta. “The visual element is key to the communication, since no decision
maker has the time to pore over stacks of spreadsheets.” FPWD depicts all its irrigation assets in those maps and generates work orders from them. Having the entire work his-tory for each piece gives staff the ideal environment to keep track of all of the department’s asset maintenance activity.
A Billion GallonsConserving civic water output entails knowing every sprinkler’s performance. Now that FPWD staff had fixed the data, they endeavored to determine each sprinkler zone’s output, then correct any overwatering issues that arose. To begin correcting, staff crunched num-bers to arrive at the evapotranspiration rate—the rate at which dispensed water evaporates from a given area, which determines the amount of water needed for replenishment. “We have more than 24 million square feet of irrigated landscape that requires about 58 inches of precipitation annually,”
Sufficiently watering civic turf during a wicked drought can’t be done without a reliable base of irrigation information to map and study. In 2007, the folks at the FPWD got a head start on updating their water network data. FPWD now evangelizes the benefits of data hygiene and applied geography to anyone who’ll listen.
continued on page 4
The city’s monitoring system has brought more meters into compliance in just a year, with the majority of meters showing usage to be within budget (green dots indicate usage within budget and red dots represent usage over budget).

4 Esri News for State & Local Government Fall 2015
says Matta. “That’s the equivalent of a billion gallons of water.” Controlling the system pieces to precisely sprinkle the landscape would be key to not exceeding one billion gallons. Those pieces include control devices, such as timers that tell the sprinklers how long to run, and weather stations that regulate water output according to the day’s temperature, humidity, and precipitation. Fontana has three weather stations that communicate with 480 automated timers throughout the city. “If something’s wrong in the system, flow sensors tell the computer how long the sprinklers should run,” says Matta. “If [they run] for longer than that, [the sen-sors send] back that information to the computer to alert technicians to investi-gate the problem and fix it.”
Mapping the MetricsNow armed with solid data, FPWD GIS administrator Joe Field could geo-process the sprinkler information show-ing the monthly usage rate and map it
in ArcGIS. For every area within Fontana sprayed by a subsystem of sprinklers, such as medians, parks, and community centers, a map could be generated, populated with red, green, and blue dots denoting each nozzle’s metric. “If it’s red, it’s overwatering. If it’s green, it’s within target. If it’s blue, it’s underwatering,” says Matta. “That was our goal from the beginning: reading the story of the systems without our eyes glazing over from all the numbers and decimals.” Now FPWD can easily compare its target water budget to actual consump-tion. Workers armed with tablets in the field can view the maps of each as-signed area and respond accordingly to what the dots indicate. The live update capability of ArcGIS gives workers the confidence that they’re responding to the current condition of the network and not to a situation that has worsened since the last update.
Every Gallon Counts continued from page 3
Empirical Returns Although not all the numbers are in, results so far have been impressive. Fontana’s map-based investigation of its water expenditure revealed that at least one-fifth of its irrigated land-scape (100 acres) had exceeded the target annual budget of $700,000 by $300,000—all because of the inef-ficiency of spreadsheet-dependent remediation. Visualization now translates Excel tables into actionable information to meet regulations, saving the depart-ment water, time, and money. With experts predicting that the California drought will extend into the 2020s, water managers would be wise to begin conserving as soon as possible, starting with getting their irrigation data in order. Fortunately, most public works departments have GIS to make sense of those datasets once they’re cleaned. “There’s nothing quite as exhilarating as preempting a lengthy audit,” says Matta. “Presenting solid metrics is the best way to do that.”
Mapping dashboards help Fontana monitor water use and make quick, informed decisions to ensure compliance with California water-use regulations.

You know the power of Esri® GIS to improve government decisions and planning. When you add OnBase enterprise content management, vital information in documents, audio, video and other content files is easily accessible from your GIS applications – which means you have the whole picture, in the office and in the field.
Discover how you can use OnBase and Esri to make smarter decisions and achieve better results.
Learn More at OnBase.com/Esri »
Is something missing from your GIS applications?
6 Esri News for State & Local Government Fall 2015
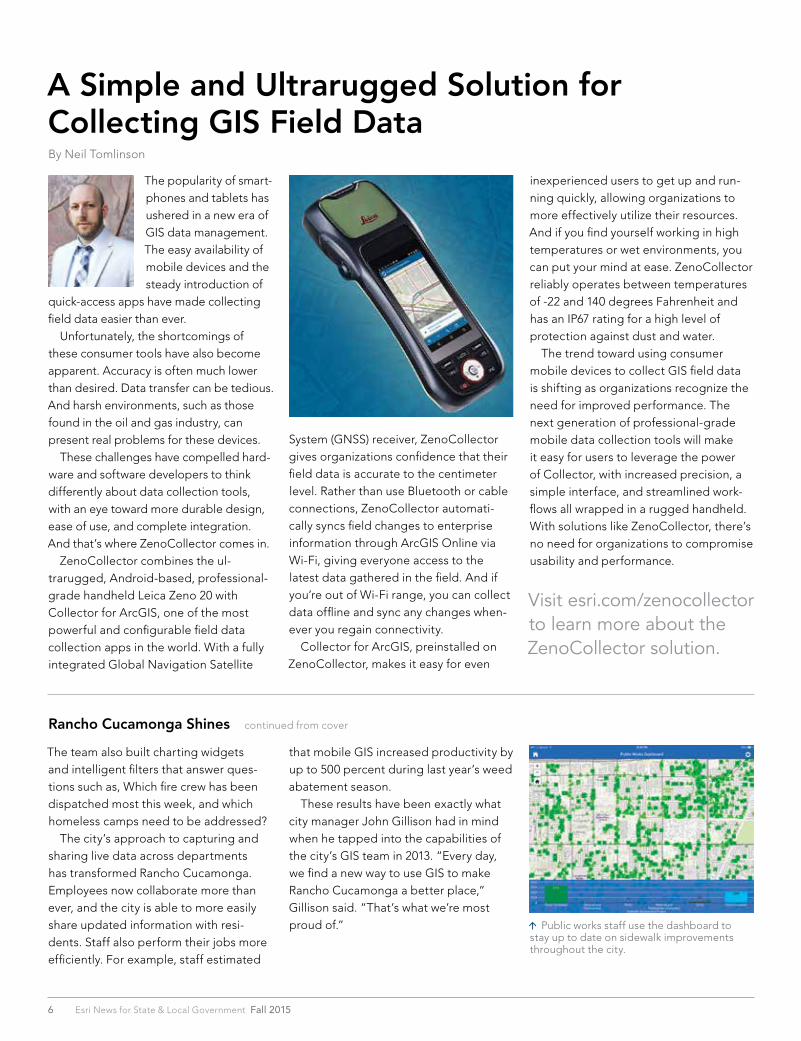
The popularity of smart-phones and tablets has ushered in a new era of GIS data management. The easy availability of mobile devices and the steady introduction of
quick-access apps have made collecting field data easier than ever. Unfortunately, the shortcomings of these consumer tools have also become apparent. Accuracy is often much lower than desired. Data transfer can be tedious. And harsh environments, such as those found in the oil and gas industry, can present real problems for these devices. These challenges have compelled hard-ware and software developers to think differently about data collection tools, with an eye toward more durable design, ease of use, and complete integration. And that’s where ZenoCollector comes in. ZenoCollector combines the ul-trarugged, Android-based, professional-grade handheld Leica Zeno 20 with Collector for ArcGIS, one of the most powerful and configurable field data collection apps in the world. With a fully integrated Global Navigation Satellite
A Simple and Ultrarugged Solution for Collecting GIS Field DataBy Neil Tomlinson
System (GNSS) receiver, ZenoCollector gives organizations confidence that their field data is accurate to the centimeter level. Rather than use Bluetooth or cable connections, ZenoCollector automati-cally syncs field changes to enterprise information through ArcGIS Online via Wi-Fi, giving everyone access to the latest data gathered in the field. And if you’re out of Wi-Fi range, you can collect data offline and sync any changes when-ever you regain connectivity. Collector for ArcGIS, preinstalled on ZenoCollector, makes it easy for even
inexperienced users to get up and run-ning quickly, allowing organizations to more effectively utilize their resources. And if you find yourself working in high temperatures or wet environments, you can put your mind at ease. ZenoCollector reliably operates between temperatures of -22 and 140 degrees Fahrenheit and has an IP67 rating for a high level of protection against dust and water. The trend toward using consumer mobile devices to collect GIS field data is shifting as organizations recognize the need for improved performance. The next generation of professional-grade mobile data collection tools will make it easy for users to leverage the power of Collector, with increased precision, a simple interface, and streamlined work-flows all wrapped in a rugged handheld. With solutions like ZenoCollector, there’s no need for organizations to compromise usability and performance.
Visit esri.com/zenocollector to learn more about the ZenoCollector solution.
The team also built charting widgets and intelligent filters that answer ques-tions such as, Which fire crew has been dispatched most this week, and which homeless camps need to be addressed? The city’s approach to capturing and sharing live data across departments has transformed Rancho Cucamonga. Employees now collaborate more than ever, and the city is able to more easily share updated information with resi-dents. Staff also perform their jobs more efficiently. For example, staff estimated
Rancho Cucamonga Shines continued from cover
that mobile GIS increased productivity by up to 500 percent during last year’s weed abatement season. These results have been exactly what city manager John Gillison had in mind when he tapped into the capabilities of the city’s GIS team in 2013. “Every day, we find a new way to use GIS to make Rancho Cucamonga a better place,” Gillison said. “That’s what we’re most proud of.” Public works staff use the dashboard to
stay up to date on sidewalk improvements throughout the city.

7Fall 2015 esri.com/localgov
In May 2015, the International City/County Management Association (ICMA) and Esri invited a small group of local government executives to Esri’s Redlands campus to participate in a whiteboard exercise that would capture their ideas on how best to develop strategies for de-livering services to citizens, fostering col-laboration with other organizations, and measuring performance. This carefully selected group of professionals repre-sented communities large and small from across the United States. Whiteboard ex-ercises are informal events in a think tank-like setting where executives can learn about technology trends and discuss the needs of their organizations. In recent years, executives have dealt with reduced budgets and staffing, the legacy of the recent recession. In many cases, the resources and funds allocated to governments have shifted. Policy changes, new legislation, and changes in the tax base mean that resources are no longer sufficient to pursue large pro-jects. In practical terms, this means that many jurisdictions continue using legacy business systems with less-than-optimal workflows.
Executives Discuss Smart Communities Solutions
At the same time, these jurisdictions must deal with a growing list of issues, many related to an aging population and deteriorating infrastructure as well as a citi-zenery that expects additional social ser-vices for groups such as veterans and those with mental health needs. Citizens also expect those services to be conveniently accessible via the web and smartphones. This had led many local governments to embrace a smart communities approach: using digital technologies to manage resources more effectively and engage citizens. GIS plays a pivotal role in ena-bling the transformation of a community of any size into a smart community.
Partnering with CommunitiesOver the last several years, ICMA and Esri have cohosted executive white board exercises as a way to better understand the challenges executives face and help Esri develop smart community solu-tions that address these needs. These exercises nominally focus on a specific topic. The most recent session zeroed in on health and human services, an area of growing concern for governments as the population ages.
However, government’s role in health and human services delivery can’t be neatly parsed from the other types of ser-vices governments furnish. Consequently, the initial discussion revolved around the much broader topic of how to commu-nicate with citizens in a simple way and collaborate with other organizations. That sparked wide-ranging conversations that occupied the morning session. The consensus was that phones, specifi-cally smartphones, offer the single best method to reach the people who need services but may not have traditional com-puter access or even a mailing address. According to the Pew Research Internet and American Life Project undertaken in 2014, 90 percent of all American adults own a cell phone, and of those, 58 percent have smartphones. These statistics span virtually all income levels. This reality has been acknowledged by some jurisdictions that give out basic cell phones to home-less people because it was found to be the only effective way to communicate with this population.
Michael Penny, city manager of Littleton, Colorado; Bonnie Svrcek, deputy city manager for the City of Lynchburg, Virginia; and Cory Fleming, program director for ICMA, participating in a whiteboard exercise discussion.
continued on page 8
In a brainstorming session, the group listed apps they would like to have developed.

8 Esri News for State & Local Government Fall 2015
Beyond agreeing that apps are an ef-fective mechanism for delivering infor-mation, several participants identified a fundamental problem governments have when communicating with citizens: most local governments require citizens to understand government organizational structure to determine which depart-ment or agency can supply what they need. Michael Penny, the city manager of Littleton, Colorado, and a veteran of Esri
just an answer. Technology is helping to change the nature of public meet-ings from the comments of a handful of citizens who show up at city hall to an ongoing discussion online that can include input from many citizens. GIS applications such as GeoPlanner for ArcGIS can facilitate these kinds of interactions. In fact, GIS is almost always an aspect of citizencentric apps because informa-tion about the location of services is most useful when placed in a geographic context. People don’t always go to places in their own counties but instead go to the nearest location for services. Frequently, they don’t know or care about jurisdictional bounda-ries. They just want their needs met as quickly and simply as possible.
This jurisdictional indifference drives collaboration and, by extension, inter-operability. By working together, local governments, agencies, and nonprofits can provide better, cost-effective service by more intelligently locating service centers. Sharing data on com-munity resources with nonprofits and other entities not only helps get informa-tion out to citizens but can also enhance other programs, efforts, and research and lead to collaboration. However, unlocking data and form-ing partnerships can be challenging. As several participants noted, some open data solutions are far from user-friendly and “are basically for geeks.” Pushing data to the cloud primarily to eliminate local infrastructure requirements and reduce costs without any real plan for making it usable does not enable data sharing or app development with that data. From a developer standpoint, disparate cloud sources of data that have not been organ-ized with openness in mind can be, at best, difficult to use and, at worst, nearly useless.
Executives Discuss Smart Communities Solutions continued from page 7
whiteboard exercises, summed the situ-ation up by saying, “We did not design ourselves around apps.” To be effective, public-facing apps should be usercentric in the manner of Yelp, Pinterest, and other popular con-sumer apps. Apps should be about what the citizen wants and not what is most expedient for government. “We don’t need to regurgitate the same information in yet another format,” said Penny. John Salomone, the town manager for the Town of Newington, Connecticut, and Veronica Ferguson, an administra-tor for Sonoma County, California, also noted that—increasingly—the character of communication with the public is changing. Citizens, particularly younger ones, want a dialog with government, not
This app, built using Web AppBuilder for ArcGIS, provides current information on the status of water and sewer projects for Washington Suburban Sanitary Commission (WSSC).
This map, created by Sarah Haynes, the community outreach and development coordinator for NMCDC, provides information on more than 65,000 women and babies covered by the Supplemental Nutrition Assistance Program for Women, Infants, and Children program in New Mexico.

9Fall 2015 esri.com/localgov
However, ArcGIS Online—with its online hosting, mapping capabilities, and apps and templates—facilitates data sharing without requiring a high level of technical expertise. ArcGIS Open Data, a functionality built into ArcGIS Online, easily generates a website dedicated to sharing datasets selected from an exist-ing ArcGIS Online or ArcGIS for Server site and automatically updates those datasets, ensuring that the most current data is used. Esri director of government market-ing Christopher Thomas, one of the event moderators, used the success of the New Mexico Community Data Collaborative (NMCDC) as an example of the value of data sharing using ArcGIS Online. This statewide data repository makes its health and human services data available through an ArcGIS Online site that was built entirely using free Esri apps. The site lives up to its motto,
“Building community capacity to move data into action,” by making more than 200 neighborhood-level datasets with more than 1,200 variables avail-able to other agencies, nonprofits, and researchers. During its first few months of opera-tion, there were 56,000 data downloads from the site. Instead of concentrating on developing health apps, NMCDC develops and shares the neighborhood-level data that makes it possible for other government agencies and universities to do research that promotes community assessment, child health, and participa-tory decision making. In addition to supplying data, NMCDC will collaborate with and train users of its data warehouse, offering workshops, consultation services, and assistance to users without requiring payment. Collaborating analysts who are subscrib-ers to the site can upload and store data, make maps and apps, use files shared by others, and copy and modify maps. This example also encouraged continu-ation of a discussion of the characteristics of successful apps. Good apps should be self-service, relevant to the citizen,
unconstrained by jurisdictional bounda-ries, and provide context so the informa-tion can be understood. Great apps should incorporate demographics and/or the user’s profile to provide information that’s tailored to the individual and might even anticipate the user’s needs and sup-port a virtual experience. And Esri Story Map is a great tool for sharing information with citizens and other agencies, whether that information is about the amenities available at local parks or the status of disaster response efforts. Thomas said local governments often run into problems when they hire an outside app developer. These develop-ers do not thoroughly understand the problem they are trying to address. They are not part of government and typically don’t understand the existing business processes or consider the needs of citizens. Esri has been extending the ArcGIS platform to bring app development within the grasp of local government without re-quiring hiring developers, either in-house or on contract. For several years, Esri has been developing solution templates that supply functionality needed for land records, water utilities, public works, fire services, emergency management, law enforcement, planning and development, and elections departments. More than 150 of these configurable apps—some the direct result of feedback obtained from whiteboard sessions—are available at no charge from ArcGIS Online. To provide greater customization, ArcGIS Online and Portal for ArcGIS now include Web AppBuilder for ArcGIS. Using this what-you-see-is-what-you-get wizard environment, nonprogrammers can create custom web mapping applica-tions that run on any device. AppStudio for ArcGIS, currently in beta, is another tool that lets nonprogrammers create apps. It can convert maps into mobile apps for Android, iOS, Windows, Mac OS X, and Linux that run natively on smartphones, tablets, and desktops.
An App Wish ListThe group engaged in a brainstorming ses-sion to identify apps that would improve the delivery of government services and internal government processes. The long wish list included public-facing apps that • Provide captions for hearing disabled
persons attending a city event. • Locate nearby businesses that accept
Supplemental Nutrition Assistance Program (SNAP) cards.
• Apply the Uber model for sharing cars to provide transporation for seniors and disabled persons.
• Provide information on where to get clothes, transitional housing, and other necessities for people leaving jail.
• Locate all nonprofits in a community. • Locate and describe nearby social
services. • Coordinate donations of clothing and
food in response to a disaster. • Show the real-time status of snowplows.
Internal apps were also listed. Most of these apps related to social media by ag-gregating feeds and mapping the interest in specific topics to support officials when dealing with the public. After creating the wish list, apps were prioritized, and three high-priority apps were chosen: an app for capturing and aggregating social media comments, a 211 app for social services, and an app to measure the success of a job placement program. In the last exercise of the day, the group was divided into three teams and each was assigned a priority app. Each group identified the typical user for the app, the information it would provide, the information it would collect, how it would be used, and what would consti-tute a successful outcome. Participants felt that walking through this robust app design process was very valuable. They planned to share the insights they gained with others in their organizations and fellow ICMA members. Intelligently built apps that promote smart community goals help executives make better informed decisions, depart-ments accomplish more, and citizens remain engaged with local government.

10 Esri News for State & Local Government Fall 2015
Have you ever walked through your neighborhood and seen a geyser of water from a broken sprinkler head, or a tree branch lying in the middle of the street, or graffiti on a bus stop shelter, and wondered how you could notify the right people to come and take care of it? It’s a common situation people find themselves in, not only in their neigh-borhood but also in almost any type of community they belong to. Governments, companies, nonprofit or-ganizations, and even loosely connected social groups such as bird watchers and people who like farmers’ markets face similar issues because they’re not set up to gather people’s observations and manage that information in a meaningful way. They lack the tools to facilitate com-munity engagement. Geography can serve as a starting point for building a community engage-ment strategy, and GIS technology can provide the tools to accomplish it. Maps and spatial analytics form a universal translator that allows individuals living and working in communities to build strong, long-lasting relationships with other people simply by sharing geo-graphic information. Here are three ways to get started with community engagement using ArcGIS:
1. Empower your community with crowdsourcing apps.Crowdsourcing is the process of collect-ing volunteered information from people. Given the right tools, they can become your eyes and ears on the ground. But if social media has taught us anything, it’s that when you ask people to volunteer their observations, you may end up with more than you can handle. To avoid information overload, focus on a specific problem or a manageable set of choices.
GIS Empowers Community EngagementGeography Can Serve as a Starting Point for Building Strong, Lasting Relationships with Communities
Surveys are one form of crowdsourcing. Conducted person-to-person or via a website, these can be used to create in-ventories, gather information about peo-ple’s experiences, or take stock of what a community is thinking about certain issues. When combined with geography, surveys can demonstrate how important a place or the surrounding environment is to the matters in question. ArcGIS Online subscribers can create and deploy location-based surveys using the GeoForm template, which gener-ates responsive, web-based forms. For example, an emergency management organization could develop an inventory of medical personnel for disaster prepar-edness activities by asking doctors and nurses to visit the organization’s website and fill out an identification form. GeoForm makes conducting surveys simple and straightforward and gives users a sense of urgency that a communi-ty can understand. The template’s source code can be downloaded on GitHub. The Esri Crowdsource Reporter app template also makes it easy to integrate geography data with important issues. The template, available from ArcGIS
Online (with the source code on GitHub as well), allows developers to configure responsive apps that work on smart-phones, tablets, and desktop browsers to maximize community engagement. The City of Los Angeles, for example, began a concerted water conservation effort, called EveryDrop, to help tackle California’s current serious, decade-long drought. The project’s mission is to pro-vide applications to the public and gov-ernment agencies so they can help curb water waste and promote water conserva-tion. As part of the EveryDrop platform, the city offers a free crowdsourcing app for Apple and Android phones that allows citizens to report the location of water waste. The app also teaches users how to better conserve water. Empowering people to send in their ob-servations is one thing; doing something with the data is another. A critical process for maintaining a crowdsourcing channel is to aggregate the crowdsourced data, analyze it, and then take action. Crowdsource Manager, a companion application to Crowdsource Reporter, helps organizations do just that. It pre-sents data in both map and table formats
Glen Canyon Institute used the Esri Story Map Journal application to create its story map, The Place No One Knew.

11Fall 2015 esri.com/localgov
and includes tools for finding patterns, reviewing details, updating statuses, and assigning responsibilities. This template is also available for free with an ArcGIS Online subscription.
2. Tell stories to your community.Telling people a story that’s relevant to their location is powerful—especially if it’s related to an issue they care about. Storytelling is also a great way to communi-cate with stakeholders inside an organiza-tion, including managers and executives. Giving a narrative form to geographic in-formation impresses it with realistic charac-ter that just doesn’t come across in charts or graphs. Story maps, which combine interactive maps with multimedia content, provide an engaging way to explore data and navigate information nuances. Glen Canyon Institute—a nonprofit that seeks to restore and preserve southern Utah’s Glen Canyon, which was flooded in the 1960s when part of the Colorado River was dammed—has a loyal community of members and people who want to get involved in its conserva-tion projects. One of the ways the insti-tute communicates the importance of its mission is by providing a story map on its website that takes viewers on a virtual tour of the Colorado River, using more than 100 photos of key points of interest.ArcGIS Online subscribers can create and share their stories using Esri Story
Map applications, including Esri Story Map Journal, the app Glen Canyon Institute used. While creating a story map may seem like a daunting task, it is actually just a matter of organizing and presenting the information; the Story Map templates take care of the rest.
3. Use dashboards to help drive your community engagement strategy.Dashboard applications, which con-solidate complicated and often dynamic information into one simple view, are escalating in popularity. That’s because everyone wants to know the status of a project or get minute-by-minute updates on events in progress such as elections or emergency management operations. Dashboards help people absorb infor-mation with just one glance, much like looking at the dashboard of a car. These applications can be specific to project activities or organization assets or can outline the progress of a program as a whole. This makes dashboards especially important for decision makers and other people who need to stay on top of an unfolding situation. They need to know what’s going on and where things are happening—in one look. Geography works well with dashboards. Maps again become the universal transla-tor that helps people orient themselves to the information at hand. However, unlike
crowdsourcing, which can evolve into a long-term dialog between communities, and in contrast to story maps, which can be used to reinforce the scope and com-mitment of one community to another, dashboards get personal and go behind the scenes. They can help organizations monitor and evaluate their community engagement strategies. The Summary Viewer solution template, available with an ArcGIS Online subscrip-tion, can turn a map into a dashboard to report metrics. It summarizes the numeric attributes of features in a speci-fied map layer and displays the ones that appear on the visible area of the map. The summaries can be configured to show the sum, average, minimum, and maximum of specified field values. So, for example, the owner of a chain of retail stores could see all his stores in a given geographic area, plus the total number of employees, the square footage, and the sales amounts for those stores, all on one dashboard.
Everything Rolled into One Community Engagement ProjectIn a more encompassing example, a city is looking to streamline its processes for fixing potholes. It could develop a crowdsourcing app that encourages the community to report potholes on city streets. An operations manager could use the Crowdsource Manager app to organize and validate reports and then assign work appropriately. The city could then put up a public-facing story map that displays the crowdsourced informa-tion and shows the potholes that have been fixed to assure the community that its reports are making a difference. Meanwhile, project stakeholders could use an internal dashboard to stay abreast of how the project is going and what is being accomplished.
Building Apps, Building RelationshipsCommunity engagement initiatives hinge on active listening, participation, and
Summary Viewer is a configurable dashboard for reviewing complex statistics at a glance. continued on page 14

12 Esri News for State & Local Government Fall 2015
St. Louis County, Minnesota, no longer searches for land records the old-school way. Using the Esri platform, its Planning and Community Development and Information Technology departments de-signed a portal that gives staff access to the county’s land records store and digitized maps in a secure environment with simple controls. With the portal, users can get specific documentation in just a few clicks.
Like a GumshoeUntil recently, investigating land records required the Planning and Community Development staff to canvass the large county in northeastern Minnesota, gum-shoe style. “Our records were strewn across 7,000 square miles,” said Darren Jablonsky, deputy director of Planning and Community Development in Duluth, Minnesota. “When we retrieved what we needed, we’d have to manually connect all the property identification numbers and addresses to get the correct informa-tion and relate it to a spatial location.” That typically involved fusing data in paper records and spreadsheets to spatial data. The purpose was to present users with all pertinent land records information about a property within a digital map. The diversity of the collections dizzied the mind: large paper maps, map books, indexes, spreadsheets, desktop- and web-based applications, and imaging systems. Over the years, St. Louis County had amassed a galaxy of land records information. Predictably, long delays were commonplace. St. Louis County’s 1,700 employees bemoaned the slow system not only for its impact on their workflow but also because
Land Records Investigation Gets Bionic Upgrade in Minnesota
Esri Technology• ArcGIS for Desktop• ArcGIS for Server
clients who requested land records had to wait weeks to get information. “Delaying response to the people we serve — not just residents but [also] Realtors, surveyors, engineers, mining companies, nonprofit agencies, and investment firms — didn’t sit well with any of us,” Jablonsky said. “Keeping morale high is important here.” Designing a new GIS-based system to manage and retrieve land records would require support from departmental directors, the St. Louis County Board of Commissioners, and outside consultants.
Portal to the Digital DimensionThe board members and directors led the effort to create the Land Information Portal. After creating a focus group to address all the land- and property-related issues that departments dealt with, the board ap-pointed a team to launch a digital one-stop shop of recorded documents and data that county staff could access. In 2009, the board of commissioners adopted the Land Records Management Plan to establish an enterprise GIS division to direct the devel-opment of the Land Information Portal. First, the county would have to digitize all land documentation for ease of access to the records. To further complicate
matters, all county recorders, assessors, auditors, planners, surveyors, and rights-of-way agents work with multiple types of paper records and documentation, such as photos, quitclaim deeds, and titles. Fortunately, digitization had already been under way throughout the county. “Many of the departments were in the process of converting both paper and microfilm to digital for sharing and integration with their applications,” Jablonsky said. “This made it easier to standardize a single-access method in the portal for retrieving and displaying recorded documents and images.” St. Louis County contracted with Pro-West & Associates, from Walker, Minnesota, to configure the portal frame-work. Together, they developed the que-rying architecture to optimize searching, SQL Server Reporting Services reports, and GIS mapping services. County IT de-velopers linked many existing web-based applications within the portal and used ArcGIS for Desktop to design and deploy web services to ArcGIS for Server.
Popular in UseThe portal has become an invaluable tool in a surprising number of staff workflows.
Once a parcel is selected, the user can view recorded documents within it, such as quitclaim and warranty deeds, land-use permits, certificates of survey, plats, and photos.
continued on page 14
17Spring 2014 esri.com/localgov
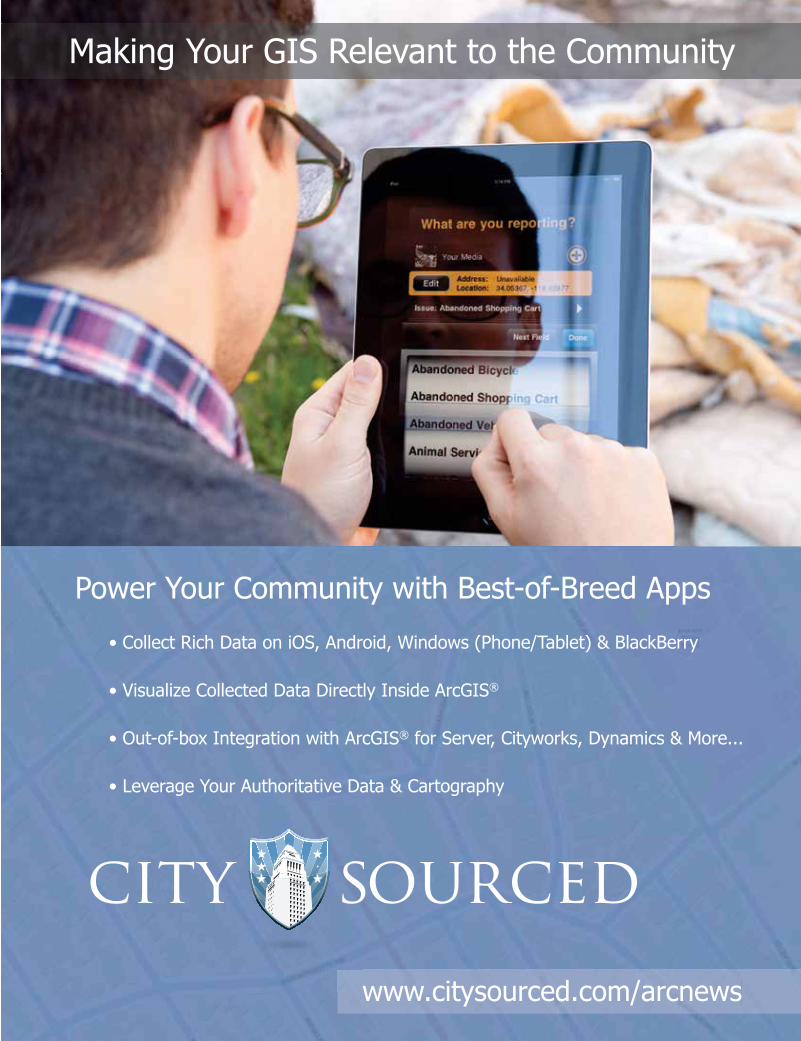
Election Results in Single-Member Constituencies Power Your Community with Best-of-Breed Apps
www.citysourced.com/arcnews
• Collect Rich Data on iOS, Android, Windows (Phone/Tablet) & BlackBerry
• Visualize Collected Data Directly Inside ArcGIS®
• Out-of-box Integration with ArcGIS® for Server, Cityworks, Dynamics & More...
• Leverage Your Authoritative Data & Cartography
Making Your GIS Relevant to the Community
G62525_StateGov_140055_Spring_3-14.indd 17 2/25/14 4:36 PM

14 Esri News for State & Local Government Fall 2015
While attending the Esri User Conference in July, I learned that 20,000 local governments use GIS technology glob-ally—20,000! Through peer-to-peer sharing and networking, that number represents a tremendous capacity for improved operations. Isn’t it likely that if your community builds a good app or dashboard, it would work equally well for one or more of your neighbors? As GIS technology moves to the web and becomes increasingly intuitive for non-GIS professionals, the technology is transforming how local governments do business. For local government manag-ers, the challenge is to meet high expectations and encourage their GIS teams to work with all departments to create and innovate. Chris Cappelli, Esri’s director of global business develop-ment, shared some tips—based on his own experiences—on how local governments can establish a collaborative environ-ment that delivers the desired results. • Leverage GIS as an enterprise asset. GIS isn’t just for a few
departments within your local government. Treat GIS as a re-source for all your departments.
• Focus your GIS professionals. Let your GIS team members know what the priorities are for your organization and work with them to define how they can deliver on those priorities.
• Empower everyone with maps. Some departments will in-evitably have a harder time envisioning how they can use GIS technology. Show them how maps can work for them.
• Create a destination portal. We all have portals that we go to in our personal life for information, like websites for travel info
Getting the Results You Want from GISBy Cory Fleming, CRM Program Director, ICMA
trust. Geography and mapping technology can play a key role in opening up and sustaining the communication channels necessary to successfully support communities both inside and
GIS Empowers Community Engagement continued from page 11
Land Records Investigation Gets Bionic Upgrade in Minnesota continued from page 12
or reviews of consumer products. Portals have tremendous value in turning data into information that employees can depend on to do their jobs.
• Integrate with your other mission systems and data assets. Whether it’s an enterprise resource program (ERP) for budget-ing and cost accounting or a work order management system for tracking projects, such systems need to be integrated and work together. Stand-alone systems that don’t work with other systems in your organization add little value.
• Configure commercial off-the-shelf software as a platform. Use straightforward configurations, rather than custom code, to create a better fit for your organization.
• Get involved personally. Use maps, apps, and dashboards and let your GIS team know what you like and don’t like about the product.
• Create map series that are tied to your business objectives. Use the series to look for leading and lagging indicators as-sociated with your business objectives.
• Organize effectively. Employ good people throughout your organization and give them the support they need to innovate.
• Promote a culture of sharing and collaboration. In any or-ganization, it’s easy to become overly focused on tasks directly related to one’s job. As a leader of your organization, remind people that they are an important part of a larger mission and help them see how working together can have an even greater impact.
Assessors use the portal to view real estate market data by neighborhood; calculate assessment and sales data; and ensure fair and equitable assessments of taxable residential, commercial, agricultural, and industrial properties. Planning and Community Development staff rely on the Land Information Portal to conduct development reviews and coordinate with the City of Duluth on property blight removal. The county’s Public Health and Human Services department also uses the portal to access assessment history when screening foster care applicants and reviewing public assistance cases. Its wide applicability even surprised its creators.
“It’s been amazing to see the different uses of the portal by individual users and within departments,” said Jablonsky. “The wealth of data alone has been a valuable resource, breaking down data barriers across all our departments.” The Land Information Portal plays an integral role in the county’s daily operations and serves as a perfect model for any county to replicate. Esri recognized the successful model, honoring the county with a Special Achievement in GIS Award at the 2014 Esri User Conference.
outside an organization. Getting started with a few simple GIS applications can help organizations build strong, long-lasting relationships with their communities.


Presorted Standard
US Postage Paid Esri
380 New York Street Redlands, California 92373-8100 usa
147943 QUAD166M10/15sp
Learn more atesri.com/smartcommunities.
Every Community CanBe a Smart CommunityAt Esri®, we do more than talk about smart communities.We help create them.
For decades, we have partnered with thousands of governments of all sizes, all around the world. Throughthese partnerships we built ArcGIS® for State Governmentand ArcGIS for Local Government—a series of application templates for issues related to economy, health, infrastructure, and public safety. You can download these apps and start creating your smart community today.
Smart communities start here.
Copyright © 2015 Esri. All rights reserved.
G66703_State_Local_Govt_Newsletter_dl_FNLindd.indd 1 12/23/14 9:52 AM