Embed Size (px)
Citation preview

2/18/2014
1
Ramsey County Workforce Solutions MFIP Employment Services
Performance Outcomes for 2014
Mark Herzfeld, Program Evaluator Kate Probert, Manager
1
What we will cover
• Goals and philosophy for MFIP-ES
• Overview of current and new performance measures on new Report Card
• Added racial disparities measures and county-wide indicators
2
Goals of MFIP
• To encourage and enable all families to find employment;
• To help families increase their income and move out of poverty;
• To prevent long-term use of welfare as a primary source of family income.
3
Workforce Solutions Philosophy
• Employment is the primary means to exit MFIP or DWP successfully or to become more self-sufficient, including FSS and those extended.
• All MFIP and DWP participants benefit from some employment.
• Sustained employment leads to improved self sufficiency.
• Ultimate goal is to leave MFIP and DWP with income.
• The more quickly participants are engaged in activities, the more quickly they begin to move on the path to employment.
4
Workforce Solutions Philosophy cont’d
• Achieving a goal requires defining of a goal, development and implementation of a plan. The development of an Employment Plan gives direction, a road map to participant and always must be client focused and client driven.
• Career planning and coaching support participants in making job and career choices.
• Credentials and certificates are important milestones on a participant’s career pathway.
• Education is a fundamental prerequisite for self sufficient income.
5
Blending with New Outcomes
• New Report Card keeps all the previous measures
• Most new measures cover primary counseling activities and data already in place
• A few require new procedures to account for job retention, career planning, and skill attainment
• Early 2014 is a major transition for all agencies
6

2/18/2014
2
Old and New Measures
Current Report Card
(5 measures—6 parts)
Current Operations Becoming Performance Measures with Existing WF1 and MAXIS Data
(5 measures—11 parts)
Job retention, credentials, coaching assessment activities, diploma/
certificates, labor market activities with new data recording procedures
(3 measures—7 parts)
7
What’s New? • Get even more familiar with sub types
• Career coaching
• Review of interests
• Labor market intelligence
• Stackable credentials
• Self-marketing credential
• WF1 activities will have a subtype code that relates to the measure
• Example: measure 10A for career coaching will have a subtype “10ACC” under the activity “other”.
8
Caseload Trends—not individual audits
• As agency level measures, they represent the proportions of the caseload
• Not every participant must attain the targets
• There always are particular circumstances
• The Report Card is for the collective
big picture achievement
• Targets vary from 0.5% - 90.0% based
mostly on past trends.
9
Overall Purpose of Measures • New emphasis on education and preparing
for employment – 3 stages of activities:
• Getting started . . .
• Keep working forward . . .
• Goal attainment for self-sufficiency . . .
10
Getting Started . . .
• New participants start activities within 30 and 60 days: #7A and #7B
• Cases with no income in previous quarter start earning income: #4B
• Start an employment plan within 90 and 120 days after enrollment: #8A and #8B
11
Keep working forward . . .
• Employed 1-19 hours, 20 or more, 87 or more: #1A-C
• Work Participation Rate and engaged in activities: #5, #8C
• Career planning, coaching, labor market intelligence: #10A-C
• Obtaining credentials, certificates, and education diplomas: #11A-B, 12, and 13
• Increase income and activities (FSS): #4A, #9
12

2/18/2014
3
• Job retention after 3 months: #2
• Self-Support Index: #3
• Off MFIP for 3 Months with Income: #6
Goal attainment for self-sufficiency . . .
NEW BONUS FROM DHS 13
Reordering of Measures
• 13 overall measures, including Young Parents
• Their numbering in the 2014 report card reflects the order in the new RFP documents.
• Some measures have more than one part
14
Sample Intro
15
Program Outcomes Purpose: Outcome Targets
1: Employment
Employment is the primary means to
exit MFIP successfully or to become
more self-sufficient, including FSS and
those extended. All MFIP participants
benefit from some employment.
A: 2% employed up to 19 hours a month
B. 33% employed 20+ hours a month
C: 22% employed 87+ hours a month
2: Job retention at 3 months Sustained employment leads to
improved self-sufficiency
A: 90% of participants who were working and left
MFIP for 3 months are still employed at any level
(no data till 2014)
B: 90% of participants working and still on MFIP 3
Months later are employed at any level.
3: Three year self-support index (delayed) Long-term exits off MFIP or working
full-time for sufficiency.
77% are off MFIP and DWP or working full-time 3
years since on MFIP.
4: Increase family earned income, maintain
minimum full-time wages, or start earning income
Increasing income is a key step
towards self-sufficiency
A. 47% of cases increase income or maintain
full-time minimum wages of $941 per month.
B. 25% of cases with no income in previous
quarter earning $10 or more per month in new
quarter.
5: Work participation rate target Meet federal and DHS statutory TANF
requirements. 50% will meet TANF work participation rate
6: Participants exiting MFIP Ultimate goal of MFIP is leaving with
income. 10% of cases are off MFIP with minimum wage.
7: New participants quickly start activities
The more quickly participants are
engaged in activities, the more quickly
they begin to move on the path to
employment.
A: 65% of new participants are in new activity
within 30 days of enrollment
B: 90% of new participants are in new activity
within 60 days of enrollment
8: Participants with open employment plan and
engaged in activities
The development of EPs give
direction/road map to participants
A: 80% of all participants with EP within 90 days
of enrollment.
B: 85% of all participants with EP within 120 days
of enrollment.
C: 90% of cases with 3 or more hours of activities
Sample Intro (cont’d)
16
9: FSS cases increase participation
Although FSS participants do not
count in the WPR, those individuals
benefit from being actively engaged
in activities.
Percentage of FSS cases increase engagement
hours over previous quarter by 2 percentage
points
10: Career Planning and Coaching (no data till
2014)
Career planning and coaching
supports participants in making job
and career choices.
A: 50% of all participants have career coaching
hours recorded per quarter
B: 50% of all participants have assessment
activity hours recorded per quarter reflecting
update and review of participant progress
C: 50% of all participants have labor market
intelligence related hours recorded per quarter
11: Credentials and Certificates (no data till
2014)
Credentials and certificates are
important milestones on a
participant’s career pathway leading
to employment outcomes and self-
sufficiency
A: 0.5% of all participants acquire a minimum of
1 stackable credential per quarter
B: 10% of participants with job search activities
also have acquired at least 1 self-marketing
credential (i.e. MN Ready certificate, Essential
Skills certificate, etc.) per quarter
12. Education for adults without a diploma
Education is a fundamental
prerequisite for self-sufficient
income.
30% of adult participants without a HS diploma
or GED are engaged in at least 20 hours of
education activities (GED or adult diploma
completion) per month
13. Education is pursued for young adults
Education is a fundamental
prerequisite for self-sufficient
income.
A: 80% of participants under age 20 without a HS
diploma/GED are engaged in at least 20 hours of
high school or GED activities per month.
B: 30% of participants without a HS
diploma/GED are engaged in at least 20 hours of
high school or GED activities per month.
What’s Next For Agency Report Card Measures?
• Follow-up training on specific procedures with job retention, career coaching, credentials and sub types
• Policy and procedure documents help interpret and instruct how to manage and record the new measures.
17
Summary: Old and New Measures
Current Report Card
(5 measures—6 parts)
Current Operations Becoming Performance Measures with Existing WF1 and MAXIS Data
(5 measures—11 parts)
Job retention, credentials, coaching assessment activities, diploma/
certificates, labor market activities with new data recording procedures
(3 measures—7 parts)
18
2/18/2014
4
Overall Purpose of Measures • New emphasis on education and preparing
for employment – 3 stages
• Getting started . . .
• Keep working forward . . .
• Goal attainment for self-sufficiency . . .
19
Goals of MFIP
• To encourage and enable all families to find employment;
• To help families increase their income and move out of poverty;
• To prevent long-term use of welfare as a primary source of family income.
20
Racial Disparity Measures
• Four measures that are part of each agency’s contract
• Reduce any gaps with whites each year compared to the previous year
• Three measures compare results between whites, African Americans and American Indians within each agency (if more than 10 participants).
• Longevity on MFIP is only measured county-wide and includes extension caseload
• Each agency is expected to help reduce
length of time on MFIP county-wide
21
Racial Disparity Measures • Blending current measures for American Indians
and African Americans within each agency
• Continue with WPR
• 1-year Self-Support Index (S-SI) Off cash grant for 3 months now, not sanctioned or
timed off, or
Working 130+ hours per month for 3 months now
• Add percent employed and longevity (countable months) on MFIP
• As with all other DHS and county reports, immigrants are separated within Black/African Americans from U.S. born. 22
Racial Disparity by Agency
• African American, American Indian and whites are measured within each agency for employment, WPR, and Self-Support Index.
• The average for the previous year is compared county-wide (pre-extension) with whites.
• If African American or American Indian results within an agency are less than county-wide outcome for whites, the agency is expected to reduce the disparity by half the following year.
• The disparities and progress will be updated each quarter for the current year.
23
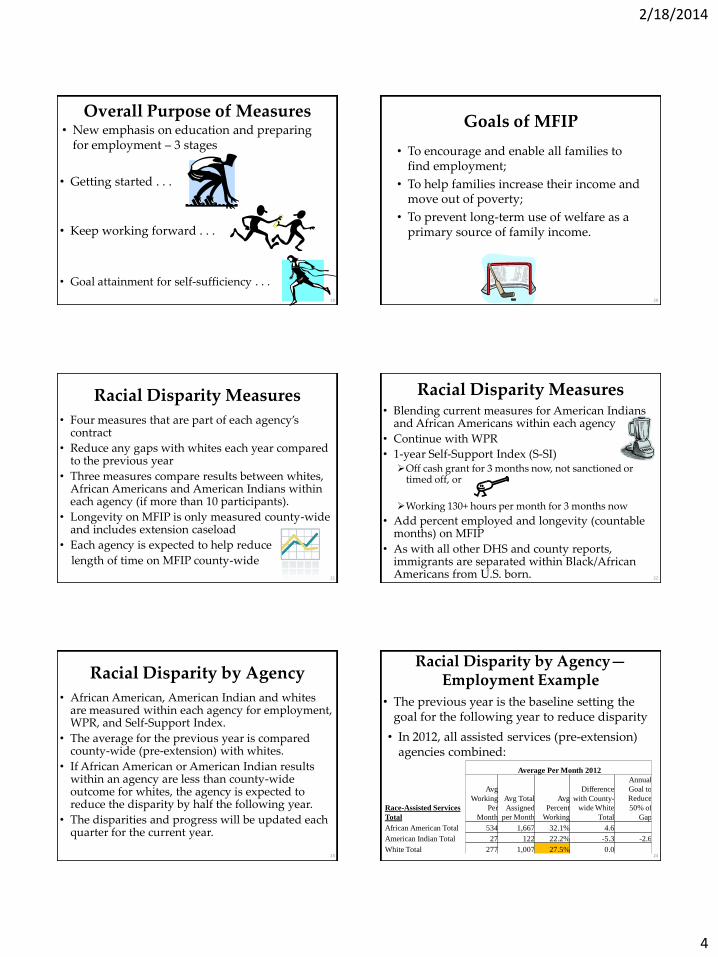
Racial Disparity by Agency—Employment Example
• The previous year is the baseline setting the goal for the following year to reduce disparity
Average Per Month 2012
Race-Assisted Services
Total
Avg
Working
Per
Month
Avg Total
Assigned
per Month
Avg
Percent
Working
Difference
with County-
wide White
Total
Annual
Goal to
Reduce
50% of
Gap
African American Total 534 1,667 32.1% 4.6
American Indian Total 27 122 22.2% -5.3 -2.6
White Total 277 1,007 27.5% 0.0 24
• In 2012, all assisted services (pre-extension) agencies combined:

2/18/2014
5
Racial Disparity Targets by Agency—Employment Example
• In 2013, reduce disparity at least by half:
White Total 2012
= 27.5%
Difference with
County-wide
White Total in
2012
Target Level
of Disparity
in 2013
Avg Percent
Working
2013
Jan-Sep
2013
Disparity
White -- -- 26.9% --
African
American
Agency 1 +5.2 n/a 32.1% +2.5
Agency 2 -4.0 -2.0 23.9% -3.0
• If fewer than 10 participants within an agency, results are not compared to whites.
The difference with
whites counts—not the
actual rate
25
Reduce by half
Racial Disparity Targets by Agency: WPR and S-SI
• Repeat disparity goals for percentages in WPR and Self-Support Index.
Results by race within agency compared to county results for whites (pre-extension)
If results less than whites county-wide in 2012, the target for 2013 is half the disparity of 2012
If a group is higher than whites in 2012, maintain the lack of disparity in 2013
• Recalculate targets for 2014 based on 2013 disparities for employment, WPR, and S-SI
26
Racial Disparity Targets by Agency: WPR and S-SI
• The data and procedures for participants are exactly the same as the corresponding Report Card measure for the whole agency. S-SI: Work hours, cash grant, MFIP eligibility on MAXIS 1-year Index for racial disparities; 3-year Index for entire
agency (#3) WPR: Work hours and WF1 activities counted us usual
• No new codes or procedures Pay stubs to financial worker for work hours
Cash grant and eligibility monthly review by financial worker based on income, household size, etc.
Same WPR countable hours 27
Racial Disparity Measure—Longevity on MFIP
• County-wide comparison of all groups
• Based on proportions of county’s total caseload who have less than 60 months and 60+ months by race/ethnicity
• Take the ratio of group’s percentage of the county total with 60+ months divided by percentage with under 60.
• Compare that ratio with whites.
• Goal is to reduce the difference above whites to 0.05 or keep within 0.05 in following year.
28
Racial Disparity Measure—Longevity: Illustration with 2012
Average Per Month,
2012 A B C D E F
Total Parents on
Ramsey County MFIP
Avg on
60+
Months
Avg
0 to 59
Months
Percent of
60 or
More
Percent of
0 to 59
Ratio of
percentages
Difference
with White
Total 1,262 5,171 100.0% 100.0% 1.000
African American 659 1,808 52.2% 35.0% 1.494 0.484
American Indian 45 137 3.6% 2.6% 1.347 0.336
Asian American 7 215 0.6% 4.2% 0.138 -0.873
Hmong 128 301 10.2% 5.8% 1.749 0.739
Latino/Hispanic 68 320 5.4% 6.2% 0.875 -0.135
Multi-racial 23 121 1.8% 2.3% 0.774 -0.237
Other Asian Immigrant 14 684 1.1% 13.2% 0.084 -0.927
Other Black Immigrant 12 200 0.9% 3.9% 0.241 -0.769
Somali 34 286 2.7% 5.5% 0.486 -0.524
White 271 1,099 21.5% 21.3% 1.010 0.000 29
Racial Disparity Measure—Longevity, Results 2013
Average Per Month, January Through September 2013
Goal:
<=0.050
Total Parents on
Ramsey County MFIP
Avg on
60+
Months
Avg 0 to
59 Months
Percent of
60 or More
Percent of
0 to 59
Ratio of
percentages
Difference
with
White
Total 1,245 4,818 100.0% 100.0% 1.000 -0.122
African American 659 1,750 53.0% 36.3% 1.458 0.337
American Indian 43 122 3.5% 2.5% 1.380 0.258
Asian American 8 202 0.7% 4.2% 0.162 -0.959
Hmong 106 258 8.5% 5.4% 1.597 0.475
Latino/Hispanic 66 272 5.3% 5.6% 0.944 -0.178
Multi-racial 25 115 2.0% 2.4% 0.855 -0.267
Other Asian Immigrant 16 661 1.3% 13.7% 0.092 -1.030
Other Black Immigrant 11 190 0.9% 4.0% 0.226 -0.896
Somali 32 293 2.6% 6.1% 0.421 -0.700
White 277 956 22.2% 19.8% 1.122 0.000
30

2/18/2014
6
General County-Wide Indicators
• Blending of past indicators
• Not performance measures
• Not calculated per agency
• Overall trends in caseload Cases leaving MFIP for 3 months by length on MFIP
Sanction rates by FSS and not FSS
FSS caseload by race/ethnicity
WF1 enrollments and exits past 18 months
Educational attainment by race/ethnicity
31
Reports – Overview/Timing
• Report Card (13 Measures) Finished 4 months after end of measurement period
For example, Jul-Sep 2013 finished in Jan 2014
Released first month of each quarter (Jan, Apr, etc.)
• Racial Disparities (4 Measures) Finished one month after Report Card (Feb, May, etc.)
General indicators distributed along with racial disparity results
• Updated on WFS Provider Reports Page
32
Goals of MFIP
• To encourage and enable all families to find employment;
• To help families increase their income and move out of poverty;
• To prevent long-term use of welfare as a primary source of family income.
33
Questions: Ramsey County Workforce
Solutions Employment Services Performance
Outcomes
Thank you Mark Herzfeld, Program Evaluator
Kate Probert, Manager Alan Wanless, MIS Manager
Vidhya Shanker, Program Evaluator 34