Embed Size (px)
Citation preview

Raman Spectroscopy
Kalachakra Mandala of Tibetian Buddhism
Dr. Davide FerriPaul Scherrer Institut� 056 310 27 81� [email protected]

Raman spectroscopy
Literature:M.A. Banares, Raman Spectroscopy, in In situ spectroscopy of catalysts (Ed. B.M. Weckhuysen), ASP, Stevenson Ranch, CA, 2004, pp. 59-104Ingle, Crouch, Spectrochemical Analysis, Prenctice Hall 1988Handbook of Spectroscopy (Ed. Gauglitz, Vo-Dinh), Wiley, Vol. 1http://www.kosi.com/raman/resources/tutorial/index.html
Chandrasekhara Venkata Raman (1888 – 1970)
February 28, 1928: discovery of the Raman effect
Nobel Prize Physics 1930 “for his work on the scattering of light and for the discovery of the effect named after him”

Raman spectroscopy
Visible UV
X-Ray
Gamma
Infrared
Microwave
Radio
Energy
nanometers
2.48 x 10⁻⁷ 0.124 2.48 4.96 2480 2.45 x 10⁶ eV
Wavelength 5 x 10⁹ 10000 500 250 0.5 5 x 10⁻⁴
Raman
FIR
MIR NIR

0 200 400 600 800 1000 1200
EPR
UV-Vis
XAFS
NMR
Raman
IR
Number of publications
Number of publications containing in situ, catalysis, and respective methodSource: ISI Web of Knowledge (Sept. 2008)
Importance of Raman spec. in catalysis

Raman spectroscopy
elastic scattering = Rayleigh scatteringinelastic scattering = Raman scattering (ca. 1 over 107 photons)
Evib = E0 – E
incident light
scattered light
sample
E0 E
Raman shift

Raman effect
� Change in polarizability , α� Particle << wavelength: d << λ
� Particle emits scattered light as a point source
� E0 = incident beam irradiance� α = polarizability of the particle (ease of distortion of the electron cloud)� λ = wavelength of the incident radiation� θ = angle between incident and scattered ray
� More scattering at low wavelength (4th power law)
Esc =α2 (1+cos2θ)
λ4E0

Classic mechanics approach
Electric field of exciting radiation:
Induced dipole:
StokesAnti-Stokes
E = E0cos(2πν0t)
µin = αE = αE0cos(2πν0t)
cosx·cosy = 1/2 [cos(x+y)+cos(x–y)]
α = α0 + αcos(2πνvibt)
µin = αE = [α0 + αcos(2πνvibt)]E0cos(2πν0t)
µin = α0E0cos(2πν0t) + αE0cos(2πνvibt)cos(2πν0t)
Induced change of α :
and µin = α0E0cos(2πν0t) + α/2E0cos[2π(ν0+νvib)t] + α/2E0cos[2π(ν0-νvib)t]}
Rayleigh

Quantum mechanics approach
virtual level
v = 0 (initial)
v = 1 (final)
Stokes Anti-Stokes Raman shift (cm-1)
Rayleigh
Stokes Anti-StokesR
aman
inte
nsity
electronic level
vibrational levels
Rayleighν0ν0–ν ν0+ν
νvib νvib
Raman spectrum
1
106
hν0 hν0
hν0
hν0 h(ν0+νvib)
h(ν0-νvib)
hνvib

� Classical theory inadequate: same intensity for Anti-Stokes and Stokes lines is predicted
� Measure of Temperature:
Quantum mechanics theory
excited population
relaxed population= e-E/kT
Stokes lines more intense than Anti-Stokes lines (factor 100)
I (Anti-Stokes)
I (Stokes)
ν0+νvib
ν0–νvib
= e-hνvib/kT
4

Raman signals
� Intensity of Raman signals depends on:
� 4th power of ν (4th power law)
� 2nd power of ∆α- properties of molecules- strength of bonds
� Same information contained in Stokes and Anti-Stokes signals� Same distance from Rayleigh line whatever ν0
covalent bond STRONG bands
ionic bond WEAK bands
(catalysis!)
Esc =α2 (1+cos2θ)
λ4E0
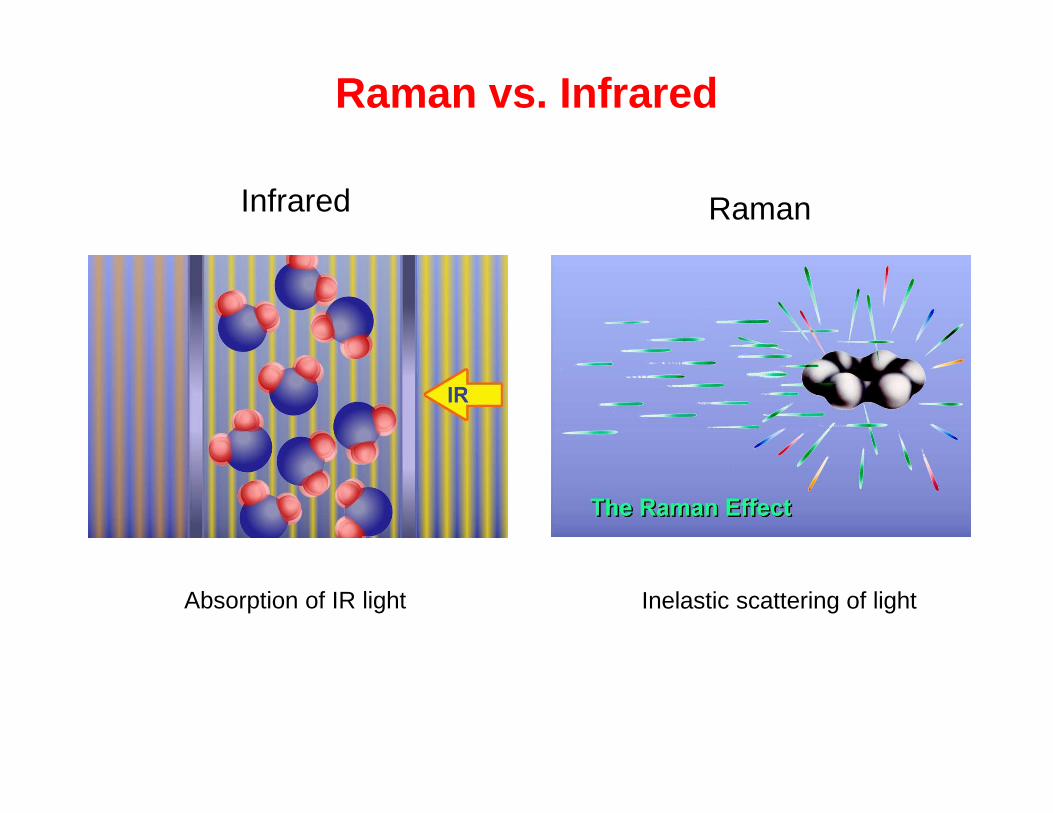
Raman vs. Infrared
Inelastic scattering of lightAbsorption of IR light
Infrared Raman

Raman vs. Infrared
� high absorption for polar bonds (C=O, H2O, NH, etc.)
� high absorption for easily polarizable bonds
� large electron clouds� not polar
� H2O is a very weak Raman scatterer
� C=C double bonds strong Raman scatterers
∂α∂Q
2
≠ 0∂µ∂Q
2
≠ 0
Selection rules

Raman vs. Infrared
+- -
νas
νsδ
degenerate modes
1340 cm-1
2349 cm-1
667 cm-1
Raman active
CO2
δ667 cm-1

Raman vs. Infrared
ν(C-H)
ν(C=O)δ(CH3)
δ(C-H)
Raman shift (cm-1)
Inte
nsity
Acetone

Raman vs. Infrared
O
Cl
Cl

Raman vs. Infrared
� Simple optics� Versatile design of cells (quartz & glass allowed)� Fiber optics� Almost no limitation in temperature� Very small amount (picog) of sample possible� Water no problem� Sensitive to microcrystals (< 4 nm)� Sample of phase not critical� Spatial resolution (1 µm)� No contribution from gas phase
� Relatively expensive instruments� Low spectral resolution (UV and Vis)� Difficult quantification (limited to heterogeneous catalysis)� Structure of analyte affected by high energy of laser (e.g. UV Raman)� Fluorescence
Adv
anta
ges
Dis
adva
ntag
es

Fluorescence and Raman signals
UV Vis NIR
Vis Raman FT RamanUV Raman
excitation line
Raman signals
frequency/energy
Fluorescence Emission of visible light during a time posterior to the sample
irradiation
Esc proportional to ν4
Fluorescence proportional to ν
107 stronger than Raman scattering
� IR excitation� UV excitation� Pulsed Lasers
Solution

Instrumentation
LasersExcitation wavelengths
lense
Laser source
sample
to detector
objective and sample stage
� UV
� Vis (green)
� Vis (red)
� NIR
� IR
250 nm
514 nm
633 nm
780 nm
1064 nm(9395 cm-1)

Dispersive instruments
Lasers

Resonance Raman Spectroscopy
� Raman scattering strongly enhanced if the excited state is not virtual, but an electronically excited state (factor 106 !)
� Vibrations related to an electronic transition are excited
Pulsed laser used to avoid fluorescence
Resonance Raman scattering Fluorescence
fast (10-14 s)
excited electronic
state
ground electronic
state
hνhν0 slow (10-9–10-6 s)hν0 hν

Surface Enhanced Raman Spectroscopy
2-mercaptoethanol
bulk (liquid)
on Ag
Fleischmann, Chem. Phys. Lett. 26 (1974) 163
� Valid for adsorbates
� Enhanced electric field provided by surface
� Excitation of surface plasmons by light
� Enhancement greater when plasmon frequency in resonance with incident radiation
� Plasmon oscillations perpendicular to surface
The original experiment

Surface Enhanced Raman Spectroscopy
� Enhancement factor up to 106 on substrates like: Ag, Au, Cu
� Less enhancement for other metals (Pt and Pd)
� Dual nature (electromagnetic [surface plasmons] + chemical [charge transfer surface–adsorbate])
� Applications: electrochemistry, corrosion, (bio-)adsorbates, acidity of surfaces, (bio-)sensing
� Remarks:
� rough surface; nanoparticles (10–100 nm) or kinks, steps etc. (E always perpendicular to surface, locally)� vibrations normal to surface are enhanced
Njoki et al., J. Phys. Chem. C 111 (2007) 14664

Applications
� Aqueous solutions� Environmental chemistry & trace
analysis� Semiconductor technology� Biochemical and biomedical� Pharmaceutical industry� Heterogeneous catalysis� Forensic science� Polymer science� Food science� Art conservation� Reaction monitoring
785 nm
1064 nm
500100015002000250030003500
Raman shift (cm-1)0.
10.
20.
30.
40.
50.
60.
70.
8
Inte
nsity

MOx/M’OX used in a number of industrial chemical processes (dehydrogenation, oxidation, amoxidation…)
Question: nature of MOx and the role in catalysis?
Applications

Applications
� Monolayer (monomeric) & polymeric species
M
O
OOO
M
OO
OOM
OO
OO
MOx
1030-990 cm-1
950-750 cm-1
monomers
950-750 cm-1
M
OO
OO
M
O
O
O
950-750 cm-1
M
OO
OO
M
O
O
O
crystalline phase+ ev. polymers
MOx
polymers
MOx
νas = 900 cm-1
νs = 600 cm-1
δ = 200 cm-1
M
O
OO
O M
OO
OM
O
O
O
O
MO
O
O
M
O
M
O
OO
O M
OO
OM
O
O
O
O
MO
O
O
M
O950-750 cm-1
M
O
O
OO
M
O
O
O
950-750 cm-1
M
O
O
OO
M
O
O
O
surface species

Applications
815
665 280
crystalline MoO3
1002
940
300
870
surface MoO3
MoO3/Al2O3dehydrated at 500°C
Very weak signals from support oxides as SiO2 and Al2O3 at 800–1100 cm-1
Advantage over IR
Wachs, Catal. Today 27 (1996) 437
� Monomeric & polymeric species

Applications
� Monomeric & polymeric species� Monomeric & polymeric species
Wu et al., J. Phys. Chem. B 109 (2005) 2793
γ-Al2O3
14.2
8
4.4
1.20.160.030.01
V2O5
14.2
γ-Al2O3
8
4.41.2
0.16
V2O5
UV-laser244 nm
vis-laser488 nm

Applications
V2O5: 996 cm-1
TiO2: 402 cm-1
Brückner et al., Catal. Today 113 (2006) 16
VxOy
air flow @ 450°CO2/C3H8 @ 20°C@ 100°C@ 150°C@ 200°C
� Reactivity of V/TiO2 after oxidative treatmentV5+Ox
VxOy
V5+→ V4+
O OOO
O
V

M/MOX (M= Pd, Pt, Rh; MOx= Al2O3, ZrO2, CeO2…) used for total and partial oxidation reactions
Question: what is the state of Pd during reaction?
Examples: Pd for CH4 combustionRh for CH4 partial oxidation
Examples for in situ studies

Applications
� Resonance Raman – State of the metal in Pd/Al2O3
inte
nsity
Raman shift (cm-1)
1200200 600 1000400 800
inte
nsity
Raman shift (cm-1)
1200200 600 1000400 800
300°C, O2
300°C, H2
as prepared+300°C3 min O2
431
624
624
273
400°C, O2
400°C, He
2 wt.% Pd/Al2O3, red. 400°C (3 h) + calcined 600°C (3 h)
Demoulin et al., PCCP 5 (2003) 4394

Applications
Demoulin et al., PCCP 5 (2003) 4394
� Resonance Raman – Methane oxidation over Pd/Al2O3
inte
nsity
Raman shift (cm-1)
1200200 600 1000400 800
400°C, H2
400°C
425°C
450°C
500°C 24 %
15 %
4 %
2 %
PdO
CH4 conv.
reduced Pd
feed
CH
4/O
2 (1
:10)
inout
objective+532 nm
near PdO mode
CH4 + 2O2 → CO2 + 2H2O
PdO↑
Pd(0)

Applications
� Resonance Raman – Methane oxidation over Pd/ZrO2
1 vol% CH4/4 vol.% O2/He10 wt.% Pd/ZrO2
200 400 600 800 1000 120020000
30000
40000
50000
60000
70000
80000
90000
70200300400500600700800860
Raman shift (cm-1)
Inte
nsity
T (°C)
514 nm reactor cellinlet
outlet
oven
PdO→Pd
gas-phase combustion
Pd→PdO
650→630 cm-1
change in PdO stoichiometry ?

Applications
� Methane partial oxidation over Rh/Al2O3
3 mW, 325 nmCH4/O2/Ar = 2/1/45
CH4 + 0.5O2 → CO + 2H2
Li et al., Catal. Today 131 (2008) 179
0.1 wt.%T50%= 550°C
0.25 wt.%520°C
1.0 wt.%470°C
3.0 wt.%450°C
RhOx↓
Rh(0)
ActivityRh content
Applications
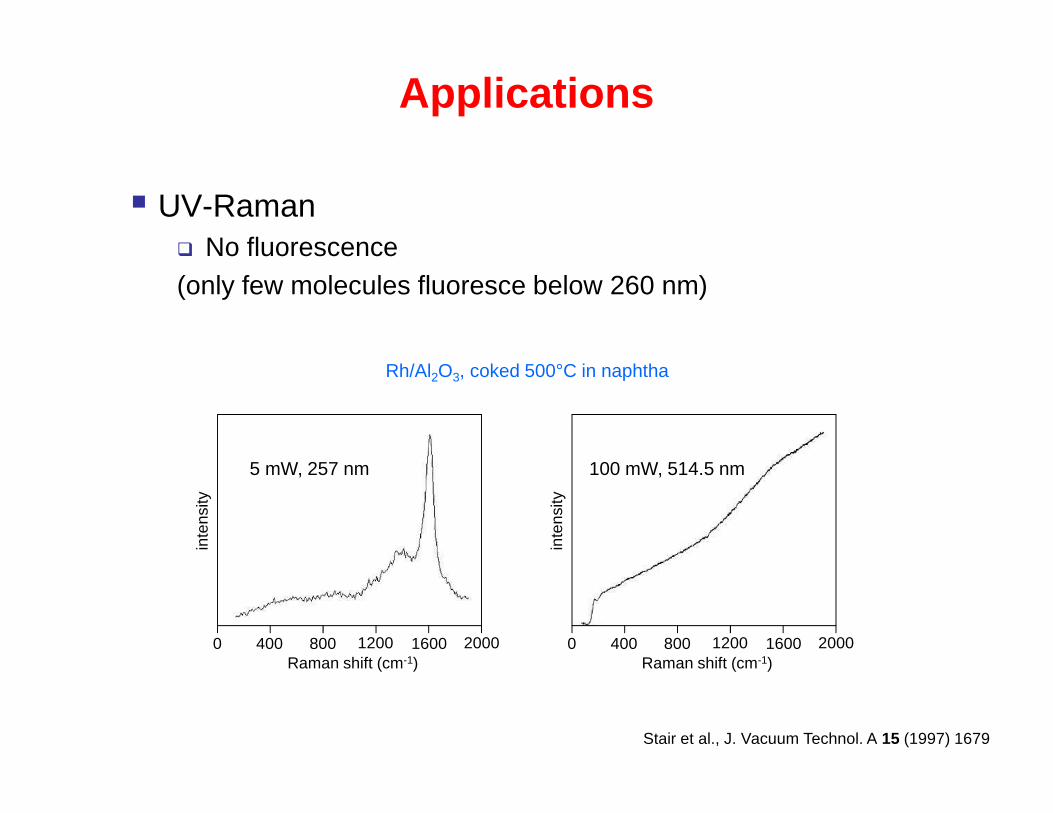
� UV-Raman� No fluorescence(only few molecules fluoresce below 260 nm)
Stair et al., J. Vacuum Technol. A 15 (1997) 1679
Rh/Al2O3, coked 500°C in naphtha
5 mW, 257 nm
400 800 1200 1600 20000
inte
nsity
Raman shift (cm-1)
100 mW, 514.5 nm
400 800 1200 1600 20000
inte
nsity
Raman shift (cm-1)

Applications
� (Polyaromatic) Coke formation and characterization� (Polyaromatic) Coke formation and characterization
UV
H-MFI
CrOx/Al2O3
Coke from :H-MFI: methanol-to-hydrocarbons (MTH)CrOx/Al2O3: C3H8 dehydrogenation (ODH)
Coke classification1D topology, chain-like2D topology, sheet-like
Stair, Adv. Catal. 51 (2007) 75

Applications
� (Polyaromatic) Coke formation and characterization� (Polyaromatic) Coke formation and characterization
Coke from :H-MFI: methanol-to-hydrocarbons (MTH)CrOx/Al2O3: C3H8 dehydrogenation (ODH)
Coke classification1D topology, chain-like2D topology, sheet-like
Stair, Adv. Catal. 51 (2007) 75

Applications
� Propane dehydrogenation� Propane dehydrogenation
Airaksinen et al., J. Catal. 230 (2005) 507
Cr2O3/Al2O3, 580°C, 514 nm
time (min)5% C3H8/He
10
20
30
40
1580
1340
10’10’C3H8
He
C-H
DRIFTS
aromatic / C=Caliphatic
cat. activity (GC)
spectrum spectrum
carboxylate

MoS2, 6 min
full power, FB
MoS2, 6 min
full power
MoS2, 1 min
full power
MoS2, 6 min
1/8 power
* α-MoO3
hydrodesulfurization
Beato et al., Catal. Today 205 (2013) 128
Applications
� Fluidized bed reactor cell

Beato et al., Catal. Today 205 (2013) 128
CH3OH steam reforming (r.t.) on H-ZSM5
λ= 244 nm
Laser induced CH3OH decomposition
FB
FB off
CH3OH
zeoliteCH3OH CH3OH
Sulfuric acid V2O5/pyrosulfate catalyst
λ= 514 nm
active species: mono- & dimeric V5+
oxosulfate species
V-O-S
V-O-V
no conv.
(V4+O)3(SO4)54-
ca. 30%
conv.
SO42-
V5+
polym. species
Applications
� Fluidized bed reactor cell

Geske et al., Catal. Sci. Technol. 3 (2013) 169
ethane ODH on MoOx/Al2O3
1 mm Al2O3 spheres
full O2 conv.max. C2H4 conc.
� monitoring of reaction in fixed bed
reactor (Raman/MS)
� partial reduction MoO3→MoO2
with decreasing O2 content
� MoO3 vanishes when no O2 is
present (point β, 19 mm)
fiber optics; spatial resolution, 1 mm
violet/MoO2
yellow/MoO3
Applications
� Fixed bed reactor


![Prediction of Dry Matter Intake Throughout Lactation in a ... · e −[(0.564 0.124 ×PKMK) (WOL + P)], where PKMK = month postcalving when peak milk yield occurred (1, 2, or 3) and](https://img.pdfslide.us/doc/110x75/5d25606588c993a0298d1be8/prediction-of-dry-matter-intake-throughout-lactation-in-a-e-0564-0124.jpg)