Embed Size (px)
DESCRIPTION
RWH is a decentralized alternative water supply technology that has great potential to meet the needs of households suffering from the water supply crisis taking place in Oaxaca de Juárez, Mexico. This master's thesis attempts to estimate the current and achievable water savings from RWH in Oaxaca, evaluate its potential to meet the city’s demand, and identify potential barriers to its implementation. A survey of 45 households was conducted and six RWH model scenarios were run with the data it provided. The model shows that: (1) RWH has the potential to meet 65-75% of the city’s non-potable water demand; (2) significantly more RWH is already occurring in Oaxaca than previously imagined; (3) substantial improvements to RWH can be made; and (4) RWH is an economically viable alternative water supply for the city. The survey results show that cultural and technical barriers are not significant obstacles to RWH, but that informational and economic barriers act as important deterrents. In order to overcome these barriers to RWH implementation and improvement, it is recommended that: (1) a RWH awareness campaign be established; (2) a RWH Association be founded; and (3) an economic incentive for RWH adoption such as a subsidy, tax rebate, or funds made available by a foundation or grant be enacted or acquired.
Citation preview

Rainwater Harvesting in Oaxaca de Juárez, Mexico: Constraints and Promise
Masters Thesis Submitted to the Faculty of the Bard Center for Environmental Policy
By Nolan Gardner
In partial fulfillment of the requirement for the degree of Master of Science in Environmental Policy
!
!
Bard College
Bard Center for Environmental Policy
P.O. Box 5000
Annandale on Hudson, NY 12504-5000
May, 2012

Acknowledgements
The research for this thesis was made possible with the help of many advisors, colleagues, family, and friends. I would like to especially thank Gautam Sethi, Mara Ranville, and Alejandra Martinez Sanchez for their wisdom and guidance, and Simon Topp, Jessica Lebovits, Clara Gardner, Darien Gardner, and Kate O’Kane for their love and support.

!
!
i!
Table of Contents Abstract(.........................................................................................................................(iv!Chapter(1:(Introduction(............................................................................................(1!1.1(! Global(Context(............................................................................................................(1!1.2(! Oaxaca(de(Juárez(........................................................................................................(2!1.3(! The(Oaxacan(Water(Supply(....................................................................................(4!1.3.1! Public!Sector!Water!........................................................................................................!4!1.3.2! Private!Water!Sector!......................................................................................................!6!
1.4! Current(RWH(in(Oaxaca(...........................................................................................(7!1.5! Barriers(to(Implementation(and(Improvement(..............................................(8!
Chapter(2:(Literature(Review(..............................................................................(10!2.1! Materials(&(Components(of(a(RWH(System(....................................................(11!2.2! The(Quality(of(Harvested(Rainwater(................................................................(13!2.2.1! Appropriate!Rainwater!Uses!...................................................................................!14!2.2.2! Public!Perception!of!Rainwater!Quality!..............................................................!15!
2.3! Hydraulic(and(Economic(RWH(Models(.............................................................(17!2.3.1! Scale!of!Analysis!............................................................................................................!17!2.3.2! Optimal!Sizing!of!a!RWH!System!............................................................................!19!2.3.3! Private!Value!of!Harvested!Rainwater!................................................................!22!2.3.3.1! Water!Prices!..........................................................................................................................!23!2.3.3.2! Initial!Capital!Costs!.............................................................................................................!23!2.3.3.3! Maintenance!and!Operational!Costs!...........................................................................!24!2.3.3.4! NPVs!and!Payback!Periods!..............................................................................................!25!
2.3.4! Social!Value!of!Harvested!Rainwater!...................................................................!26!2.3.5! Policies!to!Promote!RWH!..........................................................................................!27!2.3.5.1! Germany!..................................................................................................................................!28!2.3.5.2! Australia!..................................................................................................................................!29!2.3.5.3! Spain!..........................................................................................................................................!30!2.3.5.4! Developing!Countries!........................................................................................................!31!
2.3.6!! Barriers!to!Implementation!....................................................................................!31!Chapter(3:(Model(and(Methods(...........................................................................(33!3.1! The(Survey(Process(.................................................................................................(33!3.2! Model(for(RWH(Storage(Dynamics(.....................................................................(34!3.2.1! Unconstrained!RWH!Potential!................................................................................!34!3.2.1.1! Splash!Off/Evaporation/Runoff!Coefficient!.............................................................!35!3.2.1.2! Mean!Monthly!Rainfall!......................................................................................................!35!3.2.1.3! Catchment!Area!....................................................................................................................!36!
3.2.2! ShortWTerm!Storage!Constraints!............................................................................!36!3.2.2.1! ShortWTerm!Storage!Capacity!.........................................................................................!36!3.2.2.2! Additional!Storage!Capacity!............................................................................................!36!3.2.2.3! “Days!With!Rain”!..................................................................................................................!37!
3.2.3! LongWTerm!Storage!Constraints!.............................................................................!37!3.2.3.1! Daily!Household!Consumption!......................................................................................!38!3.2.3.2! LongWTerm!Storage!Capacity!..........................................................................................!38!3.2.3.3! LongWTerm!Storage!Loss!(Overflow)!...........................................................................!39!
3.2.4! Constrained!RWH!Potential!.....................................................................................!39!3.3! Important(Model(Assumptions(...........................................................................(39!3.3.1! Unconstrained!RWH!Potential!................................................................................!40!3.3.2! Constrained!RWH!Potential!.....................................................................................!40!

!
!
ii!
3.4! Model(for(RWH(Economics(...................................................................................(41!3.4.1! Inputs!for!Six!Model!Scenarios!...............................................................................!42!3.4.1.1! Model!Inputs:!Scenarios!1,!2,!&!4!vs.!Scenarios!4,!5,!&!6!....................................!42!3.4.1.2! Model!Inputs!for!Scenarios!1!&!4:!Current!Practices!...........................................!43!3.4.1.3! Model!Inputs!for!Scenarios!2!&!5:!Basic!RWH!System!Improvements!........!43!3.4.1.4! Model!Inputs!for!Scenarios!3!&!6:!Applying!Entirety!of!Storage!to!RWH!...!44!
3.4.2!Model!Equations!................................................................................................................!45!3.4.2.1! Water!Savings!Efficiency!(WSE)!...................................................................................!45!3.4.2.2! Net!Present!Value!(NPV)!..................................................................................................!46!3.4.2.3! Payback!Period!(PBP)!........................................................................................................!47!
Chapter(4:(Results(....................................................................................................(49!4.1! Survey(Results(..........................................................................................................(49!4.1.1! Demographics!and!General!Water!Use!................................................................!49!4.1.2! Households!Water!Storage!Capacities!and!Pumps!.........................................!50!4.1.3! RWH!System!Components!........................................................................................!53!4.1.4! Harvested!Rainwater!Quality!and!Uses!...............................................................!54!4.1.5! Harvested!Rainwater!Treatment!Methods!........................................................!56!4.1.6! Catchment!Area!and!Storage!Capacity!.................................................................!57!4.1.7! RWH!System!Cleaning!and!Maintenance!Procedures!...................................!58!4.1.7.1! Storage!Tanks!........................................................................................................................!59!4.1.7.2! Gutters!&!Downspouts!......................................................................................................!59!4.1.7.3! Catchment!Surface!..............................................................................................................!60!
4.1.8! Knowledge,!Perceptions,!and!Legality!of!RWH!................................................!60!4.1.9! Interest!in!and!Intentions!for!Future!RWH!.......................................................!61!4.1.9.1! Household!WillingWtoWPay!(WTP)!.................................................................................!63!
4.2! RWH(Dynamics(Model(and(Economics(of(RWH(Model(Results(................(64!4.2.1! Model!Inputs!...................................................................................................................!64!4.2.2! Model!Inputs!Assigned!to!Applicable!Scenarios!..............................................!67!4.2.3! Model!Results!.................................................................................................................!69!
Chapter(5:(Policy(Recommendations(................................................................(73!5.1! Cultural(and(Technical(Barriers(to(RWH(.........................................................(73!5.2! Overcoming(the(Informational(Barriers(to(RWH(.........................................(74!5.3! Overcoming(the(Economic(Barriers(to(RWH(..................................................(75!5.4(! Government(Support:(RWH(as(a(Public(Good(................................................(76!5.5! Conclusion(.................................................................................................................(77!
Works(Cited(...............................................................................................................(80!Appendix(A:(RWH(System(Components(............................................................(86!A.1! Catchment(Surface(..................................................................................................(86!A.2! Gutters(and(Downspouts(......................................................................................(86!A.3! First[Flush(Diverter((FFD)(....................................................................................(87!A.4! Storage(Tank(.............................................................................................................(89!A.5! Pump(and(Plumbing(...............................................................................................(91!A.6! Treatment,(Filtration,(and(Purification(...........................................................(91!
Appendix(B:(Harvested(Rainwater(Quality(.....................................................(92!B.1(! Paths(of(Contamination(.........................................................................................(92!B.2! Water(Quality(Study(Parameters(.......................................................................(92!B.3! Post[Storage(Filtration(and(Treatment(............................................................(96!

!
!
iii!
Appendix(C:(Valuing(the(Rainwater(Harvest(................................................(100!C.1! Current(Rainwater(Values(.................................................................................(100!C.2! Projected(Future(Rainwater(Values(...............................................................(104!
Appendix(D:(The(Cost(of(Basic(RWH(System(Improvements(...................(107!Appendix(E:(Survey(Results(................................................................................(109!E.1! ADOSAPACO(...........................................................................................................(109!E.2! Public(Water(Trucks(............................................................................................(111!E.3! Private(Water(Trucks(..........................................................................................(113!E.4! Public(and(Private(Wells(....................................................................................(115!
Appendix(F:(Model(Inputs,(Presented(by(Household(.................................(117!Appendix(G:(Basic(Improvement(Costs(&(Changes(in(Practice(...............(119!Appendix(H:(Model(Results,(Presented(by(Household(..............................(122!Appendix(I:(Reasons(for(Household(Exclusion(in(the(Survey(..................(132!Appendix(J:(Survey(Materials((English)(..........................................................(133!Appendix(K:(Survey(Materials((Spanish)(.......................................................(149!!

!
!
iv!
Abstract
RWH is a decentralized alternative water supply technology that has great potential to meet the needs of households suffering from the water supply crisis taking place in Oaxaca de Juárez, Mexico. This thesis attempts to estimate the current and achievable water savings from RWH in Oaxaca, evaluate its potential to meet the city’s demand, and identify potential barriers to its implementation. A survey of 45 households was conducted and six RWH model scenarios were run with the data it provided. The model shows that: (1) RWH has the potential to meet 65-75% of the city’s non-potable water demand; (2) significantly more RWH is already occurring in Oaxaca than previously imagined; (3) substantial improvements to RWH can be made; and (4) RWH is an economically viable alternative water supply for the city. The survey results show that cultural and technical barriers are not significant obstacles to RWH, but that informational and economic barriers act as important deterrents. In order to overcome these barriers to RWH implementation and improvement, it is recommended that: (1) a RWH awareness campaign be established; (2) a RWH Association be founded; and (3) an economic incentive for RWH adoption such as a subsidy, tax rebate, or funds made available by a foundation or grant be enacted or acquired.

!
!
1!
Chapter 1: Introduction
Rainwater harvesting (RWH) is a decentralized alternative water supply that has great
potential to alleviate urban problems of non-potable water quantity, quality, and
availability. It is an ancient technique that has been used as a water supply and for
stormwater management for thousands of years (Rygaard et al. 2011; Abdulla & Al-
Shareef 2009; Helmreich & Horn 2009; Vargas 2009). This thesis examines the city of
Oaxaca de Juárez, Mexico, and attempts to estimate the current and achievable water
savings from RWH, assess the feasibility of applying this technology, evaluate its
potential to meet the city’s demand, and identify potential barriers to its implementation.
The analysis is both hydraulic and economic, and is conducted on a household-by-
household basis with information drawn from 45 households surveys. Six RWH scenarios
are explored, and the achievable water savings efficiency (WSE), the net present value
(NPV) of the system, and payback period for system improvements are calculated for
each household in each scenario. Based on this analysis, the thesis argues that RWH is a
viable policy option for Oaxaca, and that it should be used as a policy instrument in the
city’s water supply strategy. However, the survey and model results show that two
significant barriers to RWH exist, and that they must be overcome if RWH is to live up to
its potential as a water supply.
1.1 Global Context
As the mass migration to urban environments that has been occurring over the last fifty
years continues, cities all around the world are struggling to find adequate water supplies
(Angrill et al. 2011; Domènech & Saurí 2011; Farreny et al. 2011; Tam et al. 2010;
!
!
2!
Thomas 1998). In 2008, the UN estimated that the 3.3 billion people living in urban areas
in 2007 would to increase to 6.4 billion by 2050, and that urban water demand was going
to rise accordingly (Domènech & Saurí 2011). In the face of rising demand, the
traditional model of urban water management has depended on large-scale infrastructure
projects such as dams and aqueducts, and used eminent domain to lay claim to other
community’s water supplies, sometimes hundreds of miles away. However, this model is
confronting resistance from environmentalists, human rights activists, and others because
of the often-underestimated damages it causes (Martinson & Thomas 2003).
In contrast, many cities are considering a range of non-traditional options such as
desalinization, rainwater harvesting (RWH), greywater recycling, and general water
conservation practices to match the widening gap between supply and demand
(Martinson & Thomas 2003). In conjunction with the Intergovernmental Panel on
Climate Change’s (IPCC’s) 2007 predictions of increased variability of precipitation and
more frequent flood events, the need for developing adaptive water management
strategies is imminent (Domènech & Saurí 2011). Many analysts argue that that RWH
will play a central role in these adaptive strategies. (Domènech and Saurí 2011; Farreny,
Gabarrell, & Rieradevall 2011; Rygaard et al. 2011; Abdulla & Al-Shareef 2009).
1.2 Oaxaca de Juárez
The current water supply in Oaxaca de Juárez is dangerously inadequate. Decades of
unsustainable withdrawal from the shallow Zaachila Aquifer have left the landscape
around the city barren and the one of the city’s primary water supplies all but spent,
empty for large portions of the year (Consejo 2011). As a result, marginal households in

!
!
3!
Oaxaca often go for long periods without water, sometimes as much as a month or two
(Lusher 2007). In order to address this problem, policymakers in Oaxaca have chosen the
old industrial paradigm of damming to claim new water supplies, yet they are also open
to the new environmental methods of reducing, recycling, and using what you have
sustainably (Consejo 2011).
According to the government calculations, there is not enough water in the
Central Valleys of Oaxaca to meet the demands of its population (CNA 2011). Non-
governmental organizations (NGOs), such as the Institute for Nature and Society of
Oaxaca (INSO), disagree, and have other ideas about how to meet the Oaxacan water
supply gap. They argue that the quantity of water in the Central Valleys is sufficient to
meet the population’s demands, and that the real problem is the way that water is
managed (Consejo 2011). For example, within the same week that a household might not
receive water from the city’s water utility, the Administradora de Obras y Servicios de
Agua Potable y Alacantarillado de la Ciudad de Oaxaca (ADOSAPACO), they also
might have a few inches of stormwater flooding in the first floor of their house (Parker
2010). To capture this reality, INSO has developed a water supply paradigm in which
alternative technologies such as RWH can be used to convert this unusable and often
damaging fast water into controlled and functional slow water (Consejo 2011).
In 2011, despite the lobbying and input of INSO, other NGOs, and several
communities to dissuade them, the government approved a large dam project Southwest
of the city (Consejo 2011). The proposed Paso Ancho dam will allegedly provide Oaxaca
with ample water supplies for the next 20 years (including projected growth). However, it
will also inundate thousands of acres and divert the water supply of many rural

!
!
4!
communities to do so. In addition, the 2.5 billion pesos in infrastructure costs for the dam
(CNA 2011) will likely more than double public water prices, a drastic change that will
have particularly negative repercussions within the poorer sectors of Oaxaca de Juárez
(Consejo 2011). Critics of the dam argue that it will also perpetuate the current
mismanagement of the city’s water supplies by eliminating the pressure of water scarcity,
and therefore the incentive to reform current practices (Consejo 2011).
1.3 The Oaxacan Water Supply
Oaxaca’s water supply system is a complex web of public and private provision. The
public sector is managed by ADOSAPACO, but, when its supply fails, consumers look to
the estimated 200 distinct private water truck companies residing in the city to meet their
demand. In addition, it is very rare that a Oaxacan family will drink from their tap
(Lusher 2007). Everybody knows that the piped municipal water, and even the water
from private trucks, is dirty—appropriate for flushing one’s toilet, but not for drinking.
Most families purchase drinking water in “garrafones,” 20-liter bottles of purified water
that cost about 15 pesos (~US$1.15), and those that do not only do so because they
cannot afford the expense (Lusher 2007). Thus, Oaxaca has two distinct streams of water
supply and consumption, water for drinking, and water for everything else. This thesis
will deal primarily with the latter.
1.3.1 Public Sector Water
ADOSAPACO, the State agency responsible for the acquisition, treatment, distribution,
processing, recycling, and disposal of water, has property claims to four
reservoir/watershed systems to the North of the city and some 15-20 deep wells to the

!
!
5!
South and West (Lusher 2007). Although this diverse portfolio was sufficient to supply
the city’s needs some thirty years ago, it has not kept pace with the 30-40% increases in
population that have occurred about every decade since the 1950’s (Consejo 2011). At
one time, perhaps as recently as 30 years ago, there was water pumping through the pipes
beneath Oaxaca constantly, despite the fact that some 40% of this water was lost to leaks
and cracks in the ancient infrastructure along the way (Consejo 2011). In those days,
when a resident of Oaxaca turned on their tap, water rushed straight from the pipes,
annunciating its abundance and the easy right to its use. Somewhere along the line,
ADOSAPACO was forced, by a growing scarcity no doubt, to alter this practice.
Currently, certain sections of the city receive water from ADOSAPACO on
average about two times per week, some as much as five times per week, and others as
little as once per week (Lusher 2007). ADOSAPACO sends water to different sections of
the city on different days of the week. Some houses are lucky enough to be located at the
crossroads of this underground network; others are at the extremities. A household
receives water from ADOSAPACO usually for a matter of hours (Consejo 2011). In
order to have access to water for the rest of the week, households purchase private water
storage tanks, and almost every household owns at least one. These private water storage
tanks are generally plastic Rotoplas tanks, with a capacity of 1,100 liters, located on the
roof of a home; locally referred to as tinacos. Within the few hours that ADOSAPACO
puts water in a section of their pipes, the pressure of the system carries the water up to the
households’ tinacos. The water in a given tinaco is then consumed throughout the week
as a household needs it, via the gravitational force that its rooftop location affords.

!
!
6!
The ADOSAPACO water tariff being as cheap as it is, and the small-scale plastic
tinacos being as cheap as they are, this system actually works quite well, at least while
ADOSAPACO has water to distribute. Although they may have minimized the amount
they are losing to leaks and cracks, ADOSAPACO’s staggered distribution system has in
no way solved the larger water scarcity problem. Oaxaca receives an average of over 700
millimeters of rain every year, but almost the entirety of this occurs within 8 months.
Hence, by the end of the dry season, and even into the beginning of the rainy season
before the wells and reservoirs have recovered, ADOSAPACO has almost no water to
distribute. Households that do not have an alternative water source to ADOSAPACO can
sometimes go for one or even two months without water.
1.3.2 Private Water Sector
The most common alternative water sources are the privately owned water trucks,
referred to locally as las pipas. ADOSAPACO itself owns a handful of water trucks that
deliver water to households that are not receiving water through the pipe system
(“Honorable Ayuntamiento of Oaxaca de Juárez” 2005). However, as many
ADOSAPACO customers survey respondents revealed, it can be weeks after a household
has put in a call to the public ADOSAPACO pipas before the water trucks actually arrive,
and when they do, their load must be split between several blocks of customers, leaving
only a few hundred liters to each household. Many respondents not only expressed that
they did not see the point in contacting the public water trucks, but also that, when they
did, the water was generally very bad quality.
!
!
7!
Private water trucks are expensive. Although there is a considerable range in
prices1, the mean survey respondent reported paying 156 pesos per cubic meter (1,000
liters). Compared to the mean of 53 pesos per cubic meter that households reported
paying for public ADOSAPACO water, the private price felt outlandish to most
households. Nonetheless, many households commit a large portion of their monthly
income during the dry season to paying for private water truck services, unable to deny
the importance of having water. It is these high private water truck costs that could
potentially be offset by RWH and create a cost-savings that might incentivize households
to invest in a RWH system.
1.4 Current RWH in Oaxaca
In addition to purchasing from the private water trucks, it is not uncommon for
households in Oaxaca to collect rainwater off of their roofs to augment their water
supply. They know that every liter of free rainwater they capture is potentially a savings
to their household. Thus, although many households in Oaxaca are currently harvesting
rainwater, they are doing so out of necessity, and in a very rustic manner. Generally, only
a portion of the roof is used to capture rainwater, without gutters or downspouts, and this
small percentage of the potential harvesting capacity is stored in large buckets and bins,
locally known as tambos (large 100 to 200-liter buckets), tinas (50 to 100-liter wash
bins), and cubetas (small 10 to 50-liter buckets) made of plastic or metal, and often
without tops. When it is rains hard, these buckets and bins fill quickly, capturing the same
quantity of water whether it rained 5 mm or 50 mm—unless they are emptied during the
!!!!!!!!!!!!!!!!!!!!!!!!!!!!!!!!!!!!!!!!!!!!!!!!!!!!!!!!1!Generally, the price per liter decreased as the quantity increased and increased as the quantity decreased.!

!
!
8!
rain. Most households use this harvested rainwater for only the most basic of uses,
namely, watering plants, washing floors, and flushing toilets.
The motivation of this research, therefore, is to investigate the potential of a more
sophisticated form of RWH to provide a larger alternative water supply. That is, to
calculate how much of a household’s water demand could be offset by a RWH system
complete with gutters, downspouts, a large storage tank, and a simple low-tech filtration
device such as a first-flush diverter. This type of RWH system would allow a household
to capture almost all the water that falls on their roof, store the surplus from the rainy
season for use during the dry season, and bring the quality of their harvested rainwater up
to a standard where they could comfortably and safely use it for bathing, laundry, and
washing dishes in addition to cleaning and watering plants.
1.5 Barriers to Implementation and Improvement
Before the survey associated with this thesis was conducted, the work of Parker (2010)
and others had led INSO to believe that very little RWH was taking place in Oaxaca. In
response, a number of hypotheses had been developed in an attempt to explain the lack
RWH in a city that, at least in INSO’s eyes, could so clearly benefit from it. Drawn from
both local knowledge and experiences from the literature it was theorized that households
in Oaxaca were resistant to harvesting rainwater because of: (1) cultural barriers, such as
the belief that Oaxaca did not receive enough rainfall to make a RWH system worthwhile
or the perception that harvested rainwater was not of high enough quality; (2)
informational barriers, such as knowledge gaps at both personal and institutional levels
for either installing or maintaining a RWH system; (3) technical barriers, such as space

!
!
9!
constraints for large cisterns or the flat cement roofs so popular in Oaxaca rather than the
angled tile roofs to which RWH systems are often applied; or (4) economic barriers, such
as the large initial capital costs of a RWH system or the highly-subsidized public water
prices in Oaxaca. These hypotheses served to shape both this thesis and the survey that it
is based on. Even after the survey results showed larger-than-imagined participation in
RWH, these hypothesized barriers to RWH implementation and improvement continued
to set the stage for RWH work in Oaxaca.

!
!
10!
Chapter 2: Literature Review
Governments and water supply professionals in many developed developing nations are
becoming concerned because, when they try to expand their supply, they find that all the
water has been claimed or polluted (Farreny et al. 2011; Martinson & Thomas 2003).
RWH provides an innovative, alternative solution (Imteaz et al. 2011; Kahinda &
Taigbenu 2011; Mandak & Tapsuwan 2011; Palla & Gnecco 2011; Sturm et al. 2009;
Chatfield & Coombes 2007; Ghisi, Bressan, & Martini 2007; Martinson & Thomas 2003;
Gardner et al. 2001), and one that many governments are promoting, supporting, and
even subsidizing (Domènech & Saurí 2011; Farreny, Gabarrell, & Rieradevall 2011;
Rygaard et al. 2011; Tam et al. 2010; Thomas 1998). Two of the world's experts in this
field, Martinson and Thomas (2003), believe that the technology on which RWH systems
are based has improved drastically since the 1990's. They state that system costs have
been reduced dramatically, that concerns over water quality are better understood, and
that methods now exist for overcoming many previous technical difficulties (Martinson
& Thomas 2003). This belief is echoed by a general shift that can be seen in the literature
from the 1990’s to the 2000’s. While most articles and research prior to 2000 are focused
on the technicalities of RWH systems (what materials were appropriate for the catchment
area and the cistern, what uses harvested rainwater could safely be put to, or what level of
filtration/treatment was necessary), the past decade has marked a shift toward empirical
case analysis focusing on water quality data and investigating economic and social
aspects of RWH. Case studies and analyses of RWH projects at the single-building scale,
the neighborhood scale, the city scale, and even the country scale from nations around the
globe showcase this new pattern in the literature and describe the policies that cities are
!
!
11!
implementing to promote and regulate RWH (Domènech & Saurí 2011; Rygaard et al.
2011; Abdulla & Al-Shareef 2009; Kahinda et al. 2007; Villarreal & Dixon 2004;
Thomas 1998). Notably, Mexico is largely absent from this literature.
Broadly speaking, there are three strains of RWH research in the literature. The
first is a literature regarding the technical aspects of RWH, and usually involves topics
such as the appropriate construction, use, and maintenance of a RWH system and the best
and/or cheapest materials to build with. The second concerns water quality and focuses
on testing harvested rainwater with a variety of water quality parameters at different
points within a RWH system. The third investigates the economic viability of RWH as an
instrument in public and private strategies for meeting water consumption demands. The
following chapter reviews the first and second of these strands in brief, and the third at
length, since it is the most relevant to the investigation at hand.
2.1 Materials & Components of a RWH System
The basic components of complete rainwater harvesting system are as follows: (1)
catchment surface; (2) gutters and downspouts; (3) first-flush diverter (FFD); (4) storage
tank(s)/cistern(s); (5) delivery system; and (6) treatment/purification (Texas Water
Development Board 2005). Although this thesis does not focus on the technical aspects of
RWH, an extensive literature exists discussing these components. The following section
considers the basic purpose of each component very briefly, but more information on
each of them can be found in Appendix A.
The catchment surface of a RWH system is simply the area onto which the
harvested rainwater first falls. It can refer to any surface that harvested rainwater drains

!
!
12!
into a cistern from (i.e. roof, patio, parking lot), but usually suggests a roof, and in this
thesis will always denote a household’s roof area. It can be made from a variety of
materials, although certain ones are preferable to others. The size of the catchment area is
the most powerful factor in determining how much rainwater can be harvested.
Gutters and downspouts are a channeling system that carries rainwater from the
catchment surface to the storage tank. Like the catchment surface, they can be made from
a many materials, each with their own advantages and disadvantages, but they also vary
greatly in order to best fit roof characteristics. Many houses in Oaxaca, for example, have
flat roofs and would need channeling upon the roof itself rather than perimeter guttering.
First-flush diversion is the most basic and acclaimed form of filtration for a
RWH system. Many designs for FFDs exist, but, in its simplest form, it is a Y-pipe that
sits in every downspout and allows the owner to close the valve leading to the cistern,
letting the rainwater pour out upon the ground instead. Empirical evidence indicates that
performing this first-flush a few times per year drastically improves the quality of
harvested rainwater (Vialle et al. 2011; Lee et al. 2010; Helmreich & Horn 2008).
The storage tank is where the harvested rainwater ends up and is stored for future
use. It can be made from a variety of materials, but since it usually represents the
majority of the initial capital costs, cheaper materials are generally favored, namely
cement and plastic. The size of the storage tank is second only to the size of the
catchment area as a factor in determining how much rainwater can be harvested, and,
because it is also such a significant portion of the initial investment, the economic
literature emphasizes optimal cistern sizing heavily.

!
!
13!
The delivery system is simply the plumbing that takes harvested rainwater from
the storage tank to household faucets, etc. In most cases RWH systems can be patched in
to already existing plumbing very easily, but on occasion new pipes must be installed.
Some systems use a pump to carry rainwater to a second storage tank on the roof, where
it is distributed via gravity; others pump water directly from the cistern to the faucet.
Treatment and purification methods are generally applied post-storage and used to
bring harvested rainwater to potable quality. Because this thesis is recommending that
rainwater be used for non-potable uses like watering plants, flushing toilets, and laundry,
the majority of the treatment methods available are not of concern. If households plan to
use their harvested rainwater for other non-potable uses like bathing and cooking, than
the literature recommends small doses of chlorine in addition to the FFDs (Domènech &
Saurí 2011; Farreny et al. 2011; Imteaz et al. 2011; Mandak & Tapsuwan 2011; Toronto
& Region Conservation 2010; Helmreich & Horn 2008; Kahinda, Taigbenu, & Boroto
2007; Martinson & Thomas 2003; Thomas 1998).
2.2 The Quality of Harvested Rainwater
Fourteen studies written over the last twelve years were compared for this thesis in order
to gauge the level of water quality that can be expected from a RWH system. This water
quality literature review revealed serious concerns over the gastrointestinal diseases and
poisoning that could occur from ingesting harvested rainwater, and several common paths
of contamination were identified. Although there were conflicting results and opinions as
to whether harvested rainwater is safe and appropriate for drinking, all studies concluded
that harvested rainwater is appropriate for greywater uses (Domènech & Saurí 2011;

!
!
14!
Farreny et al. 2011; Vialle et al. 2011; Morrow et al. 2010; Lee et al. 2010; Abdulla &
Al-Shareef 2009; Radaideh et al. 2009; Sazakli et al. 2007; Chang et al. 2004; Kim et al.
2004; Zhu et al. 2004; Coombes, Kuczera, & Kalma 2003; Simmons et al. 2001;
Coombes et al. 2000). Since this thesis is recommending the use of harvested rainwater
only for such greywater uses, much of the literature regarding rainwater quality is not
entirely relevant. Hence, a more detailed review of this literature can be found in
Appendix B.
2.2.1 Appropriate Rainwater Uses
Although the harvested rainwater samples in all studies met the requirements for
greywater uses, there is some disagreement about what the appropriate end uses for
greywater are. All analysts agree that greywater is not for drinking, and that it is
acceptable for uses like watering plants, flushing toilets, and conducting general
housecleaning. However, other greywater uses such as cooking, brushing teeth, washing
dishes, and doing laundry are controversial because of the possibility of procuring a
disease or other ailment from ingestion or contact with rainwater.
Basic filtration techniques are highly recommended in the literature for RWH
systems, especially if one plans to put harvested rainwater to some of the more
controversial greywater uses (Domènech & Saurí 2011; Mandak & Tapsuwan 2011;
Rygaard et al. 2011; Jones & Hunt 2010; Kahinda, Taigbenu, & Boroto 2010; Dolnicar &
Shäfer 2009; Ward 2009; Helmreich & Horn 2008; Texas Water Development Board
2005; Thomas 1998). The most common and highly recommended basic filtration
technique is the first-flush diverter (FFD), (Farreny et al. 2011; Vialle et al. 2011; Lee et
al. 2010; Morrow et al. 2010; Abdulla & Al-Shareef 2009; Helmreich & Horn 2008;
!
!
15!
Sazakli et al. 2007; Texas Water Development Board 2005; Kim et al. 2004; Zhu et al.
2004; Coombes et al. 2000; Thomas 1998). Ten of the fourteen quality studies reviewed
for this thesis conducted their analysis with entirely unfiltered rainwater, i.e. without the
use of a FFD. However, some of those analyzing unfiltered rainwater, like Farreny et al
(2011), Vialle et al. (2011), Lee et al. (2010), Morrow et al. (2010), and Kim et al.
(2004), made note of the fact that employing a FFD would likely increase the quality of
harvested water significantly.
Abdulla and Al-Shareef (2009), Zhu et al. (2004), and Coombes et al. (2000), the
only three studies that compared the qualities of first-flush rainwater and unfiltered
rainwater, found significant quality improvements in the rainwater from systems with a
FFD. Abdulla and Al-Shareef (2009) and Zhu et al. (2004) both found first-flush
harvested rainwater to be acceptable for all WHO Drinking Water Standards. Coombes et
al. (2000) found violations of the Australian Drinking Water Guidelines for ammonium
and lead parameters in all rainwater samples, but with significantly less frequency in
first-flush rainwater. Sazakli et al. (2007), on the other hand, used FFDs for all their
harvested rainwater samples. They found every sample to be within the guidelines for
chemical parameters of the 98/93/EU directive for drinking water, but also encountered a
violating presence of total coliforms, E. coli, and enterococci in 80.3%, 40.9%, and
28.8% of their rainwater samples, respectively, although always in low enough
concentrations to be used for greywater purposes (Sazakli et al. 2007).
2.2.2 Public Perception of Rainwater Quality
Although RWH is generally thought of as a powerful solution or a brilliant alternative
supply to problems with surface waters and groundwater, concerns over the quality of

!
!
16!
harvested rainwater have long held the implementation of this technology in check
(Domènech & Saurí 2011; Mandak & Tapsuwan 2011; Rygaard et al. 2011; Jones &
Hunt 2010; Kahinda, Taigbenu, & Boroto 2010; Lee et al. 2010; Dolnicar & Shäfer 2009;
Helmreich & Horn 2009; Ward 2009). Abdulla & Al-Shareef (2009) wisely observe that
"the safety of water is determined” not only “in the laboratory by absolute
measurements,” but also “at the household level by people's perceptions" (Abdulla & Al-
Shareef 2009, p. 204). As important as scholarly research and water quality standards are
in guiding public policy decisions on these matters, households are usually forced to
make these decisions on their own. Especially with decentralized, autonomous water
supplies like RWH, households have the final say in allocating the quality-
appropriateness of their water to end uses.
A striking example of this can be seen in many developing countries, where
households use the water from wells, rivers, or buckets of rainwater as drinking water
(Abdulla & Al-Shareef 2009; Sturm et al. 2009; Kahinda et al. 2007). Sometimes boiling
or a few drops of bleach are used to improve water quality, but often even these
preliminary measures are unavailable or too expensive to be taken (Abdulla & Al-Shareef
2009; Sturm et al. 2009; Kahinda et al. 2007). Kahinda et al. (2007) estimated that about
67,000 underground and aboveground rainwater storage tanks in South Africa are
currently being used for drinking water.
In direct contrast, other places in the world—especially developed countries—
have a powerful, widespread, and culturally ingrained resistance to using rainwater,
recycled water, or desalinated water for even many of the greywater end uses (Domènech
& Saurí 2011; Mandak & Tapsuwan 2011; Rygaard et al. 2011; Jones & Hunt 2010;

!
!
17!
Kahinda, Taigbenu, & Boroto 2010; Dolnicar & Shäfer 2009; Ward 2009; Helmreich &
Horn 2008; Thomas 1998). This negative perception of rainwater quality and the lack of
regulations and guidelines on the installation, use, and maintenance of this technology are
often considered some of the greatest barriers to RWH implementation (Anand & Apul
2011; Mandak & Tapsuwan 2011; Ward 2009; Kahinda, Taigbenu, & Boroto 2007).
2.3 Hydraulic and Economic RWH Models
Since the turn of the century, a number of peer-reviewed journal articles have been
published that (1) assess the success of one (or many) RWH system(s) already in
existence, (2) estimate the RWH that could be achieved if such systems were installed in
a specific location, or, occasionally, (3) attempt to put a value to the current or potential
RWH that a location is practicing or could attain. Some studies, particularly those from
Australia, were written with a slightly different motivation. Although they are still
presented in terms of harvested rainwater, they have an additional focus on stormwater
management, often presenting their results as both demand offset and stormwater abated.
The hydraulic efficiency of RWH systems is discussed in terms of water saving
efficiency (WSE) or system reliability, and the economic efficiency of RWH is discussed
in terms of net present value (NPV), payback period, or life cycle costing. The following
section reviews and compares the methods, results, and conclusions of this literature.
2.3.1 Scale of Analysis
Early studies, such as Chilton et al. (2000) or Coombes et al. (2000), generally conducted
their analysis on a single building or series of buildings (like a housing development) that
already had and were currently using a RWH system. They set out to assess the level to

!
!
18!
which these RWH systems were meeting water demands, and occasionally to investigate
the economic viability of such systems. Cistern levels, FFD functioning, and sometimes
water quality were monitored over a period of years in order to measure system
performance, give critical feedback, and potentially recommend adoption of the
technology elsewhere. These early studies set the stage for the next round of more
hypothetical studies, spurring interest in the technology and providing a basis for future
analysis.
A second round of studies, like Ghisi, Montibeller, and Schmidt (2006) or
Roebuck and Ashley (2006), started appearing in the literature by the mid-2000’s,
although it can be seen as early Coombes and Kuczera (2003) and Liaw and Tsai (2004).
These studies were distinct from those previous to them because they used rainfall data
and sometimes computer simulations to estimate a potential rainwater harvest, given
various roof sizes, storage capacities, and consumption levels. Thus, they were able to
predict system performance and economic viability before the system had been
constructed, providing a powerful policy tool. Such studies extended the scale of their
analysis to whole cities or even regions and in many cases a dialogue began between
researchers and policy-makers. Most studies focused on single-family homes; others
examined multi-unit apartment buildings, commercial enterprises, or universities. Some
studies were conducted at the behest of policy-makers; others were used to convince
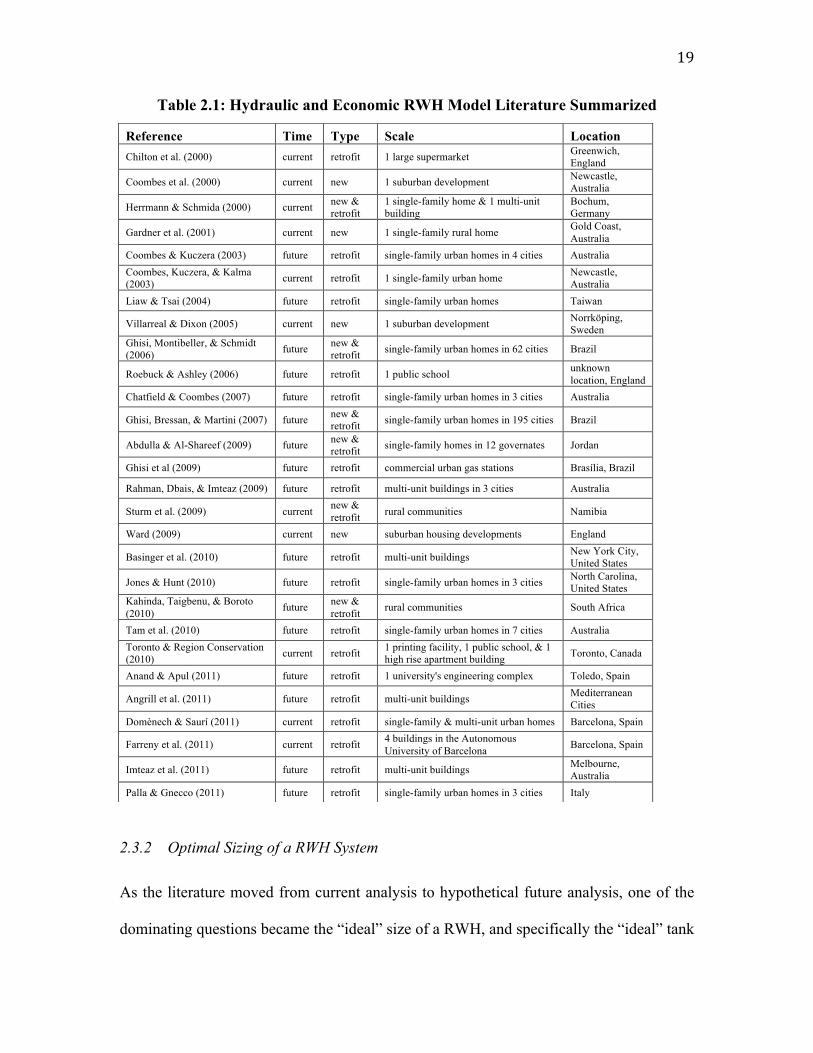
them of the feasibility of RWH. Table 2.1 presents the 28 studies reviewed for this thesis.
!
!
19!
Table 2.1: Hydraulic and Economic RWH Model Literature Summarized
2.3.2 Optimal Sizing of a RWH System
As the literature moved from current analysis to hypothetical future analysis, one of the
dominating questions became the “ideal” size of a RWH, and specifically the “ideal” tank
Reference Time Type Scale Location Chilton et al. (2000) current retrofit 1 large supermarket Greenwich,
England
Coombes et al. (2000) current new 1 suburban development Newcastle, Australia
Herrmann & Schmida (2000) current new & retrofit
1 single-family home & 1 multi-unit building
Bochum, Germany
Gardner et al. (2001) current new 1 single-family rural home Gold Coast, Australia
Coombes & Kuczera (2003) future retrofit single-family urban homes in 4 cities Australia Coombes, Kuczera, & Kalma (2003) current retrofit 1 single-family urban home Newcastle,
Australia Liaw & Tsai (2004) future retrofit single-family urban homes Taiwan
Villarreal & Dixon (2005) current new 1 suburban development Norrköping, Sweden
Ghisi, Montibeller, & Schmidt (2006) future new &
retrofit single-family urban homes in 62 cities Brazil
Roebuck & Ashley (2006) future retrofit 1 public school unknown location, England
Chatfield & Coombes (2007) future retrofit single-family urban homes in 3 cities Australia
Ghisi, Bressan, & Martini (2007) future new & retrofit single-family urban homes in 195 cities Brazil
Abdulla & Al-Shareef (2009) future new & retrofit single-family homes in 12 governates Jordan
Ghisi et al (2009) future retrofit commercial urban gas stations Brasília, Brazil
Rahman, Dbais, & Imteaz (2009) future retrofit multi-unit buildings in 3 cities Australia
Sturm et al. (2009) current new & retrofit rural communities Namibia
Ward (2009) current new suburban housing developments England
Basinger et al. (2010) future retrofit multi-unit buildings New York City, United States
Jones & Hunt (2010) future retrofit single-family urban homes in 3 cities North Carolina, United States
Kahinda, Taigbenu, & Boroto (2010) future new &
retrofit rural communities South Africa
Tam et al. (2010) future retrofit single-family urban homes in 7 cities Australia Toronto & Region Conservation (2010) current retrofit 1 printing facility, 1 public school, & 1
high rise apartment building Toronto, Canada
Anand & Apul (2011) future retrofit 1 university's engineering complex Toledo, Spain
Angrill et al. (2011) future retrofit multi-unit buildings Mediterranean Cities
Domènech & Saurí (2011) current retrofit single-family & multi-unit urban homes Barcelona, Spain
Farreny et al. (2011) current retrofit 4 buildings in the Autonomous University of Barcelona Barcelona, Spain
Imteaz et al. (2011) future retrofit multi-unit buildings Melbourne, Australia
Palla & Gnecco (2011) future retrofit single-family urban homes in 3 cities Italy

!
!
20!
size for a given roof size and consumption level. The tank size required to capture the
entirety of the rainwater falling on a roof—the unconstrained harvest—is generally
impractically large (Palla & Gnecco 2011; Jones & Hunt 2010; Toronto & Region
Conservation 2010; Chatfield & Coombes 2007; Roebuck & Ashley 2006; Coombes &
Kuczera 2003). Hence, because there is a diminishing return to increasing the tank size
(Angrill et al. 2011; Domènech & Saurí 2011; Imteaz et al. 2011; Palla & Gnecco 2011;
Jones & Hunt 2010; Tam et al. 2010; Toronto & Region Conservation 2010; Ghisi et al
2009; Chatfield & Coombes 2007; Roebuck & Ashley 2006; Coombes & Kuczera 2003;
Martinson & Thomas 2003), and because the tank is usually the most expensive part of
the system (Helmreich & Horn 2008; Texas Water Development Board 2005; Turner
2000; Thomas 1998), the “ideal” tank is smaller than that which would be necessary to
capture the unconstrained harvest. The question, then, is how much smaller?
The majority of the literature discusses system sizing and “ideal” tank size in
terms of WSE. For example, Jones and Hunt (2010) conducted an analysis of the RWH
potential for irrigation in North Carolina after a series of droughts and found that a 4,000-
liter cistern would be needed to satisfy the entire irrigation water demand for a 10 square
meter plot, but that a 1,800-liter cistern would satisfy 92% of the same irrigation water
demand. Although Jones and Hunt (2010), and other such as Sturm et al. (2009) and
Chatfield and Coombes (2007), did discuss various tank sizes in terms of WSE, they also
chose their “ideal” tank size arbitrarily. Others have developed specific methodologies.
Roebuck and Ashley (2006) developed a Microsoft Excel-based RWH computer
simulator called RainCycle™, and with it, standardized the method optimizing tank size
in terms of WSE. The software sets the hypothetical RWH system’s “ideal” tank size to

!
!
21!
the level where, by increasing the tank size by one cubic meter (1,000 liters), the WSE
increases by less than 1% (Angrill et al. 2011). Since then, Anand & Apul (2011), Angrill
et al. (2011), Domènech & Saurí (2011), Ghisi et al. (2009), and Ghisi, Bressan, &
Martini (2007) have all utilized the same optimizing methodology2, whether or not they
were using RainCycle™. Most studies in the literature, however, simply do not set an
“ideal” tank size, and discuss the WSE that would be achieved with a variety of tank
sizes (Farreny, Gabarrell, & Rieradevall 2011; Imteaz et al. 2011; Kahinda, Taigbenu, &
Boroto 2010; Tam et al. 2010; Villarreal & Dixon 2004; Coombes & Kuczera 2003;
Herrmann & Schmida 2000).
Another approach to sizing a RWH system and choosing an “ideal” tank size is to
frame the question in terms of system reliability. Liaw and Tsai (2004) pioneered a
method by which the number of system failures, defined as the number of times there is
demand for rainwater but the storage tank is empty, is turned into a system reliability
percentage, where reliability is equal to the number of failures divided by the number of
time periods analyzed. Although, Liaw and Tsai (2004) ended up favoring a WSE-type
sizing method and discussing a number of tank sizes and roof sizes rather than setting an
optimums, Palla and Gnecco (2011), Basinger et al. (2010), and Kahinda, Taigbenu, and
Boroto (2007) used the methodology they developed years later. In these studies, the
desired system reliability is chosen and, using the Storage and Reliability Estimation
Tool (SARET), the tank size that is required to meet that reliability level is produced
(Palla & Gnecco 2011; Basinger et al. 2010; Kahinda, Taigbenu, & Boroto 2007). Each
of these studies used one day as their time-unit of analysis and discussed the system
!!!!!!!!!!!!!!!!!!!!!!!!!!!!!!!!!!!!!!!!!!!!!!!!!!!!!!!!2!Some studies used the tank size that, by increasing it one cubic meter, would result in a 0.5% increase in WSE instead.!

!
!
22!
reliability for a variety of roof sizes, tank sizes, and consumption levels, with no
optimums chosen (Palla & Gnecco 2011; Basinger et al. 2010; Kahinda, Taigbenu, &
Boroto 2007).
The least common way to discuss system sizing is in terms of the value of the
rainwater harvest. Liaw and Tsai (2004) incorporated the costs of converting catchment
areas and building storage tanks, but it only served to set a lowest-cost optimum ratio
between these two RWH system inputs. The incorporation of prices did not extend to
attempting to value the rainwater harvest and optimizing accordingly. Similarly, Ghisi et
al. (2009) conducted an “investment feasibility” analysis when sizing their RWH system,
but it only served to set constraints on the tank sizes they considered. Many studies do
use municipal water prices to put a value to harvested rainwater, but none of them
optimize their system size in order to maximize the NPV of the system of minimize the
payback period for system improvements, as this thesis does.
2.3.3 Private Value of Harvested Rainwater
Surprisingly few studies that conducted a comprehensive hydraulic analysis also
performed an economic one. Almost all of the thirteen studies reviewed for this thesis
that do perform an economic analysis simply take the price of municipal water that
households are currently paying and value harvested rainwater as the costs avoided by
offsetting this supply. Some, such as Sturm et al. (2009), factor in the costs of private
water supplies where necessary, and others, such as Domènech and Saurí (2011),
Farreny, Gabarrell, and Rieradevall (2011), Imteaz et al. (2011), and Rahman, Dbais, and
Imteaz (2009), assume an increase in municipal water prices over the time period
considered. However, RWH systems also have costs, and to calculate NPVs and payback

!
!
23!
periods initial capital costs and maintenance and operational costs need to be included. A
variety of approaches exist.
2.3.3.1 Water Prices
A common theme running through this literature is that current water prices are too low
to make RWH an economically viable alternative water supply. Most of the studies with
very negative NPVs and unreasonably long payback periods stated that RWH would be
more viable if municipal water prices were higher (Coombes, Kuczera, & Kalma 2003;
Gardner et al. 2001; Chilton et al. 2000). Hence, more contemporary studies that took
place in regions that have had drastic increases in municipal water prices in the recent
past applied price inflations to their economic analyses (Domènech & Saurí 2011;
Farreny, Gabarrell, & Rieradevall 2011; Imteaz et al. 2011; Rahman, Dbais, & Imteaz
2009). Domènech and Saurí (2011) and Farreny, Gabarrell, and Rieradevall (2011)
assumed annual increases in municipal water prices of 4% and 5%, respectively. Both
studies took place in Barcelona, Spain, and cited average rates of past increase as
evidence for their, admittedly, arbitrary choice. Imteaz et al. (2011) and Rahman, Dbais,
and Imteaz (2009) assumed annual increases in municipal water prices of 15% and 4.5%,
respectively, citing past increases in Melbourne and Sydney to support their choices.
2.3.3.2 Initial Capital Costs
The methods for calculating the initial capital costs of gutters, downspouts, FFDs, storage
tanks, pumps, etc. vary greatly in the literature. Almost all studies put prices on the
storage tank and the pump, but did not include any discussion of costs for the channeling
system that must accompany them. The costs of these components have either been
absorbed into those that were included, or they were ignored entirely. Ghisi et al. (2009),

!
!
24!
Rahman, Dbais, and Imteaz (2009), Sturm et al. (2009), and Liaw and Tsai (2004) are the
exceptions, and presented cost estimations for channeling, roof conversion, or plumbing
modifications. This gap in the economic analyses of these studies can perhaps be
explained by the overwhelming consensus in the literature that the storage tank makes up
the majority of a RWH system’s cost.
2.3.3.3 Maintenance and Operational Costs
There is a strong feeling in the literature that the economic barrier to RWH is in the initial
capital costs, and that maintenance and operational costs are extremely low (Helmreich &
Horn 2008; Martinson & Thomas 2003). Hence, several studies neglected to include
maintenance and operational costs at all 3 (Imteaz et al. 2011; Toronto & Region
Conservation 2010; Sturm et al. 2009; Liaw & Tsai 2004; Chilton et al. 2000). Of the
studies that did include estimations for these costs, many arbitrarily set an annual fee for
anticipated maintenance costs (Domènech & Saurí 2011; Farreny, Gabarrell, &
Rieradevall 2011; Gardner et al. 2001); others broke the costs down by component and
cited replacement cost estimations and frequency necessary (Ghisi et al. 2009; Rahman,
Dbais, & Imteaz 2009; Roebuck & Ashley 2006); and others still gave maintenance cost
estimations per quantity of rainwater captured (Tam et al. 2010; Coombes et al. 2003).
The only operational costs considered in any studies were the electricity costs from
pumping harvested rainwater out of the cistern, and only Domènech and Saurí (2011),
!!!!!!!!!!!!!!!!!!!!!!!!!!!!!!!!!!!!!!!!!!!!!!!!!!!!!!!!3!This decision is supported by various interviews and survey, such as those conducted by Domènech and Saurí (2011), Tam et al. (2010), and Coombes, Kuczera, and Kalma (2003), as well as the survey conducted for this thesis, which all had the owners of RWH systems reporting zero or negligible monetary costs for RWH system maintenance. Although zero does seem impossibly low, the results of the survey for this thesis and the results of Domènech and Saurí’s (2011) interviews revealed that households do not perform many of the recommended maintenance procedures, which, while explaining the low perceived maintenance costs, also brings about new questions of water quality and the lifespans of system components.!

!
!
25!
Farreny, Gabarrell, and Rieradevall (2011), and Rahman, Dbais, and Imteaz (2009)
considered such costs. All studies that assumed municipal water price increases also
applied domestic inflation rates to all maintenance and operational costs (Domènech &
Saurí 2011; Farreny, Gabarrell, & Rieradevall 2011; Imteaz et al. 2011; Rahman, Dbais,
& Imteaz 2009).
2.3.3.4 NPVs and Payback Periods
Domènech and Saurí (2011), Ghisi et al. (2009), Sturm et al. (2009), Roebuck and Ashley
(2006), and Coombes, Kuczera, & Kalma (2003) used the NPV of RWH systems as a
measure of economic viability in their analyses. Meanwhile, Farreny, Gabarrell, and
Rieradevall (2011), Imteaz et al. (2011), Tam et al. (2010), Rahman, Dbais, and Imteaz
(2009), and Gardner et al. (2001) used life cycle costing (LCC), which does not differ
from NPV in principle, but only in the units it is measured, as a measure of economic
viability in their analyses. In addition, Domènech and Saurí (2011), Farreny, Gabarrell,
and Rieradevall (2011), Imteaz et al. (2011), Toronto & Region Conservation (2010),
Sturm et al. (2009), Rahman, Dbais, and Imteaz (2009), Roebuck and Ashley (2006),
Liaw & Tsai (2004), Gardner et al. (2001), and Chilton et al. (2000) used the payback
period for RWH system installation costs, sometimes accounting for maintenance and
operational costs along the way and sometimes not, as a measure of economic viability in
their analyses. The discount rates applied to these economic measurements ranged from
0% to 10% with a mean of 3.9% (median of 3.5%), and many studied considered several
discount rates for sensitivity analysis. The discount periods for which these economic
measurements were studied ranged from 15 to 65 years with a mean of 44.4 years
(median of 50 years).

!
!
26!
2.3.4 Social Value of Harvested Rainwater
At least seven different types of social values have been identified in the literature for
urban harvesting rainwater: (1) decreased need for stormwater management systems; (2)
decreased intensity and frequency of flooding events; (3) decreased need for future
municipal water and sewage distribution networks; (4) decreased energy use for
delivering municipal water and treating sewage; (5) decreased need for future public
works projects to acquire more water; (6) decreased groundwater withdrawal; (7)
decreased dumping and overflow of raw sewage; and (8) increases in quality of life.
Although a few of these social values are discussed in almost every study that conducted
an economic analysis, very few attempts have been made to quantify them.
In regard to the decreased need for stormwater management systems, Coombes et
al. (2000) wrote, “Andoh and Declerck (1999) found that retention and infiltration
measures used as source controls reduced infrastructure maintenance and rehabilitation
cost by a factor of five and also significantly reduced pollution of receiving waters”
(Coombes et al. 2000, p. 10). Along the same lines, Vargas (2009) calculated that Penn
State could decrease its peak stormwater runoff by 52.7% and its total stormwater runoff
volume by 46.1% with RWH, generating 10 to 30 million US dollars in cost savings over
the next 30 years. Ouessar et al. (2004) conducted perhaps the most thorough analysis of
the social valuation of RWH. They found that a combination of RWH and other water-
saving and erosion-preventing technologies in the 336 square kilometer Oued Oum
Zessar watershed of central Tunisia could generate as much as US$645,000 from the
reduction in flood damages to structures that would result, and that investments of this
nature had an internal rate of return (IRR) of 18.4% in this respect (Ouessar et al. 2004).

!
!
27!
In addition, they found that these same technologies and practices could generate as much
as US$847,000 from the groundwater withdrawals that it would offset and the increases
in quality of life that it would cause, and that investments of this nature had an IRR of
26.0% in this respect (Ouessar et al. 2004).
Few other attempts exist, but even the studies that did mention specific social
values explicitly stated that high social values exist for RWH and that future research
should attempt to quantify these values (Angrill et al. 2011; Domènech & Saurí 2011;
Farreny, Gabarrell, & Rieradevall 2011; Kahinda & Taigbenu 2011; Mankad &
Tapsuwan 2011; Jones & Hunt 2010; Toronto & Region Conservation 2010; Abdulla &
Al-Shareef 2009; Chatfield & Coombes 2007; Chilton et al. 2000; Coombes et al. 2000).
2.3.5 Policies to Promote RWH
As an alternative water supply technology being used as part of a toolkit to address a
city’s adaptive water strategies, RWH has a number of advantages and benefits that make
it attractive to both city planners and water consumers: (1) the water itself is free, the
only costs accrue from collection and use; (2) the distribution systems necessary for
rainwater are very small in scale because the point of use is located so close to the source;
(3) the fact that rainwater has zero hardness extends the life of appliances and eliminates
the need for softening processes; (4) the harvesting itself reduces stormwater drainage
and therefore non-point source pollution; (5) the alternative supply decreases the strain on
water utilities to increase the size of water grids and treatment plants; and (6) the smaller
public water networks that results reduce consumer water utility bills, for those
harvesting rainwater, and also for everyone else (Texas Water Development Board 2005;
Coombes et al. 2003; Gardner et al. 2001). In addition to these, there are several
!
!
28!
developing country-specific advantages and benefits to RWH: (7) the water supply is
decentralized and therefore households who are not receiving sufficient water from
public sources can take the acquisition of water into their own hands, without having to
travel long distances; and (8) the fact that harvested rainwater is released slowly
decreases erosion and flooding, and increases groundwater recharge (Kahinda &
Taigbenu 2011; Abdulla & Al-Shareef 2009; Sturm et al. 2009; Ouessar et al. 2004;
Thomas 1998).
In light of these advantages and benefits, national, regional, and local
governments have developed a number of policy instruments for promoting the use of
RWH over the last twenty years. Several motivations and a variety of outcomes have
resulted. The following section reviews the literature on such policies. These case studies
are by no means the only countries with rainwater-promoting policies, but selections
from a broader literature.
2.3.5.1 Germany
The earliest set of government policies that set out to promote RWH were enacted in
Germany during the early 1990’s. Various city councils, such as the Hansestadt
Hamburg, began adopting rainwater-supportive policies by choosing to use decentralized
cisterns and rainwater catchments for public schools, and encouraging private enterprise
and industry to adopt these water-saving technologies with tax incentives and subsidies
(Toronto & Region Conservation 2010; Herrmann & Schmida 2000). Although the
original catalyst that popularized RWH in Germany was almost certainly based on the
environmental concerns of forward-thinking people, the technology appealed to
governments because of the stormwater abatement and associated savings it caused

!
!
29!
(Herrmann & Schmida 2000). Environmentalists, scholars, and politicians alike were not
sure that RWH was economically feasible at the household level, but they understood
very well the social values it would generate (Herrmann & Schmida 2000). Nonetheless,
in 1995, the Fachvereinigung Betriebswassernutzung (FBR) was formed in Frankfurt as
the principle pressure group for lobbyists, consultants, and RWH manufacturers, and by
1999 pre-fabricated rainwater tank manufacturers had reported over 10,000 cistern sales,
many to single-family households (Toronto & Region Conservation 2010; Herrmann &
Schmida 2000). RWH not only proved to be an excellent investment from a societal
perspective, but also an attractive financial venture for households, at least once a subsidy
was offered to them (Toronto & Region Conservation 2010; Herrmann & Schmida 2000).
2.3.5.2 Australia
With a similar motivation as Germany of using RWH to aid in storwmwater management
(SWM) and decrease flooding, the city of Newcastle, Australia commissioned Peter J.
Coombes in 1999 to help design the RWH system of a new suburban development,
Figtree Place (Coombes et al. 2000). Working within the newly developed paradigm of
water sensitive urban development (WSUD), the Newcastle City Council and Coombes
set goals that rainwater would satisfy 50% of hot water and toilet demand, 100% of
domestic irrigation needs, and 100% of car-washing needs (Coombes et al. 2000). These
same rainwater tanks would act as retention tanks for stormwater, reducing downstream
flooding, the strain on stormwater infrastructure, and water pollution resulting from
combined sewer system overflow (Coombes et al. 2000). In addition, and most
importantly, Figtree Place would serve as a pilot project and RWH experiment (Coombes
et al. 2000).

!
!
30!
In 1999 and 2000, many of Australia’s largest, low-lying cities in the flood plains
of New South Wales and Queensland began following Newcastle’s example and adopting
rainwater-promoting policies (Tam et al. 2010). In the context of the severe restrictions
and conservation policies for water use that had come before, the regional and state
policies that became popular, requiring the installation of RWH systems in new homes
and offering cash rebates for retrofits, were well-received by Australians (Tam et al.
2010). By 2001, 16% of Australian households used rainwater tanks in their homes (Tam
et al. 2010). Australian consultants and proponents of RWH had perceived that this
technology could act to alleviate both their droughts and their floods, and they succeeded
in negotiating a set of policies that would accomplish it (Tam et al. 2010).
2.3.5.3 Spain
For the last 100 years Spain has followed in the traditional western paradigm of dams and
large inter-basin transfers to ensure sufficient supply and economic development
(Domènech & Saurí 2011). However, this paradigm is coming to end, especially in semi-
arid regions like Spain, as large cities run out of dams and basins to transfer water from.
The last of such projects for the Metropolitan Area of Barcelona (MAB) was abandoned
by the regional government in 2001 in favor of desalination and RWH opportunities
(Domènech & Saurí 2011). In 2002, Sant Cugat del Vallès (SCV) was the first
municipality in Spain to approve a building code that required buildings with more than
300 square meters of garden space to install RWH systems (Domènech & Saurí 2011). In
addition, SCV offered subsidies to households installing RWH systems of up 1,200 Euros
but never exceeding 50% of the total system cost (Domènech & Saurí 2011). Since then,
over 40 other municipalities in Catalonia have passed regulations to promote RWH

!
!
31!
(Domènech & Saurí 2011). An analysis of these policies conducted by Domènech and
Saurí in 2011, concluded that such subsidies are an extremely effective way to encourage
and support the use of RWH systems.
2.3.5.4 Developing Countries
Studies by Ghisi et al. (2009; 2007; 2006) in Brazil, by Kahinda et al. (2011; 2010; 2007)
in South Arfica, by Sturm et al. (2009) in Namibia, and by Ouessar et al. (2004) in
Tunisia have all analyzed the potential water supplies that RWH could offer these water-
stressed countries. However, a combination of financial, technical, and institutional
limitations have made it very difficult to introduce policies to promote RWH, and,
without government aid, the large capital investments required to install a RWH system
are unaffordable to the majority of households (Kahinda, Taigbenu, & Boroto 2010;
Ghisi et al. 2009). Nonetheless, several policy programs have flourished. Thomas (1998)
reviewed the large-scale programs that China introduced in the Hebei Province and
elsewhere during the mid-1990’s. Funding targets were set such that each household
benefitting from community-wide roof and courtyard RWH systems would only have to
invest about US$100 (Thomas 1998). Within a few years, over 100,000 rural and
suburban households were involved and benefitting (Thomas 1998).
2.3.6 Barriers to Implementation
Various barriers to RWH have been identified in the literature. Domènech and Saurí
(2011) and Ward (2009) cited cultural barriers such as the perception of harvested
rainwater quality or the lack of as being important in limiting RWH. Basinger et al.
(2010) and Martinson and Thomas (2003) cite technical barriers as the most powerful in

!
!
32!
limiting RWH implementation. Meanwhile, Domènech and Saurí (2011), Farreny et al.
(2011), Kahinda and Taigbenu (2011), Kahinda, Taigbenu, and Boroto (2010), Abdulla &
Al-Shareef (2009), Ghisi et al. (2009), Gardner et al. (2001), Chilton et al. (2000), Turner
(2000), and Thomas (1998) treated economic barriers such as the large initial
investments required as the greatest force working against RWH adoption. Anand and
Apul (2011), Domènech and Saurí (2011), Farreny, Gabarrell, and Rieradevall (2011),
Basinger et al. (2010), and Tam et al. (2010) found that institutional and administrative
barriers from the lack of regulations and guidelines on installation, use, and maintenance
of RWH systems was limiting their adoption, whereas Kahinda and Taigbenu (2011),
Toronto & Region Conservation (2010), and Kahinda, Taigbenu, & Boroto (2007) stated
that various legal and regulatory barriers such as zoning laws and building codes were
holding RWH implementation back. Hence, the barriers to RWH seem to be very
dependent on location, illustrating the need for an analysis of Oaxaca’s barriers to RWH
in specific.

!
!
33!
Chapter 3: Model and Methods
The water supply system of Oaxaca de Juárez differs in several ways from other urban
areas studied in the literature, and these differences support the need for Oaxaca-specific
data collection and for a novel approach to RWH modeling.
Because the tariff for municipal, piped water varies drastically between households, and
because households already have a wide range of water storage capacities at their
disposal, household-by-household data is needed to properly estimate RWH potential.
The following chapter presents the survey and model that were developed in order to
collect and analyze these data, and assess Oaxaca’s RWH potential.
3.1 The Survey Process
In order to randomly choose a survey sample from Oaxaca’s population, ArcGIS was
used to randomly select 100 survey points within the “urban area” defined by the Instituto
Nacional de Estadística y Geographía (INEGI). Over a five-week period, 45 of these 100
households were successfully surveyed4. Depending on which sources of water, which
type of storage capacity in use, and whether they already harvested rainwater, households
were asked between 46 and 99 questions. Some questions targeted household
demographics, with the idea of having the necessary control information to run
regressions, but most focused on current water use, current storage capacity, current
!!!!!!!!!!!!!!!!!!!!!!!!!!!!!!!!!!!!!!!!!!!!!!!!!!!!!!!!4!A discussion of the reasons for excluding the other 55 households can be found in Appendix I.!

!
!
34!
RWH practices, RWH potential, RWH perceptions, and interest in/willingness to use
harvested rainwater as a household water supply5.
3.2 Model for RWH Storage Dynamics
The dynamic RWH model used in this study has three steps: calculating the
unconstrained RWH potential, estimating short-term constraints on capacity, and
estimating long-term constraints on capacity. Each step is presented in the following
section.
3.2.1 Unconstrained RWH Potential
The unconstrained RWH potential is defined simply as the amount of rainfall that could
be harvested if households had gutters, downspouts, and all other RWH system
components, and were also not constrained by rainwater storage capacity. Under such
conditions, the potential RWH is a function of the size of each household’s catchment
area, the average monthly rainfall, and a standard runoff coefficient, such that:
!!" = ! ∗ !! ∗ !!
where !!" is the unconstrained RWH potential of household j in month i (liters), K is the
splash off/evaporation/runoff coefficient, !! is the average monthly rainfall in month i
(millimeters), and !! is the catchment area of household j (m2).
!!!!!!!!!!!!!!!!!!!!!!!!!!!!!!!!!!!!!!!!!!!!!!!!!!!!!!!!5!A full copy of these questions can be found in both English and Spanish in Appendices J and K, respectively.!

!
!
35!
3.2.1.1 Splash Off/Evaporation/Runoff Coefficient
The literature uses a range of values from 0.7 to 0.95 (Farreny et al. 2011), with 0.8, 0.85,
and 0.9 being the most common by far (Domènech & Saurí, 2011; Farreny et al. 2011).
Evidence has shown that the quantity of runoff depends on roof material, roof slope, and
atmospheric conditions (Farreny et al. 2011; Abdulla & Al-Shareef, 2009). Regardless of
roof material and roof slope, 0.85 was chosen as the simplifying runoff coefficient for all
households in this study.
3.2.1.2 Mean Monthly Rainfall
The rainfall data in this model is based on information combined from two
meteorological datasets each compiled by the Comision Nacional del Agua 6
(CONAGUA). The resulting rainfall profile for Oaxaca is shown in Table 3.1 below:
Table 3.1: Mean monthly rainfall in Oaxaca de Juárez
Month Rainfall (mm) Jan 2.38 Feb 7.02 Mar 14.54 Apr 40.11 May 87.64 Jun 157.24 Jul 114.83 Aug 107.53 Sep 125.26 Oct 51.87 Nov 9.21 Dec 3.36
TOTAL 721.00 !!!!!!!!!!!!!!!!!!!!!!!!!!!!!!!!!!!!!!!!!!!!!!!!!!!!!!!!6!The two datasets used, from meteorological stations within the urban area of Oaxaca, have rainfall data from as early as 1952 and 1981 on, respectively. Both datasets show the millimeters of rainfall during each month for every year until 2008; however, but both contain significant data gaps. The dataset from 1952 on is missing 41 of 672 data points (6.1%), in addition to three entire years of data (an additional 5.4%). The dataset from 1981 on is missing 23 of 324 data points (7.1%).!
!
!
36!
3.2.1.3 Catchment Area
The size of each household’s catchment area was collected during the survey process.
Each respondent was asked to draw a picture of their roof, indicate which part of it they
used for RWH, and place approximate dimensions wherever appropriate. Depending on
the RWH scenario, either the catchment area they indicated using or the catchment area
at their disposal was used.
3.2.2 Short-Term Storage Constraints
In the presence of short-term storage constraints, the RWH potential of household j in
month i is given by:
!!" = !"# !!" , (!! + !!) ∗ !!
where !!" is the RWH potential limited by short-term storage capacity (liters), !! is the
short-term storage capacity of household j (liters), !! is the additional storage capacity
invested in by household j (liters), and !! is the mean number of “days with rain” in
month i (days).
3.2.2.1 Short-Term Storage Capacity
The quantity of short-term storage that each household used for RWH and the quantity of
low-gravity storage that each household had at their disposal, i.e. potential short-term
storage, were collected in the survey. Depending on the RWH scenario, either the short-
term storage used or the short-term storage potential was used.
3.2.2.2 Additional Storage Capacity
Using Microsoft Excel’s “Solver” tool, it was found that some households could increase
the net present value (NPV) of their RWH system by purchasing additional storage. This

!
!
37!
quantity of additional storage invested that households are assumed to be willing to
purchase changes depending on the RWH scenario.
3.2.2.3 “Days With Rain”
The number of “days with rain” is derived from a single CONAGUA dataset from one of
the two meteorological stations in Oaxaca7. Means were taken to get the average number
of “days with rain” for each month. The standard deviations are also reported in order to
present the wide variation in this dataset. The results can be seen below in Table 3.2
below:
Table 3.2: “Days with Rain”
Month Mean number of “days with rain”
Standard deviation of the number of “days with rain”
Jan 0.40 0.82 Feb 2.29 3.24 Mar 2.35 1.87 Apr 5.25 3.60 May 10.50 5.46 Jun 15.08 4.11 Jul 15.08 4.51 Aug 16.63 4.48
Sep 15.96 3.87
Oct 6.96 3.95
Nov 2.05 1.94
Dec 2.00 4.93
3.2.3 Long-Term Storage Constraints
Long-term storage constraints require a daily dynamic analysis. Assuming twelve months
of thirty days each, the number of “days with rain” was rounded down to the nearest
!!!!!!!!!!!!!!!!!!!!!!!!!!!!!!!!!!!!!!!!!!!!!!!!!!!!!!!!7!The number of “days with rain” in each month was recorded from 1981 to 2008, but is missing 50 of its 324 data points (15.4%). Means were taken ignoring the missing data points.!

!
!
38!
factor of 30 (i.e. the 16.63 days of rain in August was rounded to 15), such that it rained
every (30/!!) days, and the remainder from rounding was added to the first “day with
rain.” In this way, the quantity of water in short-term storage is calculated on a daily
basis:
!!"!"! = !"# !! , (!! + !!)
where, !!"!"! is the quantity of water in short-term storage on day d (liters), !! is the
rainfall on day d (millimeters), !! is the short-term storage capacity of household j
(liters), and !! is the additional storage capacity invested in by household j (liters).
Assuming that at the end of every day, the household empties the water in the
short-term storage tanks into long-term storage tanks, the quantity of water in long-term
storage is calculated on a daily basis:
!!"!"# = !"# !"# !! !!!!"# + !!"!"! − !!" , 0 , !! + !!
where !!"!"# is the quantity of water in long-term storage on day d (liters), !!" is the daily
water consumption of household j (liters), and !! is the long-term storage capacity of
household j (liters).
3.2.3.1 Daily Household Consumption
Daily household water consumption is information taken directly from the survey, and it
assumes constant daily consumption by households throughout the year.
3.2.3.2 Long-Term Storage Capacity
Long-term storage capacity is also information taken from the survey. Households were
asked to report the quantity of long-term storage used for RWH, and the quantity of high-

!
!
39!
gravity storage not currently used for RWH that could potentially be used as long-term
storage. Depending on the RWH scenario, either the current long-term storage of the
long-term storage potential was used.
3.2.3.3 Long-Term Storage Loss (Overflow)
On occasion, a household’s long-term storage will reach capacity, preventing them from
capturing any more rainwater. If this happens, the household will incur a long-term
storage loss due to overflow such that:
!!" = !"# !!(!!!)!"# + !!"!"! − !!" − !! − !! , 0
where !!" !is the long-term storage overflow on day d (liters).
3.2.4 Constrained RWH Potential
The RWH potential limited by both short-term storage capacity and long-term storage
capacity will therefore be the sum of all quantities of short-term storage minus the sum of
all quantities of long-term storage loss, as follows:
!! = !!"!"! −!"#
!!!!!"
where !! is the annual RWH potential of household j limited by short-term storage
capacity and long-term storage capacity.
3.3 Important Model Assumptions
A large degree of environmental variability is absent from this model. Most studies in the
literature use computer-programming tools such as RainCycle™ to make more
complicated models that incorporate such environmental variability, but monetary and

!
!
40!
temporal constraints prevented their incorporation in this study. The simplified model
employed instead forces a set of assumptions that limit both the quality of the model and
of its results8.
3.3.1 Unconstrained RWH Potential
The first step of this model makes two important assumptions. First, due to inadequate
data collection and insufficient researcher knowledge, the entirety of the catchment area
reported by household respondents is assumed to be appropriate for RWH. This
assumption will generally lead to an overestimation of household RWH potential. The
second assumption made in the first step of this model is that the splash
off/evaporation/runoff coefficient of 0.85 is assumed to be appropriate for all roof
materials and slopes. This could result in either an over- or underestimation of household
RWH potential, depending on catchment area and locational characteristics.
3.3.2 Constrained RWH Potential
There are four important assumptions made in the second and third steps of the model,
most of which stem from the limitations inherent in the data available, and also in the
computational abilities of Microsoft Excel. They are listed below:
1. The “days with rain” are spaced evenly across each month. 2. Each “day with rain” consists of a single rain event. 3. All rain events are of equal size. 4. All households perform basic RWH system maintenance
The first of these assumptions is likely to lead to an overestimation of RWH potential
because, if the “days with rain” were spaced less evenly, there would be more loss in
!!!!!!!!!!!!!!!!!!!!!!!!!!!!!!!!!!!!!!!!!!!!!!!!!!!!!!!!8!It is the author’s intention to conduct a more detailed analysis that would include such environmental variability later, using MathWorks’ MATLAB to build a multi-iteration rainfall generator into the model.!
!
!
41!
long-term storage due to overflow. The second assumption may, in some cases, cause an
underestimation of RWH potential for households vigorously emptying their short-term
storage into long-term storage. The third assumption acts to overestimate the RWH
potential of all households except those with large quantities of short-term storage
because, if rain events varied in size, the short-term storage losses would be greater. The
basic RWH system maintenance discussed to in the fourth assumption refers to
households emptying their short-term storage into long-term storage, if they do not have a
mechanized way of doing so. Failure to do this would cause greater short-term storage
losses, making the model likely to overestimate the RWH potential of households
collecting rainwater in buckets, particularly in the current RWH practices scenarios.
3.4 Model for RWH Economics
The RWH economics model developed for this thesis takes the output !! (the quantity of
rainwater household j could potentially capture annually) from the RWH dynamics model
and turns it into three economic measurements commonly found in the literature: (1) the
water savings efficiency (WSE) attained by household j when capturing !!; (2) the
payback period for RWH system improvements that would bring household j to !!; and
(3) the net present value (NPV) of household j’s RWH system. These measurements of
the economic viability of RWH use the prices that households are currently paying for
water to value the rainwater harvest, calculating the cost-savings from public and private
water sources that RWH offsets for a ten-year period. Further discussion of how these
prices were calculated and used can be found in Appendix C.

!
!
42!
3.4.1 Inputs for Six Model Scenarios
The model for RWH storage dynamics and the model for RWH economics were run six
times, using a different RWH scenario each time. Three scenarios involving different
RWH system components were run in two different price scenarios for a total of six. The
following section describes the inputs used for each scenario.
3.4.1.1 Model Inputs: Scenarios 1, 2, & 4 vs. Scenarios 4, 5, & 6
While scenarios 1, 2, and 3 use the water prices households are currently paying,
scenarios 4, 5, and 6 assume a price increase over the period. Five or six years from now,
the large dam Southwest of the city, Paso Ancho, is scheduled for completion, and a
drastic price increase in publicly supplied water is expected to follow (Consejo 2011;
Vervaeke 2011). The city currently subsidizes public water heavily. While some estimate
that the city is subsidizing about 65% of public water service costs (“Honorable
Ayuntamiento of Oaxaca de Juárez” 2005), other experts estimate that the city foots
about 90% of most household’s water bills (Juan José Consejo 2011; Willem Vervaeke
2011). Though there have been indications for a long time that the city plans to raise
public water tariffs by at least a factor of three (“Honorable Ayuntamiento of Oaxaca de
Juárez” 2005), the director of INSO, Juan José Consejo (2011), suspects that, once Paso
Ancho is completed, the city will raise public water tariffs by a factor of eight. The city
has done nothing to begin recouping to high capital costs of the dam, and sooner or later
it will need to adjust public water tariffs accordingly (Juan José Consejo 2011; Willem
Vervaeke 2011).
Scenarios 4, 5, and 6 are therefore meant to account for the probable result of the
dam being completed. Hence, current water prices are used for the first five years of the

!
!
43!
ten-year period of RWH considered, but inflated prices are applied to the last five years.
In addition, the dam completion is ostensibly going to increase the supply of public water
dramatically, providing enough water to meet not only the entire city’s current demand,
but also the projected increase over the next 20 years (Juan José Consejo 2011; Willem
Vervaeke 2011). Hence, each household’s water supply distribution is assumed to shift,
acquiring more water from public sources than before. Details on price inflations and
supply distribution shifts can be found in Appendix C.
3.4.1.2 Model Inputs for Scenarios 1 & 4: Current Practices
Scenarios 1 and 4 estimate the quantity and value of harvested rainwater currently being
captured in Oaxaca. Therefore, the rainwater harvest, and, subsequently, the current and
projected future values of their harvest, are calculated in Scenarios 1 and 4 using the
short-term storage capacity, the long-term storage capacity, and the catchment area that
households reported utilizing for their RWH systems in the survey.
As stated above, Scenario 1 assumes constant water prices and constant water
supply distributions, whereas Scenario 4 uses a two time-period model with inflated,
post-dam water prices and adjusted water supply distributions in order to reflect the
probable outcome of the dam being completed. Because these scenarios are meant to
reflect current practices, there are no improvement costs to households and, thus, no
payback period for recouping the investment. However, the WSE and the NPV of each
household’s RWH system are calculated.
3.4.1.3 Model Inputs for Scenarios 2 & 5: Basic RWH System Improvements
Scenarios 2 and 5 estimate the RWH potential of households if they were to: (1) adjust
their rainwater use practices to put rainwater to every end use other than drinking; (2)
!
!
44!
make the relatively small investment of outfitting their home with gutters, downspouts,
first-flush diverters (FFDs), and a pump, if they do not already have them; and (3) apply
to RWH only the water storage units they currently use for rainwater, but purchase
additional storage units for RWH in order to maximize the NPV of their RWH system. In
this hypothetical exercise, it is assumed that households will be willing to adjust their
perceptions of and practices with rainwater as indicated above, and the model does not
make any allowance for households that would be unwilling to enact these changes. The
investments in basic RWH improvements and addition storage units outlined above,
however, are fully taken into consideration. Details on how these investment costs were
calculated can be found in Appendix D.
Many households use only a small portion of their available catchment area for
RWH. The simple additions of gutters, downspouts, FFDs, a pump, and, in some cases,
additional water storage, would allow household to use the entirety of their catchment
areas and bring almost every household in Oaxaca much nearer to its full RWH potential.
Thus, the annual rainwater harvest, and, subsequently, the current and projected future
values of their harvest, are calculated in Scenarios 2 and 5 using the full catchment area
at households’ disposals, but only the portions of their short-term storage capacities and
long-term storage capacities that they reported using for RWH in the survey, plus any
additional storage that would increase the NPV of their RWH system.
3.4.1.4 Model Inputs for Scenarios 3 & 6: Applying Entirety of Storage to RWH
Most households currently devote only a small portion of their water storage capacity to
RWH. As in Scenarios 2 and 5, the object of Scenarios 3 and 6 is to model the potential
RWH that could occur if households were to: (1) adjust their rainwater use practices to

!
!
45!
put rainwater to every end use other than drinking; and (2) make the relatively small
investment of outfitting their home with gutters, downspouts, FFDs, and a pump, if they
do not already have them. However, unlike Scenarios 2 and 5, Scenarios 3 and 6 also
assume that all households have begun using all the water storage capacities at their
disposal for RWH, as some households already do, in addition to any added storage that
would increase the NPV of their RWH systems.
Thus, the annual rainwater harvest, !! , and, subsequently, the current and
projected future values of their harvest, are calculated in Scenarios 3 and 6 using the full
catchment areas, short-term storage capacities, and long-term storage capacities at
households’ disposals, plus any additional storage that would increase the NPV of their
RWH system.
3.4.2 Model Equations
The following section presents the equations for WSE, NPV, and payback period used in
the model.
3.4.2.1 Water Savings Efficiency (WSE)
WSE is defined in the literature as the percent of current consumption that a household
could offset with harvested rainwater (Domènech & Saurí 2011; Roebuck & Ashley
2007; Villarreal & Dixon 2004; Coombes et al. 2000). It is calculated as follows in this
model:
!
!

!
!
46!
!"#! =!!!!
where !"#! is the WSE attained by household j, !! is the annual rainwater harvest of
household j (liters), and !! !is the annual water consumption of household j (liters).
3.4.2.2 Net Present Value (NPV)
Many components of a RWH system have a lifespan of about 5 to 15 years (Farreny,
Gabarrell, & Rieradevall’s 2011; Imteaz et al. 2011; Tam et al. 2010; Toronto & Region
Conservation 2010; Ghisi et al. 2009; Sturm et al. 2009; Liaw & Tsai 2004; Chilton et al.
2000). In order to reflect this probable depreciation, a ten-year time period was chosen
for this analysis. Discount rates of 0% to 10% can be found in the literature (Domènech
& Saurí 2011; Rahman, Dbais, & Imteaz 2009; Sturm et al. 2009), but, in the face of the
current economic downturn, Mexico’s Central Bank has been holding the nominal
interest rate at 4.5% (Trading Economies 2012). With a consumer price index ranging
from 3.1% to 4.1% and with an average of about 3.5% over the last year (Global-Rates
2012), the real interest rate is likely to be somewhere between 0.4% and 1.4%. However,
a conservative estimate of 3% was applied to this model. Hence, the NPV of a household
j’s RWH system is the sum of ten years of rainwater harvest’s values, discounted to their
present value at a rate of 3%. For Scenarios 1, 2, and 3, which assume constant water
pricing during the ten-year period, the NPV is calculated as is shown below:
!"#! =!!! 1− 1
(1+ !)!"
where !"#! is the NPV of household j’s current RWH system (pesos)—holding water
prices constant, !! is the current value of household j’s annual rainwater harvest (pesos),

!
!
47!
and ! is the discount rate. For Scenarios 4, 5, and 6, which assume post-dam price
inflation for second half of the ten-year period, the NPV is calculated as is shown below:
!
!"#$! =!!! 1− 1
(1+ !)! + !"!! 1− 1(1+ !)!" − !!!! 1− 1
(1+ !)!
where !"#$! is the NPV of household j’s current RWH system (pesos)—assuming post-
dam price inflation, !"! is the projected future value of household j’s annual rainwater
harvest (pesos), and ! is the discount rate.
3.4.2.3 Payback Period (PBP)
The payback period is defined as the number of years it would take a household to recoup
its investment in RWH system improvements. For Scenarios 1, 2, and 3, which assume
constant water pricing over the ten-year period, the payback period is calculated as
follows, applying the same discount rate of 3%:
!"!! = − log!!! 1− !! ∗!!!
where !"!! is the number of years required to recoup investment !! (years), !! is the cost
of basic RWH system improvements for household j (pesos), !! is the current value of
household j’s annual rainwater harvest (pesos), and ! is the the discount rate. Details on
how the basic improvement costs and added storage costs were calculated can be found in
Appendix D.
For Scenarios 4, 5, and 6, which assume post-dam price inflation for the second
half of the ten-year period, the payback period is calculated as follows:

!
!
48!
if
5 ≥ − log!!! 1− !! ∗!!!
then
!"!! = − log!!! 1− !! ∗!!!
but if
5 < − log!!! 1− !! ∗!!!
then
!"!! = 5− log!!! 1− !! −!!! ∗ 1 − 1
1 + !5
∗ !!"!
where !"! is the projected future value of household j’s annual rainwater harvest (pesos).

!
!
49!
Chapter 4: Results
4.1 Survey Results
The results from the survey have been used to evaluate the hypothesized barriers to RWH
implementation and improvement. They show that the cultural barriers and technical
barriers are not significant obstacles to RWH in Oaxaca, that informational barriers pose
a substantial obstacle, and that household interest in and willingness-to-pay (WTP) for
RWH improvements is high, indicating that economic barriers can be overcome. The
following section presents summary survey results for a selection of the questions that
inform a hypothesized barrier. Further summary survey results to other questions can be
found in Appendix E.
4.1.1 Demographics and General Water Use
Based on the 45 surveys, the average household was found to have 4.42 residents9, an
annual non-potable water consumption of 57,698 liters, or 38 liters per person per day
(pppd), and an annual income of 104,907 pesos. These figures are comparable to with
data from other sources (Lusher 2007; “Honorable Ayuntamiento of Oaxaca de Juárez”
2005; CNA 1993), indicating that the sample population of this study is a fairly accurate
representation of the larger, Oaxacan population. These data imply that the average
household consumes about 167 liters of non-potable water per day. Adding Lusher’s
(2007) estimation of 13 liters of potable water per household per day to this gives a total
!!!!!!!!!!!!!!!!!!!!!!!!!!!!!!!!!!!!!!!!!!!!!!!!!!!!!!!!9!The Instituto Nacional de Estadística y Geografía (INEGI) found in 2005 that the average household had 5 occupants, which is not unreasonably far from the survey finding.!

!
!
50!
per household per day water consumption of 180 liters10. A piece of information for
which no corollary was found in the literature is that the total yearly expenses for the
average household were estimated to be 134,213 pesos, of which 1.85% (2,487 pesos)
was for non-potable water consumption and 2.57% (3,448 pesos) was for potable water
consumption11.
The results also revealed the percentage of surveyed household that received
water from each water source, and the portions of their consumption that each water
source provided (Table 4.1).
Table 4.1: Water Supply Distribution
Water Source
% of Households Receiving
from Source
Mean % of Consumption Supplied
by Source for HHs receiving from Source
Mean % of Consumption
Supplied by Source for All HHs
ADOSAPACO 91.1% 75.3% 69% Public Water Trucks 28.9% 14.6% 4% Private Water Trucks 75.6% 22.5% 17% Public Wells 2.2% 50.0% 1% Private Wells 11.1% 7.5% 1% RWH Systems 84.4% 10.9% 9% SUM=100%
4.1.2 Households Water Storage Capacities and Pumps
Due to the unusual and unreliable water supply system in Oaxaca, it is very important for
households to have their own water storage units. Nonetheless, 1 of the 45 surveyed
households (2.2%) had no cisterns and no tinacos at their disposal, only a collection of
!!!!!!!!!!!!!!!!!!!!!!!!!!!!!!!!!!!!!!!!!!!!!!!!!!!!!!!!10!In comparison, the Comisión Nacional del Agua (CNA) estimated the average daily household water consumption at 181 liters in 1993.!11!Total yearly expenses and annual potable water expenses were based on Lusher’s (2007) finding that the average household consumes 1 garrafon per person per week, and the author’s own experience of the average garrafon price being 15 pesos, as opposed to Lusher’s (2007) finding of 13 pesos.!

!
!
51!
buckets amounting to about 100 liters. Unsurprisingly, this minuscule quantity of storage
limited this household’s water consumption and their quality of life dramatically. All 44
other households had at least one tinaco and/or a collection of tambos (large buckets of
generally 200 liters) amounting to at least 500 liters. Less common was for households to
have a cistern, with only 24 of 45 households (53.3%) reporting ownership.
The average water storage capacity held by households with tinacos was 2,431
liters. For cisterns it was 7,318 liters. Generally, tinacos were made of plastic, but
asbestos was common as well and cement rare. Cisterns were almost always made of
cement, but brick and cement composites, as well as plastic, could be found occasionally.
With the exception of one household’s 1,230-liter cistern, all tinacos and cisterns were
covered almost all the time, limiting outside contamination and preventing mosquito
larvae from infesting the supply. The fact that households already have so much storage
at their disposal is very favorable to RWH, and has the potential to decrease any
economic barriers that might exist.
32 of 45 of the surveyed households (71.1%) stated that they would benefit from
having more water storage capacity than they currently do. 20 of these 32 (62.5%)
expressed an intent to purchase more storage in the near future. Most did not know
exactly what they planned to purchase, but many had a specific size of tinaco or cistern in
mind, and one household even expressed the intent to purchase a second, larger cistern
specifically for their RWH system. Although 33 of 45 households (73.3%) reported that
they had space to increase their storage capacity by putting a cistern in their yard12, 11 of
!!!!!!!!!!!!!!!!!!!!!!!!!!!!!!!!!!!!!!!!!!!!!!!!!!!!!!!!12!It should be noted that a common barrier to installing cisterns is soil geology. It makes the cost of excavation, which is often a significant portion of the total cost, highly variable (Sanchez 2011). In some cases, it is so expensive that households are forced to build their cisterns aboveground, which requires more space, and sometimes prevents the building entirely (Sanchez 2011). These details were not made clear to

!
!
52!
these 33 (33.3%) were households that had stated they would not benefit from additional
water storage capacity. This leaves 22 households of the 32 that said they would benefit
from additional storage (68.8%), who also said they have the space necessary for a
cistern.
Similarly, 25 of 45 households (55.6%) reported that they would be able to
increase their storage capacity by placing additional tinacos on their roofs. However, 8 of
these 25 (32.0%) were households that had stated they would not benefit from additional
water storage capacity. As with cisterns, this leaves only 17 of the 32 that said they would
benefit from additional storage (53.1%), who also said they have the capacity to place
additional tinacos on their roofs13. Synthesizing the two tells us that 29 of the 32
households (90.6%) that said they would benefit from increased storage can indeed
increase their storage, one way or another. Because space constraints were one of the
principle technical barriers hypothesized, this indicates that only 9.4% of the surveyed
households would be likely to face a significant technical barrier to RWH.
31 of 45 of the surveyed households (68.9%) owned an electric pump, which was
usually used for bringing water from low-elevation storage units to high-elevation storage
units. 10 of the households that did not own a pump of any kind (22.2% of total) received
sufficient pressure from their ADOSAPACO connection and/or water trucks to conduct
the water to their rooftop storage tanks, making a pump unnecessary. The other 4
households without a pump (8.9%) did not own one because they did not have rooftop
!!!!!!!!!!!!!!!!!!!!!!!!!!!!!!!!!!!!!!!!!!!!!!!!!!!!!!!!!!!!!!!!!!!!!!!!!!!!!!!!!!!!!!!!!!!!!!!!!!!!!!!!!!!!!!!!!!!!!!!!!!!!!!!!!!!!!!!!!!!!!!!!!!!!!!!!!!!!!!!!!!!!!respondents, and it is not known whether they had a belowground or aboveground cistern in mind when they said, “yes,” they have the space for one. Hence, some yeses could be no’s and vice versa. The degree of correctness here is expected to be low.!13!The most common reason cited by respondents for not being able to place additional storage on their roofs was a simple weight limitation. Water is heavy and it seems that many roofs were already at their weight capacity in Oaxaca.!

!
!
53!
storage or a water-distributing pipe system to carry water from roof to faucets. In fact,
they had no faucets at all, and instead took water from their storage tanks by hand. Like
the 9.4% that may not have space to increase their storage capacity, this 8.9% of the
surveyed households represent the minority that would possibly face technical barriers to
RWH.
4.1.3 RWH System Components
Parker (2010) and INSO’s previous research had concluded that, although the people of
Oaxaca thought highly of harvested rainwater quality, sophisticated harvesting systems
were not on their radar (Consejo 2011). However, survey results revealed that 38 of 45
households (84.4%) were capturing rainwater in at least a very basic capacity, although
often out of necessity. The range of levels at which RWH occurs in Oaxaca can be
summarized easily by examining the portions of the sample that use each of the following
RWH system components: gutters, downspouts, FFDs, long-term storage units, and post-
storage filtration (Table 4.6).
Table 4.2: Use of RWH System Components
System Component # of
Households that Use It
% of Households that Use It
Gutters 17 37.8% Downspouts 16 35.6% FFDs 1 2.2% Long-term Storage 7 15.6% Post-Storage Filtration 5 11.1%
Only 5 of 45 households (11.1%) had relatively sophisticated RWH systems with gutters,
downspouts, and long-term storage, and only one of these had FFDs as well. The large
majority of households capturing rainwater were therefore doing so using what Oaxacans

!
!
54!
called the “rustic method”—capturing water in buckets and bins directly from the roof,
with no gutters and downspouts to attain a high rate of capture, no FFDs or other
filtration and treatment techniques to guarantee a certain water quality level, and no long-
term storage to make the supply last into the dry season. Although the “rustic method”
clearly has serious limitations, these results show that there is much more RWH taking
place than previously imagined.
4.1.4 Harvested Rainwater Quality and Uses
When respondents were asked to rate the quality of the rainwater from their RWH
system, or, for those that did not have one, their perception of the quality of water from a
RWH system, on a 1 to 5 Likert scale, where 1=very bad, 2=bad, 3=mediocre, 4=good,
and 5=very good, they replied as follows:
Table 4.3: Quality of Harvested Rainwater
Quality Rating
# of HHs giving rating
% of HHs giving rating
1 0 0.0% 2 3 6.8% 3 6 13.6% 4 34 77.3% 5 1 2.3%
Despite the fact that respondents rated the quality of harvested rainwater very highly, the
end uses to which households felt comfortable putting their rainwater were very limited,
indicating a disconnect between the perceptions of quality and use. It is possible that this
results from cultural barriers to RHW, but this thesis theorizes that much of this
disconnect can be explained by the rustic methods with which people are currently
capturing rainwater in Oaxaca.

!
!
55!
The work of Lee et al. (2010), Morrow et al. (2010), Chang et al. (2004), and
Simmons et al. (2001) in isolating background contamination in harvested rainwater from
catchment or system-based contamination concludes that the likelihood and level of
contamination in entirely untreated and unfiltered rainwater is high. Contamination from
atmospheric deposition, leaching of roof materials, and animal feces is very possible in
“rustic” RWH systems, and since most households seem well aware of these risks, it is
not surprising that the number of end uses they feel comfortable putting harvested
rainwater to is so small. Even the households with sophisticated RWH systems generally
use their rainwater for nothing more than watering their gardens, flushing their toilets,
and general cleaning. Those that use rainwater for bathing, doing laundry, and even
cooking do so out of necessity because their other water sources do not sufficiently
supply their needs. If more modern and sophisticated RWH methods were employed, it is
posited that the number of end uses households felt comfortable with would be very
likely to rise, closing this disconnect between perceived quality and actual use. This
would indicate that there is a significant informational barrier to RWH, not a cultural
barrier.
Households were also asked about the type and frequency of mammals such as
cats, dogs, raccoons, and rats, as well the quantity of birds living in their immediate
neighborhood, so as to gauge the likelihood of fecal contamination on their catchment
areas. This acts as a harvested rainwater quality proxy. 29 of 38 households capturing
some quantity of rainwater (76.3%) reported cats that “lived in, on, or traversed” their
roof. 20 of these 29 cat sightings (69.0%) were made daily, 1 (3.4%) was made every
other day, 2 (6.9%) were made weekly, 1 (3.4%) twice per month, 2 (6.9%) monthly, 1
!
!
56!
(3.4%) every other month, and 2 (6.9%) weekly, but only during the dry season14. 6 of 38
households capturing some quantity of rainwater (15.8%) reported seeing dogs, allegedly
on their roofs (if one believes every respondent understood the question fully), of which 4
stated daily frequency, 1 weekly, and 1 “rarely.” 5 of 38 households capturing some
quantity of rainwater (13.2%) reported seeing rats on their roof, of which 3 stated daily
frequency and 2 monthly frequency. 1 household also reported monthly sightings of a
raccoon.
When asked about the quantities of bird living in their immediate neighborhood,
households were given the three choices: not many, the normal amount, and many. 9 of
38 households (23.7%) reported that not many birds lived in their immediate
neighborhood, 17 of 38 (44.7%) reported the normal amount, and 12 of 38 (31.6%)
households reported many birds. Such animal quantities and frequency of sightings are
not particularly informative to any barriers to improvement, but they could prove useful
in explaining the variation in microbial contaminants for a water quality regression.
4.1.5 Harvested Rainwater Treatment Methods
Only 3 of 38 households capturing rainwater (7.9%) employed pre-storage filtration
techniques for their harvested rainwater. Two respondents reported using different types
of unidentified mesh or membrane that the surveyor did not see and one household used a
!!!!!!!!!!!!!!!!!!!!!!!!!!!!!!!!!!!!!!!!!!!!!!!!!!!!!!!!14!The “only during the dry season” phenomenon seen in cat sitings is of particular interest to this study. One could hypothesize that, since the elements are probably kinder in this mile-high, sub-tropical climate during the dry season, mammals are likely to seek refuges other than rooftops during the wet season. If indeed cats are found upon rooftops more often during the dry season, as these respondents claim, then it is possible that some households were likely to overstate the frequency with which they saw cats, since the question failed to delineate between wet and dry seasons. The general implication, if mammals are less present on rooftops during the wet season, would be that fecal contamination should be less of a concern than these results might otherwise indicate. !

!
!
57!
homemade FFD. For post-storage filtration, 4 of the 38 households capturing rainwater
(10.5%) added chlorine to their harvested rainwater and 1 of 38 (2.6%) used a cartridge
filter. The largely unfiltered nature of current RWH systems in Oaxaca supports the idea
that, by altering practices and increasing filtration, households can overcome the cultural
barriers preventing them from putting harvested rainwater to many of the recommended
end uses. Hence, it is the informational barriers of disseminating knowledge regarding
such filtration techniques that is acting as a principle obstacle to RWH, not perceptions of
rainwater quality.
4.1.6 Catchment Area and Storage Capacity
The households of Oaxaca have much potential to augment and improve their RWH
systems. The mean roof size of the 45 surveyed households was 132 square meters
(median of 86). However, the mean catchment area currently being used for RWH was 70
square meters (median of 48), or 53.0% of the total capacity available (55.8% of the
median). Similarly, the mean quantity short-term storage capacity being used by the 45
surveyed households was 1,306 liters (median of 300). The mean long-term storage
capacity was 2,008 liters (median of 400). However, the total mean low-elevation
storage, i.e. storage that could be used as short-term storage with all the necessary gutters
and downspouts, at households’ disposals was 4,952 liters (median of 3,000). Likewise,
the total mean high-elevation storage, i.e. roof storage that households could add to their
short-term storage capacity for a total long-term storage capacity, at households’
disposals was 1,671 liters (median of 1,100). As with catchment area, one can see the
substantial room for improvement.

!
!
58!
Although roof material and roof type were excluded from analysis, data were
collected regarding these parameters: 20 households (44.4%) had cement roofs; 7
(15.6%) had cement and brick roofs; 5 (11.1%) had part cement and part metal; 5
(11.1%) had all metal roofs; 3 (6.7%) had tiled roofs; 1 (2.2%) had part of cement and
part wood and metal; 1 (2.2%) had part cement and brick and part metal, (2.2%) 1 had
part cement and part stone; (2.2%) 1 had part cement and part tile, and (2.2%) 1 had part
metal and part tile. 9 of 45 surveyed households (20.0%) reported having roofs with a
slope, known in Oaxaca as a techo, and the other 36 (80.0%) reported having a flat roof,
called an azotea.
4.1.7 RWH System Cleaning and Maintenance Procedures
Respondents were asked to describe the type of frequency of cleaning and maintenance
procedures they performed on components of their RWH systems. When asked to
estimate the total monetary costs and hours spent by their household per year in cleaning
and maintaining their RWH systems, 2 of 38 respondents whose households were
capturing rainwater (5.3%) were not comfortable giving a monetary estimate and 19 of 38
households (50.0%) reported that their RWH system cost them nothing monetarily to
maintain. Even when it was pointed out that the materials like soap, chlorine, etc. they
use for this maintenance cost money, respondents replied that no, it cost them nothing
because they already had those materials around the house. The remaining 17 households
were found to spend a mean of 724 pesos (median of 400 pesos) annually in maintaining
their RWH systems. However, no maintenance or operational costs were taken into
account in the economics analysis.

!
!
59!
Only 1 of 38 respondents whose households were capturing rainwater (2.6%) was
unwilling to give an estimation of the number of hours of work that their household
invested in maintaining their RHW system, and only 5 of 38 (13.2%) reported 0 hours of
work as their estimate. The remaining 32 households were found to invest a mean of 27
hours (median of 8 hours) annually in maintaining their RWH systems.
4.1.7.1 Storage Tanks
Households with long-term storage, low-elevation storage like a cistern were found to
clean them a mean of 5.75 times per year, with a median of 2 times per year. Households
with long-term, high-elevation storage like a roof tinaco were found to clean them a
mean of 3.18 times per year, with a median of 2 times per year. Households with tambos,
tinas, and other sorts of buckets and short-term storage were found to clean them a mean
of 104.77 times per year, with a median of 50 times per year. These tinaco and tambo
means exclude one household that reported their private water truck company, Triton,
coming once a month to clean their storage tanks as part of the regular monthly service
they paid for. Most respondents, 30 of 38 (78.9%), reported cleaning their storage tanks
with a sponge and a mixture of water, soap, and chlorine. 2 of 38 households (5.3%) used
a sponge, water, and soap but no chlorine. 1 household (2.6%) used a sponge, water, and
chlorine but no soap, 1 household (2.6%) used only a sponge and water, 1 household
(2.6%) used a power washer with chlorine, and 3 respondents (7.9%) did not know how
their household’s storage tanks were cleaned.
4.1.7.2 Gutters & Downspouts
7 of the 17 households with gutters (41.2%) had never cleaned them. The 10 remaining
households were found to clean their gutters a mean of 8.45 times per year, with a median

!
!
60!
of 2 times per year. 8 of the 16 households with downspouts (50%) had never cleaned
them. The remaining 8 households were found to clean their downspouts a mean of 8.10
times per year, with a median of 2.5 times per year. For most households, these gutter and
downspout cleaning procedures meant sweeping out gutters and/or washing gutters and
downspouts down with a sponge or hose and different mixture of water and/or soap
and/or chlorine.
4.1.7.3 Catchment Surface
Households also reported various levels of roof cleaning. 9 of the 38 households
capturing rainwater (23.7%) did not regularly clean their roofs. The 29 remaining
households were found to clean their roofs a mean of 38 times per year, with a median of
3 times per year. For most households, 18 of 29 (62.1%), this cleaning procedure simply
meant sweeping their roof, but 7 of 29 (24.1%) also washed their roofs with different
combinations of water, soap, and chlorine, 1 household (3.4%) also washed with a power
washer, 1 (3.4%) household repainted regularly in addition to sweeping, and 2 (6.9%)
respondents were unaware of the cleaning procedures undertaken by their household.
4.1.8 Knowledge, Perceptions, and Legality of RWH
Households were also asked a series of questions regarding their general perceptions of
the success of their RWH systems. 36 of the 38 households already capturing some
rainwater (94.7%) stated that the time and money they had invested in their RWH system
had been worthwhile, with one household abstaining because they were unsure and
another household saying it had not been worthwhile. 33 of the 38 households (86.8%)
stated that their RWH system contributed significantly to their water supply. 37 of the 38

!
!
61!
households (97.4%) stated that they would recommend RWH as an alternative water
supply to a friend, with the one remaining household (2.6%) saying that such a
recommendation would depend on the technical specifics of the building in question.
These results support the lack of cultural barriers, showing that RWH is held in high
esteem as an alternative water source in Oaxaca.
On a slightly different note, 16 of 38 households that currently harvest rainwater
(42.1%) were able to confidently say that there are no legal limitations to RWH in
Oaxaca. The other 57.9% stated that they could not speak either way to the matter. This
affirms the initial hypothesis that legal barriers like those found in South Africa
(Kahinda & Taigbenu 2011; Kahinda, Taigbenu, & Boroto 2007) are not relevant in
Oaxaca.
4.1.9 Interest in and Intentions for Future RWH
Respondents were asked to rate their level of interest in improving their RWH systems.
They were given a 1 to 5 Likert scale, where 1=not interested, 2=indifferent, 3=not a
priority, 4=slightly interested, and 5=very interested, and asked to place their level of
interest on it. The responses of households currently capturing rainwater and those not
doing so are presented together in Table 4.4:
Table 4.4: Interest in Improving RWH Systems
Interest Rating
# of HHs giving rating
% of HHs giving rating
1 0 0.0% 2 3 6.7% 3 2 4.4% 4 14 31.1% 5 25 55.6%
unknown 1 2.2%

!
!
62!
These results indicate that the economic barriers to RWH could potentially be overcome.
Even if households were made to understand that the improvements to a RWH system
would pay themselves off, the high initial costs would still act as a significant obstacle,
but since many households showed such a keen interest in improving, initial costs are less
restricting to adoption.
For households that classified themselves as either “interested or slightly
interested in improving their RWH,” or for those not already capturing rainwater,
“interested or slightly interested in acquiring a RWH system,” a specific set of
improvements was discussed. This generally included purchasing and installing gutters,
downspouts, FFDs, a pump, and a cistern, excluding any of the above if a household was
already using them. Next, households were asked why they had not yet completed or
attempted the specific improvement we had discussed previously, or why they were not
interested in making such improvements. There were a multitude of responses: 30 of 45
households (66.7%) cited economic barriers such as the expense of the systems or the
current state of the economy; 11 of 45 households (24.4%) cited technical barriers such
as not being the owner of the house, siting or space limitations for various system
components, or concerns over the permits they would need; 10 of 45 households (22.2%)
cited informational barriers, stating that they would endeavor to make improvements if
they had the necessary knowledge; 4 of 45 households (8.9%) cited a lack of desire,
feeling content with their current supply; and 2 of 45 households (4.4%) thought that the
quantity of rainfall in Oaxaca was too low to make such an investment worthwhile. These
results speak for themselves; strong economic barriers, relatively significant technical
barriers and informational barriers, and weak and insignificant cultural barriers.

!
!
63!
4.1.9.1 Household Willing-to-Pay (WTP)
Respondents were also asked how they would respond to the following hypothetical
situation, taken directly from the survey:
Let us imagine a hypothetical situation where the government is offering households who wish to install a RWH system a subsidy of up to 20,000 pesos, but no more than half the initial capital cost.
When respondents were asked if they would apply for this subsidy, 1 (2.2%) did not feel
comfortable speaking for their households and 38 of 45 households (84.5%) responded,
yes, they would apply. The remaining 6 households (13.3%) were very hesitant to tell the
surveyor why they would not apply for the subsidy. Those that did give a substantive
response expressed distrust in the government. They stated either that they would not
apply because they did not believe the government would come through on the payment,
or that they could not imagine the government making this kind of offer at all, and had
responded they way they did in order to best reflect this doubt in the government15.
As a follow-up, respondents were given a willingness-to-pay (WTP) question
meant to further gauge their interest in investing in RWH systems:
If a contractor quoted you a price of 40,000 pesos to install/improve your RWH system, and if the government offered to cover half the cost, how much of the remaining 20,000 pesos do you feel you could afford to pay for with your current economic capacities?
3 of 45 respondents (6.7%) felt unable to answer the question and 6 of 45 (13.3%) felt
that their household’s current economic condition would not permit them to spend
anything on a RWH system. The remaining 36 households (80.0%) answered the !!!!!!!!!!!!!!!!!!!!!!!!!!!!!!!!!!!!!!!!!!!!!!!!!!!!!!!!15!This distrust of the government was echoed in the way that many respondents answered their doors. Respondents were often very skeptical of the surveyor, but were usually reassured when it was made clear that the survey was not for government purposes or government sponsored. The fact that the survey was for a Master’s thesis and not a government study generally made respondents feel more comfortable and more willing to participate.!

!
!
64!
question in one of two different ways, either offering a one-time payment they felt
they could afford to invest, or giving a monthly payment they would be willing to
invest in a RWH system over the next 1 to 3 years. The mean one-time payment for
households that answered the question was 8,519 pesos, with a median of 5,000
pesos. The mean monthly payment for households that answered the question was
554 pesos with a median of 500 pesos. These WTP results indicate that many
households are extremely interested in improving their RWH systems, and willing to
make the initial investments to do so. If households were to stand by these numbers, it
is likely that the economic barriers to RWH can be overcome.
4.2 RWH Dynamics Model and Economics of RWH Model Results
4.2.1 Model Inputs
The results of the RWH dynamics and economics models are presented in this section.
Three primary results can be drawn from these model results: (1) that there is
substantially more RWH occurring in Oaxaca than previously imagined; (2) that there is
still significant room for improvement; and (3) that RWH is an economically viable
alternative water source for households in Oaxaca.
The models were performed on a household-by-household basis; with the goal of
leaving open the possibility of within household variations. The RWH dynamics model
uses dynamic daily analysis and household-specific information collected in the survey to
estimate the quantity of rainwater each household could potentially capture in a variety of
circumstances. Because many households were already collecting rainwater, respondents
were asked the size of the catchment area, the quantity of short-term storage, and the
!
!
65!
quantity of long-term storage currently being used. However, since most households were
not harvesting rainwater to their full potential, the total—used and unused—catchment
area, quantity of short- term storage, and quantity of long-term storage at each
household’s disposal was also collected in the survey. These inputs are presented for each
household in Table F.1 of Appendix F.
The RWH economics model was constructed in order to take the potential
quantity of harvested rainwater output from the RWH dynamics model and attempt to put
a value on it. Every liter of captured rainwater is assumed to offset one liter of water that
would otherwise be purchased by households from public or private sources, resulting in
a household cost-savings. Thus, the prices of public and private water were used to put a
value on harvested rainwater. Although per-household water prices were collected in the
survey, the variance was higher than expected and the decision was made to restrict the
variation in household-reported prices with ADOSAPACO-promulgated prices. The
result of this restriction is presented for each household in Table F.2 of Appendix F. For
further details on the mathematics of this restriction, refer to Appendix C.
Households were also asked what portion of their consumption was supplied by
each water source. The percentages for public water sources, private water sources, and
all sources other than RWH are presented just as they were reported in the survey in
Table F.2 of Appendix F. For model scenarios 4, 5, and 6, which assume water price
inflation after the dam construction is finished, projections of future water prices and
future water supply distributions are also presented in Table F.2. For further discussion of
how these projections were calculated, see Appendix C.

!
!
66!
Households cannot make proper use of the entirety of the catchment area, the
short-term storage capacity, and long-term storage capacity at their disposal unless they
have the proper RWH system components to do so. Thus, data collected in the survey
regarding RWH systems and practices were used to evaluate the component needs of
each household’s RWH system. To make full use of a catchment area and storage units in
RWH, a network of gutters, downspouts, FFDs, and a pump is necessary. Hence,
households without any one of these components would need to purchase and install
them before making full use of their catchment and storage potential. Each household’s
needs and the costs associated with them are presented in Table G.1 of Appendix G.
Channeling—gutters and downspouts—and filtration costs are priced proportionately to
the household’s catchment area, since more of these components are needed the larger the
roof. Further discussion of the specific relationship between catchment area and these
specific costs can be found in Appendix D.
In addition, to fully appreciate the benefits of improving their RWH systems,
most households would need to adjust the end uses to which they put harvested rainwater.
Respondents were asked which of the following uses they feel—or would feel—
comfortable using harvested rainwater for, if it were treated only through the simple first
flush diversion technique and minimal chlorine: drinking, cooking, bathing, laundering,
general cleaning, flushing toilets, and watering plants. Households capable of capturing
quantities of rainwater that approach their total non-potable consumption would only be
able to make full use of this harvest if they were willing to use harvested rainwater for
each of these end uses. Because the literature seems to support the use of rainwater for
non-potable uses in most cases, it is assumed that households would adjust their use of

!
!
67!
harvested rainwater accordingly and with no increase in health risks (see Appendix B for
a detailed discussion of the harvested rainwater quality literature). Table G.1 in Appednix
G presents which of the six non-potable end-uses each household currently does not use
harvested rainwater for, i.e. the uses it would need to add to fully appreciate an increased
rainwater harvest.
The other change in practice that households would need to undertake to reach
their full RWH potential is employing the storage units they currently use for
ADOSAPACO water and private water truck to store harvested rainwater as well, mixing
their water sources when they needed to. Table G.1 also presents the storage units that
each household has but does not currently use for harvested rainwater, i.e. the storage
units that scenarios 3 and 6 assume they using for RWH.
4.2.2 Model Inputs Assigned to Applicable Scenarios
Six combinations of these inputs were used for running the RWH dynamics and
economics models. Scenarios 1 and 4 represent the RWH practices currently being
employed by the households in the sample. They use the catchment area, short-term
storage capacity, and long-term storage capacity currently used by households, as well as
zero basic improvement costs and no changes in practice.
Scenarios 2 and 5 represent the RWH potential that each household could attain if
it were to: (1) adjust its rainwater use practices such that rainwater was being put to every
end use other than drinking; (2) make the relatively small investment of outfitting their
home with gutters, downspouts, first-flush diverters (FFDs), and a pump, if they do not
already have them; but (3) utilize only the storage capacities they already employ for
RWH, plus the additional storage optimized by Microsoft Excel’s “Solver” function.

!
!
68!
These scenarios keep the storage units that each household currently uses for private and
public water sources reserved solely for those supplies. Thus, Scenarios 2 and 5 use the
total catchment area at households’ disposals and the short-term storage capacity and
long-term storage capacity currently used by households (plus the optimized additional
storage), as well as all changes in practice.
Lastly, Scenarios 3 and 6 represent the RWH potential that each household could
attain if it were to (1) adjust its rainwater use practices such that rainwater was being put
to every end use other than drinking; and (2) make the relatively small investment of
outfitting their home with gutters, downspouts, first-flush diverters (FFDs), and a pump,
if they do not already have them. In addition, Scenarios 3 and 6 assume that every
household is willing to utilize the entirety of the storage capacities at its disposal, plus the
additional storage optimized by Microsoft Excel’s “Solver” function. Thus, these
scenarios use the total catchment area, short-term storage capacity, and long-term storage
capacity at households’ disposals (plus the optimized additional storage), as well as all
changes in practice.
Scenarios 1, 2, and 3 also differ from scenarios 4, 5, and 6 because they assume
constant water pricing and constant water supply distributions over the ten-year period
considered. They therefore use only the current water prices and current water supply
distributions. Scenarios 4, 5, and 6, on the other hand, assume that the prices of both
public and private water will rise after the dam is completed, and that each household’s
water supply distribution will shift so that each receives more water from public sources
than they currently do. They therefore use the current water prices and current water

!
!
69!
supply distributions for the first five-year period and the projected future water prices and
projected future water supply distributions for second five-year period.
This information is summarized in Table 4.5 below. In the “Catchment Area,”
short-term storage capacity (“STSC”), and long-term storage capacity (“LTSC”)
columns, “Current” indicates that the capacities currently used by households were
applied to the scenario in question. “Total” indicates that the total capacities at
households’ disposals were used instead. “No” denotes that no RWH system
improvements and/or changes in practice were applied to the scenario in question;
whereas “Yes” indicates that they were applied. In the “Water Prices” column, “Current”
indicates that the current water prices and water supply distributions were applied to the
scenario in question. “Future” indicates that the projected post-dam prices were applied
in the second five-year period.
Table 4.5: Model Inputs
Model Input Scenario 1 Scenario 2 Scenario 3 Scenario 4 Scenario 5 Scenario 6
Catchment Area Current Total Total Current Total Total
STSC Current Current Total Current Current Total
LTSC Current Current Total Current Current Total
Improvements No Yes Yes No Yes Yes
Changes in Practice No Yes Yes No Yes Yes
Water Prices Current Current Current Future Future Future Shows whether “currently” used or “total” catchment area, short-term storage capacity, and long-term storage capacity data are used in each scenario, whether each scenario assumes that households have invested in basic RWH “improvements” and “changed their RWH practices” or not, and whether each scenario assumes constant water pricing at “current” rate or post-dam price inflation in the “future.”
4.2.3 Model Results
Table 4.6 and Table 4.7 present the model outputs for the hydraulic and economic
parameters considered as averages within each scenario. Results for each household can

!
!
70!
be found in Appendix H. Both the mean and the median are reported for each parameter
because significant outliers were found to skew the mean results considerably. Household
IDs 20 and 30 had catchment areas significantly larger than any others considered,
causing the rainwater harvest, the value of the harvest, the net present value, and the
optimized added storage to be much higher than those of other households. Hence, more
emphasis is put on the median values than the means.
Table 4.6: Summary Results for Scenario 1, 2, & 3
RWH Parameter Scenario 1: Current Practices
Scenario 2: Basic System Improvements
Scenario 3: Applying Entirety of Storage to RWH
Annual Rainwater Harvest (liters)
Mean 16,825 39,129 42,519
Median 13,352 29,596 33,094
Water Savings Efficiency (%) Mean 41.3% 235.3% 246.3%
Median 40.0% 67.3% 73.8%
Value of Annual Harvest (pesos) Mean 490 5,498 5,588
Median 264 564 659
Basic Improvement Costs (pesos) Mean 0 5,690 5,690
Median 0 5,172 5,172
Additional Storage Costs (pesos) Mean 0 9,063 8,704
Median 0 0 0
NPV of RWH System (pesos) Mean 4,180 33,075 34,209
Median 2,255 1,088 1,960
Payback Period (years) Mean 0 17.8 10.3
Median 0 6.7 6.2
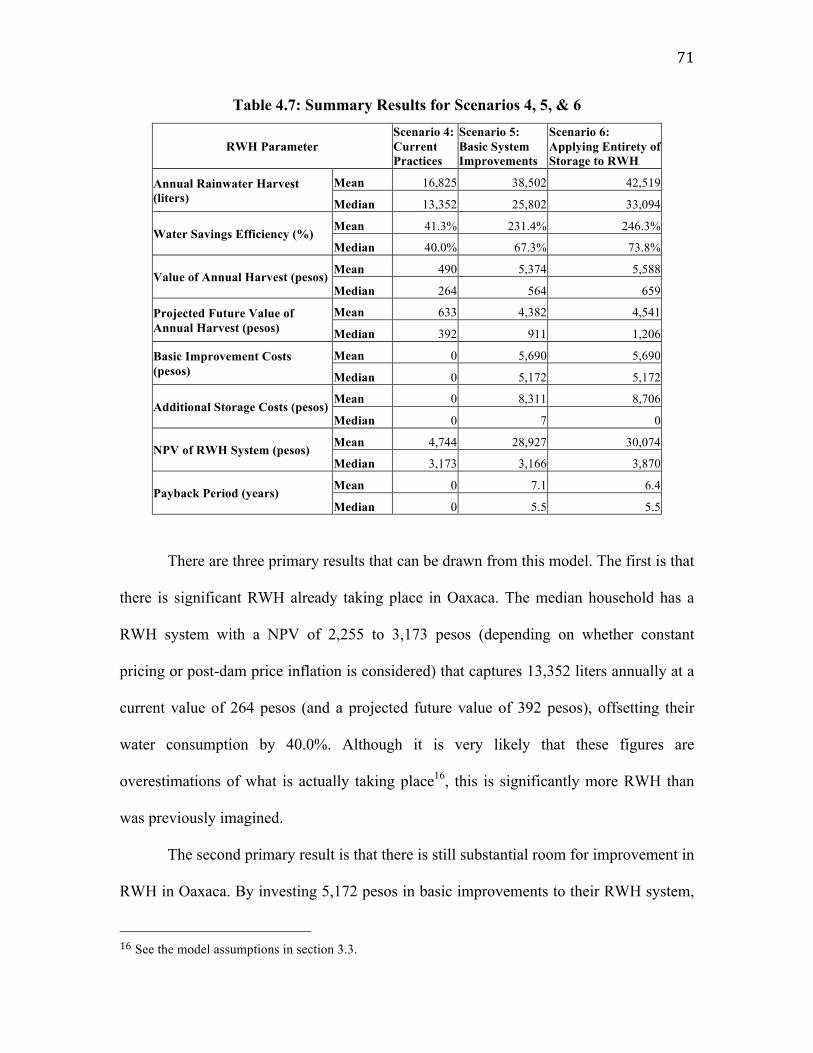
!
!
71!
Table 4.7: Summary Results for Scenarios 4, 5, & 6
RWH Parameter Scenario 4: Current Practices
Scenario 5: Basic System Improvements
Scenario 6: Applying Entirety of Storage to RWH
Annual Rainwater Harvest (liters)
Mean 16,825 38,502 42,519
Median 13,352 25,802 33,094
Water Savings Efficiency (%) Mean 41.3% 231.4% 246.3%
Median 40.0% 67.3% 73.8%
Value of Annual Harvest (pesos) Mean 490 5,374 5,588
Median 264 564 659
Projected Future Value of Annual Harvest (pesos)
Mean 633 4,382 4,541
Median 392 911 1,206
Basic Improvement Costs (pesos)
Mean 0 5,690 5,690
Median 0 5,172 5,172
Additional Storage Costs (pesos) Mean 0 8,311 8,706
Median 0 7 0
NPV of RWH System (pesos) Mean 4,744 28,927 30,074
Median 3,173 3,166 3,870
Payback Period (years) Mean 0 7.1 6.4
Median 0 5.5 5.5
There are three primary results that can be drawn from this model. The first is that
there is significant RWH already taking place in Oaxaca. The median household has a
RWH system with a NPV of 2,255 to 3,173 pesos (depending on whether constant
pricing or post-dam price inflation is considered) that captures 13,352 liters annually at a
current value of 264 pesos (and a projected future value of 392 pesos), offsetting their
water consumption by 40.0%. Although it is very likely that these figures are
overestimations of what is actually taking place16, this is significantly more RWH than
was previously imagined.
The second primary result is that there is still substantial room for improvement in
RWH in Oaxaca. By investing 5,172 pesos in basic improvements to their RWH system,
!!!!!!!!!!!!!!!!!!!!!!!!!!!!!!!!!!!!!!!!!!!!!!!!!!!!!!!!16!See the model assumptions in section 3.3.!

!
!
72!
the median household could increase their rainwater harvest to at least 25,802 liters
annually, offsetting their water consumption by a minimum of 67.3%. Under the best of
circumstances, the same investment could increase their annual rainwater harvest to
33,094 liters and their WSE to 73.8%. Depending on whether post-dam water prices
increase as predicted, and whether or not the household decides to apply the water
storage units they already have to RWH, this investment could decrease the NPV of their
RWH system to as low as 1,088 pesos, or increase it to as much as 3,870 pesos. These
results indicate that, at a relatively low cost, many households could significantly
increase their RWH. In addition, they show that many households would be likely to
benefit economically from doing so.
The third primary result is that RWH is an economically feasible alternative water
supply for Oaxaca. The median payback periods in all scenarios are under seven years,
indicating that, even under the worst of circumstances considered, the majority of the
households in the sample population would be able to fully repay the investments they
made in system improvements within seven years. Harvesting beyond then would only
benefit them further. These results show that investing in RWH is an economically viable
way for households in Oaxaca to augment their water supply.
!
!
73!
Chapter 5: Policy Recommendations
The survey and model results have been used to evaluate the hypothesized barriers to
RWH identified in section 1.5. While the presence of cultural barriers and technical
barriers was found, their influence on household decisions was deemed to be marginal.
Policies to overcome the remaining informational barriers and economic barriers are
presented in the following chapter.
5.1 Cultural and Technical Barriers to RWH
It is posited that the negative perceptions of rainwater quality that have acted as a
significant cultural barriers in Europe, Australia, and the United States (Domènech &
Saurí 2011; Mankad & Tapsuwan 2011; Rygaard et al. 2011; Jones & Hunt 2010;
Dolnicar & Shäfer 2009) are not present in Mexico, where the quality of municipal water
is much lower. Depending on the location of the household, there is a very good chance
that harvested rainwater would actually be of better quality than piped ADOSAPACO
water (Consejo 2011). Hence, with the support of survey results that show that
households in Oaxaca hold both RWH systems and the quality of harvested rainwater in
high esteem, cultural barriers to RWH were deemed negligible.
Although several technical barriers to RWH were identified, such as the lack of
space in which to put additional water storage units or the fact that many families are
renting, their effects are limited to a relatively small number of households. Survey
results show that 15.5% and 9.4% of households would run up against the technical
barriers of being a renter and having space constraints for addition storage, respectively.
Hence, over 75% of households do not face technical barriers, and those that do are

!
!
74!
simply unsuitable for RWH in their present state. Public policies cannot change that.
Hence, technical barriers too were deemed to be negligible.
5.2 Overcoming the Informational Barriers to RWH
Survey results show the informational barriers to RWH pose a significant obstacle to
implementation and improvement. Like Anand and Apul (2011), Domènech and Saurí
(2011), Farreny, Gabarrell, and Rieradevall (2011), Basinger et al. (2010), and Tam et al.
(2010), who cite the lack of regulation and guidelines at the institutional and
governmental level for appropriate RWH system installation, use, and maintenance as a
principle obstacle, respondents often stated that they felt uninformed regarding RWH.
When asked to rate their level of knowledge regarding RWH systems on a 1 to 5 Likert
scale, where 1=very badly informed, 2=badly informed, 3=average, 4=well informed, and
5=very well informed, respondents replied as follows in Table 5.1:
Table 5.1: Knowledge of RWH Systems
Knowledge Rating
# of HHs giving rating
% of HHs giving rating
1 3 6.7% 2 13 28.9% 3 17 37.8% 4 9 20.0% 5 2 4.4%
unknown 1 2.2%
Respondents also conveyed that their lack of knowledge acted as a deterrent to
implementing and improving their RWH systems.
!
!
75!
In order to overcome these informational barriers to RWH, this thesis would like
to recommend that government bodies and NGOs such as INSO work to establish a RWH
awareness campaign such as those launched in Australia (Tam et al. 2010; Coombes et al.
2000) and a RWH Association such as those created in England (Ward 2009) and
Germany (Hermann & Schmida 2000). The awareness campaign would serve to increase
household knowledge of the potential benefits of RWH and alert contractors to the
potential business that RWH system installation and improvements could offer them. The
RWH Association would serve to establish a set of regulations and guidelines for RWH
system installation, use, and maintenance in Oaxaca that would make households more
informed about and comfortable with adopting RWH technologies. The Association
would also create a venue for RWH lobbyists, supporters, and contractors to organize,
establishing networks and pressuring the government for support.
5.3 Overcoming the Economic Barriers to RWH
The model results show that RWH is an economically feasible alternative water supply
for Oaxaca. They indicate that the majority of households would be able to pay off their
initial investment in RWH system improvements in less than seven years. However,
despite these model calculations, the high initial capital costs that a RWH system requires
make up almost 60% of the mean household’s monthly income. Although the median
household would need to invest 5,172 pesos and also reported a median WTP of 5,000
pesos, indicating that almost half of the surveyed households would be willing to make
the necessary investment, it is posited that much fewer households would follow through.
Long-term, slow-payoff investments like RWH systems are historically unfavorably
!
!
76!
among households, and there is much evidence that WTP figures of this type
overestimate actual will. On the other hand, households in Oaxaca would not only be
motivated by the economic viability of RWH, but also by the water demands they have
that are not currently being met. In any case, this thesis would like to recommend that a
further economic incentive for RWH be established in Oaxaca.
The most successful case studies of RWH promotion involve regulatory or
economic mechanisms that require or incentivize RWH, respectively. It is hypothesized
that the government of Oaxaca would not have the political will to require RWH in any
capacity, but the subsidies used by Germany and Spain to encourage RWH could be very
successful in promoting RWH if applied. 86.4% of the surveyed households reported that
they would apply for such a subsidy if it existed, however, it is very unlikely that the
government would act to support RWH in the current policy environment. Hence, NGOs
such as INSO might have to look to international sources of funding to finance RWH
adoption.
5.4 Government Support: RWH as a Public Good
Despite that fact that RWH would generate many social values and public goods, which,
from a utilitarian perspective, should make a government willing to support it, this thesis
conjectures that the government of Oaxaca would not consider promoting RWH, at least
not financially. Perhaps if RWH had been on the agenda five years ago, before plans for
the Paso Ancho dam had begun working their way through the bureaucratic hurdles, but
not anymore. Since the national government agreed to fund the 2.5 billion-peso dam, the
water supply crisis has probably been knocked to the bottom of the city and state

!
!
77!
governments’ agendas. In addition, the decentralized nature of RWH makes government
prospects for profitmaking and power-grabbing very unlikely.
Nonetheless, the dam will not solve the city’s water problems. Dam or not, the
ability of the government to meet water demands and to increase water quality is still
tempered by the decrepit pipe infrastructure that leaks as much as 40% of the city’s water
(Lusher 2007). Thus, RWH is part of a toolkit that will continue to help meet the city’s
water needs. And if, as predicted, the government will not support RWH, it is
recommended that NGOs search for international funding sources to incentivize RWH at
the household level in Oaxaca.
5.5 Conclusion
Oaxaca de Juárez is in the midst of a water crisis. The quantity of water that the city
provides is not enough to meet the people’s demand, and the quality of water they do
deliver is unfit for many of the people’s needs. The city’s government plans to address
these issues with the construction of the Paso Ancho dam. However, such a dam will not
attend to the quality problems, and will only serve as a short-term band-aid for a portion
of the population in regards to the quantity problems. The Oaxacan government has made
its people promises before, and it has failed them time and again. As a result, many
Oaxacans do not trust their government. The people of Oaxaca de Juárez are therefore
faced with a choice: they can put their faith in the government and its dam, or they can
take their water supply problems into their own hands with RWH.
Despite its low average income and its arid climate, Oaxaca is very well suited for
RWH for a number of reasons. First, there is the fact that the water supply is already split

!
!
78!
between potable and non-potable sources and uses. This makes the cultural barrier of
perceived rainwater quality, which might result from telling a European or American
household that the water pouring from their faucet is no longer potable, a non-issue.
Second, most households already have many water storage units at their disposal and, in
this way, are primed for RWH, which makes the initial economic barriers less daunting.
And third, many households are suffering from water supply issues and in desperate need
of an alternative water supply, making their interest in and willingness to pay for RWH
systems higher than their incomes might otherwise dictate.
However, there are many forces working against RWH in Oaxaca as well. First, is
the informational barrier resulting from the fact that most households are not aware of
the potential in RWH. Most households would not know how to begin harvesting in a
more sophisticated fashion, and those that do often have doubts as to whether a RWH
system would supply enough water and of good enough quality to make the large initial
investments worthwhile. Second, is the economic barrier that results from municipal
water prices in Oaxaca being highly subsidized and the per quantity water tariffs being
the lowest in Mexico (Lusher 2007). This makes the cost-savings offset by RWH very
low and the payback of initial investments long. And third, is the fact that the government
of Oaxaca is corrupt and, like its people, poor. It would therefore be very unlikely to
provide the financial assistance that many households would need in order to make the
initial investment in RWH system improvements.
Such obstacles can be overcome. If households do not know about RWH, then
teach them. If the initial investments in system improvements seem unaffordable, find
financial aid for households in need. If the government is unwilling to provide proper

!
!
79!
RWH guidelines or sufficient economic incentives, find other regulators and financiers.
These are the roles to be filled by NGOs. This thesis has identified informational and
economic barriers as the principle obstacles to RWH in Oaxaca. For the city to meet its
full RWH potential, an awareness campaign must be started, a RWH Association must be
founded, and funding for households in need must be financed. Though the government’s
dam may serve to prolong the Oaxacan water crisis and cause more problems than its
solves, the actions of NGOs may alleviate the strain on households and help them to find
a clean and reliable water source in the decentralized supply that RWH offers.

!
!
80!
Works Cited
Abdulla, F., & Al-Shareef, A. (2009). Roof rainwater harvesting systems for household water supply in Jordan. Desalination, 243 (1-3), 195–207.
Anand, C., & Apul, D. (2011). Economic and environmental analysis of standard, high efficiency, rainwater flushed, and composting toilets. Journal of Environmental Management, 92 (3), 419–428.
Angrill, S., Farreny, R., Gasol, C., Gabarrell, X., Viñolas, B., Josa, A., & Rieradevall, J. (2011). Environmental analysis of rainwater harvesting infrastructures in diffuse and compact urban models of Mediterranean climate. The International Journal of Life Cycle Assessment, 1–18.
Báez, A., Belmont, R., García, R., Padilla, H., & Torres, M. (2007). Chemical composition of rainwater collected at a southwest site of Mexico City, Mexico. Atmospheric Research, 86 (1), 61–75.
Báez, A., Belmont, R., García, R., Torres, M., & Padilla, H. (2006). Rainwater chemical composition at two sites in Central Mexico. Atmospheric Research, 80 (1), 67–85.
Basinger, M., Montalto, F., & Lall, U. (2010). A rainwater harvesting system reliability model based on nonparametric stochastic rainfall generator. Journal of Hydrology, 392 (3-4), 105–118.
Brown, R. (2005). Impediments to integrated urban stormwater management: The need for institutional reform. Environmental Management, 36 (3), 455–468.
Burkhard, R., Deletic, A., & Craig, A. (2000). Techniques for water and wastewater management: a review of techniques and their integration in planning. Urban Water, 2 (3), 197–221.
Chang, M., McBroom, M., & Scott Beasley, R. (2004). Roofing as a source of nonpoint water pollution. Journal of Environmental Management, 73 (4), 307–315.
Chatfield, R. C., & Coombes, P. J. (2007). Urban Rainwater Harvesting: Analysis of a Decentralized Approach for Meeting Water Demand in Urban Cities. Retrieved October 8, 2011, from http://www.ctahr.hawaii.edu.
Chilton, J., Maidment, G., Marriott, D., Francis, A., & Tobias, G. (2000). Case study of a rainwater recovery system in a commercial building with a large roof. Urban Water, 1 (4), 345–354.
Comisión Nacional del Agua (CNA) (2011).
Consejo, J.J. (2011, November 22). Personal Interview Coombes, P., Kuczera, G., Kalma, J.D. (2003). Economic water quantity and quality
impacts from the use of a rainwater tank in the inner city, Australian Journal of Water Resources, 7 (2), 101-110.
Coombes, P., & Kuczera, G. (2003). Analysis of the performance of rainwater tanks in Australian capital cities. Retrieved October 7, 2011, from http://www.waterplex.com.au.

!
!
81!
Coombes, P., Argue, J., & Kuczera, G. (2000). Figtree Place: a case study in water sensitive urban development (WSUD). Urban Water, 1 (4), 335–343.
Dbais, J., Rahman, A., Ronaldson, P., & Shrestha, S. (2007). Life cycle costing of rainwater tank as a component of water sensitive urban design. Retrieved October 8, 2011, from http://www.handle.uws.edu.au.
University of Warwick, Development Technology Unit. (2001). Recommendations for Designing Rainwater Harvesting System Tanks. Retrieved October 17, 2011, from http://www2.warwick.ac.uk.
Dillon, P., Pavelic, P., Toze, S., Rinck-Pfeiffer, S., Martin, R., Knapton, A., & Pidsley, D. (2006). Role of aquifer storage in water reuse. Desalination, 188 (1-3), 123–134.
Dolnicar, S., & Schafer, A. (2009). Desalinated versus recycled water: public perceptions and profiles of the accepters. Journal of Environmental Management, 90 (2), 888–900.
Domenech, L., & Sauri, D. (2011). A comparative appraisal of the use of rainwater harvesting in single and multi-family buildings of the Metropolitan Area of Barcelona (Spain): social experience, drinking water savings and economic costs. Journal of Cleaner Production, 19 (6-7), 598–608.
Environmental Protection Agency (2001). Parameters of Water Quality: Interpretation and Standards. Retrieved November 29, 2011, from http://www.epa.ie.
Eroksuz, E., & Rahman, A. (2010). Rainwater tanks in multi-unit buildings: A case study for three Australian cities. Resources, Conservation and Recycling, 54 (12), 1449–1452.
Farreny, R., Gabarrell, X., & Rieradevall, J. (2011a). Cost-efficiency of rainwater harvesting strategies in dense Mediterranean neighbourhoods. Resources, Conservation and Recycling. Retrieved October 7, 2011, from http://www.sciencedirect.com.
Farreny, R., Morales-Pinzón, T., Guisasola, A., Tayą, C., Rieradevall, J., & Gabarrell, X. (2011b). Roof Selection For Rainwater Harvesting: Quantity And Quality Assessment In Spain. Water Research. Retrieved October 7, 2011, from http://www.sciencedirect.com.
Fletcher, T., Deletic, A., Mitchell, V., & Hatt, B. (2008). Reuse of Urban Runoff in Australia: A Review of Recent Advances and Remaining Challenges. Retrieved October 6, 2011, from http://www.ncbi.nlm.nih.gov.
Gardner, T., Coombes, P., & Marks, R. (2001). Use of rainwater at a range of scales in Australian urban environments. Retrieved October 19, 2011, from http://www.healthyhomeproject.com.
Ghisi, E., Bressan, D., & Martini, M. (2007a). Rainwater tank capacity and potential for potable water savings by using rainwater in the residential sector of southeastern Brazil. Building and Environment, 42 (4), 1654–1666.

!
!
82!
Ghisi, E., Bressan, D., & Martini, M. (2007b). Rainwater tank capacity and potential for potable water savings by using rainwater in the residential sector of southeastern Brazil. Building and Environment, 42 (4), 1654–1666.
Ghisi, E., Montibeller, A., & Schmidt, R. (2006). Potential for potable water savings by using rainwater: An analysis over 62 cities in southern Brazil. Building and Environment, 41 (2), 204–210.
Ghisi, E., Tavares, D., & Rocha, V. (2009). Rainwater harvesting in petrol stations in Brasília: Potential for potable water savings and investment feasibility analysis. Resources, Conservation and Recycling, 54 (2), 79–85.
Glendenning, C., & Vervoort, R. (2010b). Hydrological impacts of rainwater harvesting (RWH) in a case study catchment: The Arvari River, Rajasthan, India:: Part 2. Catchment-scale impacts. Agricultural Water Management. Retrieved October 6, 2011, from http://www.sciencedirect.com.
Glendenning, C., & Vervoort, R. (2010a). Hydrological impacts of rainwater harvesting (RWH) in a case study catchment: The Arvari River, Rajasthan, India. Part 1: Field-scale impacts. Agricultural Water Management, 98 (2), 331–342.
Global-Rates (2012). Inflation Mexico: consumer price index (CPI). Retrieved April 9, 2012 from www.global-rates.com.
Gould, J. (1999). Contributions relating to rainwater harvesting. Retrieved October 21, 2011, from http://oldwww.wii.gov.in.
Hatt, B., Deletic, A., & Fletcher, T. (2006). Integrated treatment and recycling of stormwater: a review of Australian practice. Journal of Environmental Management, 79 (1), 102–113.
Helmreich, B., & Horn, H. (2009). Opportunities in rainwater harvesting. Desalination, 248 (1-3), 118–124.
Herrmann, T., & Schmida, U. (2000). Rainwater utilisation in Germany: efficiency, dimensioning, hydraulic and environmental aspects, 1–10.
“Honorable Ayuntamiento of Oaxaca de Juárez” (2005). Plan Municipal de Desarrollo, 2005-2007. Technical report, Municipio de Oaxaca de Juárez.
Imteaz, M., Shanableh, A., Rahman, A., & Ahsan, A. (2011). Optimisation of rainwater tank design from large roofs: A case study in Melbourne, Australia. Resources, Conservation and Recycling, 55, 1022-1029.
INEGI (2005). Indicadores seleccionados de viviendas particulares habitadas por municipio, 2005.
Jones, M., & Hunt, W. (2010). Performance of rainwater harvesting systems in the southeastern United States. Resources, Conservation and Recycling, 54 (10), 623–629.
Kahinda, J. M., & Taigbenu, A. E. (2011). Rainwater harvesting in South Africa: challenges and opportunities. Journal of Physics and Chemistry of the Earth. Retrieved October 8, 2012, from http://www.sciencedirect.com.

!
!
83!
Kahinda, J. M., Taigbenu, A., & Boroto, J. (2007). Domestic rainwater harvesting to improve water supply in rural South Africa. Journal of Physics and Chemistry of the Earth, 32 (15-18), 1050–1057.
Kahinda, J. M., Taigbenu, A., & Boroto, R. (2010). Domestic rainwater harvesting as an adaptation measure to climate change in South Africa. Journal of Physics and Chemistry of the Earth, 35 (13-14), 742–751.
Kim, R., Lee, S., Kim, Y., & Lee, J. (2004). Pollutants in Rainwater Runoff and Their Control by Surface Modification Using TiO2. Journal of Industrial and Engineering Chemistry, 10 (1), 152–160.
Lee, JY, Yang, J., Han, M., & Choi, J. (2010). Comparison of the microbiological and chemical characterization of harvested rainwater and reservoir water as alternative water resources. Science of the Total Environment, 408 (4), 896–905.
Liaw, C., & Tsai, Y. (2004). Optimum Storage Volume of Rooftop Rainwater Harvesting Systems for Domestic Use. Journal of the American Water Resources Association, 40 (4), 901–912.
Lusher, L. (2007). Water Policy on Demand: Valuation of Improved Water Services in Oaxaca, Mexico (Masters Thesis). Retrieved from the Bard College database.
Mankad, A., & Tapsuwan, S. (2011). Review of socio-economic drivers of community acceptance and adoption of decentralised water systems. Journal of Environmental Management, 92 (3), 380–391.
Martinson, B., & Thomas, T. (2009). Quantifying the first-flush phenomenon: effects of first-flush on water yield and quality. Retrieved October 10, 2011 from www.raintankdepot.com.
Martinson, D., & Thomas, T. (2003). Better, faster, cheaper: research into roofwater harvesting for water supply in low-income countries. Retrieved October 10, 2011 from www2.warwick.ac.uk.
Mbilinyi, B., Tumbo, S., Mahoo, H., Senkondo, E., & Hatibu, N. (2005). Indigenous knowledge as decision support tool in rainwater harvesting. Physics and Chemistry of the Earth, 30 (11-16), 792–798.
Moore, D., & Mclean, S. (2008). Appraisal of the requirements for establishing domestic roof rainwater harvesting schemes in Bangladesh. Journal of Building Appraisal, 4 (1), 23–31.
Morrow, A., Dunstan, R., & Coombes, P. (2010). Elemental composition at different points of the rainwater harvesting system. Science of the Total Environment, 408 (20), 4542–4548.
Ouessar, M., Sghaier, M., Mahdhi, N., Abdelli, F., De Graaff, J., Chaieb, H., Yahyaoui, H., et al. (2004). An integrated approach for impact assessment of water harvesting techniques in dry areas: the case of Oued Oum Zessar watershed (Tunisia). Environmental monitoring and assessment, 99 (1), 127–140.
Palla, A., & Gnecco, I. (2011). Non-dimensional design parameters and performance assessment of rainwater harvesting systems. Journal of Hydrology.

!
!
84!
Parker, H. (2010). Rainwater Harvesting in Oaxaca: Present and Future (Masters Thesis). Retrieved from the Institute of Nature and Society of Oaxaca.
Radaideh, J., Al-Zboon, K., Al-Harahsheh, A., & Al-Adamat, R. (2009). Quality Assessment of Harvested Rainwater for Domestic Uses. Jordan Journal of Earth and Environmental Sciences, 2 (1), 26-31.
Rahman, A., Dbais, J., & Imteaz, M. (2009). Sustainability of Rainwater Harvesting Systems in Multistorey Residential Buildings. American Journal of Engineering and Applied Sciences, 3 (1), 73-82.
Rauch, W., Seggelke, K., Brown, R., & Krebs, P. (2005). Integrated approaches in urban storm drainage: Where do we stand? Environmental Management, 35 (4), 396–409.
Roebuck, R., & Ashley, R. (2006). Predicting the hydraulic and life-cycle cost performance of rainwater harvesting systems using a computer-based modeling tool. Retrieved March 29, 2012 from www.sudsolutions.co.uk.
Roebuck, R., Oltean Dumbrava, C., & Tait, S. (2011). Whole life cost performance of domestic rainwater harvesting systems in the United Kingdom. Water and Environment Journal, 25 (3), 355–365.
Roy, A., Wenger, S., Fletcher, T., Walsh, C., Ladson, A., Shuster, W., Thurston, H., et al. (2008). Impediments and solutions to sustainable, watershed-scale urban stormwater management: lessons from Australia and the United States. Environmental Management, 42 (2), 344–359.
Ryan, A., Spash, C., & Measham, T. (2009). Socio-economic and psychological predictors of domestic greywater and rainwater collection: Evidence from Australia. Journal of Hydrology, 379 (1-2), 164–171.
Rygaard, M., Binning, P., & Albrechtsen, H. (2011). Increasing urban water self-sufficiency: New era, new challenges. Journal of Environmental Management, 92 (1), 185–194.
Sanchez, A. M. (2011, December 5). Personal Interview Sazakli, E., Alexopoulos, A., & Leotsinidis, M. (2007). Rainwater harvesting, quality
assessment and utilization in Kefalonia Island, Greece. Water Research, 41 (9), 2039–2047.
Simmons, G., Hope, V., Lewis, G., Whitmore, J., & Gao, W. (2001). Contamination of potable roof-collected rainwater in Auckland, New Zealand. Water Research, 35 (6), 1518–1524.
Simmons, G., Jury, S., Thornley, C., Harte, D., Mohiuddin, J., & Taylor, M. (2008). A Legionnaires' disease outbreak: A water blaster and roof-collected rainwater systems. Water Research, 42 (6-7), 1449–1458.
Still, G., & Thomas, T. (2003). Sizing and optimally locating guttering for rainwater harvesting. Retrieved October 10, 2011 from www2.warwick.ac.uk.

!
!
85!
Sturm, M., Zimmermann, M., Schütz, K., Urban, W., & Hartung, H. (2009). Rainwater harvesting as an alternative water resource in rural sites in central northern Namibia. Physics and Chemistry of the Earth, 34 (13), 776–785.
Tam, V., Tam, L., & Zeng, S. (2010). Cost effectiveness and tradeoff on the use of rainwater tank: An empirical study in Australian residential decision-making. Resources, Conservation and Recycling, 54 (3), 178–186.
Thomas, T. (1998). Domestic water supply using rainwater harvesting. Building Research & Information, 26 (2), 94–101.
Toronto and Region Conservation (2011). Performance Evaluation of Rainwater Harvesting Systems. Retrieved October 10, 2011, from http://www.sustainabletechnologies.ca.
Trading Economics (2012). Mexico Interest Rate. Retrieved April 9, 2012 from www.tradingeconomies.com.
Turner, S., & Four, E. (2000). Design of rainwater storage tanks for use in developing countries. Retrieved October 12, 2011 from www2.warwick.ac.uk.
Vargas, D. (2009). Rainwater Harvesting: A Sustainable Solution to Stormwater Management (Masters Thesis). Retrieved from the Institute of Nature and Society of Oaxaca.
Verdin, D. (2005). Tinacos Rotoplas. In La Gran Vía: Lista de Precios. Retrieved February 25, 2012, from http://ferreterialagranvia.tripod.com/id18.html.
Vervaeke, W. (2011, December 9). Personal Interview. Vialle, C., Sablayrolles, C., Lovera, M., & Jacob, S. (2011). Monitoring of water quality
from roof runoff: Interpretation using multivariate analysis. Water Research, 45 (1), 3765-3775.
Villarreal, E., & Dixon, A. (2005). Analysis of a rainwater collection system for domestic water supply in Ringdansen, Norrköping, Sweden. Building and Environment, 40 (9), 1174–1184.
Ward, S. (2009). Rainwater Harvesting in the UK–Current Practice and Future Trends. Retrieved November 3, 2011 from www.mendeley.com.
Zhu, K., Zhang, L., Hart, W., Liu, M., & Chen, H. (2004). Quality issues in harvested rainwater in arid and semi-arid Loess Plateau of northern China. Journal of Arid Environments, 57 (4), 487–505.

!
!
86!
Appendix A: RWH System Components
A.1 Catchment Surface
The materials from which a catchment surface is made play a critical role the functioning
of a RWH system. It recommended that roofs be made from metal, clay, concrete, or slate
if they are to be used for RWH (Helmreich & Horn 2008; Texas Water Development
Board 2005; Thomas 1998). Composite or asphalt shingles as well as roofs made from
tar, gravel, wood, or other organic matter are not recommended because they leech toxins
into the water supply (Helmreich & Horn 2008; Texas Water Development Board 2005;
Thomas 1998). Although expensive, slate is the most highly recommended material. Its
smoothness and chemical stability limit evaporation and leeching, respectively (Texas
Water Development Board 2005). After slate, metal roofs, particularly ones made from
aluminum, zinc, and steel are comparable, but one must be careful of what they are
painted with (Texas Water Development Board 2005). Clay and concrete are the cheapest
options but because they are so porous they have been known to "contribute as much as a
10% loss due to texture, inefficient flow, or evaporation" (Texas Water Development
Board 2005, p. 6). In addition, porous roofing materials encourage the growth of bacteria
and potential water contaminants (Texas Water Development Board 2005). However, this
loss and the chance of bacterial growths can be reduced with painting or coating, but, as
noted above, one must be careful of the type of paint/coating used (Texas Water
Development Board 2005; Thomas 1998).
A.2 Gutters and Downspouts
Gutters and downspouts are generally made of PVC, vinyl, seamless aluminum, and

!
!
87!
galvanized steel (Helmreich & Horn 2008; Texas Water Development Board 2005;
Thomas 1998). Seamless aluminum tends to be the most expensive, as it must be installed
by a professional, but the others are relatively comparable in price (Texas Water
Development Board 2005). In addition, at least two 45-degree elbows, many brackets and
straps, and general hardware are necessary to complete the system (Texas Water
Development Board 2005). Factors such as the presence of "roof valleys," roof slope,
intensity of rainfall, and number and frequency of downspouts make a "gutter-sizing rule
of thumb" difficult to create, but some water will be lost to spillage or overrunning,
especially if gutters are not well maintained and "roof valleys" are not properly accounted
for (Texas Water Development Board 2005). In order to prevent clogging and
contamination, mesh screens are necessary along gutters or in downspouts (Helmreich &
Horn 2008; Texas Water Development Board 2005; Thomas 1998). There are many types
and models of such mesh screen available, and various designs of where to put them and
how to best use them (Texas Water Development Board 2005). Further information on
optimized water conveyance as a function of roof slope, gutter slope, aperture, and width
can be found in Still and Thomas’s (2003) analysis of gutter performance.
A.3 First-Flush Diverter (FFD)
By far the most important and prevalent form of pre-cistern filtration or treatment in the
literature is the first-flush diverter (FFD) (Lee et al. 2010; Martinson & Thomas 2009;
Helmreich & Horn 2008; Texas Water Development Board 2005). The device is a simple
box with an inlet, baffle, and removable filter covering the outlet that usually sits just
before the storage tank/cistern (Texas Water Development Board 2005). Essentially, a
FFD is a fork or “v” in the piping of a RWH system that lies between the downspouts and

!
!
88!
the cistern, allowing the operator of a RWH to choose whether the rainwater’s final
destination is the cistern or not (see figure 2.1). The guiding concept here is that the first
rain event of the season (and perhaps others afterward) should be used to clean the
catchment surface, gutters, and downspouts, rather than being captured in the cistern
(Texas Water Development Board 2005). After the eight months of almost no rain that
occurs in Oaxaca, a RWH catchment surface will be highly contaminated with
atmospheric deposition, animal feces, and other pollutants (Texas Water Development
Board 2005). The first rain event of the season will wash the majority of these
contaminants away, and a FFD prevents this first-flush cleaning from making it to the
cistern.
FFDs are the best RWH filtration technique because they are not sensitive to
particle size, and since roof dust is so small, this is quite important (Martinson & Thomas
2009). FFDs also remove dissolved contaminants in addition to suspended ones,
eliminating the possibility of contamination from trace minerals like lead and zinc
(Martinson & Thomas 2009). Empirical evidence indicates that the improvements to
water quality resulting from this practice are drastic (Vialle et al. 2011; Lee et al. 2010;
Helmreich & Horn 2008).
Several methods exist for choosing the number of FFDs, the size of each flush,
and timing between. Factors such as the catchment surface area, the number of dry days
in between rains, the quantity and type of debris and dust, the slope and smoothness of
the collection surface, and the number of downspouts will affect the optimal diversion
quantity (Texas Water Development Board 2005). Generally, one first-flush diverter is
necessary for each downspout and it is recommended that each one be cleaned after each
!
!
89!
rain event (Texas Water Development Board 2005). The rule of thumb for sizing one's
FFD is that one to two gallons of first-flush diversion will be needed for each 100 square
feet of collection area [approximately 4 to 8 liters of FFD for every 10 square meters]
(Texas Water Development Board 2005). Martinson and Thomas (2009) developed a
more complex and sophisticated method for sizing first flush diversion attributes and
there work should be referred to if more detail is desired. They optimized the FFD reset
time and the quantity of water diverted for a variety of locations and rain profiles around
the world. They weighed the removal efficiency and volumetric efficiency of first flush
diversion against each other in order to establish a design procedure for setting a reset
times and sizing a FFD (Martinson & Thomas 2009).!!
A.4 Storage Tank
The storage tank/cistern is the most expensive, and arguably the most important, part of a
RWH system (Texas Water Development Board 2005). Ideally, its size should be a
function of the local rainwater supply, the demand, the projected length of time between
rain events, and the catchment surface area, as well as less scientific variables such as
aesthetics, personal preference, and budget (Texas Water Development Board 2005).
Storage tanks/cisterns can be made from earthenware mud or clay, from recycled vinyl
swimming pools, and from concrete, brick, galvanized steel, or stone and mortar (Texas
Water Development Board 2005). All designs must have covers in order to prevent
evaporation, mosquitoes, and contamination (Thomas 1998), be opaque or painted in
order to prevent algae growth, and be easily accessible for cleaning (Texas Water
Development Board 2005; Thomas 1998). Much of the literature agrees that cement is
not only an appropriate material for a rainwater cistern, but also the cheapest (Texas

!
!
90!
Water Development Board 2005; Turner 2000; Thomas 1998).
In 2000, Turner (2000) published a set of construction recommendations for
cement tanks in an attempt to minimize the material inputs and cost, while maintaining
cistern quality. Because approximately 80% of the cost of a cement tank is the
construction material (Turner 2000), the easiest way to reduce its cost is to decrease the
quantity of necessary materials. However, reducing material inputs by, for example,
thinning walls can increase the chance of cracking caused by shrinking (Turner 2000).
Hence, Turner (2000) writes of several strategies for avoiding this result: "reducing the
effects of potentially damaging differential shrinkage, incorporating good curing regimes,
and studying the role reinforcing plays in reducing shrinkage and cracking (Turner 2000,
p. 15).
Siting a storage tank/cistern can sometimes be very difficult. In order to minimize
plumbing, the tank should be placed close to points of supply and demand, but higher
altitudes are also preferable so as to minimize the pumping that will be necessary (Texas
Water Development Board 2005). In addition, the weight of the storage tank is important.
A gallon of water weighs about 8 pounds (one liter of water weighs about one kilogram),
which makes even small tanks extremely heavy. This is of particular concern in Oaxaca,
where roofs are already lined with water storage tanks and often weighed down to the
capacity they can withstand. Because of these weight concerns, and because space is a
scarce commodity in city centers like Oaxaca, underground tanks are generally more
practical than surface ones, but, according to Thomas (1998), they “possess significant
disadvantages" (Thomas 1998, p. 97).

!
!
91!
A.5 Pump and Plumbing
Rainwater is captured and conveyed via gutters, downspouts, and FFDs like those
discussed above to low-gravity storage like a cistern. Households without a pump will
need one, either to carry water directly to the faucets etc. above, or to pump the water to
higher-gravity storage, where it can be conveyed via gravity (Texas Water Development
Board 2005). Such pumps are usually electric.
The piping and delivery system appropriate for a RWH system is no different than
the plumbing used for any other source of water. In most cases, a RWH system can be
attached to existing plumbing (Helmreich & Horn 2008; Texas Water Development
Board 2005; Thomas 1998).
A.6 Treatment, Filtration, and Purification
There is a very in-depth literature on appropriate methods of treatment and filtration for
harvested rainwater. Most of these works, however, attempt to bring harvested rainwater
to a quality level appropriate for drinking. Because this thesis is proposing the use of
harvested rainwater for all end uses other than drinking, the more sophisticated
techniques discussed in Vialle et al. (2011), Lee et al. (2010), Helmreich & Horn (2008),
Texas Water Development Board (2005), Thomas (1998), and elsewhere would be
inappropriate. Instead, the recommended post-storage treatment is nothing more than
chlorine, relying heavily on first-flush diversion and gutter mesh to filter out potential
contaminants (Domènech & Saurí 2011; Farreny et al. 2011; Imteaz et al. 2011; Mandak
& Tapsuwan 2011; Toronto & Region Conservation 2010; Helmreich & Horn 2008;
Kahinda, Taigbenu, & Boroto 2007; Martinson & Thomas 2003; Thomas 1998).

!
!
92!
Appendix B: Harvested Rainwater Quality
B.1 Paths of Contamination
Generally, there is agreement that the factors affecting the quality of harvested rainwater
are: "(1) the cleanliness and age of catchments, storage tanks, pipes, and gutters; and (2)
[the] atmospheric conditions” present at each site (Lee et al. 2010, p. 896). In addition, all
authors seem to concur that it is reasonable to assume that catchment areas will become
contaminated with "dust, organic matter, bird and animal droppings, and pollutants from
human activities" (Lee et al. 2010, p. 897). These potential paths of contamination show
types of water pollution that one might expect to find in harvested rainwater and inform
the kinds of treatment and filtration that one might use to prevent contamination. They
also illustrate the importance of regular RWH system maintenance.
B.2 Water Quality Study Parameters
In addition to regional factors such as atmospheric deposition and local factors such as
catchment area material and the presence of mammals, rodents, and birds on the
catchment area, the quality of harvested rainwater—and the conclusions that study
authors draw—also depends on the water quality parameters being tested and the water
quality standards they are compared to. Hence, the wide variety of water quality test
results in the literature can be largely explained by differences in location, quality
parameters, and water quality standards. For example, Kahinda et al. (2007) reviewed the
literature on the quality of harvested rainwater and found a wide range of conclusions in
the literature. On the one hand, Sazakli et al. (2007), Zhu et al. (2004), Handia et al.
(2003), and Dillaha and Zolan (1984) conducted studies that showed levels of chemical

!
!
93!
and/or microbial contaminants that met the World Health Organization’s (WHO’s)
international standards for drinking water (Kahinda et al. 2007). On the other hand, the
research conducted by Abbott et al. (2006), Vasudevan and Pathak (2000), Nevondo and
Cloete (1999), and Yaziz et al. (1989) concluded that levels of chemical and/microbial
contaminants are often found in harvested rainwater at concentrations exceeding
international standards for drinking water (Kahinda et al. 2007). Authors such as Sazakli
et al. (2007), Zhu et al. (2004), Vásquez et al. (2003), and Gould (1999) took a more
nuanced view; they claim that the quality of harvested rainwater depends on the
geography, topography, and weather conditions of the area, the type and proximity of
pollution sources, the type of catchment area, the type of water tank, and the handling of
the water itself (Kahinda et al. 2007). The discrepancy in the literature makes it clear that
the quality of harvested rainwater depends on various factors discussed, but it is
encouraging that there are some scientists who believe rainwater is potable without
treatment (Kahinda et al. 2007). Other papers, such as Imteaz et al. (2011), Mandak &
Tapsuwan (2011), Toronto & Region Conservation (2010), Helmreich & Horn (2009),
Martinson & Thomas (2003), and Thomas (1998), have similarly inconclusive rainwater
quality literature reviews.
A variety of testing approaches were taken in the fourteen papers reviewed for
this thesis. Farreny et al. (2011), Chang et al. (2004), Kim et al. (2004), and Zhu et al.
(2004) focused their analysis on comparing the qualities of rainwater attained from RWH
systems with catchment areas made of different materials. All four studies took their
rainwater samples from roof runoff, so as to eliminate the confounding factors added by
storage and piping, and compared their results to national or international water quality

!
!
94!
standards. Meanwhile, Domènech & Saurí (2011), Vialle et al. (2011), Abdulla & Al-
Shareef (2009); Radaideh et al. (2009), Sazakli et al. (2007), Coombes, Kuczera, &
Kalma (2003), and Coombes et al. (2000) took their rainwater samples from the rainwater
storage tanks of active RWH systems in an effort to incorporate the effects that
longstanding, stagnant water might have on quality17. Morrow et al. (2010) and Lee et al.
(2010), on the other hand, decided to focus on the differences in water quality found at
various point in a RWH system. Morrow et al. (2010) took samples from roof runoff,
rainwater tanks, and indoor faucets of homes with active RWH systems. Lee et al. (2010)
took samples directly from the sky and from roof runoff, and compared these results to
the public groundwater sources that RWH would theoretically be replacing or offsetting.
Farreny et al. (2011) conducted a similar quality comparison with public groundwater
sources in their analysis.
The results of these various studies were not analyzed for this thesis, but their
general conclusions are compared and contrasted below. With the exception of Kim et al.
(2004), which did not compare its results to any water quality standards, every study
reviewed showed at least one drinking water violation in their rainwater quality tests. The
most common violations were microbial parameters like E. coli, fecal coliforms, and total
coliforms (Domènech & Saurí 2011; Vialle et al. 2011; Morrow et al. 2010; Lee et al.
2010; Abdulla & Al-Shareef 2009; Radaideh et al. 2009; Sazakli et al. 2007; Chang et al.
2004; Zhu et al. 2004; Coombes, Kuczera, & Kalma 2003; Simmons et al. 2001;
Coombes et al. 2000). The next most common violations were mineral and heavy metal
parameters like lead, arsenic, zinc, aluminium, and copper (Farreny et al. 2011; Morrow
!!!!!!!!!!!!!!!!!!!!!!!!!!!!!!!!!!!!!!!!!!!!!!!!!!!!!!!!17!Depending on the study, these rainwater samples were taken from storage tanks that contained rainwater that was either entirely unfiltered and untreated or filtered by nothing more than a wide mesh and a FFD.!

!
!
95!
et al. 2010; Lee et al. 2010; Radaideh et al. 2009; Chang et al. 2004). Other than these
microbial and mineral violations, it seems that harvested rainwater is safe and appropriate
for human consumption. In fact, for other water quality parameters, rainwater tends to be
cleaner than ground and surface water alternatives in almost all cases.
Unlike groundwater, rainwater is usually free of chemical contaminants like
pesticides and fertilizers, and is almost always more colorless, less hard, less turbid, of
more appropriate pH, and with a smaller concentration of suspended solids and salts
(Farreny et al. 2011; Lee et al. 2010; Abdulla & Al-Shareef 2009; Kahinda et al. 2007;
Sazakli et al. 2007; Zhu et al. 2004). The two studies that actually compared rainwater
quality to groundwater quality, Farreny et al. (2011) and Lee et al. (2010), even found a
series of drinking water violations present in the groundwater samples that were absent
from rainwater. Farreny et al. (2011) found that the concentrations of all minerals and
heavy metals in their roof runoff harvested rainwater samples were within EU drinking
water standards except for ammonium and nitrites. However, they found concentrations
of phosphates and chlorine that were well above European drinking water standards in a
significant portion of their groundwater samples for the Metropolitan Area of Barcelona
(Farreny et al. 2011). They also found concentrations of nitrates, nitrites, and sulfates
that, in addition to being much higher than those in rainwater, violated European drinking
water standards in an insignificant portion of their samples (Farreny et al. 2011). Lee et
al. (2010) found that the concentrations of all minerals and heavy metals in harvested
rainwater were within WHO Drinking Water Standards except aluminum. In addition,
they found higher than permissible concentrations of total coliforms and E. coli in 91.6%
and 72.0% of their roof runoff harvested rainwater samples, respectively (Lee et al.

!
!
96!
2010). However, they found higher than permissible concentrations of total coliforms and
E. coli in 94.4% and 85.2% of their groundwater samples, respectively, indicating that the
groundwater in South Korea is actually more contaminated than harvested rainwater for
microbial water quality parameters (Lee et al. 2010). These comparative results in
Farreny et al. (2011) and Lee et al. (2010) were attained without the use of FFDs or other
basic filtration devices for harvested rainwater samples.
B.3 Post-Storage Filtration and Treatment
Owners of RWH that wish to use their harvested rainwater for drinking, or that feel a
FFD would be insufficient to bring their harvested rainwater to the desired quality level,
have a variety of additional filtration and treatment options. Chlorine is recommended as
the cheapest and most easily applicable disinfectant (Helmreich & Horn 2008; Sazakli et
al. 2007; Texas Water Development Board 2005). It can be applied either in tablet form
or as gas and the desired concentration is between 0.4 and 0.5 mg/L (Helmreich & Horn
2008). However, it is noted that the chlorine should be applied after harvested water has
been removed from the storage tank, otherwise the chlorine may react with organic
matter settled at the bottom of the tank, resulting in undesirable by-products (Helmreich
& Horn 2008). In addition, some parasitic species have shown resistance to chlorine,
especially in low doses (Helmreich & Horn 2008).
An alternative to chlorination for improving the bacteriological quality of
rainwater is using a graded slow sand filter (Helmreich & Horn 2008; Texas Water
Development Board 2005). Although this method is comparable in price to chlorination,
it is generally slower and requires a constant flow of water through the filter (Helmreich
& Horn 2008; Texas Water Development Board 2005). It also requires some form of

!
!
97!
nutrient-reducing pre-treatment (Helmreich & Horn 2008). Although the sand/gravel
filter materials may be more readily available than chlorine gas or tablets for many
households, the knowledge necessary for this method of treatment is harder to come by
(Helmreich & Horn 2008).
A third, cheap method of disinfection mentioned in the literature is pasteurization
by solar technology, combining UV-A radiation with heat (Helmreich & Horn 2008;
Texas Water Development Board 2005). This method happens to be the most common in
Texas, and is a combination of cartridge filters and ultraviolet (UV) light treatment
(Texas Water Development Board 2005). Water passes through a 5-micron cartridge
filter [with a screen of 5 micrometer mesh], a 3-micron activated charcoal filter, and a
UV lamp (Texas Water Development Board 2005). In theory, the 5-micron filter removes
dust and other suspended particles, the 3-micron filter traps microscopic particles and
absorbs organic molecules into the activated surface, and the UV lamp acts as final
guarantee of purity (Texas Water Development Board 2005). Both filters and the UV
lamp must be replaced regularly, and the UV lamp requires additional maintenance if it is
to live up to its 10,000 hour lifespan (Texas Water Development Board 2005). In
addition, the filters and UV have a maximum recommended volume per time of 12
gallons [45 liters] per minute and if more is required doubling up on filters and using
stronger UV lights will be necessary (Texas Water Development Board 2005). This high-
tech process may work for those rich enough to afford it, but Helmreich and Horn (2008)
suggest that it can be achieved in poorer parts of the work too by creating "batches" of
rainwater in bottles or bags and placing them in direct sunlight, or continuous flow
(SODIS) reactors. A minimum of fifty degrees Celsius is recommended and has been

!
!
98!
shown to successfully inactivate E. coli and other undesirable bacteria if given enough
time to do so (Helmreich & Horn 2008). The "batch" methods are relatively labor
intensive but can treat sufficient water for a household’s drinking consumption
(Helmreich & Horn 2008). The continuous flow methods like SODIS reactors can
produce about 100 L of disinfected water per square meter of solar collector per day
(Helmreich & Horn 2008). However, neither method functions properly if the water has
more 10 mg/L of suspended solids, and thus other filtration processes may be necessary
(Helmreich & Horn 2008).
These first three filtration methods give a variety of options for eliminating
bacteriological contaminants in cheap but labor-intensive ways. However, the removal of
hazardous substances and inorganic pollutants from rainwater can be more difficult. Fast
sand filters are sometimes used but are only appropriate for certain, large pollutants
(Helmreich & Horn 2008). The addition of a filtration layer made of activated carbon,
anthracite coal, or a metal membrane (1-5 micrometers) has been shown to remove most
microorganisms, however these methods are generally rather expensive (Helmreich &
Horn 2008). Ozone provides another option of treatment. Some RWH system owners
pump ozone into their storage tanks overnight and the highly reactive compound acts as
an oxidizing agent, reducing color, eliminating foul odors, and reducing the total organic
carbon in the water, eventually dissipating within 15 minutes of injection (Texas Water
Development Board 2005). Membrane filtration methods like reverse osmosis and
nanofiltration are another option. They force water through a semi-permeable membrane
at a high pressure, filtering dissolved solids and salts (Texas Water Development Board
2005). The process is generally thought to be overkill for rainwater because a percentage

!
!
99!
of water that does not make it through the membrane is lost as "brine," and thus other
methods of treatment are usually preferred, at least for rainwater (Texas Water
Development Board 2005).
!

!
!
100!
Appendix C: Valuing the Rainwater Harvest
C.1 Current Rainwater Values
In order to put a value to harvested rainwater, it is necessary to incorporate the prices that
households are currently paying for non-potable water. Households in Oaxaca obtain
water from six distinct sources: (1) piped municipal water; (2) trucked municipal water;
(3) municipal well water; (4) trucked water purchased from private enterprises; (5)
private well water; and (6) private RWH systems. Sources 5 and 6, harvested rainwater
and private well water, are free, with no associated costs other than private upkeep and
maintenance. Source 4, private water trucks, is generally the most expensive of the six,
with a wide range of prices that vary widely across households. Sources 1, 2, and 3 are all
supplied by the state water agency, ADOSAPACO. All tariffs and fees associated with
sources 1, 2, and 3 are therefore connected and these sources will be treated as a single
entity this point forward. Hence, only the first four sources have substantial costs to the
household18, and, since the first three can be treated as one, economic analysis of RWH
will include the distinct costs of only two present water sources that harvested rainwater
could potentially replace: public ADOSAPACO services and private water truck services.
!!!!!!!!!!!!!!!!!!!!!!!!!!!!!!!!!!!!!!!!!!!!!!!!!!!!!!!!18!In the survey, households were asked to estimate the monetary costs and the hours of labor they invested annually to maintain their RWH systems. Although these costs and time play an important role in the perceptions and incentives/disincentives to adopting RWH systems, the responses were too variable and too dependent on maintenance practices that change between households and that would also be expected to change if system improvements were adopted to be included in the model. They are, however, reported briefly in Chapter 4.!

!
!
101!
C.1.1 The Two-Price System
Using this simplified two-source, two-price system the relationship developed for his
model between current household water costs and the value of harvested rainwater can be
seen below:
!! = !!!!!!"#!!!"!
∗ !!!"# +!!!"#!!!"!
∗ !!!"#
where !! is the value of household j’s annual rainwater harvest (pesos), !! is the annual
rainwater harvest of household j (liters), !!!"# is the percentage of household j’s
consumption supplied by ADOSAPACO, !!!"# is the percentage of household j’s
consumption supplied by private water trucks, !!!"! is the percentage of household j’s
consumption supplied by all non-RWH sources, !!!"# is the price per liter paid by
household j for ADOSAPCO service (pesos), and !!!"# is the price per liter paid by
household j for private water truck service (pesos).
C.1.2 Public Water Prices
Although !!!"! ,!!!"# , !!!"! , and !!!"# are household-specific information taken directly
from the survey, official ADOSAPACO documents present different public water prices,
!!!"#, than those reported by respondents.
In trying to negotiate between these two, sometimes drastically, different prices, a
decision was made to combine the two. Households generally do not have keen sense of
exactly how much water they receive from ADOSAPCAO sources. Although they
generally know how much they pay, the nature of ADOSAPACO water delivery, filling
!
!
102!
cisterns and tinacos once a day, 1-7 times per week, makes it very difficult for
households to know exactly how much water they have received. Hence, the conclusion
was reached that the water prices reported by households in the survey were likely to be
exaggerated19. On the other hand, both survey respondents and coworkers at INSO
suggested that the prices published in official ADOSAPACO documents were likely to
understate the tariffs actually being charged to households. This is almost entirely due to
the Oaxacan “water shortage” and to the fact that most households receive less water than
ADOSAPACO reports, while still paying the same bi-monthly fee. Therefore, !!!"#has
been defined in this model as a combination of household estimations and official
ADOSAPACO price characterizations.
There are various types of ADOSAPACO tariffs. Households are charged fixed
payments of 40 pesos annually for the right to connect to the system and 80 pesos
annually for a water meter, the corresponding data collection, and the maintenance and
replacement costs such meters require (“Honorable Ayuntamiento of Oaxaca de Juárez”
2005). In addition, households are charged either a variable rate per cubic meter (1,000
liters) consumed or a flat consumption fee of 38 pesos every two months for colonias and
103 pesos every two months for non-colonias (“Honorable Ayuntamiento of Oaxaca de
Juárez” 2005). The variable rates are listed below in Table C.1:
!!!!!!!!!!!!!!!!!!!!!!!!!!!!!!!!!!!!!!!!!!!!!!!!!!!!!!!!19!Survey results reveal that, according to their own estimations, households pay anywhere from 3.5 pesos per cubic meter to 750 pesos per cubic meter, with a median of 18.18 pesos per cubic meter. In addition, a correlation coefficient of negative 0.378 was found between quantity received and price per cubic meter paid, indicating that households that receive more water from ADOSAPCO actually pay less per quantity, which is the opposite of the agency’s stated intention, as can be seen in Table C.1 below.!

!
!
103!
Table C.1: Piped ADOSAPACO Water Tariff!!
Range of Consumption Tariff (2002) (pesos/!!)
0 to 20 !! 0.637
21 to 30 !! 0.950!
42 to 240 !! 1.264!
241 to 480 !! 1.508
> 480 !! 1.900
1 Adapted from ”Plan Municipal de Desarrollo Sus- tentable (2005-2007)” 2 There is a break between 30 and 42 m3, however this is exactly as printed in (“Honorable Ayuntamiento of Oaxaca de Juárez” 2005). It is assumed here that 42 is misprinted and 31 is the real value
The “Honorable Ayuntamiento of Oaxaca de Juárez” (2005) states that these variable
rates are intended for metered households, but also reports that only 18% of households
in Oaxaca are charged the variable rates, despite that fact that 95% of households are
metered (“Honorable Ayuntamiento of Oaxaca de Juárez” 2005). The remaining 82% are
charged the flat consumption fees instead.
This model assumes that all households are metered, and therefore paying 120
pesos in fixed payments annually. Because respondents were not asked in the survey if
their household was metered, there is no way to know which households pay the smaller,
40 peso, fixed payment. Hence, this difference, for the unmetered 5%, is assumed to be
negligible 20 . In addition, it assumes that all households are charged the variable
consumption fees, paying per liter according to their total consumption, rather than the
flat consumption fees. This choice was made because obtaining a per liter water price for
a household paying 120 pesos in fixed payments and 456 pesos (38 pesos × 12 months)
!!!!!!!!!!!!!!!!!!!!!!!!!!!!!!!!!!!!!!!!!!!!!!!!!!!!!!!!20!Also in support of this assumption is the fact that the “Honorable Ayuntamiento of Oaxaca de Juárez” (2005) makes it clear that it would like all households to be metered, but that the high iron and magnesium concentrations increase the frequency of meter failure and thus the percentage of unmetered households.!

!
!
104!
in flat consumption fees annually would necessitate dividing their total annual payments,
576 pesos, by their total annual consumption, which place a large emphasis on the
accuracy of this consumption figure. Since the only household consumption data
available were the guesses provided by respondents themselves, the variable rate was
selected as the more accurate and viable option.
Fixed and variable ADOSAPACO water prices were combined with the prices
households themselves reported in the following way:
!!!"# = !"#!!"# +!"#!!"#
!!!"#∗!!
+ 3 !"#! !"#!!! − !"#!!"# −!"#!!"#
!!!"#∗!!
!
where !"#!!"# is the price per liter according to ADOSAPACO documents (pesos),
!"#!!"# is the annual tariff for being connected to the ADOSAPACO system (pesos),
!"#!!! is the price per liter for public water reported by household j in the survey
(pesos), and !! !is the annual water consumption of household j (liters).
C.2 Projected Future Rainwater Values
Scenarios 1, 2, and 3 use the current water prices described above to value harvested
rainwater over the ten-year period analyzed. However, scenarios 4, 5, and 6 assume that
the dam construction will be completed after 5 years, and that water prices and water
supply distributions will shift accordingly. To account for this, it is assumed that
households will transfer much of their current private water purchases to public sources,
such that:

!
!
105!
!!!!"# = !!!"# + 0.8!!!"# and !!!!"# = 0.2!!!"#
where !!!!"#is the projected future percentage of household j’s consumption supplied by
ADOSAPACO and !!!!"# is the projected future percentage of household j’s
consumption supplied by private water trucks.
The projected future price of water is modeled in a more complicated fashion. It is
simulated by applying a factor of price inflation (assumed to be 5.5) to the per liter,
variable rates in both the ADOSAPACO documents and those reported in the survey:
!"!!"# = ! ∗ !"#!!"# +!"#!!"#!"!
!"# + 3 !"#! ! ∗ !"#!!! − ! ∗ !"#!!"# −!"#!!"#!"!
!"#
!
where !"!!"# is the projected future price per liter paid by household j for ADOSAPCO
service and ! is the probable factor of price inflation.
The future price of private water is simulated by applying the same probable
factor of price inflation (assumed to be 5.5) to current private water prices. However, as a
control, the average ratio of private per liter water prices to public per liter water prices
(found to be 10.5) was applied to the projected future price of public water. When this
yielded prices greater than the price of potable garrafon water, 3 was chosen as factor of
increase instead. This choice is justified by the fact that private water is unlikely to
increase in price as much as public water. The average of these two methods of projecting
the future price of private water was used as the final estimate, as can be seen below:

!
!
106!
!"!!"# =! ∗ !"!!"# + ! ∗ !!!"#
2
where !"!!"# is the projected future price per liter paid by household j for private water
truck service and ! is the average factor of price difference between public and private
water.
Substituting these percentages and prices into the equation to estimate the annual
value of household j’s rainwater harvest yields:
!"! = !!!!"!!"#!!!"!
∗ !"!!"# +!"!!"#!!!"!
∗ !!!"#
where !"! is the projected future value of household j’s annual rainwater harvest.

!
!
107!
Appendix D: The Cost of Basic RWH System Improvements
Basic improvement costs are divided into three categories: channeling costs, filtration
costs, and pump costs. Channeling improvement costs refer to the material and labor
costs associated with gutter and downspout installation. Likewise, filtration
improvements costs refer to material and labor costs associated with FFD installation and
pump improvement costs to the cost of purchasing an electric pump. Taken together with
the costs of purchasing additional water storage, the sum yields initial capital costs a
household would need to invest in their RWH system to bring themselves to the RWH
potential expressed by Scenarios 2, 3, 5, and 6. The details of this investment calculation
are shown below:
!! = !!! ∗ !"#!! + !!! ∗ !"#$! + !!! ∗ !"#! + !!! ∗ !"#$!
where !! is the cost of basic system improvements and additional storage for household j
(pesos), !!! is the need of channeling variable; =1 if household j needs channeling
improvements, =0 if they don’t, !!!is the need of filtration variable; =1 if household j
needs filtration improvements, =0 if they don’t, !!!is the need of pumping variable; =1 if
household j needs a pump, =0 if they don’t, !!! is the need of storage variable; =1 if
household j would benefit from increased storage, =0 if they wouldn’t, !"#!! is the
channeling improvement costs for household j (pesos), !"#!! is the filtration
improvement costs for household j (pesos), !"#! is the cost of an electric pump (pesos),
and !"#$! is optimized additional storage costs for household j (pesos). Both channeling
costs and filtration costs are higher for households with larger catchment areas. Hence,

!
!
108!
they have been allowed to vary with the size of a household’s catchment area. Similarly,
the costs of additional water storage are dependent on the quantity of additional water
storage that Microsoft Excel’s “Solver” function recommends for a household. Pump
costs, on the other hand, are independent of household characteristics and held constant at
1,500 pesos. The details of how each of these variable varies can be found below:
!"#!! =!! 180− 40!"#! !!
1+ 3!!!
!"#$! = 1− 0.25!!! 1,000!"#! !! − 500
!"#! = 1,500
!"#$! = !! 2.25− !"#!" !!4
where !! is the catchment area of household j (m2), !!! is the need of downspout variable;
=1 if household j already has gutters but needs downspouts, =0 if household j has neither
gutters nor downspouts, and !! is the additional storage capacity invested in by
household j (liters).
The equations for channeling costs, filtration costs, and additional storage costs
were developed specifically for use in this thesis. The channeling costs and filtration
costs equations are meant to replicate the relationship between the costs that INSO
quoted to households interested in improving their RWH systems for these components
and the size of each of the quoted household’s catchment areas. The additional storage
costs equation is meant to replicate the relationship between tinaco storage capacity and
tinaco cost found on Verdin’s (2005) website and an INSO document that estimates the
costs of a 30,000-liter belowground cement cistern.

!
!
109!
Appendix E: Survey Results
E.1 ADOSAPACO
Lusher (2007) found that Oaxaca de Juárez has one of the lowest piped municipal water
prices in Mexico, with most residents paying 0.637 pesos per cubic meter (“Honorable
Ayuntamiento of Oaxaca de Juárez” 2005). This claim, however, is based on the price
that ADOSAPACO asserts it is charging, and since many households are paying a fixed
rate and then receiving less water than they need in the drier months, the price per
quantity received is actually much higher. Although households were not able to say
exactly what price they were paying, the amount they pay in annual tariffs was divided by
the water quantity they said they received annually from ADOSAPACO (whether it was
through the pipes, carried by truck, or out of a municipal well). The result was a wide
range of prices, from 3.50 pesos per cubic meter (1,000 liters) to 750 pesos per cubic
meter, with a mean of 56.5 and a median of 19.5. A reasonable level of doubt should be
applied to the quantities of water that households estimated they receive annually from
ADOSAPACO, but, regardless of the inaccuracies inherent in these types of estimations,
it is clear that ADOSAPACO is delivering less water than it once did, and less water than
the people need.
Households with a connection to ADOSAPACO were asked how many times per
month they received water via this connection, during both the wet and the dry season.
The 41 (91.1%) households with an ADOSAPACO connection received water an average
of 8.35 times during the wet season and 4.67 times during the dry season. While some
respondents reported that they receive water as many as 30 times per month, during both
wet and dry seasons, others reported as little as one time per month during the wet season

!
!
110!
and zero during the dry season. 17 of the 41 (41.5%) households with an ADOSAPACO
connection received water via the pipes less than once per week during the wet season,
and 31 of these same 41 (75.6%) received water less than once per week during the dry
season. It is no wonder then, that the high end of the per-liter price range of public water
is over 200 times greater than the low end.
The same piping system failures that are responsible for this wide range of
distribution success, and thus prices, are also a likely cause of the high variation in water
quality. When asked to rate the quality of piped ADOSAPACO water on a 1 to 5 Likert
scale, where 1=very bad, 2=bad, 3=mediocre, 4=good, and 5=very good, survey
respondents gave a wide variety of answers. The distribuition is presented below in Table
E.1:
Table E.1: Quality of Piped ADOSAPACO Water
Quality Rating
# of HHs giving rating
% of HHs giving rating
1 4 8.9% 2 18 40.0% 3 8 17.8% 4 14 31.1% 5 1 2.2%
While some households felt that the water coming out of their taps was practically
potable, others reported that it often came out very smelly, and sometimes even brown. It
is more than likely that such water quality variability is a product of systemic problems
and not differences of opinion.
Another way to measure water quality is to look at the number of households that
chose to treat water from this source. Although this brings in potentially confounding
!
!
111!
economic factors since treatment is costly, the result aligns with the quality ratings above.
Only 12 of 41 households (29.3%) receiving piped water from ADOSAPACO chose (or
had the money) to treat it. 8 of these 12 (66.7%) use an ADOSAPACO-sponsored
cartridge filter21, 3 of 12 (25.0%) use additional chlorine (beyond what ADOSAPACO
already uses), 1 of 12 (8.3%) uses a Japanese-designed water treatment device called the
Leveluk SD501 from the US company Enagic, and 4 of 12 (33.3%) boil their water
before either drinking or cooking with it.
E.2 Public Water Trucks
Public water trucks are supposed to have two purposes in Oaxaca. First, they deliver
water to neighborhoods that pay into the system but have no pipes to conduct the water to
them. Second, in times of drought, they supposed to carry state-purchased water from
sources that are not publicly owned to neighborhoods that have not received their share of
water through the pipes. However, only 13 of 45 (28.9%) households reported that they
receive service from ADOSAPACO’s public water trucks. The most common reason
reported for this was a simple lack of service. 17 of the 32 (53.1%) respondents that did
not receive water from public water trucks stated that the public water trucks did not
serve their neighborhood. Another common reason was the irregularity and unreliability
of service, even for the neighborhoods that were supposed to receive public trucks. 6 of
32 (18.8%) respondents alluded to this unreliability, and many told stories about calling
ADOSAPACO, being promised a delivery, and then never receiving one, or, when and if
the public water truck finally arrived, only receiving a few hundred liters, sometimes less,
!!!!!!!!!!!!!!!!!!!!!!!!!!!!!!!!!!!!!!!!!!!!!!!!!!!!!!!!21!One survey respondent reported that the ADOSAPACO cartridge filters cost approximately 100 pesos to purchase and 100 pesos to replace, and that they are supposed to last about 2-3 months.
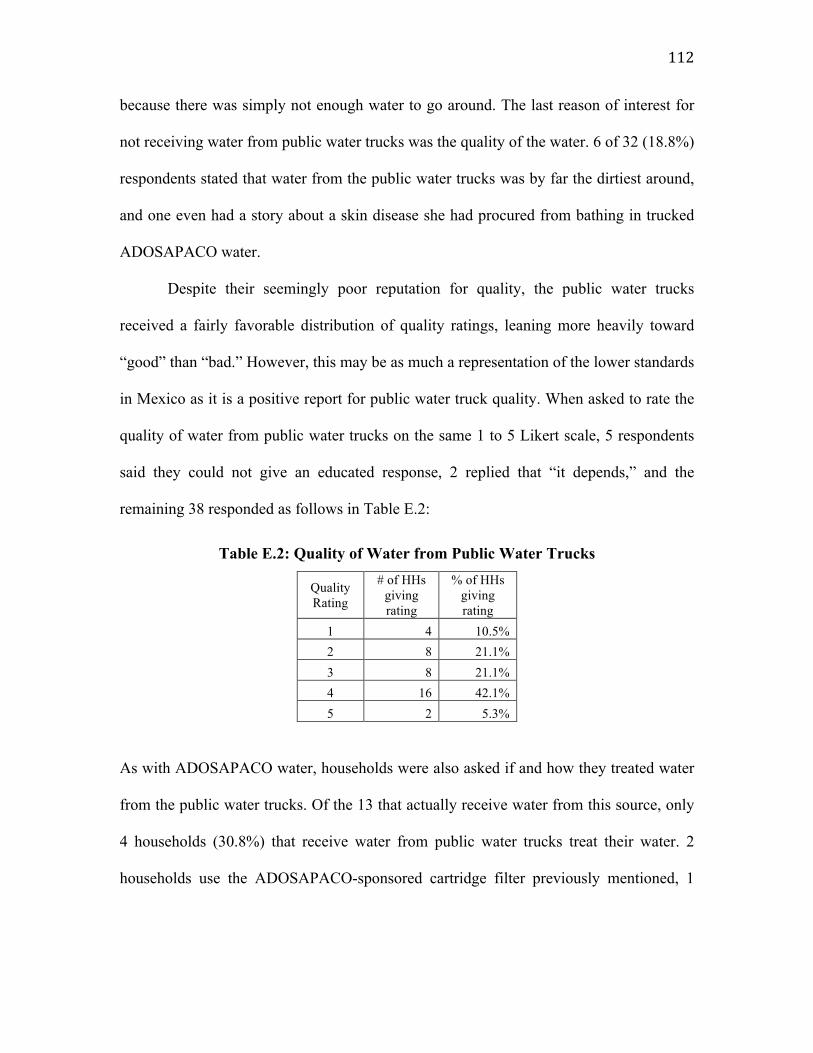
!
!
112!
because there was simply not enough water to go around. The last reason of interest for
not receiving water from public water trucks was the quality of the water. 6 of 32 (18.8%)
respondents stated that water from the public water trucks was by far the dirtiest around,
and one even had a story about a skin disease she had procured from bathing in trucked
ADOSAPACO water.
Despite their seemingly poor reputation for quality, the public water trucks
received a fairly favorable distribution of quality ratings, leaning more heavily toward
“good” than “bad.” However, this may be as much a representation of the lower standards
in Mexico as it is a positive report for public water truck quality. When asked to rate the
quality of water from public water trucks on the same 1 to 5 Likert scale, 5 respondents
said they could not give an educated response, 2 replied that “it depends,” and the
remaining 38 responded as follows in Table E.2:
Table E.2: Quality of Water from Public Water Trucks
Quality Rating
# of HHs giving rating
% of HHs giving rating
1 4 10.5% 2 8 21.1% 3 8 21.1% 4 16 42.1% 5 2 5.3%
As with ADOSAPACO water, households were also asked if and how they treated water
from the public water trucks. Of the 13 that actually receive water from this source, only
4 households (30.8%) that receive water from public water trucks treat their water. 2
households use the ADOSAPACO-sponsored cartridge filter previously mentioned, 1

!
!
113!
treats with additional chlorine, 1 with both a cartridge filter and chlorine, and 1 by boiling
before using the water for cooking or drinking.
E.3 Private Water Trucks
The “Honorable Ayuntamiento of Oaxaca de Juárez” (2005) states that households pay
60 pesos per cubic meter for water from private water trucks. Lusher (2007) reports that
over half the respondents in her survey were paying more than 80 pesos per cubic meter,
with a mean of 173 pesos. My own survey results present a range prices from 33.3 pesos
per cubic meter to 1,000 pesos per cubic meter, with a mean of 156 pesos per cubic meter
and a median of 100 pesos per cubic meter.
This large range is surprising when one considers the competition in the market
for this service. One would think that the 200 or so private water truck companies that
Juán José Consejo (2011) and others estimate are in existence would keep private water
prices low and relatively consistent. The absence of this effect illustrates the lack of
“perfect information” in this market. Rather than contacting a regular company whose
reputation for quality and a fair price has been established by previous interactions,
households will usually solicit private water trucks by flagging them down off the street,
after being brought to their doorstep by the sound of chains dragging behind and the call
from the truck’s loudspeaker of, “Agua, agua!” Of the 34 households that receive water
from private water trucks, only 8 (23.5%) have specific companies they regularly
purchase from, and not a single company name is shared between these eight. Hence, the
market for private water trucks in Oaxaca is not competitive, and the range of prices for
private water truck services is very wide.
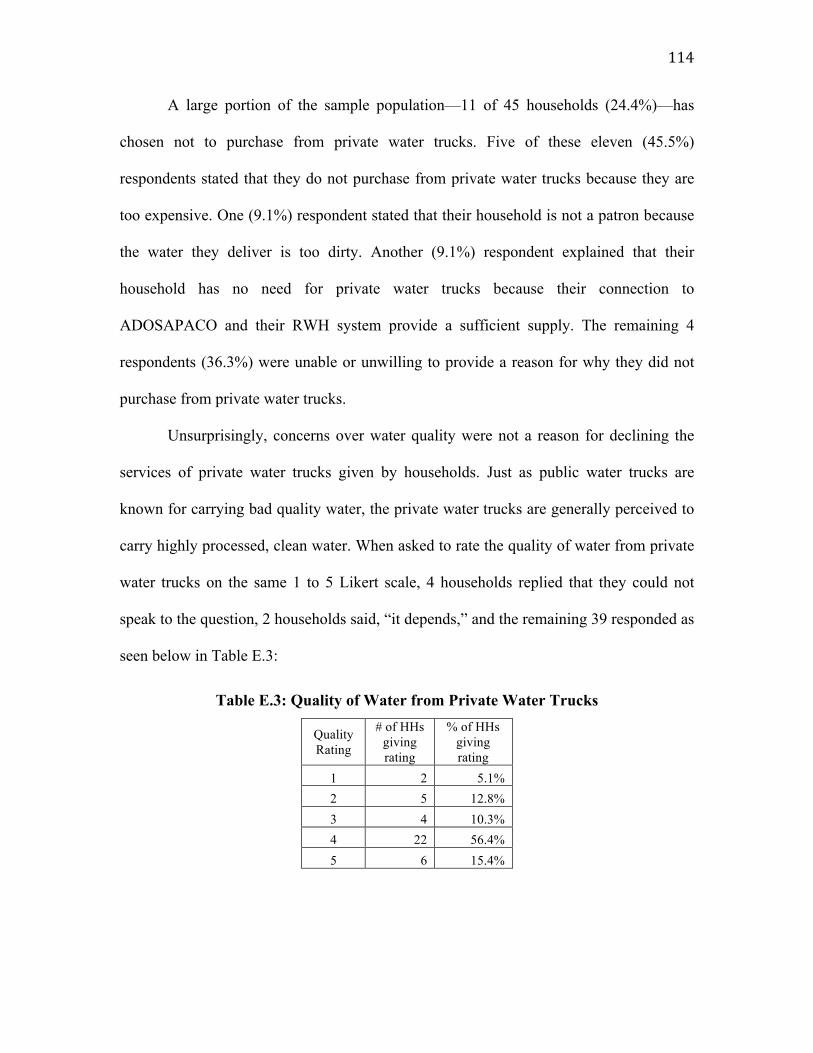
!
!
114!
A large portion of the sample population—11 of 45 households (24.4%)—has
chosen not to purchase from private water trucks. Five of these eleven (45.5%)
respondents stated that they do not purchase from private water trucks because they are
too expensive. One (9.1%) respondent stated that their household is not a patron because
the water they deliver is too dirty. Another (9.1%) respondent explained that their
household has no need for private water trucks because their connection to
ADOSAPACO and their RWH system provide a sufficient supply. The remaining 4
respondents (36.3%) were unable or unwilling to provide a reason for why they did not
purchase from private water trucks.
Unsurprisingly, concerns over water quality were not a reason for declining the
services of private water trucks given by households. Just as public water trucks are
known for carrying bad quality water, the private water trucks are generally perceived to
carry highly processed, clean water. When asked to rate the quality of water from private
water trucks on the same 1 to 5 Likert scale, 4 households replied that they could not
speak to the question, 2 households said, “it depends,” and the remaining 39 responded as
seen below in Table E.3:
Table E.3: Quality of Water from Private Water Trucks
Quality Rating
# of HHs giving rating
% of HHs giving rating
1 2 5.1% 2 5 12.8% 3 4 10.3% 4 22 56.4% 5 6 15.4%
!
!
115!
However, even private water trucks, which are considered the cleanest of all non-potable
water sources, received almost 20% “bad” or “very bad” quality ratings. This illustrates
the futility of asking survey questions regarding general perceptions, like these regarding
water quality. Some respondents were probably comparing the quality of water from
private water trucks to that of ADOSAPACO, giving a comparatively high rating as a
result. Other might have been comparing it the quality of water in a U.S. city and giving
low ratings to all water sources in Oaxaca. Thus, the results of such questions are best
used comparatively, and a comparative discussion of these quality-rating tables and other
water use data can be found in Chapter 5.
Moreover, 11 of the 34 households (32.3%) that receive water from private water
trucks treat the water from this source, a percentage equivalent to the households that
treat their public water truck water. 5 of these 11 (45.5%) do so using a cartridge filter, 4
of 11 (36.4%) employ additional chlorine, 1 of 11 (9.1%) has a the Leveluk SD501 water
filter by Enagic mentioned previously, another 1 of 11 (9.1%) uses a carbon filter, and 4
of these 11 (36.4%) boil their water in addition to other treatments if they are using it
cooking or drinking.
E.4 Public and Private Wells
Although much of ADOSAPACO’s piped municipal water is drawn from public wells,
the number of households that receive water directly public wells, rather than via the
pipes, is relatively small, 1 in 45 households (2.2%). Similarly, many households have
private wells, but, because the aquifer is so depleted, few are able to draw water from
them anymore. Thus public and private wells amount to only 1% and 1% of the sample
household’s water supplies, respectively. For public wells, the one household that

!
!
116!
receives water rated its quality at 1 on the Likert scale, “very bad.” For private wells, one
household (20%) gave a rating of 2, one household (20%) gave a rating of 3, and three
households (60%) gave a rating of 4.
The one household that receives water from a public well does not treat it beyond
the municipality’s treatment before using it. 3 of 5 households (60%) treat the water they
draw from their private wells; one with cartridge filter if they are using it for bathing and
flushing their toilets and with colloidal silver if they are cooking or washing dishes, one
with additional chlorine, and one by boiling if they are using it for cooking or drinking.
!

!
!
117!
Appendix F: Model Inputs, Presented by Household !
Table F.1: Consumption, Catchment Area, STSC, and LTSC, by Household
!
Household ID
Monthly Household Consump-
tion (L)
Currently Used by Households Total Capacities Already at Households' Disposals
Catchment Area (!!) STSC (L) LTSC
(L) Catchment Area (!!)
STSC (L)
LTSC (L)
1 10,000 6 400 - 86 15,500 1,100 2 1,200 24 200 1,500 24 3,500 - 3 8,000 26 100 - 26 100 2,200 4 2,000 48 300 - 48 2,300 - 5 4,000 - - - 120 3,800 1,200 6 4,000 70 550 5,000 78 5,550 2,200 7 20,000 76 200 - 76 1,300 1,100 8 5,000 42 180 - 67 1,410 - 9 2,400 39 960 - 88 5,560 -
10 3,000 318 6,000 6,000 367 12,000 1,100 11 3,000 180 400 - 180 7,400 2,200 12 7,667 495 32,000 32,000 495 32,000 2,700 13 1,500 18 100 - 78 100 100 14 2,000 54 188 - 54 9,188 1,000 15 5,000 144 600 3,300 144 1,700 2,200 16 1,500 88 700 - 88 12,900 - 17 8,800 16 800 - 16 800 2,200 18 6,000 12 2,000 - 38 2,000 - 19 3,000 4 200 - 36 950 750 20 6,000 - - - 850 - 1,800 21 5,000 25 260 - 169 260 3,300 22 6,000 - - - 54 3,000 2,200 23 500 36 60 - 36 60 1,400 24 20,000 120 700 2,500 480 3,200 3,500 25 4,000 150 150 3,300 150 2,350 1,100 26 3,000 16 800 - 32 2,800 2,400 27 2,500 8 200 - 8 1,700 1,000 28 3,000 10 800 - 42 800 10,000 29 8,000 132 800 - 132 800 4,600 30 400 - - - 600 10,000 700 31 1,500 96 600 - 96 2,100 2,200 32 3,500 32 1,000 - 32 4,000 2,500 33 6,000 120 20 - 120 6,020 1,100 34 1,000 214 200 - 214 3,200 1,100 35 10,000 - - - 120 10,000 2,500 36 1,000 - - - 100 - 500 37 5,000 80 500 - 80 1,500 1,200 38 1,000 99 120 - 99 5,120 750 39 800 88 760 - 88 760 1,000 40 2,000 60 4,000 10,000 60 14,000 4,000 41 1,600 60 200 4,000 60 4,200 1,000 42 8,500 - - - 64 10,000 1,100 43 10,000 62 400 - 62 10,400 500 44 2,000 100 1,000 2,000 100 3,000 1,500 45 6,000 300 320 - 300 5,520 2,200
MEAN 4,808 77 1,306 1,547 139 4,952 1,671 MEDIAN 3,500 48 300 - 86 3,000 1,100
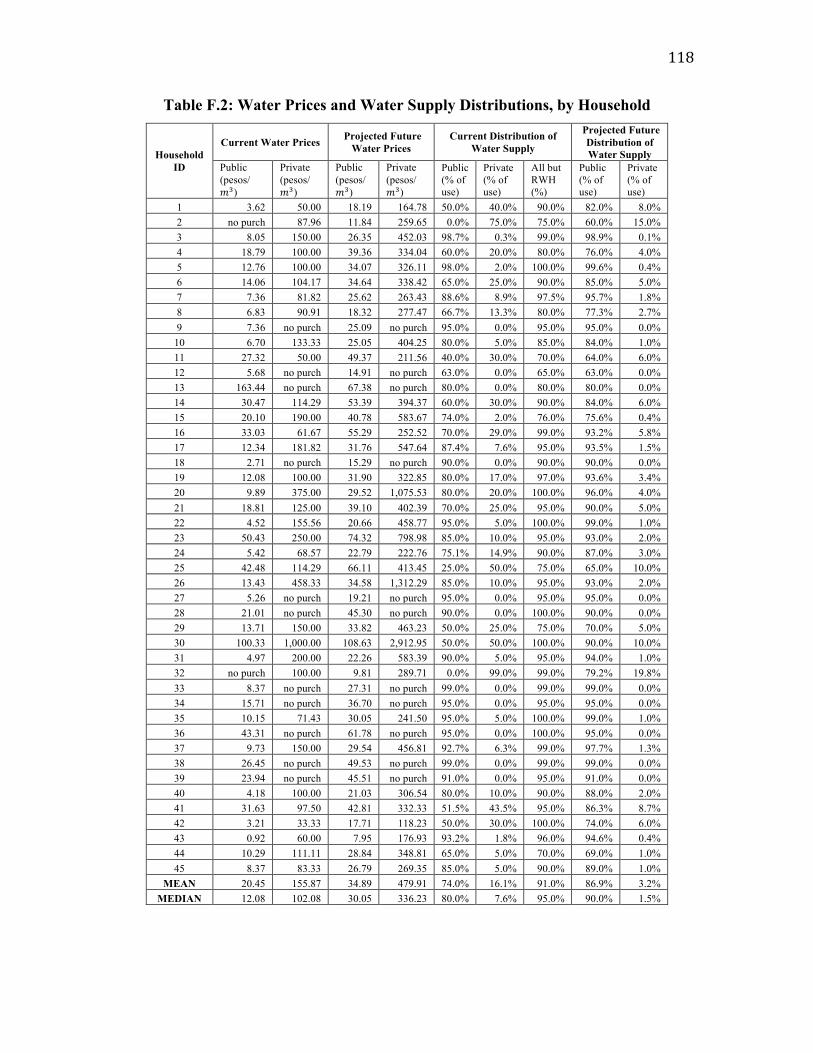
!
!
118!
Table F.2: Water Prices and Water Supply Distributions, by Household
Household ID
Current Water Prices Projected Future Water Prices
Current Distribution of Water Supply
Projected Future Distribution of Water Supply
Public (pesos/ !!)
Private (pesos/!!)
Public (pesos/!!)
Private (pesos/!!)
Public (% of use)
Private (% of use)
All but RWH (%)
Public (% of use)
Private (% of use)
1 3.62 50.00 18.19 164.78 50.0% 40.0% 90.0% 82.0% 8.0% 2 no purch 87.96 11.84 259.65 0.0% 75.0% 75.0% 60.0% 15.0% 3 8.05 150.00 26.35 452.03 98.7% 0.3% 99.0% 98.9% 0.1% 4 18.79 100.00 39.36 334.04 60.0% 20.0% 80.0% 76.0% 4.0% 5 12.76 100.00 34.07 326.11 98.0% 2.0% 100.0% 99.6% 0.4% 6 14.06 104.17 34.64 338.42 65.0% 25.0% 90.0% 85.0% 5.0% 7 7.36 81.82 25.62 263.43 88.6% 8.9% 97.5% 95.7% 1.8% 8 6.83 90.91 18.32 277.47 66.7% 13.3% 80.0% 77.3% 2.7% 9 7.36 no purch 25.09 no purch 95.0% 0.0% 95.0% 95.0% 0.0%
10 6.70 133.33 25.05 404.25 80.0% 5.0% 85.0% 84.0% 1.0% 11 27.32 50.00 49.37 211.56 40.0% 30.0% 70.0% 64.0% 6.0% 12 5.68 no purch 14.91 no purch 63.0% 0.0% 65.0% 63.0% 0.0% 13 163.44 no purch 67.38 no purch 80.0% 0.0% 80.0% 80.0% 0.0% 14 30.47 114.29 53.39 394.37 60.0% 30.0% 90.0% 84.0% 6.0% 15 20.10 190.00 40.78 583.67 74.0% 2.0% 76.0% 75.6% 0.4% 16 33.03 61.67 55.29 252.52 70.0% 29.0% 99.0% 93.2% 5.8% 17 12.34 181.82 31.76 547.64 87.4% 7.6% 95.0% 93.5% 1.5% 18 2.71 no purch 15.29 no purch 90.0% 0.0% 90.0% 90.0% 0.0% 19 12.08 100.00 31.90 322.85 80.0% 17.0% 97.0% 93.6% 3.4% 20 9.89 375.00 29.52 1,075.53 80.0% 20.0% 100.0% 96.0% 4.0% 21 18.81 125.00 39.10 402.39 70.0% 25.0% 95.0% 90.0% 5.0% 22 4.52 155.56 20.66 458.77 95.0% 5.0% 100.0% 99.0% 1.0% 23 50.43 250.00 74.32 798.98 85.0% 10.0% 95.0% 93.0% 2.0% 24 5.42 68.57 22.79 222.76 75.1% 14.9% 90.0% 87.0% 3.0% 25 42.48 114.29 66.11 413.45 25.0% 50.0% 75.0% 65.0% 10.0% 26 13.43 458.33 34.58 1,312.29 85.0% 10.0% 95.0% 93.0% 2.0% 27 5.26 no purch 19.21 no purch 95.0% 0.0% 95.0% 95.0% 0.0% 28 21.01 no purch 45.30 no purch 90.0% 0.0% 100.0% 90.0% 0.0% 29 13.71 150.00 33.82 463.23 50.0% 25.0% 75.0% 70.0% 5.0% 30 100.33 1,000.00 108.63 2,912.95 50.0% 50.0% 100.0% 90.0% 10.0% 31 4.97 200.00 22.26 583.39 90.0% 5.0% 95.0% 94.0% 1.0% 32 no purch 100.00 9.81 289.71 0.0% 99.0% 99.0% 79.2% 19.8% 33 8.37 no purch 27.31 no purch 99.0% 0.0% 99.0% 99.0% 0.0% 34 15.71 no purch 36.70 no purch 95.0% 0.0% 95.0% 95.0% 0.0% 35 10.15 71.43 30.05 241.50 95.0% 5.0% 100.0% 99.0% 1.0% 36 43.31 no purch 61.78 no purch 95.0% 0.0% 100.0% 95.0% 0.0% 37 9.73 150.00 29.54 456.81 92.7% 6.3% 99.0% 97.7% 1.3% 38 26.45 no purch 49.53 no purch 99.0% 0.0% 99.0% 99.0% 0.0% 39 23.94 no purch 45.51 no purch 91.0% 0.0% 95.0% 91.0% 0.0% 40 4.18 100.00 21.03 306.54 80.0% 10.0% 90.0% 88.0% 2.0% 41 31.63 97.50 42.81 332.33 51.5% 43.5% 95.0% 86.3% 8.7% 42 3.21 33.33 17.71 118.23 50.0% 30.0% 100.0% 74.0% 6.0% 43 0.92 60.00 7.95 176.93 93.2% 1.8% 96.0% 94.6% 0.4% 44 10.29 111.11 28.84 348.81 65.0% 5.0% 70.0% 69.0% 1.0% 45 8.37 83.33 26.79 269.35 85.0% 5.0% 90.0% 89.0% 1.0%
MEAN 20.45 155.87 34.89 479.91 74.0% 16.1% 91.0% 86.9% 3.2% MEDIAN 12.08 102.08 30.05 336.23 80.0% 7.6% 95.0% 90.0% 1.5%

!
!
119!
Appendix G: Basic Improvement Costs & Changes in Practice
Table G.1: Basic Improvement Costs & Changes in Perception & Practice
HH ID
Basic Improvement Costs (pesos) Change in Practices
Channeling Filtration Pump TOTAL Additional Harvested Rainwater End-Uses
Additional Storage Applied to RWH
1 5,959 1,701 - 7,660.04 cook, bath 1 cis, 2 tin r 2 - 1,475 no dist sys 1,474.64 cook 1 tin p 3 2,537 1,134 1,500 5,171.68 cook, bath 2 tin r 4 4,022 1,429 no dist sys 5,450.78 cook 2 tin p 5 7,322 1,856 - 9,177.72 cook 1 cis, 1 tin r 6 - 2,207 - 2,206.98 bath 1 cis, 2 tin r 7 - 2,191 1,500 3,690.84 cook 1 tin r, 1 tin p 8 - 2,113 no dist sys 2,112.52 cook, bath, laundry 1 cis 9 6,048 1,711 - 7,759.07 cook 1 cis
10 3,049 2,377 - 5,425.91 cook, bath, laundry, clean, flush 1 cis 11 2,292 2,045 - 4,337.11 cook, bath, laundry 1 cis, 2 tin r 12 - - - - cook, bath, laundry, clean, flush 3 tin r 13 5,594 1,655 1,500 8,749.47 cook NONE 14 1,092 1,484 - 2,575.48 cook 1 cis, 1 tin r 15 - 2,588 - 2,587.92 cook NONE 16 - 2,282 - 2,281.93 cook 1 cis, 2 tin r 17 - 1,223 - 1,222.71 cook, bath 2 tin r 18 851 1,320 no dist sys 2,171.26 cook, bath NONE 19 3,274 1,295 - 4,568.67 cook, bath, laundry 1 tin r, 1 tin p 20 10,504 2,768 1,500 14,772.55 cook 2 tin r 21 8,873 2,016 - 10,888.81 cook, bath 3 tin r 22 4,366 1,484 - 5,850.32 cook, bath 1 cis, 2 tin r 23 - 1,727 1,500 3,226.57 cook, bath, laundry, flush 2 tin r 24 - 3,336 - 3,335.99 cook 1 cis 25 8,320 1,960 - 10,280.27 cook 2 tin p, 1 tin r 26 - 1,653 1,500 3,153.38 NONE 2 tin r, 1 tam p 27 1,027 594 1,500 3,120.57 cook, bath 2 tin r, 1 tin p 28 - 1,822 - 1,822.34 cook, bath, laundry 1 tin r 29 7,741 1,900 1,500 11,141.63 NONE 4 tin r 30 12,609 2,606 - 15,214.72 cook 1 cis, 1 tin r 31 - 2,336 - 2,335.99 cook, bath, laundry 1 cis + 2 tin r 32 3,004 1,240 1,500 5,743.71 NONE 2 tin p, 1 tin r 33 7,322 1,856 - 9,177.72 cook, bath, laundry, clean, flush 1 cis, 1 tin r 34 2,495 2,126 - 4,620.64 cook 1 cis, 1 tin r 35 7,322 1,856 - 9,177.72 NONE 1 cis, 1 tin r 36 6,555 1,771 1,500 9,825.60 cook 1 tin r 37 - 2,223 1,500 3,722.71 cook, bath, laundry 1 tin r, 5 tam p 38 6,514 1,766 - 8,280.10 cook, bath, laundry 1 cis, 1 tin r 39 6,048 1,711 1,500 9,259.07 cook 1 tin r 40 - 2,044 - 2,043.96 cook 1 cis, 4 tin r 41 4,694 1,533 - 6,227.47 NONE 1 cis, 1 tin r 42 4,905 1,563 - 6,467.85 cook, bath, laundry 1 cis, 1 tin r 43 4,800 1,548 - 6,348.70 cook, bath 1 cis, 1 tin r 44 6,555 1,771 - 8,325.60 cook, bath 1 cis, 2 tin r 45 - 3,044 - 3,043.96 cook, bath 1 cis, 3 tin p, 2 tin r

!
!
120!
Where “cis” refers to a cistern, “tin” to a tinaco, and “tam” to tambos. Similarly, “r”
means that the unit in question is located on the roof, and “p” that it is at ground level on
the patio.

!
!
121!

!
!
122!
Appendix H: Model Results, Presented by Household
Table H.1: Scenario 1 Results
Current Practices with Constant Water Pricing
Household ID
Size of Annual
Harvest (L)
WSE (% consumption
offset by RWH)
Value of Annual Harvest (pesos)
Cost of Basic Improvements
(pesos)
Optimized Additional Storage (L)
Cost of Additional
Storage (pesos)
NPV of RWH
System (pesos)
Payback Period (years)
1 3,677 3.1% 89 - - - 760 - 2 10,063 69.9% 885 - - - 7,551 - 3 8,774 9.1% 75 - - - 638 - 4 14,816 61.7% 579 - - - 4,941 - 5 - 0.0% - - - - - - 6 32,440 67.6% 1,268 - - - 10,817 - 7 17,769 7.4% 251 - - - 2,144 - 8 15,715 26.2% 328 - - - 2,794 - 9 16,815 58.4% 124 - - - 1,056 -
10 34,762 96.6% 492 - - - 4,195 - 11 22,778 63.3% 844 - - - 7,197 - 12 99,298 107.9% 547 - - - 4,662 - 13 8,616 47.9% 1,408 - - - 12,012 - 14 13,352 55.6% 780 - - - 6,653 - 15 38,956 64.9% 957 - - - 8,164 - 16 13,627 75.7% 564 - - - 4,815 - 17 9,806 9.3% 254 - - - 2,164 - 18 7,354 10.2% 20 - - - 170 - 19 2,451 6.8% 67 - - - 575 - 20 - 0.0% - - - - - - 21 15,096 25.2% 706 - - - 6,021 - 22 - 0.0% - - - - - - 23 3,700 61.7% 264 - - - 2,255 - 24 59,705 24.9% 947 - - - 8,077 - 25 13,500 28.1% 1,220 - - - 10,405 - 26 9,806 27.2% 591 - - - 5,041 - 27 4,903 16.3% 26 - - - 220 - 28 6,128 17.0% 116 - - - 988 - 29 53,026 55.2% 3,136 - - - 26,751 - 30 - 0.0% - - - - - -

!
!
123!
31 13,662 75.9% 208 - - - 1,776 - 32 19,611 46.7% 1,961 - - - 16,729 - 33 1,800 2.5% 15 - - - 129 - 34 8,833 73.6% 139 - - - 1,184 - 35 - 0.0% - - - - - - 36 - 0.0% - - - - - - 37 33,081 55.1% 619 - - - 5,279 - 38 7,433 61.9% 197 - - - 1,677 - 39 8,478 88.3% 194 - - - 1,658 - 40 29,596 123.3% 439 - - - 3,743 - 41 15,702 81.8% 970 - - - 8,274 - 42 - 0.0% - - - - - - 43 33,418 27.8% 67 - - - 574 - 44 19,769 82.4% 346 - - - 2,949 - 45 28,800 40.0% 361 - - - 3,079 -
MEAN 16,825 41.3% 490 - - - 4,180 - MEDIAN 13,352 40.0% 264 - - - 2,255 -
Table H.2: Scenario 2 Results Basic Improvements, No Changes in Current Storage Uses, Additional Storage (if needed), & Constant Water Pricing
Household ID
Size of Annual Harvest
(L)
WSE (% consumption
offset by RWH)
Value of Annual Harvest (pesos)
Cost of Basic Improvements
(pesos)
Optimized Additional Storage (L)
Cost of Additional
Storage (pesos)
NPV of RWH
System (pesos)
Payback Period (years)
1 49,971 41.6% 1,211 7,660 290 475 2,194 7.6 2 10,063 69.9% 885 1,475 - - 6,076 1.7 3 14,341 14.9% 122 5,172 81 143 (4,272) infinite 4 14,918 62.2% 583 5,451 12 23 (499) 11.2 5 31,004 64.6% 450 9,178 667 1,029 (6,371) 38.6 6 33,233 69.2% 1,299 2,207 - - 8,874 1.8 7 45,372 18.9% 642 3,691 474 749 1,036 7.9 8 31,813 53.0% 663 2,113 295 482 3,061 4.2 9 20,170 70.0% 148 7,759 - - (6,493) infinite
10 35,480 98.6% 502 5,426 - - (1,144) 13.3 11 25,470 70.7% 943 4,337 205 342 3,368 5.5 12 99,298 107.9% 547 - - - 4,662 - 13 47,802 265.6% 7,813 8,749 35,045 39,034 18,859 6.9 14 15,481 64.5% 904 2,575 163 276 4,862 3.4

!
!
124!
15 42,612 71.0% 1,047 2,588 - - 6,342 2.6 16 13,627 75.7% 564 2,282 - - 2,533 4.4 17 9,806 9.3% 254 1,223 - - 941 5.3 18 23,288 32.3% 63 2,171 - - (1,633) infinite 19 18,357 51.0% 505 4,569 55 101 (365) 11.0 20 63,414 88.1% 5,258 14,773 3,000 4,142 25,934 3.9 21 40,378 67.3% 1,888 10,889 740 1,134 4,082 7.2 22 30,992 43.0% 374 5,850 414 661 (3,320) 25.0 23 4,613 76.9% 330 3,227 129 223 (638) 12.7 24 149,425 62.3% 2,370 3,336 - - 16,879 1.5 25 35,570 74.1% 3,214 10,280 - - 17,134 3.4 26 18,381 51.1% 1,108 3,153 - - 6,296 3.0 27 4,903 16.3% 26 3,121 - - (2,900) infinite 28 19,965 55.5% 377 1,822 - - 1,398 5.3 29 53,608 55.8% 3,170 11,142 57 104 15,799 3.8 30 367,708 7660.6% 202,300 15,215 363,096 312,260 1,398,181 1.7 31 13,662 75.9% 208 2,336 - - (560) 13.9 32 19,611 46.7% 1,961 5,744 - - 10,985 3.1 33 40,240 55.9% 337 9,178 580 904 (7,208) 77.2 34 8,833 73.6% 139 4,621 - - (3,437) 226.8 35 61,191 51.0% 809 9,178 851 1,292 (3,572) 16.6 36 9,460 78.8% 389 9,826 336 544 (7,049) 54.3 37 33,081 55.1% 619 3,723 - - 1,556 6.7 38 8,715 72.6% 231 8,280 80 142 (6,456) infinite 39 8,478 88.3% 194 9,259 - - (7,601) infinite 40 29,596 123.3% 439 2,044 - - 1,699 5.1 41 17,048 88.8% 1,053 6,227 - - 2,756 6.6 42 38,208 37.5% 443 6,468 567 886 (3,570) 23.3 43 33,418 27.8% 67 6,349 - - (5,774) infinite 44 19,769 82.4% 346 8,326 - - (5,376) 43.4 45 48,444 67.3% 607 3,044 680 1,048 1,088 7.6
MEAN 39,129 235.3% 5,498 5,690 9,063 8,133 33,075 17.8 MEDIAN 29,596 67.3% 564 5,172 - - 1,088 6.7

!
!
125!
Table H.3: Scenario 3 Results Basic Improvements, Applying Entirety of Current Storage to RWH,
Additional Storage (if needed), & Constant Water Pricing
Household ID
Size of Annual Harvest
(L)
WSE (% consumption
offset by RWH)
Value of Annual Harvest (pesos)
Cost of Basic Improvements
(pesos)
Optimized Additional Storage (L)
Cost of Additional
Storage (pesos)
NPV of RWH
System (pesos)
Payback Period (years)
1 52,705 43.9% 1,277 7,660 - - 3,234 6.7 2 11,863 82.4% 1,044 1,475 - - 7,427 1.5 3 15,224 15.9% 130 5,246 81 143 (4,282) infinite 4 17,013 70.9% 665 5,451 - - 223 9.5 5 36,189 75.4% 525 9,178 - - (4,700) 25.1 6 35,433 73.8% 1,385 2,207 - - 9,608 1.7 7 46,576 19.4% 659 3,691 - - 1,930 6.2 8 33,054 55.1% 689 2,113 - - 3,764 3.3 9 24,770 86.0% 182 7,759 - - (6,204) infinite
10 42,580 118.3% 602 5,426 - - (288) 10.7 11 35,563 98.8% 1,317 4,337 - - 6,899 3.5 12 101,998 110.9% 561 - - - 4,789 - 13 47,802 265.6% 7,813 8,749 34,945 38,934 18,959 6.8 14 25,439 106.0% 1,486 2,575 - - 10,100 1.8 15 42,612 71.0% 1,047 2,588 - - 6,342 2.6 16 25,827 143.5% 1,070 2,282 - - 6,843 2.2 17 9,806 9.3% 254 1,223 - - 941 5.3 18 23,288 32.3% 63 2,171 - - (1,633) infinite 19 19,967 55.5% 549 4,569 - - 113 9.7 20 65,214 90.6% 5,407 14,773 3,000 4,142 27,207 3.8 21 43,678 72.8% 2,042 10,889 740 1,134 5,398 6.6 22 33,094 46.0% 399 5,850 - - (2,443) 19.6 23 6,013 100.2% 430 3,227 129 223 215 9.3 24 152,925 63.7% 2,425 3,336 - - 17,353 1.4 25 35,570 74.1% 3,214 10,280 - - 17,134 3.4 26 19,611 54.5% 1,182 3,153 - - 6,928 2.8 27 4,903 16.3% 26 3,121 - - (2,900) infinite 28 25,740 71.5% 487 1,822 - - 2,329 4.0 29 58,208 60.6% 3,443 11,142 57 104 18,120 3.5 30 367,708 7660.6% 202,300 15,215 352,396 304,203 1,406,239 1.6 31 17,443 96.9% 266 2,336 - - (69) 10.4 32 19,611 46.7% 1,961 5,744 - - 10,985 3.1 33 48,936 68.0% 410 9,178 - - (5,683) 37.7 34 14,876 124.0% 234 4,621 - - (2,627) 30.4

!
!
126!
35 73,388 61.2% 970 9,178 - - (906) 11.3 36 10,145 84.5% 417 9,895 336 544 (6,878) 46.9 37 35,611 59.4% 666 3,723 - - 1,960 6.2 38 15,354 127.9% 406 8,280 - - (4,816) 32.0 39 9,478 98.7% 217 9,259 - - (7,405) infinite 40 33,596 140.0% 498 2,044 - - 2,205 4.4 41 18,048 94.0% 1,115 6,227 - - 3,283 6.2 42 39,222 38.5% 455 6,468 - - (2,584) 18.8 43 37,996 31.7% 77 6,349 - - (5,696) infinite 44 21,269 88.6% 372 8,326 - - (5,153) 37.7 45 58,025 80.6% 727 3,044 - - 3,160 4.5
MEAN 42,519 246.3% 5,588 5,693 8,704 7,765 34,209 10.3 MEDIAN 33,094 73.8% 659 5,246 - - 1,960 6.2
Table H.4: Scenario 4 Results
Current Practices with Post-Dam Price Inflation
Household ID
Size of Annual
Harvest (L)
WSE (% consumption
offset by RWH)
Value of Annual Harvest (pesos)
Annual Projected Post-Dam
Value (pesos)
Cost of Basic Improvements
(pesos)
Optimized Additional Storage (L)
Cost of Additional
Storage (pesos)
NPV of RWH
System (pesos)
Payback Period (years)
1 3,677 3.1% 89 115 - - - 862 - 2 10,063 69.9% 885 169 - - - 4,721 - 3 8,774 9.1% 75 234 - - - 1,266 - 4 14,816 61.7% 579 801 - - - 5,819 - 5 - 0.0% - - - - - - - 6 32,440 67.6% 1,268 1,671 - - - 12,410 - 7 17,769 7.4% 251 532 - - - 3,254 - 8 15,715 26.2% 328 424 - - - 3,173 - 9 16,815 58.4% 124 422 - - - 2,233 -
10 34,762 96.6% 492 1,026 - - - 6,305 - 11 22,778 63.3% 844 1,441 - - - 9,558 - 12 99,298 107.9% 547 1,435 - - - 8,173 - 13 8,616 47.9% 1,408 580 - - - 8,742 - 14 13,352 55.6% 780 1,016 - - - 7,587 - 15 38,956 64.9% 957 1,700 - - - 11,098 - 16 13,627 75.7% 564 911 - - - 6,183 - 17 9,806 9.3% 254 392 - - - 2,711 - 18 7,354 10.2% 20 112 - - - 536 -

!
!
127!
19 2,451 6.8% 67 103 - - - 716 - 20 - 0.0% - - - - - - - 21 15,096 25.2% 706 879 - - - 6,705 - 22 - 0.0% - - - - - - - 23 3,700 61.7% 264 331 - - - 2,520 - 24 59,705 24.9% 947 1,755 - - - 11,271 - 25 13,500 28.1% 1,220 1,518 - - - 11,582 - 26 9,806 27.2% 591 603 - - - 5,088 - 27 4,903 16.3% 26 94 - - - 490 - 28 6,128 17.0% 116 250 - - - 1,518 - 29 53,026 55.2% 3,136 3,311 - - - 27,443 - 30 - 0.0% - - - - - - - 31 13,662 75.9% 208 385 - - - 2,474 - 32 19,611 46.7% 1,961 302 - - - 10,175 - 33 1,800 2.5% 15 49 - - - 263 - 34 8,833 73.6% 139 324 - - - 1,916 - 35 - 0.0% - - - - - - - 36 - 0.0% - - - - - - - 37 33,081 55.1% 619 1,158 - - - 7,409 - 38 7,433 61.9% 197 368 - - - 2,355 - 39 8,478 88.3% 194 370 - - - 2,350 - 40 29,596 123.3% 439 810 - - - 5,210 - 41 15,702 81.8% 970 1,088 - - - 8,741 - 42 - 0.0% - - - - - - - 43 33,418 27.8% 67 284 - - - 1,430 - 44 19,769 82.4% 346 660 - - - 4,193 - 45 28,800 40.0% 361 849 - - - 5,008 -
MEAN 16,825 41.3% 490 633 - - - 4,744 - MEDIAN 13,352 40.0% 264 392 - - - 3,173 -
Table A.5: Scenario 5 Results
Basic Improvements, No Changes in Current Storage Uses, Additional Storage (if needed), & Post-Dam Price Inflation
Household ID
Size of Annual
Harvest (L)
WSE (consumption
offset by RWH)
Value of Annual Harvest (pesos)
Annual Projected Post-Dam
Value (pesos)
Cost of Basic Improvements
(pesos)
Optimized Additional Storage (L)
Cost of Additional
Storage (pesos)
NPV of RWH
System (pesos)
Payback Period (years)
1 49,971 41.6% 1,211 1,560 7,660 290 475 3,573 6.7 2 10,063 69.9% 885 618 1,475 - - 5,020 1.7

!
!
128!
3 15,224 15.9% 130 406 5,172 126 217 (3,193) infinite 4 14,918 62.2% 583 807 5,451 12 23 385 8.7 5 31,793 66.2% 461 1,120 9,178 779 1,190 (3,830) 13.5 6 33,233 69.2% 1,299 1,712 2,207 - - 10,506 1.8 7 45,372 18.9% 642 1,359 3,691 474 749 3,869 6.1 8 31,813 53.0% 663 857 2,113 295 482 3,829 4.2 9 20,170 70.0% 148 506 7,759 - - (5,080) infinite
10 35,480 98.6% 502 1,047 5,426 - - 1,010 8.2 11 25,802 71.7% 956 1,633 4,337 288 470 6,019 5.3 12 99,298 107.9% 547 1,435 - - - 8,173 - 13 13,211 73.4% 2,159 890 8,749 454 719 3,936 4.8 14 15,579 64.9% 910 1,186 2,575 195 328 5,949 3.4 15 42,612 71.0% 1,047 1,859 2,588 - - 9,552 2.6 16 13,627 75.7% 564 911 2,282 - - 3,901 4.4 17 9,806 9.3% 254 392 1,223 - - 1,488 5.2 18 23,288 32.3% 63 356 2,171 - - (475) infinite 19 18,357 51.0% 505 773 4,569 55 101 695 8.2 20 63,414 88.1% 5,258 4,525 14,773 3,000 4,142 23,040 3.9 21 40,378 67.3% 1,888 2,351 10,889 740 1,134 5,910 6.5 22 30,992 43.0% 374 776 5,850 414 661 (1,732) 11.9 23 4,613 76.9% 330 413 3,227 129 223 (308) 10.1 24 149,425 62.3% 2,370 4,393 3,336 - - 24,874 1.5 25 35,570 74.1% 3,214 3,999 10,280 - - 20,236 3.4 26 18,381 51.1% 1,108 1,130 3,153 - - 6,385 3.0 27 4,903 16.3% 26 94 3,121 - - (2,630) infinite 28 19,965 55.5% 377 814 1,822 - - 3,122 5.1 29 53,608 55.8% 3,170 3,347 11,142 57 104 16,499 3.8 30 367,708 7660.6% 202,300 143,063 15,215 363,096 312,260 1,164,166 1.7 31 13,662 75.9% 208 385 2,336 - - 138 8.9 32 19,611 46.7% 1,961 1,290 5,744 - - 8,335 3.1 33 42,193 58.6% 353 1,152 9,178 740 1,134 (4,142) 13.7 34 8,833 73.6% 139 324 4,621 - - (2,704) 20.6 35 61,191 51.0% 809 1,968 9,178 851 1,292 1,009 8.7 36 9,645 80.4% 397 566 9,826 382 613 (6,385) 25.7 37 33,162 55.3% 620 1,161 3,723 7 14 3,691 5.8 38 9,436 78.6% 250 467 8,280 213 355 (5,646) infinite 39 8,478 88.3% 194 370 9,259 - - (6,909) infinite 40 29,596 123.3% 439 810 2,044 - - 3,166 5.0 41 17,048 88.8% 1,053 1,182 6,227 - - 3,263 6.2 42 38,208 37.5% 443 772 6,468 567 886 (2,273) 12.8 43 33,418 27.8% 67 284 6,349 - - (4,918) infinite

!
!
129!
44 19,769 82.4% 346 660 8,326 - - (4,133) 17.4 45 49,766 69.1% 624 1,467 3,044 826 1,256 4,353 6.0
MEAN 38,502 231.4% 5,374 4,382 5,690 8,311 7,307 28,927 7.1 MEDIAN 25,802 67.3% 564 911 5,172 7 14 3,166 5.5
Table A.6: Scenario 6 Results Basic Improvements, Applying Entirety of Current Storage to RWH,
Additional Storage (if needed), & Post-Dam Price Inflation
Household ID
Size of Annual
Harvest (L
WSE (consumption
offset by RWH)
Value of Annual Harvest (pesos)
Annual Projected Post-Dam
Value (pesos)
Cost of Basic Improvements
(pesos)
Optimized Additional Storage (L)
Cost of Additional
Storage (pesos)
NPV of RWH
System (pesos)
Payback Period (years)
1 52,705 43.9% 1,277 1,645 7,660 - - 4,689 6.1 2 11,863 82.4% 1,044 199 1,475 - - 4,091 1.5 3 15,224 15.9% 130 406 5,172 126 217 (3,193) infinite 4 17,013 70.9% 665 920 5,451 - - 1,231 7.8 5 36,189 75.4% 525 1,275 9,178 - - (1,735) 10.9 6 35,433 73.8% 1,385 1,826 2,207 - - 11,348 1.7 7 46,576 19.4% 659 1,395 3,691 - - 4,839 5.5 8 33,054 55.1% 689 891 2,113 - - 4,562 3.3 9 24,770 86.0% 182 621 7,759 - - (4,469) infinite
10 42,580 118.3% 602 1,257 5,426 - - 2,297 7.2 11 35,563 98.8% 1,317 2,250 4,337 - - 10,585 3.5 12 101,998 110.9% 561 1,474 - - - 8,395 - 13 47,802 265.6% 7,813 3,221 8,749 34,945 38,934 819 9.0 14 25,439 106.0% 1,486 1,936 2,575 - - 11,880 1.8 15 42,612 71.0% 1,047 1,859 2,588 - - 9,552 2.6 16 25,827 143.5% 1,070 1,726 2,282 - - 9,437 2.2 17 9,806 9.3% 254 392 1,223 - - 1,488 5.2 18 23,288 32.3% 63 356 2,171 - - (475) infinite 19 19,967 55.5% 549 841 4,569 - - 1,265 7.6 20 65,214 90.6% 5,407 4,653 14,773 3,000 4,142 24,231 3.8 21 43,678 72.8% 2,042 2,543 10,889 740 1,134 7,375 6.1 22 33,094 46.0% 399 829 5,850 - - (746) 10.3 23 6,013 100.2% 430 539 3,227 129 223 646 7.9 24 152,925 63.7% 2,425 4,496 3,336 - - 25,534 1.4 25 35,570 74.1% 3,214 3,999 10,280 - - 20,236 3.4 26 19,611 54.5% 1,182 1,206 3,153 - - 7,023 2.8 27 4,903 16.3% 26 94 3,121 - - (2,630) infinite
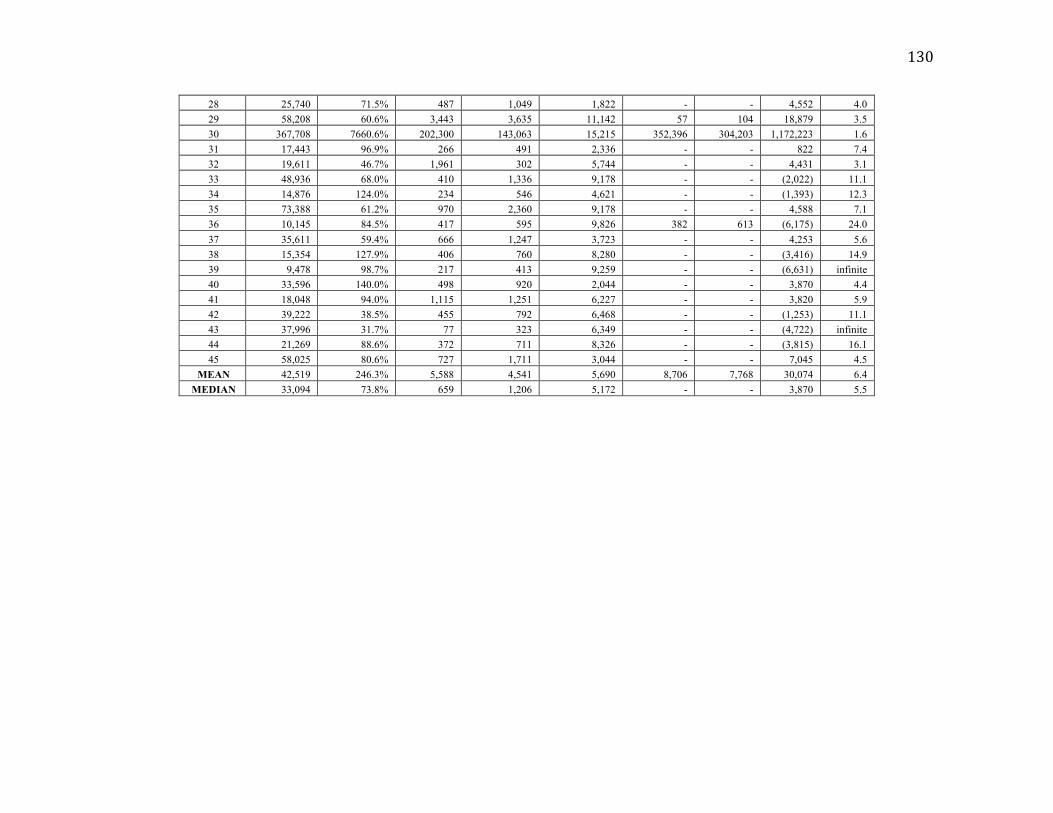
!
!
130!
28 25,740 71.5% 487 1,049 1,822 - - 4,552 4.0 29 58,208 60.6% 3,443 3,635 11,142 57 104 18,879 3.5 30 367,708 7660.6% 202,300 143,063 15,215 352,396 304,203 1,172,223 1.6 31 17,443 96.9% 266 491 2,336 - - 822 7.4 32 19,611 46.7% 1,961 302 5,744 - - 4,431 3.1 33 48,936 68.0% 410 1,336 9,178 - - (2,022) 11.1 34 14,876 124.0% 234 546 4,621 - - (1,393) 12.3 35 73,388 61.2% 970 2,360 9,178 - - 4,588 7.1 36 10,145 84.5% 417 595 9,826 382 613 (6,175) 24.0 37 35,611 59.4% 666 1,247 3,723 - - 4,253 5.6 38 15,354 127.9% 406 760 8,280 - - (3,416) 14.9 39 9,478 98.7% 217 413 9,259 - - (6,631) infinite 40 33,596 140.0% 498 920 2,044 - - 3,870 4.4 41 18,048 94.0% 1,115 1,251 6,227 - - 3,820 5.9 42 39,222 38.5% 455 792 6,468 - - (1,253) 11.1 43 37,996 31.7% 77 323 6,349 - - (4,722) infinite 44 21,269 88.6% 372 711 8,326 - - (3,815) 16.1 45 58,025 80.6% 727 1,711 3,044 - - 7,045 4.5
MEAN 42,519 246.3% 5,588 4,541 5,690 8,706 7,768 30,074 6.4 MEDIAN 33,094 73.8% 659 1,206 5,172 - - 3,870 5.5

!
!
131!

!
!
132!
Appendix I: Reasons for Household Exclusion in the Survey
For a variety of reasons, many households were excluded from the survey. The most
common reason for exclusion was that a resident stated that they were not interested in
participating in the survey (occurred at 18 of the randomly selected points). The second
most common reason for exclusion was that, on three separate occasions, the household’s
door was knocked on, but, each time, nobody was home (occurred at 16 of the randomly
selected points). The third most common reason for exclusion was that the resident told
the surveyor that they were busy and unable to participate at the moment. An
appointment to conduct the survey later was made, but when the surveyor returned at the
specified time, the resident was not home (occurred at 15 of the randomly selected
points). Such sites were also visited a minimum of three times. The fourth and least
common reason for exclusion was that the site was deemed unsuitable for the purposes of
the survey (occurred at 6 of the randomly selected points). This usually happened because
the building was not a residency but a commercial enterprise or a market.
!

!
!
133!
Appendix J: Survey Materials (English)
Rainwater Harvesting in Oaxaca, Mexico
Consent Form
Hello, my name is Nolan Gardner and I am a Master’s student at the Bard Center for Environmental Policy in New York State and a volunteer with the Instituto de la Naturaleza y la Sociedad de Oaxaca. Presently, I am conducting a household survey of water usage and perceptions of rainwater catchment systems in the city of Oaxaca for my Master’s research and your house was randomly selected to participate. The survey generally takes about 30-40 minutes to complete.
If you participate in this study you will asked to answer questions about how you use water, both municipal and private, your household demographics, your perceptions of rainwater harvesting as an alternative to current practices, and the capacity and potential of your household to accommodate both the roof catchment system and the storage tanks that would be necessary for a household hoping to install a rainwater catchment system.
This survey is completely voluntary and if there is any question that you do not want to answer it is possible to omit it and continue with the survey. My faculty advisor and I will have sole access to the information you provide. At any time, you may withdraw from participation in the survey without difficulty. It is very unlikely that this survey will pose any risk to you. This information will only be used in my thesis and possibly in future publications and research. This study is not related to the local, state, or federal government. The primary benefit of participating is that you would be helping to contribute new knowledge to society, specifically regarding water use and the potential for rainwater harvesting systems in the city. Because I want to be sure to understand your responses to my questions and because my Spanish is somewhat limited, I would like to ask your permission to record the open-ended portions of the interview. If you do not want to be recorded that is perfectly understandable and the survey/interview will be conducted without my recording device. All recordings, transcriptions, and other raw data from this process will be kept in a locked office desk or on a password-protected computer, and they will be destroyed before January 1st 2013.
If you have concerns regarding your rights as a participant in this study, please contact Dr. Sarah Dunphy-Lelii of the Bard College Institutional Review Board. Her contact information is listed on the bottom of this form. Additionally, you may contact me or my faculty advisor, Dr. Gautam Sethi if you have any questions.
By signing this page, you are indicating that you understand the above information and are willing to participate in the survey. You will also be given a copy of this consent form for your records.
Please check all forms of consent that apply:
I give permission for the information I provide in this study to be published anonymously with no specific mention of my or my family’s names. I give permission that the information I provide in this study can be quoted specifically, mentioning my name.
I agree to have my voice recorded for the purposes of this study.
_________________________________ ______________________ Signature Date ______________________________________
Printed Name
!!
!
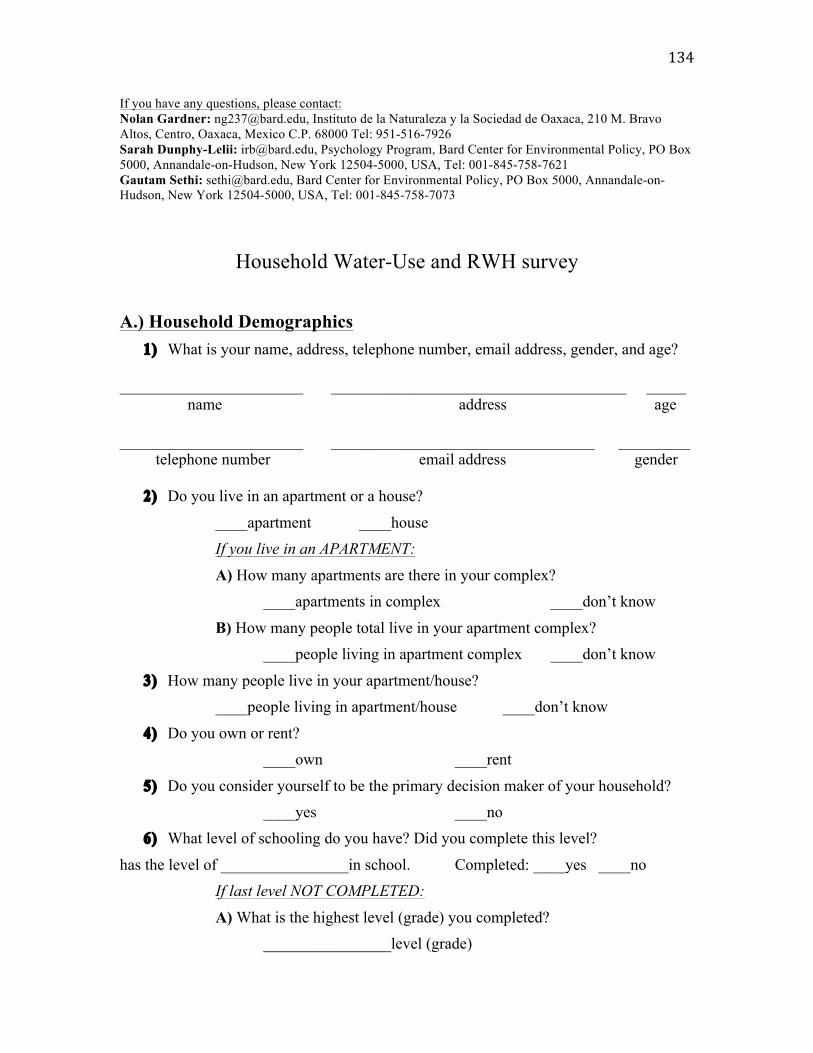
!
!
134!
If you have any questions, please contact: Nolan Gardner: [email protected], Instituto de la Naturaleza y la Sociedad de Oaxaca, 210 M. Bravo Altos, Centro, Oaxaca, Mexico C.P. 68000 Tel: 951-516-7926 Sarah Dunphy-Lelii: [email protected], Psychology Program, Bard Center for Environmental Policy, PO Box 5000, Annandale-on-Hudson, New York 12504-5000, USA, Tel: 001-845-758-7621 Gautam Sethi: [email protected], Bard Center for Environmental Policy, PO Box 5000, Annandale-on- Hudson, New York 12504-5000, USA, Tel: 001-845-758-7073
Household Water-Use and RWH survey !!A.) Household Demographics
1) What is your name, address, telephone number, email address, gender, and age? _______________________ _____________________________________ _____ name address age _______________________ _________________________________ _________ telephone number email address gender
2) Do you live in an apartment or a house?
____apartment ____house If you live in an APARTMENT: A) How many apartments are there in your complex? ____apartments in complex ____don’t know
B) How many people total live in your apartment complex? ____people living in apartment complex ____don’t know
3) How many people live in your apartment/house? ____people living in apartment/house ____don’t know
4) Do you own or rent? ____own ____rent
5) Do you consider yourself to be the primary decision maker of your household? ____yes ____no
6) What level of schooling do you have? Did you complete this level?
has the level of ________________in school. Completed: ____yes ____no If last level NOT COMPLETED: A) What is the highest level (grade) you completed? ________________level (grade)
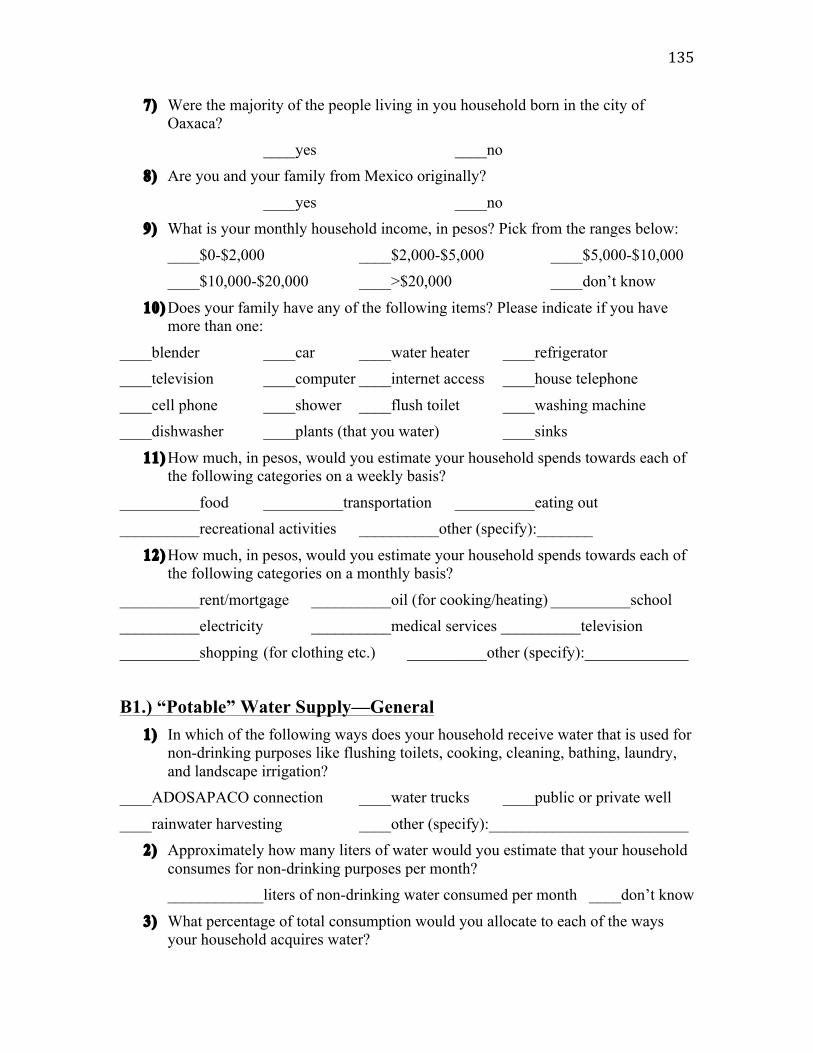
!
!
135!
7) Were the majority of the people living in you household born in the city of Oaxaca?
____yes ____no 8) Are you and your family from Mexico originally?
____yes ____no 9) What is your monthly household income, in pesos? Pick from the ranges below:
____$0-$2,000 ____$2,000-$5,000 ____$5,000-$10,000 ____$10,000-$20,000 ____>$20,000 ____don’t know
10) Does your family have any of the following items? Please indicate if you have more than one:
____blender ____car ____water heater ____refrigerator ____television ____computer ____internet access ____house telephone
____cell phone ____shower ____flush toilet ____washing machine ____dishwasher ____plants (that you water) ____sinks
11) How much, in pesos, would you estimate your household spends towards each of the following categories on a weekly basis?
__________food __________transportation __________eating out __________recreational activities __________other (specify):_______
12) How much, in pesos, would you estimate your household spends towards each of the following categories on a monthly basis?
__________rent/mortgage __________oil (for cooking/heating) __________school __________electricity __________medical services __________television
__________shopping (for clothing etc.) __________other (specify):_____________
B1.) “Potable” Water Supply—General 1) In which of the following ways does your household receive water that is used for
non-drinking purposes like flushing toilets, cooking, cleaning, bathing, laundry, and landscape irrigation?
____ADOSAPACO connection ____water trucks ____public or private well
____rainwater harvesting ____other (specify):_________________________ 2) Approximately how many liters of water would you estimate that your household
consumes for non-drinking purposes per month? ____________liters of non-drinking water consumed per month ____don’t know
3) What percentage of total consumption would you allocate to each of the ways your household acquires water?

!
!
136!
______ADOSAPACO connection ______water trucks ______public or private well ______rainwater harvesting ______other (specify):_______________________
4) How would you rate the quality of the water from the piped municipal ADOSAPACO supply?
____very bad ____bad ____mediocre ____good ____very good ____don’t know
5) How would you rate the quality of the water from the public water trucks? ____very bad ____bad ____mediocre
____good ____very good ____don’t know 6) How would you rate the quality of the water from the private water trucks?
____very bad ____bad ____mediocre ____good ____very good ____don’t know
Proceed with each section of B from which the household receives non-potable water.
B2.) “Potable” Water Supply—ADOSAPACO 1) How much piped water do you receive monthly during the rainy season from
ADOSAPACO? ____________liters per month ____don’t know
2) How much piped water do you receive monthly during the dry season from ADOSAPACO?
____________liters per month ____don’t know
3) To the best of knowledge, what is the tariff you pay on a monthly basis for your ADOSAPACO connection?
____________pesos per month ____don’t know 4) Do you treat piped ADOSAPACO water before using it?
____yes ____no ____don’t know If water from ADOSAPACO connection is TREATED: A) In what way do you treat ADOSAPACO water? ____reverse osmosis ____boiling ____chlorine ____iodine ____rock/sand filter
____carbon filter ____UV light ____other (specify):________________ B) In which of the following ways do you use this treated ADOSAPACO water? ____drinking ____flushing toilets ____cooking ____cleaning ____bathing
____laundry ____landscape irrigation ____other (specify):__________________

!
!
137!
C) Approximately what percentage of the water from your ADOSAPACO connection do you treat?
____________percent ____don’t know 5) In which of the following ways do you use (untreated) ADOSAPACO water?
____drinking ____flushing toilets ____cooking ____cleaning ____bathing ____laundry ____landscape irrigation ____other (specify):__________________
6) Which months of the year do you generally suffer water shortages from your ADOSAPACO connection. To the best of your knowledge, please tell me for each of the following months if you received: 1 (<5 days of service); 2 (5-11 days of service); 3 (12-18 days of service); 4 (19-25 days of service); or 5 (>25 days of service).
____January ____February ____March ____April ____May ____June
____July ____August ____September ____October ____November ____December
B3.) “Potable” Water Supply—Public Water Trucks
1) Do you receive water from public or private water trucks? ____public ____private ____both ____don’t know
If they receive water from Private water trucks only, skip to section B4: 2) Who offers/provides the service of public water trucks in your neighborhood
________________________________offers it ____don’t know 3) Is there a cost associated with this service? How much do you pay each
refilling? ____yes, pay ______________each refilling ____no ____don’t know
4) With what frequency do you purchase water from these public water trucks? ____times per________ OR ____times per________ ____don’t know
5) In general, what quantity of water do you buy from the public water trucks? ____________liters ____don’t know
6) For that quantity, what price do you pay? ________________pesos ____don’t know
7) Do you pay more at the end of the dry season? How much more? ____yes, pay ________________pesos instead ____no ____don’t know
8) How much would you estimate that you pay the public water trucks for refilling your water tank/cistern over a 12-month period?
________________pesos per year ____don’t know

!
!
138!
9) Do you treat the water from the public water trucks before using it? ____yes ____no ____don’t know
If water from the public water trucks is TREATED: A) In what way do you treat the water from the public water trucks?
____reverse osmosis ____boiling ____chlorine ____iodine ____rock/sand filter ____carbon filter ____UV light ____other (specify):________________
B) In which of the following ways do you use this treated water? ____drinking ____flushing toilets ____cooking ____cleaning ____bathing
____laundry ____landscape irrigation ____other (specify):___________________ C) Approximately what percentage of the water you receive from the public water trucks do you treat? ____________percent ____don’t know
10) In which of the following ways do you use the (untreated) water from the public water trucks?
____drinking ____flushing toilets ____cooking ____cleaning ____bathing ____laundry ____landscape irrigation ____other (specify):__________________
11) I am going to present you with five options for each month of the year, reflecting how many days your household goes without water because public water trucks have failed to deliver it to you. The numbers from one to five signify: 1 (<5 days without water); 2 (5-11 days without water); 3 (12-18 days without water); 4 (19-25 days without water); or 5 (>25 days without water).
____January ____February ____March ____April ____May ____June
____July ____August ____September ____October ____November ____December OR ____there is no water shortage from public water trucks
If they do NOT receive water from Private Water Trucks: 12) Why don’t you buy water from private water trucks?
____too expensive ____water too dirty ____don’t serve my area ____other:_________
B4.) “Potable” Water Supply—Private Water Trucks
1) What is name of the company from which you purchase water? ________________water trucks ____don’t know
2) With what frequency do you purchase water from the private water trucks? ____times per________ OR ____times per________ ____don’t know
3) In general, what quantity of water do you buy from the private water trucks?
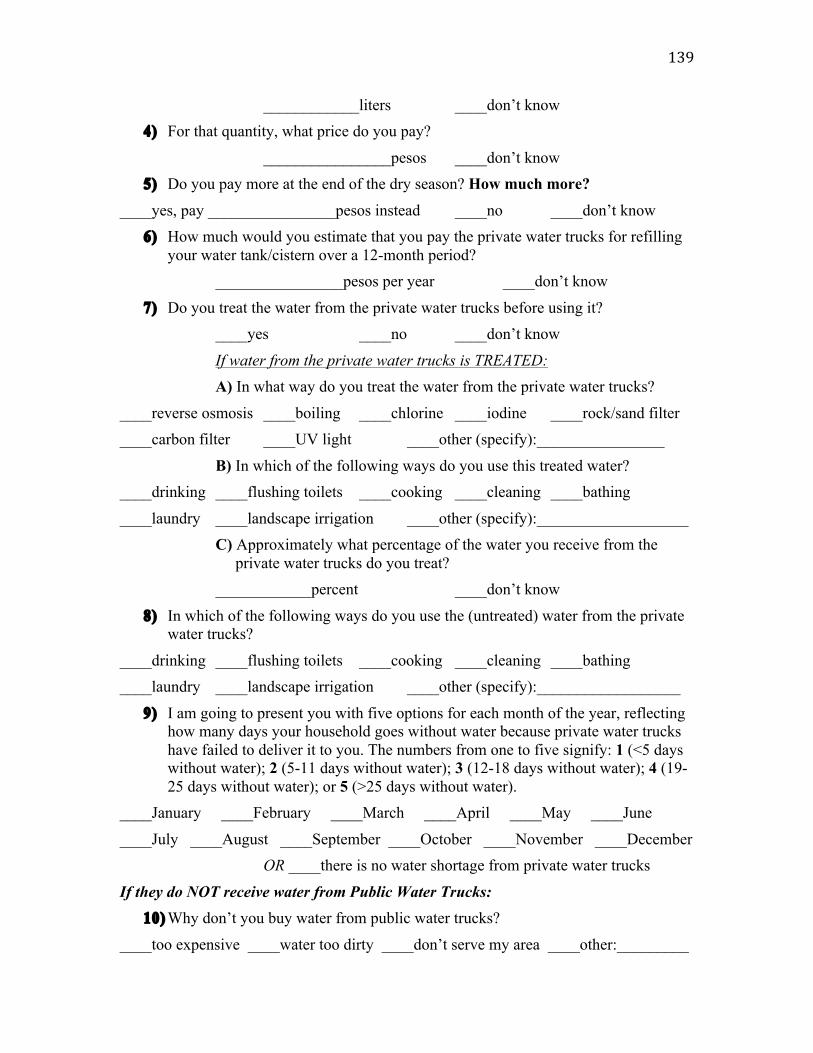
!
!
139!
____________liters ____don’t know 4) For that quantity, what price do you pay?
________________pesos ____don’t know 5) Do you pay more at the end of the dry season? How much more?
____yes, pay ________________pesos instead ____no ____don’t know 6) How much would you estimate that you pay the private water trucks for refilling
your water tank/cistern over a 12-month period? ________________pesos per year ____don’t know
7) Do you treat the water from the private water trucks before using it? ____yes ____no ____don’t know
If water from the private water trucks is TREATED: A) In what way do you treat the water from the private water trucks?
____reverse osmosis ____boiling ____chlorine ____iodine ____rock/sand filter ____carbon filter ____UV light ____other (specify):________________
B) In which of the following ways do you use this treated water? ____drinking ____flushing toilets ____cooking ____cleaning ____bathing
____laundry ____landscape irrigation ____other (specify):___________________ C) Approximately what percentage of the water you receive from the private water trucks do you treat? ____________percent ____don’t know
8) In which of the following ways do you use the (untreated) water from the private water trucks?
____drinking ____flushing toilets ____cooking ____cleaning ____bathing ____laundry ____landscape irrigation ____other (specify):__________________
9) I am going to present you with five options for each month of the year, reflecting how many days your household goes without water because private water trucks have failed to deliver it to you. The numbers from one to five signify: 1 (<5 days without water); 2 (5-11 days without water); 3 (12-18 days without water); 4 (19-25 days without water); or 5 (>25 days without water).
____January ____February ____March ____April ____May ____June
____July ____August ____September ____October ____November ____December OR ____there is no water shortage from private water trucks
If they do NOT receive water from Public Water Trucks: 10) Why don’t you buy water from public water trucks?
____too expensive ____water too dirty ____don’t serve my area ____other:_________

!
!
140!
B5.) “Potable” Water Supply—Wells
1) Do you receive water from a public or private well? ____public ____private ____don’t know
If you receive water from a PUBLIC well: A) Do you pay a user’s fee of some sort for the right to use this water? How much do you pay per year? ____yes, they pay _____________pesos/year ____no ____don’t know
2) How does the water travel from the well to your house? __pumped through pipes __extracted by bucket __don’t know __other (specify):______
If the water from the well is PUMPED: A) What kind of pump is used?
____electric ____gas ____bicibomba/man-powered ____other (specify):__________ 3) What rating would you give to the quality of the water from this well?
____very bad ____bad ____mediocre ____good ____very good ____don’t know
4) Do you treat the water from this well before using it? ____yes ____no ____don’t know If you TREAT the water from this well: A) In what way do you treat the water from this well? ____reverse osmosis ____boiling ____chlorine ____iodine ____rock/sand filter
____carbon filter ____UV light ____other (specify):________________ B) In which of the following ways do you use this treated well water?
____drinking ____flushing toilets ____cooking ____cleaning ____bathing ____laundry ____landscape irrigation ____other (specify):__________________
C) Approximately what percentage of the water you receive from the private water trucks do you treat?
____________percent ____don’t know 5) In which of the following ways do you use the (untreated) water from this well?
____drinking ____flushing toilets ____cooking ____cleaning ____bathing ____laundry ____landscape irrigation ____other (specify):__________________
6) I would like to know which months of the year you generally suffer water shortages from your well connection. For each month, please tell me, to the best of your knowledge if you received: 1 (<5 days of service); 2 (5-11 days of

!
!
141!
service); 3 (12-18 days of service); 4 (19-25 days of service); or 5 (>25 days of service).
____January ____February ____March ____April ____May ____June ____July ____August ____September ____October ____November ____December
C1.) Water Tank/Cistern Characteristics
1) Do you use any BELOWGROUND water storage tanks at your house? How many?
____yes, we use_______ ____no ____don’t know
If BELOWGROUND tank(s) present: A) What is its (their total) storage capacity?
__________liters (and ____________liters) ____don’t know B) What material is it (are they) made from?
____plastic ____ferrocement ____pottery/clay ____asbestos ____metal ____mud ____brick ____other(specify):___________
C) From what source does it (do they) get refilled? ____ADOSAPACO ____las Pipas ____RWH system ____other (specify):_______
D) Are they covered most of the time? ____yes ____no ____don’t know
2) Do you use any ABOVEGROUND water storage tanks at your house? How many?
____yes, we use_______ ____no ____don’t know If ABOVEGROUND tank(s) present: A) Where is it (are they) located? ____roof ____courtyard ____backyard ____other (specify):_______
B) What is its (their total) storage capacity? __________liters (and ____________liters) ____don’t know
C) What material is it (are they) made from? ____plastic ____ferrocement ____pottery/clay ____asbestos
____metal ____mud ____brick ____other(specify):___________ D) From what source does it (do they) get refilled?
____belowground tank ____las Pipas ____RWH system ____other (specify):_______ E) Are they covered most of the time?

!
!
142!
____yes ____no ____don’t know
If they have any storage tanks, proceed through section C1; if not, skip to section C2. 3) So, you have ___aboveground tanks and ___belowground tanks, and the water
from _______________(and sometimes_______________) fills ____________. (Meanwhile, the water from _______________is used to fill____________). Right?
4) Does the location of (any of) your storage tank(s) require that you use a pump? Or is gravity used to give pressure?
____pump used ____gravity used ____don’t know
If you use a PUMP: A) For what purpose it is used?
to bring water from ________________to________________ B) What type of pump is it?
____electric ____gas ____bicibomba/man-powered ____other (specify):__________ 5) Do you feel that a larger tank or more tanks than what you have now would serve
your needs better? ____yes ____no ____don’t know
6) Do you think there would be space in your house to put a larger tank or more tanks?
____yes ____no ____don’t know 7) Do you have any plans to purchase larger or more storage tanks?
____yes ____no ____don’t know 8) How long have you had your storage tank(s)
_____years / months , _____years / months, and _____years / months ____don’t know 9) Have your tanks ever had problems with leaking? Which ones?
____yes ____no ____don’t know 10) Do you anticipate problems with leaking in the future?
____yes ____no ____don’t know
C2.) Alternatives to Water Tanks/Cisterns 1) Do you employ any storage techniques, or do you simply rely on your
ADOSAPACO connection?
____storage techniques ____no storage ____don’t know If you employ STORAGE TECHNIQUES:

!
!
143!
A) What storage techniques do you employ? ____buckets/open containers ____don’t know ____other (specify):________________
2) How would you rate your interest in acquiring a water tank/cistern? ____disinterested ____mildly disinterested ____indifferent
____mildly interested ____very interested ____don’t know 3) Why have you not acquired one already?
___too expensive ___unnecessary ___don’t know ___other (specify):______________ 4) If you were to buy a storage tank/cistern for your house, what material would you
choose? ____plastic ____ferrocement ____pottery/clay ____asbestos
____metal ____mud ____brick ____other(specify):___________ 5) Why do you prefer that material?
____cheaper ____more durable ____lighter (weight) ____other (specify):_________ 6) If you were to buy a storage tank/cistern, where would you put it in your house?
____aboveground ____belowground ____don’t know ____other (specify):_________ ____roof ____courtyard ____backyard ____don’t know ____other (specify):________
7) What size storage tank/cistern would be ideal for your household? ____________liters
8) Is the size of the storage tank/cistern you would consider purchasing limited by the space you have to put it in?
____yes ____no ____don’t know
D1.) Rainwater Harvesting System Characteristics
1) What kind RWH system do you have? ____buckets catching water off the roof
____roof catchment with gutters and downspouts to storage tank ____roof and patio catchment with piping system to storage tank
____don’t know Proceed with section D1 if household has a real RWHS, otherwise skip to section D2
2) How long have you had your RWH system? ______years / months
3) How knowledgeable do you consider yourself about RWH systems? ____very badly informed ____badly informed ____average

!
!
144!
____well informed ____very well informed ____don’t know 4) What are the approximate dimensions of your roof/catchment area?
____________square meters 5) What material is your roof made from?
____cement ____adobe ____metal ____wood ____clay shingles ____grasses ____other (specify):___________________
6) Do you employ any initial filtration technologies? Which ones? ____first-flush diverter ____leaf screens ____none
____don’t know ____other (specify):________________________ 7) Where do you store your harvested rainwater?
in the ________liter ________from earlier ____open containers ____other:_________ 8) Is this storage tank/device used for other water sources as well? Which ones?
____yes, it’s used for _______________ ____no ____don’t know 9) Is this storage tank/device covered most of the time?
____yes ____no ____don’t know 10) What rating would you give to the quality of the water from your RWH system?
____very bad ____bad ____mediocre ____good ____very good ____don’t know
11) Do you treat your harvested rainwater beyond first-flush diversion, leaf screens, or other initial filtration techniques before using it?
____yes ____no ____don’t know If the harvested rainwater is TREATED: A) In what way do you treat your harvested rainwater? ____reverse osmosis ____boiling ____chlorine ____iodine ____rock/sand filter
____carbon filter ____UV light ____other (specify):________________ B) In which of the following ways do you use this treated rainwater?
____drinking ____flushing toilets ____cooking ____cleaning ____bathing ____laundry ____landscape irrigation ____other (specify):__________________
12) In which of the following ways do you use (untreated) rainwater? ____drinking ____flushing toilets ____cooking ____cleaning ____bathing
____laundry ____landscape irrigation ____other (specify):__________________ 13) How many times per year do you complete each of the following maintenance
procedures?

!
!
145!
____purging of the first-flush diverter ____cleaning of the storage tank(s) ____cleaning of the roof washers ____maintaining pumps
____replacing filters ____cleaning gutters/downspouts ____don’t know 14) How much money would you estimate that you spend on the maintenance of your
RWH system on a yearly basis? ____________pesos per year
15) How much time would you estimate that you spend on the maintenance of your RWH system on a yearly basis?
____________hours per year 16) Do you feel that the rainwater you collect contributes significantly to your
household water supply? ____yes ____no ____don’t know
17) How many liters would you estimate you collect every year with your system? ____________liters per year
18) Do you feel that the work you have done to construct and maintain your system has been worthwhile?
____yes ____no ____don’t know 19) Would you recommend such a system to a close friend?
____yes ____no ____don’t know 20) Are you aware of any rodents, cats, or other mammals living in, on, above, or
occasionally transecting you roof? If yes, what type and how frequently? ____yes, there are ____________every____________ ____no ____don’t know
21) How would you rate the bird population in your neighborhood? ____not populace ____average ____very populace ____don’t know
22) Are you aware of any legal barriers to RWH in Oaxaca, Mexico? If so, could you please give me the references?
____yes, the reference is______________________ ______ ____no
D2.) Rainwater Harvesting Potential & Perceptions
1) Before this survey began were you aware that people have designed systems for rainwater collection and that they are widely used throughout the world?
____yes ____no 2) How knowledgeable do you consider yourself about RWH systems?
____very badly informed ____badly informed ____average ____well informed ____very well informed ____don’t know

!
!
146!
3) Before this survey began were you aware that there are households in the city of Oaxaca that utilize such systems?
____yes ____no 4) How many households would you guess there are that use RWH in the city itself?
________households 5) What is your perception of the quality rating that water from a RWH system
should receive? ____very bad ____bad ____mediocre
____good ____very good ____don’t know 6) How would you rate your interest in acquiring a RHW system (if you were the
owner)? ____disinterested ____mildly disinterested ____indifferent
____mildly interested ____very interested ____don’t know If disinterested, mildly disinterested or indifferent: A) Why do you have no interest in RWH? ____too risky ____water too dirty ____too expensive ____other (specify):_________
If mildly interested or very interested: A) Why have you not acquired one already?
____too expensive ____current water supply is good enough ____other (specify):____ 7) What would you say is the approximate size of your roof, in square meters?
____________square meters 8) What material is your roof made from?
____cement ____adobe ____metal ____wood ____clay shingles ____grasses ____other (specify):___________________
9) Which of the following uses do you imagine being appropriate for harvested rainwater?
____drinking ____flushing toilets ____cooking ____cleaning ____bathing ____laundry ____landscape irrigation ____don’t know ____other (specify):________
10) Do you think people using harvested rainwater should filter or treat it first? ____yes ____they shouldn’t use it at all ____no ____don’t know
11) In what way do you think people should filter or treat harvested rainwater? ____reverse osmosis ____boiling ____chlorine ____iodine ____rock/sand filter
____carbon filter ____UV light ___don’t know ____other (specify):_____________

!
!
147!
12) Which of the following uses do you imagine being appropriate for harvested rainwater if it has been filtered or treated as you directed above?
____drinking ____flushing toilets ____cooking ____cleaning ____bathing ____laundry ____landscape irrigation ____don’t know ____other (specify):________
13) Are you aware of any rodents, cats, or other mammals living in, on, above, or occasionally transecting you roof? If yes, what type and how frequently?
____yes, there are ____________every____________ ____no ____don’t know 14) How would you rate the bird population in your neighborhood?
____not populace ____average ____very populace ____don’t know 15) How much would you guess the initial capital costs of a RWH system are?
____________pesos Let us imagine a hypothetical situation where the government is offering households who wish to install a RWH system a subsidy of up to 20,000 pesos, but no more than half the initial capital cost.
16) Would you be interested in applying for it? ____yes ____no ____don’t know
17) If a contractor quoted you a price of 40,000 pesos to install the system, and if the government offered to cover half the cost, how much of the remaining 20,000 pesos do you hypothetically feel you could afford to pay for?
____________pesos

!
!
148!

!
!
149!
Appendix K: Survey Materials (Spanish)
La Captación de Agua de Lluvia en Oaxaca, México
Formulario de Consentimiento
Si usted participa en este estudio, le pediré contestar algunas preguntas sobre usan ustedes el agua: tanto la del servicio público como la que compran; la demografía de la casa; las percepciones de las sistemas de captación de lluvia como un alternativo a la manera corriente; y la capacidad y el potencial de su hogar para albergar una sistema de captación sobre su tejado y los tanques de almacenaje que una familia necesitaría si quisiera instalar una sistema de captación de lluvia. Le leeré las preguntas y transcribiré sus respuestas. Si usted lo desea, puede ver la encuesta o leer las preguntas por usted mismo(a).
Esta encuesta es totalmente voluntaria y si hay alguna pregunta que usted no quiere contestar, es posible omitirla y continuar con la encuesta. Mi asesor de la facultad y yo tendremos el acceso único a la información que usted proporcionará. En cualquier momento, usted puede retirarse de la participación en la encuesta sin dificultad. Es muy improbable que esta encuesta representará cualquier amenaza a usted. Esta información es solamente para el uso de mi tesis y posiblemente en las publicaciones e investigaciones futuras. Este estudio no se relaciona con el gobierno local, estatal, o federal. La ventaja de participar en esta encuesta es la contribución del nuevo conocimiento a la sociedad, específicamente con respecto al uso de agua y el potencial de sistemas de captación de lluvia en la ciudad. Porque yo quiero tener confianza que entenderé todas sus repuestas y porque mi español es un poco limitado, me gustaría se preguntar si puedo registrar las preguntas abiertas durante la entrevista. Si no quiere que le registro su voz, esta bien, y conduciré la encuesta/entrevista sin mi aparato de registro. Todos los registros, transcripciones, y otros datos crudos estarán guardados en un cajón cerrado y en una contraseña protegida computadora, y estarán destruidos antes del primero de enero, 2013.
Si usted tiene dudas acerca de su participación en este estudio, puede contactar a Dra. Sarah Dunphy-Lelii de la tabla Institucional de Revisión del Colegio de Bard. Sus datos están al pie de pagina de este formulario. Además, usted puede contactar a mi asesor de la facultad, Dr. Gautam Sethi o a su servidor si usted tiene alguna pregunta. En este momento, ¿tiene usted alguna duda o pregunta? Le gustaría tomar unos minutos para revisar la versión escrita de lo que he dicho?
Al firmar esta página, usted está indicando que entiende la información antedicho escrito y está dispuesto(a) a participar en la encuesta. También le daré una copia de esta forma del consentimiento para sus expedientes. Por favor, chequear todas formas de consentimiento que se aplican: Doy permiso por la información que proveo en este estudio puede ser publicado de manera anónima, sin mención de los nombres de mi o mi familia.
Doy permiso por la información que proveo en este estudio puede ser citado específicamente, con mención de mi nombre.
Estoy de acuerdo en tener mi voz registrado por los propósitos de este estudio. ______________________________________ ______________________ Firma Fecha
______________________________________ Nombre y Apellido
!
!
!

!
!
150!
Si tiene, alguna pregunta, por favor póngase en contacto con: Nolan Gardner: [email protected], Instituto de la Naturaleza y la Sociedad de Oaxaca, 210 M. Bravo Altos, Centro, Oaxaca, México C.P. 68000 Tel: 951-223-6506 Sarah Dunphy-Lelii: [email protected], Psychology Program, Bard Center for Environmental Policy, PO Box 5000, Annandale-on-Hudson, New York 12504-5000, USA, Tel: 001-845-758-7621 Gautam Sethi: [email protected], Bard Center for Environmental Policy, PO Box 5000, Annandale-on- Hudson, New York 12504-5000, USA, Tel: 001-845-758-7073
Uso del agua y percepciones de la captación del agua de lluvia
A.) Demográficos de Hogares
13) Cuál es su nombre, dirección, número de teléfono, correo electrónico, género, y edad?
_______________________ _____________________________________ _____ Nombre dirección edad _______________________ _________________________________ _________ Número de teléfono correo electrónico género
14) Vive usted en un departamento o una casa?
____departamento ____casa Si vive en un DEPARTAMENTO: A) Cuántos departamentos hay en su edificio? ____departamentos en el edificio ____no lo sabe
B) Cuántas personas viven en este edificio? ____personas ____no lo sabe
15) Cuántas personas viven en su departamento/casa? ____personas que viven en el departamento/la casa ____no lo sabe
16) La casa es suya o la renta? ____propia ____renta
17) Usted es la persona que toma las principales decisiones en su hogar? ____si ____no
18) Que nivel de estudio tiene? Completó ese nivel? tiene el nivel de ____________________ en escuela. Completo:____yes ____no
Si NO COMPLETO:

!
!
151!
A) Hasta qué nivel llegó? ____________________nivel
19) La mayoría de personas en su hogar nacieron en la ciudad de Oaxaca? ____si ____no
20) Hay en su familia alguna persona que sea del extranjero? ____si ____no
21) Cuál es el promedio de ingreso mensual en su hogar? Elige de los siguientes limites:
____$0-$2,000 ____$2,000-$5,000 ____$5,000-$10,000 ____$10,000-$20,000 ____>$20,000 ____no lo sabe
22) Cuáles y cuántos de los siguientes artículos tiene en su hogar? ____licuadora ____coche ____calentador de agua ____refrigerador
____televisión ____celular ____sanitario que usa agua ____teléfono de casa ____regadera ____computadora ____lavarropas ____acceso al Internet
____lavavajillas ____plantas (que regan ustedes) ____fregadero 23) Cuánto dinero (en pesos) calcula que su hogar gasta cada semana en las siguientes
categorías? _________comida en la casa ________transporte _________comer en restaurantes
_________actividades recreativas _________otro:______________________ 24) Cuánto dinero (en pesos) calcula que su hogar gasta cada mes en las siguientes
categorías? __________escuela __________gas (para cocinar/calentar) __________electricidad
__________alquiler o hipoteca __________servicios médicos __________televisión __________hace las compras (por ropa etc.) __________otro:_____________________
B1.) Abasto de agua potable—General 7) Cuáles de las siguientes fuentes de agua utiliza su hogar para usos potables
(excepto para beber) tales como descargas de sanitario, cocina, limpieza, regadera, lavar ropa, y riego de jardín?
____ Conexión de ADOSAPACO ____Pipas ____pozo, comunitario o privado ____ Captación de agua de lluvia ____otro:____________________________
8) Cuántos litros cree usted que consume su hogar mensualmente para todos los usos potables (excepto para beber)?
____________litros cada mes ____no lo sabe

!
!
152!
9) Qué porcentaje de este consumo de agua “potable” proviene de las siguientes fuentes?
______conexión de ADOSAPACO ______Pipas ______pozo, comunitario o privado ______captación de agua de lluvia ______otro:____________________________
10) En su opinión, cómo es la calidad de agua de la red pública de ADOSAPACO?? ____muy mala ____mala ____mediocre
____buena ____muy buena ____no lo sabe 11) En su opinión, cómo es la calidad del agua de las Pipas Publicas?
____muy mala ____mala ____mediocre ____buena ____muy buena ____no lo sabe
12) En su opinión, cómo es la calidad del agua de las Pipas Privadas? ____muy mala ____mala ____mediocre
____buena ____muy buena ____no lo sabe 13) Durante un año, normalmente desde cuál mes hasta cuál mes considera usted que
la temporada de lluvia dura? de________________ a________________
14) Durante un año, normalmente desde cuál mes hasta cuál mes considera usted que la estación seca dura?
de________________ a________________
Avanza con cada sección de B que el hogar recibe agua no-potable como una fuente.
B2.) Abasto de agua “potable”—ADOSAPACO 7) Cuántos litros recibe usted mensualmente durante la estación lluviosa por su
conexión de ADOSAPACO? ____________litros por mes ____no lo sabe
8) Cuántos litros recibe usted mensualmente durante la estación seca por su conexión de ADOSAPACO?
____________litros por mes ____no lo sabe 9) De acuerdo a su conocimiento, cúal es el precio que paga cada dos meses por su
consumo de agua de la conexión de ADOSAPACO? ____________pesos cada dos meses ____no lo sabe
10) Ustedes tratan esta agua antes de que la utilicen? ____si ____no ____no lo sabe
Si el agua recibe TRATAMIENTO:

!
!
153!
A) Qué método de tratamiento usan ustedes? ____osmosis inversa ___hirviendo ___por cloración ____filtro de carbón activado
____filtro de sales ____luz ultravioleta ____por yodo ____otro:_________________ B) Para cuales de los siguientes usos utiliza su hogar el agua que trata de la conexión de ADOSAPCAO? ____para beber ____descarga de inodoro ____para cocinar ____para bañarse
____limpieza ____para lavar ropa ____riego de jardín ____otro:__________ C) Aproximadamente, qué porcentaje del agua de su conexión de ADOSAPACO tratan usted? ____________porcentaje ____no lo sabe
11) Para cuales de los siguientes usos utiliza su hogar el agua que NO trata de la conexión de ADOSAPACO?
____para beber ____descarga de inodoro ____para cocinar ____para bañarse ____limpieza ____para lavar ropa ____riego de jardín ____otro:__________
12) Durante la estación lluviosa, cuántos días por mes reciben ustedes el servicio de la red pública de ADOSAPACO?
________días por mes 13) Durante la estación seca, cuántos días por mes reciben ustedes el servicio de la
red pública de ADOSAPACO? ________días por mes
B3.) Abasto de agua “potable”—Pipas Publicas
13) Recibe usted agua de las Pipas públicas o privadas?
____públicas ____privadas ____los dos ____no lo sabe Si reciben el agua solamente de Pipas Privadas, salta a sección B4:
14) Quien le brinda el servicio de pipas publica? _______________________le brinda ____no lo sabe
15) El sevicio tiene un costo asociado? Cuánto paga cada repuesto? ____si, paga___________cada repuesto ____no ____no lo sabe
Si dise si, hay un COSTO ASOCIADO: A) Paga usted más por el servicio de pipa publica al final de la estación seca? Cuánto más paga? ____si, paga ________________ ____no ____no lo sabe

!
!
154!
B) Cuántos pesos calcular que pagan usted por los servicios de las Pipas Publicas cada año?
________________pesos por año ____no lo sabe 16) Con qué frecuencia reciben ustedes agua de estas Pipas Publicas?
______veces por__________ O _____veces por__________ ____no lo sabe 17) Generalmente, qué cantidad de agua reciben ustedes de las Pipas Publicas?
____________litros ____no lo sabe 18) Ustedes tratan el agua de las pipas publicas antes de que la utilicen?
____si ____no ____no lo sabe Si este agua recibe TRATAMIENTO: A) Cuáles métodos de tratamiento usan ustedes? ____osmosis inversa ____hirviendo ____por cloración ____filtro carbón activado
____filtro de sales ____luz ultravioleta ____por yodo ____otro:_________________ B) Cuáles de las maneras siguientes usan ustedes este agua?
____para beber ____descarga de inodoro ____para cocinar ____para bañarse ____limpieza ____para lavar ropa ____riego de jardín ____otro:__________
C) Aproximadamente, qué porcentaje del agua de las Pipas Publicas tratan ustedes?
____________porcentaje ____no lo sabe 19) Cuáles de las maneras siguientes usan ustedes el agua sin tratamiento de las
Pipas? ____para beber ____descarga de inodoro ____para cocinar ____para bañarse
____limpieza ____para lavar ropa ____riego de jardín ____otro:__________ Si NO RECIBEN el agua de las Pipas Privadas:
20) Por qué no compran ustedes el agua de las Pipas Privadas? ____demasiado caro ____agua sucia ____no sirven mi barrio ____otro:_________
B4.) Abasto de agua “potable”—Pipas Privadas
1) Cómo se llama la compañía a la que ustedes le compran agua de las Pipas Privadas, generalmente?
______________________________Pipas ____no lo sabe
2) Con qué frecuencia compran ustedes agua de las Pipas Privadas? ______veces por__________ O _____veces por__________ ____no lo sabe
3) Generalmente, qué cantidad de agua compran ustedes de las Pipas?
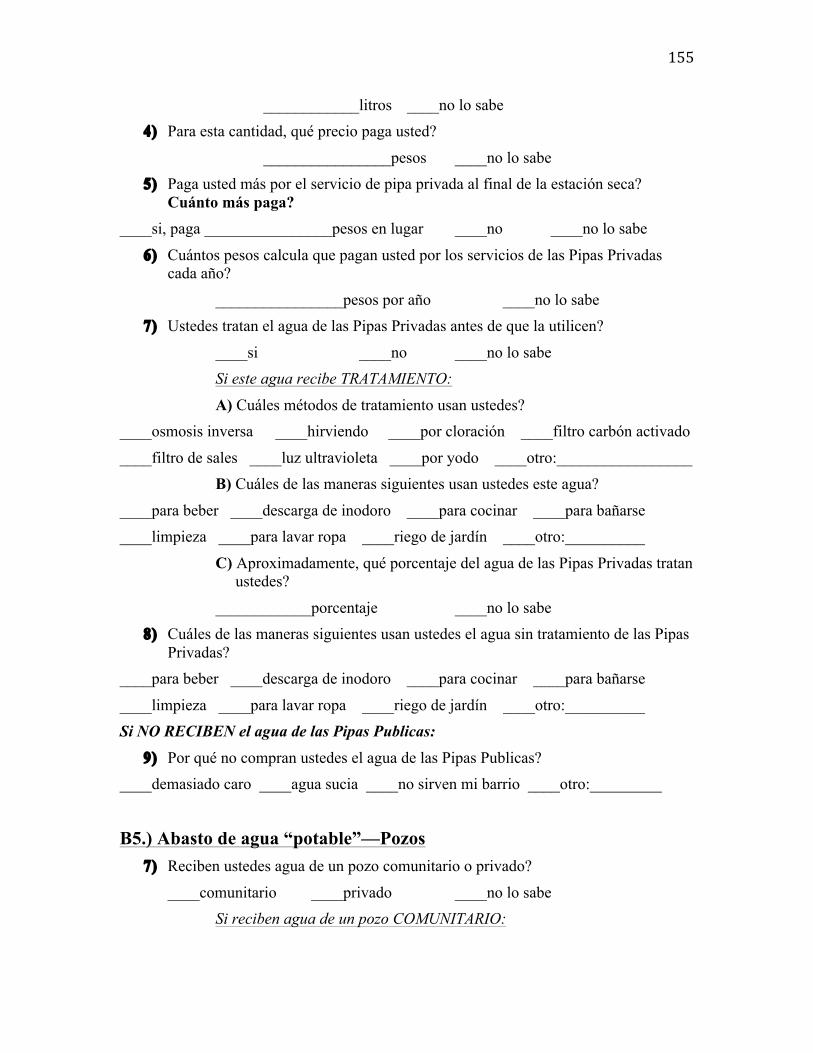
!
!
155!
____________litros ____no lo sabe 4) Para esta cantidad, qué precio paga usted?
________________pesos ____no lo sabe 5) Paga usted más por el servicio de pipa privada al final de la estación seca?
Cuánto más paga? ____si, paga ________________pesos en lugar ____no ____no lo sabe
6) Cuántos pesos calcula que pagan usted por los servicios de las Pipas Privadas cada año?
________________pesos por año ____no lo sabe 7) Ustedes tratan el agua de las Pipas Privadas antes de que la utilicen?
____si ____no ____no lo sabe Si este agua recibe TRATAMIENTO: A) Cuáles métodos de tratamiento usan ustedes? ____osmosis inversa ____hirviendo ____por cloración ____filtro carbón activado
____filtro de sales ____luz ultravioleta ____por yodo ____otro:_________________ B) Cuáles de las maneras siguientes usan ustedes este agua?
____para beber ____descarga de inodoro ____para cocinar ____para bañarse ____limpieza ____para lavar ropa ____riego de jardín ____otro:__________
C) Aproximadamente, qué porcentaje del agua de las Pipas Privadas tratan ustedes?
____________porcentaje ____no lo sabe 8) Cuáles de las maneras siguientes usan ustedes el agua sin tratamiento de las Pipas
Privadas? ____para beber ____descarga de inodoro ____para cocinar ____para bañarse
____limpieza ____para lavar ropa ____riego de jardín ____otro:__________ Si NO RECIBEN el agua de las Pipas Publicas:
9) Por qué no compran ustedes el agua de las Pipas Publicas? ____demasiado caro ____agua sucia ____no sirven mi barrio ____otro:_________
B5.) Abasto de agua “potable”—Pozos
7) Reciben ustedes agua de un pozo comunitario o privado?
____comunitario ____privado ____no lo sabe Si reciben agua de un pozo COMUNITARIO:

!
!
156!
A) Pagan ustedes un cargo de usuario por el derecho usar este pozo Cuánto paga usted cada año?
____si, paga________________pesos/año ____no ____no lo sabe 8) Cómo conduce el agua de este pozo a su departamento/casa?
___bombeada en la tubería ___extraída por cubeta ___no lo sabe ___otro:________ Si el agua del pozo es BOMBEADA:
A) Qué tipo de bomba emplean ustedes? ____eléctrica ____de combustible ____por fuerza humana ____otro:____________
9) En su opinión, cómo es la calidad de agua de este pozo? ____muy malo ____malo ____mediocre
____bueno ____muy bueno ____no lo sabe 10) Ustedes tratan este agua antes de que la utilicen?
____si ____no ____no lo sabe Si este agua recibe TRATAMIENTO: A) Cuáles métodos de tratamiento usan ustedes? ____osmosis inversa ____hirviendo ____por cloración ____filtro carbón activado
____filtro de sales ____luz ultravioleta ____por yodo ____otro:_________________ B) Cuáles de las maneras siguientes usan ustedes este agua?
____para beber ____descarga de inodoro ____para cocinar ____para bañarse ____limpieza ____para lavar ropa ____riego de jardín ____otro:__________
C) Aproximadamente, qué porcentaje del agua de este pozo tratan ustedes?
____________porcentaje ____no lo sabe 11) Cuáles de las maneras siguientes usan ustedes el agua sin tratamiento de este
pozo? ____para beber ____descarga de inodoro ____para cocinar ____para bañarse
____limpieza ____para lavar ropa ____riego de jardín ____otro:__________ 12) Durante la estación lluviosa, cuántos días por mes reciben ustedes el agua de este
pozo? ________días por mes
13) Durante la estación seca, cuántos días por mes reciben ustedes el agua de este pozo?
________días por mes

!
!
157!
C1.) Características de cisternas y tinacos
11) Usan ustedes alguna CISTERNA (tanques de almacenamiento subterráneo) en su departamento/casa? Cuántas cisternas usan?
____si, usan_______ ____no ____no lo sabe
Si usan una(s) CISTERNA(S): A) Cúal es la capacidad total de almacenaje de su(s) cisterna(s)?
______________litros (y ____________litros) ____no lo sabe B) De qué material es (son) su(s) cisterna(s)?
____plástico ____ferrocemento ____lodo ____metal ____asbesto ____tabique ____otro:____________________
C) Generalmente, de qué fuente llena usted su(s) cisterna (s)? ____ADOSAPACO ____las Pipas ____sistema de CALL ____otro:____________
D) Su(s) cisterna(s) está(n) cerrada la mayoría de las veces? ____si ____no ____no lo sabe
12) Usan ustedes algún TINACO (tanques de almacenamiento sobre el suelos) en su departamento/casa? Cuántos tinacos usan?
____si, usan_______ ____no ____no lo sabe Si usan uno(s) TINACO(S): A) Dónde está(n) ubicado(s)?
____techo/azotea ____patio ____patio trasero ____otro:_________________ B) Cuál es la capacidad total de almacenaje de su(s) tinaco(s)?
______________litros (y ____________litros) ____no lo sabe C) De qué material es (son) su(s) tinaco(s)?
____plástico ____ferrocemento ____lodo ____metal ____asbesto ____tabique ____otro:____________________
D) Generalmente, de qué fuente llena usted su(s) tinaco(s)? ____ de la cisterna ____de Pipas ____del sistema de CALL
____ de la conexión de ADOSAPACO ____otro:______________ E) Su(s) tinaco(s) está(n) cerrada la mayoría de las veces?
____si ____no ____no lo sabe Si tiene algún tanque de almacenaje, avanza a sección C1; si no, salta a sección C2.
13) Usan ustedes alguna bomba con su(s) cisterna(s) o tinaco(s)? O, utiliza la gravedad para dar presion?

!
!
158!
____bomba ____gravedad ____no lo sabe Si usan una BOMBA: A) Para qué utiliza la bomba? para llevar agua de________________a________________
B) Qué tipo de bomba emplea usted? ____eléctrica ____de gasolina ____por fuerza humana ____otro:____________
14) Cree usted que tener un mayor almacenamiento al que tiene ahora, le serviría para satisfacer mejor sus necesidades?
____si ____no ____no lo sabe 15) Tiene usted el espacio en su departamento/casa para poner un mayor almacén, si
usted lo quisiera? ____si ____no ____no lo sabe
16) Tiene usted alguna intención en el futuro de comprar un almacén más grande o más almacenes?
____si ____no ____no lo sabe 17) Por cuánto tiempo ha tenido usted su(s) almacén(es)?
______años, ______años , y______ años ____no lo sabe 18) Su(s) almacén(es) ha(n) tenido alguna fractura o alguna fuga? Cuáles?
____si ____no ____no lo sabe 19) Prevé usted alguna fractura o alguna fuga en el futuro?
____si ____no ____no lo sabe
C2.) Alternativas a cisternas y tinacos 9) Emplean ustedes alguna técnica de almacenaje? O confían ustedes en su conexión
de ADOSAPACO? ____técnicas de almacenaje ____no tienen ____no lo sabe
Si emplean TÉCNICAS DE ALMACENAJE: A) Qué técnicas de almacenaje emplean ustedes?
____cubetas o otros recipientes ____no lo sabe ____otro:______________________ 10) Qué tanto es su interés en adquirir una cisterna o un tinaco?
____no interesado(a) ____indiferente ____no me importa ____ligeramente interesad(a) ____muy interesado(a) ____no lo sabe
11) Por qué no tienen un almacén? ___demasiado caro ___innecesario ___no lo sabe ___otro:__________________

!
!
159!
12) Si comprará usted una cisterna o un tinaco para tu departamento/casa, qué material elegiría?
____plástico ____ferrocemento ____lodo ____metal ____asbesto ____tabique ____otro:____________________
13) Por qué prefiere usted este material? ____más barato ____más durable ____más ligero ____otro:__________________
14) Si comprara usted una cisterna o un tinaco para su departamento/casa, dónde lo ubicaría?
____sobre el suelo ____subterráneo ____no lo sabe ____otro:_______________ ____techo/azotea ____patio ____patio trasero ____no lo sabe ____otro:____________
15) Qué tamaño o capacidad sería ideal para su hogar? ____________litros
16) Es el tamaño o la capacidad de este tanque limitado por el espacio que tienen disponible para ponerlo?
____si ____no ____no lo sabe
D1.) Características del sistema de Captación de agua de lluvia (CALL)
23) Qué tipo de sistema de CALL tiene usted? ____cubetas o otros recipientes (como tambos) que captan agua del techo/azotea
____unos techo/azotea rodeado con canaletas y bajantes que llevan agua a un almacén ____captación directa del patio y los techos/azoteas (sin canaletas o bajantes)
____no lo sabe Avanza con sección D1, EXCEPTO si usan CUBETAS; si no, salta a sección D2
24) Por cuánto tiempo ha tenido usted su sistema de CALL? __________años
25) Qué tanto considera usted que tiene conocimiento sobre los sistemas de CALL? ____muy mal informado(a) ____mal informado(a) ____la media/el promedio
____bien informado(a) ____muy bien informado(a) ____no lo sabe 26) Aproximadamente, cuántos metros cuadrados calcula que tiene su techo/azotea?
_________metros cuadrados 27) De qué material es su techo/azotea?
____cemento ____adobe ____metal ____tejas de cerámica ____madera ____pastos o zacates ____otro:______________________

!
!
160!
28) Puede dibujar la configuración o forma de su techo y indicar las dimensiones aproximadas aquí?
29) Emplea usted alguna técnica de filtración previo al almacén? Cuáles? ____interceptor ____malla ____ninguno
____no lo sabe ____otro:________________________ 30) Dónde guarda usted su agua de lluvia captada?
____en tinaco / cisterna ____en cubetas ____en tambos ____otro:__________ 31) Usa usted este almacén para guardar otras fuentes del agua ambien? Cuáles?
____si es usado por_______________ ____no ____no lo sabe 32) Este(s) almacén(es) está(n) cerrado(s) la mayoría de las veces?
____si ____no ____no lo sabe 33) Qué capicidad de almacenamiento tienen ustedes por su agua de lluvia captada?
____________litros 34) Cuál es su opinión acerca de la calidad del agua de su sistema de CALL?
____muy mala ____mala ____mediocre ____buena ____muy buena ____no lo sabe
35) Tratan ustedes su agua de lluvia aparte del interceptor, malla, u otras técnicas inicial de filtración?
____si ____no ____no lo sabe Si TRATAN su agua de lluvia: A) Cuáles métodos de filtración o tratamiento usan ustedes? ____osmosis inversa ____hirviendo ____por cloración ____filtro carbón activado
____filtro de sales ____luz ultravioleta ____por yodo ____otro:_________________ B) Cuáles de las maneras siguientes usan ustedes esta agua de lluvia tratada? ____para beber ____descarga de inodoro ____para cocinar ____para bañarse
____limpieza ____para lavar ropa ____riego de jardín ____otro:__________ 36) Cuáles de las maneras siguientes usan ustedes el agua de lluvia sin tratamiento??
____para beber ____descarga de inodoro ____para cocinar ____para bañarse

!
!
161!
____limpieza ____para lavar ropa ____riego de jardín ____otro:__________ 37) Cuántas veces al año cumplen ustedes cada uno de los siguientes procedimientos
de mantenimientos? ____ purgar el interceptor ____limpiar el almacén ____limpieza de techo/azotea
____ mantenimiento de bomba(s) ____reemplazo de filtros ____ Limpieza de canaletas o bajantes ____no lo sabe
38) Como limpia o mantiene usted los lugares mencionados en la pregunta anterior? ________________________________________________________________________
________________________________________________________________________ 39) Cuánto cree usted que es el gasto de su hogar anualmente para mantener su
sistema de CALL? ____________pesos cada año
40) Cuántas horas calcula usted que su hogar gasta anualmente para mantener su sistema de CALL?
____________horas cada año 41) Cree usted que el trabajo que ha invertido para construir y mantener su sistema de
CALL ha valido la pena? ____si ____no ____no lo sabe
42) Cree usted que el agua de lluvia que ustedes captan contribuye considerablemente a su abasto de agua para su hogar?
____si ____no ____no lo sabe 43) Cuántos litros calcula usted que su hogar capta cada año con su sistema de
CALL? ____________litros cada año
44) Le recomendaría a un amigo un sistema de CALL? ____si ____no ____no lo sabe
45) Sabe usted si hay algún roedor, gato, u otro mamífero que viva en, sobre, o atraviese su azotea? De qué tipo y con qué frecuencia?
____si, hay________________ cada________________ ____no ____no lo sabe 46) Cuántos pájaros y aves viven en su barrio?
____no muchos ____lo normal ____tantos ____no lo sabe 47) Sabe usted si hay alguna limitación legal que exista para la CALL en la ciudad de
Oaxaca? Por favor, podría darme las referencias? ____si, la referencia es________________________________ ____no
48) Qué tanto es su interés en adquirir un sistema de CALL mejor o más completo?
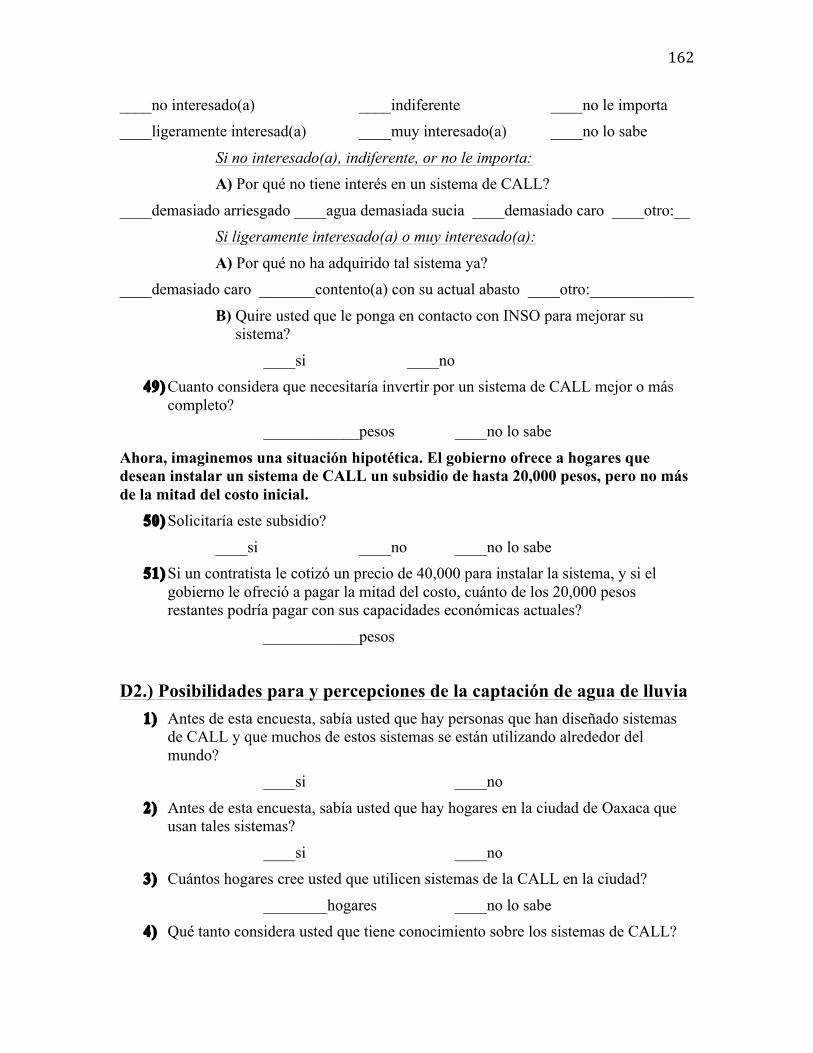
!
!
162!
____no interesado(a) ____indiferente ____no le importa ____ligeramente interesad(a) ____muy interesado(a) ____no lo sabe
Si no interesado(a), indiferente, or no le importa: A) Por qué no tiene interés en un sistema de CALL?
____demasiado arriesgado ____agua demasiada sucia ____demasiado caro ____otro:__ Si ligeramente interesado(a) o muy interesado(a): A) Por qué no ha adquirido tal sistema ya? ____demasiado caro _______contento(a) con su actual abasto ____otro:_____________
B) Quire usted que le ponga en contacto con INSO para mejorar su sistema?
____si ____no 49) Cuanto considera que necesitaría invertir por un sistema de CALL mejor o más
completo? ____________pesos ____no lo sabe
Ahora, imaginemos una situación hipotética. El gobierno ofrece a hogares que desean instalar un sistema de CALL un subsidio de hasta 20,000 pesos, pero no más de la mitad del costo inicial.
50) Solicitaría este subsidio?
____si ____no ____no lo sabe 51) Si un contratista le cotizó un precio de 40,000 para instalar la sistema, y si el
gobierno le ofreció a pagar la mitad del costo, cuánto de los 20,000 pesos restantes podría pagar con sus capacidades económicas actuales?
____________pesos
D2.) Posibilidades para y percepciones de la captación de agua de lluvia
1) Antes de esta encuesta, sabía usted que hay personas que han diseñado sistemas de CALL y que muchos de estos sistemas se están utilizando alrededor del mundo?
____si ____no
2) Antes de esta encuesta, sabía usted que hay hogares en la ciudad de Oaxaca que usan tales sistemas?
____si ____no 3) Cuántos hogares cree usted que utilicen sistemas de la CALL en la ciudad?
________hogares ____no lo sabe 4) Qué tanto considera usted que tiene conocimiento sobre los sistemas de CALL?
!
!
163!
____muy mal informado(a) ____mal informado(a) ____la media/el promedio ____bien informado(a) ____muy bien informado(a) ____no lo sabe
5) En su opinión, cómo es la calidad de agua de sistemas de CALL?? ____muy mala ____mala ____mediocre
____buena ____muy buena ____no lo sabe 6) Qué tanto es su interés en adquirir un sistema de CALL
____no interesado(a) ____indiferente ____no le importa ____ligeramente interesad(a) ____muy interesado(a) ____no lo sabe
Si no interesado(a), indiferente, or no le importa: A) Por qué no tiene interés en un sistema de CALL?
____demasiado arriesgado ____agua demasiada sucia ____demasiado caro ____otro:__ Si ligeramente interesado(a) o muy interesado(a): A) Por qué no ha adquirido tal sistema ya? ____demasiado caro _______contento(a) con su actual abasto ____otro:_____________
7) Aproximadamente, cuántos metros cuadrados calcula que tiene su techo/azotea? _________metros cuadrados
8) De qué material es su techo/azotea? ____cemento ____adobe ____metal ____tejas de cerámica
____madera ____pastos o zacates ____otro:______________________ 9) Puede dibujar la configuración o forma de su techo y indicar las dimensiones
aproximadas aquí?
10) Cuáles de los siguientes usos se imagina son apropiados para el agua de lluvia captada sin tratamiento?
____para beber ____descarga de inodoro ____para cocinar ____para bañarse ____limpieza ____para lavar ropa ____riego de jardín ____otro:__________
11) Piensa usted que la gente que capta agua de lluvia debe tratarla antes de usarla? ____si ____no debe usarla en absoluto ____no ____no lo sabe
12) Cuál considera usted que debería ser el método para filtrar dicha agua?

!
!
164!
____osmosis inversa ____hirviendo ____por cloración ____filtro carbón activado ____filtro de sales ____luz ultravioleta ____por yodo ____otro:_________________
13) Cuáles de los siguientes usos cree usted que son los más apropiadas para el agua de lluvia captada, si esta ha sido filtrada o tratada de la manera que sugirió?
____para beber ____descarga de inodoro ____para cocinar ____para bañarse ____limpieza ____para lavar ropa ____riego de jardín ____otro:__________
14) Sabe usted si hay algún roedor, gato, u otro mamífero que viva en, sobre, o atraviese su azotea?¿De qué tipo y con qué frecuencia?
____si, hay________________ cada________________ ____no ____no lo sabe 15) Cuántos pájaros y aves viven en su barrio?
____no muchos ____lo normal ____tantos ____no lo sabe 16) Cuanto considera que necesitaría invertir por un sistema de CALL
____________pesos ____no lo sabe Ahora, imaginemos una situación hipotética. El gobierno ofrece a hogares que desean instalar un sistema de CALL un subsidio de hasta 20,000 pesos, pero no más de la mitad del costo inicial.
17) Solicitaría este subsidio? ____si ____no ____no lo sabe
18) Si un contratista le cotizó un precio de 40,000 para instalar la sistema, y si el gobierno le ofreció a pagar la mitad del costo, cuánto de los 20,000 pesos restantes podría pagar con sus capacidades económicas actuales?
____________pesos
!
!