Embed Size (px)
Citation preview

Full Terms & Conditions of access and use can be found athttp://www.tandfonline.com/action/journalInformation?journalCode=ujfm20
Download by: [National Centre for Animal Health] Date: 04 April 2016, At: 12:17
North American Journal of Fisheries Management
ISSN: 0275-5947 (Print) 1548-8675 (Online) Journal homepage: http://www.tandfonline.com/loi/ujfm20
Predation by American White Pelicans and Double-Crested Cormorants on Catchable-Sized HatcheryRainbow Trout in Select Idaho Lentic Waters
Kevin A. Meyer, Christopher L. Sullivan, Patrick Kennedy, Daniel J. Schill,David M. Teuscher, Arnie F. Brimmer & D. Tommy King
To cite this article: Kevin A. Meyer, Christopher L. Sullivan, Patrick Kennedy, Daniel J. Schill,David M. Teuscher, Arnie F. Brimmer & D. Tommy King (2016) Predation by American WhitePelicans and Double-Crested Cormorants on Catchable-Sized Hatchery Rainbow Trout in SelectIdaho Lentic Waters, North American Journal of Fisheries Management, 36:2, 294-308, DOI:10.1080/02755947.2015.1120835
To link to this article: http://dx.doi.org/10.1080/02755947.2015.1120835
Published online: 30 Mar 2016.
Submit your article to this journal
Article views: 15
View related articles
View Crossmark data

ARTICLE
Predation by American White Pelicans and Double-CrestedCormorants on Catchable-Sized Hatchery Rainbow Trout inSelect Idaho Lentic Waters
Kevin A. Meyer,* Christopher L. Sullivan, Patrick Kennedy, and Daniel J. SchillIdaho Department of Fish and Game, 1414 East Locust Lane, Nampa, Idaho 83686, USA
David M. Teuscher and Arnie F. BrimmerIdaho Department of Fish and Game, 1345 Barton Road, Pocatello, Idaho 83204, USA
D. Tommy KingU.S. Department of Agriculture, Animal and Plant Health Inspection Service, Wildlife Services,National Wildlife Research Center, Post Office Box 6099, Mississippi State, Mississippi 39762, USA
AbstractIn southern Idaho, population growth of American white pelicans Pelecanus erythorhynchos at the Blackfoot
Reservoir and Lake Walcott colonies since the early 1990s has generated concerns about whether pelicanpredation is impacting angler catch of hatchery trout stocked in Idaho waters. To evaluate this concern, weestimated rates of pelican predation (i.e., the proportion of fish consumed by pelicans) and angler catch (i.e.,the proportion of fish caught by anglers) for 19 unique springtime fish stocking events over 3 years across 12study waters; where feasible we also estimated double-crested cormorant Phalacrocorax auritus predation.Stocked Rainbow Trout Oncorhynchus mykiss averaged 247 mm in length and were internally PIT-tagged (tomonitor bird predation) and externally anchor-tagged (to monitor angler catch) before stocking. Additionalhatchery trout were PIT-tagged, euthanized, and fed directly to pelicans to estimate PIT tag deposition rates atthe colonies; feeding was unsuccessful for cormorants. After the juvenile pelicans and cormorants fledged inthe fall, we recovered PIT tags from stocked and fed fish that were deposited at the two colonies. Depositionrates for pelican-consumed tags averaged 21% and declined exponentially as distance increased from thecolonies. Pelican predation on hatchery trout averaged 18% and ranged from 0 to 48%, whereas anglercatch averaged 21% and ranged from 0 to 82%. Mean angler catch was nearly four times higher when pelicanpredation was low (i.e., <25%) than when pelican predation was high (≥25%). Cormorant predation estimates(available for seven stocking events) were minimum estimates only (i.e., they assumed 100% of tags consumedby cormorants were recovered) and averaged 14% (range, 2–38%). Our results suggest that predation byAmerican white pelicans and double-crested cormorants on catchable-sized hatchery Rainbow Trout stocked insouthern Idaho waters often exceeds the total catch of those fish by anglers who compete directly with avianpredators for use of stocked trout.
American white pelicans Pelecanus erythorhynchos (here-after pelicans) experienced long-term declines in abundanceacross North America until the 1960s (Knopf and Evans2004). The cause of the decline is not clear but was likelyrelated to a lack of federal and state protection and the
extensive use of pesticides prior to the 1960s (Keith 2005).Regardless of what caused the decline, since the early 1990spelicans have experienced an almost exponential rebound inabundance (King and Anderson 2005), including in Idaho(IDFG 2009).
*Corresponding author: [email protected] June 23, 2015; accepted November 8, 2015
294
North American Journal of Fisheries Management 36:294–308, 2016© American Fisheries Society 2016ISSN: 0275-5947 print / 1548-8675 onlineDOI: 10.1080/02755947.2015.1120835
Dow
nloa
ded
by [
Nat
iona
l Cen
tre
for
Ani
mal
Hea
lth]
at 1
2:17
04
Apr
il 20
16

While recent increases in abundance are positive signs forthe conservation of American white pelicans across NorthAmerica, the increasing population size has also resulted indocumented cases of pelican predation impacts on native fishpopulations and important recreational fisheries. For example,pelicans can capitalize on fish spawning migrations (Findholtand Anderson 1995; Murphy and Tracy 2005; Scoppettoneet al. 2014), including in Idaho where pelicans frequentlyconsume substantial portions of the spawning migration ofnative Yellowstone Cutthroat Trout Oncorhynchus clarkii bou-vieri in the Blackfoot River system (Teuscher and Schill 2010;Teuscher et al. 2015). Substantial levels of pelican predationhave also been documented on hatchery trout within days ofindividual stocking events (Derby and Lovvorn 1997). Suchimpacts are not surprising for a generalist predator such as theAmerican white pelican that exhibits plasticity in its opportu-nistic feeding habits (Hall 1925; Knopf and Kennedy 1980).With the noticeable increase in the presence of pelicans atlocal fisheries, anglers and fisheries management agencies areincreasingly interested in quantifying the impact that pelicansmay be having on fisheries.
Recent innovative research investigating avian predation onsalmonids in the Pacific Northwest has focused on the recov-ery of PIT tags at bird colonies that were implanted in salmo-nids and subsequently consumed by nesting birds anddeposited at the colonies (Evans et al. 2012; Sebring et al.2013). Although PIT tag recovery efficiency at the colonieshas been estimated by intentionally sowing “control tags” ontothe bird colony before PIT tag recovery efforts are undertaken,a shortcoming to this approach is that off-colony depositionrate is unknown. Consequently, PIT tag recoveries using thismethodology only provide minimum predation estimates sincenot all tags that are consumed by birds are deposited at andrecovered from the colony. We used an updated modificationto this approach that incorporates off-colony deposition intothe predation estimates (Osterback et al. 2013; Scoppettoneet al. 2014; Hostetter et al. 2015; Teuscher et al. 2015),thereby producing estimates of total predation (rather thanminimum predation) by pelicans. The primary objective ofthis study was to estimate predation rates by American whitepelicans on catchable-sized (i.e., ~250 mm TL) hatcheryRainbow Trout O. mykiss stocked in several southern Idahoreservoirs and community ponds to gauge their general impacton hatchery-supported trout fisheries in southern Idaho.
In instances where pelican predation of stocked hatcheryfish is relatively high, it follows that angler catch (i.e., theproportion of the stocked fish caught and therefore used byanglers) of those same fish would likely be minimal since alarge portion of the stocked fish would have been consumedby pelicans before anglers could successfully catch them.However, angler catch of hatchery trout stocked in lenticenvironments is affected by numerous factors other than peli-can predation, such as rearing conditions in the hatchery (e.g.,Davison 1997; Barnes et al. 2009), season of stocking and size
at release (Yule et al. 2000), water quality (Koenig and Meyer2011), and the presence of piscine and other avian predators(Derby and Lovvorn 1997). Thus a low rate of pelican preda-tion would not necessarily translate directly into high rates ofangler catch. Likewise, we expected that pelican predation, atleast by breeding adults, would always be low at great dis-tances from a colony because breeding birds would choose toforage at waters closer to their nest. However, at waters inclose proximity to colonies, pelican predation would notnecessarily be high since it is affected by more than just traveldistance from the nest to the foraging water, such as waterdepth (Kaeding 2002; Ivey and Herziger 2006) and waterclarity (Anderson 1991) where the birds are foraging, thevulnerability of specific prey (Findholt and Anderson 1995),and forage abundance (Kaeding 2002). Secondary objectiveswere to evaluate relationships between rates of pelican preda-tion and angler catch, and rates of pelican predation anddistance from colonies.
Similar to American white pelicans, double-crested cor-morants Phalacrocorax auritus (hereafter cormorants) havealso increased in abundance in recent decades throughoutNorth America (Wires and Cuthbert 2006; Adkins et al.2014), including in Idaho. The increased abundance of thisfish predator has led to numerous conflicts with importanteconomic fish industries in North America, especially GreatLakes sport fisheries (Burnett et al. 2002; Lantry et al. 2002;Fielder 2008) and the aquaculture industry in the southeasternUnited States (Glahn et al. 2000; Dorr et al. 2012). As withpelicans, cormorants can also be very effective predators ofhatchery trout (Modde et al. 1996; Derby and Lovvorn 1997;Skiles 2008). Accordingly, a final study objective was toestimate cormorant predation on catchable-sized RainbowTrout stocked in some of these same Idaho waters.
STUDY AREAIn Idaho, American white pelicans nest primarily at two
adjacent islands in the Blackfoot Reservoir and at three adja-cent islands in Lake Walcott (also a reservoir), the latter ofwhich is part of the Minidoka National Wildlife Refuge.Pelicans in recent years have also been attempting to nest atan island in Island Park Reservoir in eastern Idaho but successhas been limited. Neighboring pelican colonies include MollyIsland at Yellowstone National Park in northwesternWyoming, Gunnison Island at the Great Salt Lake in northernUtah, Badger Island on the Columbia River in southwesternWashington, and the Malheur National Wildlife Refuge ineastern Oregon (Figure 1). Double-crested cormorants alsonest at the Blackfoot Reservoir and Lake Walcott pelicancolonies, as well as several other locations throughout Idaho.
The Idaho Department of Fish and Game (IDFG) annuallystocks about 1.8 million hatchery Rainbow Trout of catchablesize (i.e., about 250 mm TL)—hereafter referred to as hatch-ery catchable trout—in numerous lakes and rivers of Idaho to
PREDATION BY PELICANS AND CORMORANTS ON HATCHERY TROUT 295
Dow
nloa
ded
by [
Nat
iona
l Cen
tre
for
Ani
mal
Hea
lth]
at 1
2:17
04
Apr
il 20
16

provide put-and-take trout fisheries for Idaho anglers. For thisparticular study, we monitored pelican and cormorant preda-tion and angler catch of hatchery catchable trout stocked in 12study waters across southern Idaho (Figure 1; Table 1). Studywaters were not selected at random, but instead were selectedprimarily to (1) investigate pelican predation in several south-ern Idaho fisheries known or suspected to be receiving sub-stantial pelican use and (2) gain perspective on possiblegeographical gradients in pelican predation rates across south-ern Idaho in relation to Idaho’s primary pelican nesting loca-tions. Cormorants were known to forage on all study waters aswell. In some waters, hatchery catchable trout were the onlyfish present, but in most waters pelicans and cormorants couldforage on a variety of other fishes (Table 1), including severalspecies of centrarchids, cottids, cyprinids, catostomids, andother salmonids.
Distances from the study waters to the nearest of the twoprimary Idaho pelican colonies ranged from 0 to 304 km(Table 1). The soaring ability of pelicans enables them toforage at distances of up to 300 km from their nests(Johnson and Sloan 1978; Trottier et al. 1980; O’Malley andEvans 1982). In contrast, the maximum foraging distance forcormorants is only about 50 km from their nests (Custer and
Bunck 1992; Bugajski et al. 2012). Thus, for study waterswithin 50 km of the colonies, PIT-tagged fish consumed byavian predators and deposited at the Blackfoot Reservoir orLake Walcott colonies could have been the result of pelican orcormorant predation, whereas for waters more than 50 kmfrom a colony, tag deposition at the colony likely could onlyhave been the result of pelican predation. This distinction wasimportant for our approach to estimating pelican and cormor-ant predation.
METHODSEstimating the rate of pelican and cormorant predation
on hatchery catchable trout involved four steps outlined indetail below but summarized here. The first step was tostock PIT-tagged hatchery catchable trout into our studywaters that were then vulnerable to pelican and cormorantpredation. A second step was to PIT-tag other hatchery fish,euthanize them, and feed them directly to pelicans at many(but not all) of the study waters, which allowed us toestimate tag deposition rates at the colonies; direct feedingof cormorants was attempted but was unsuccessful. Thethird step occurred after pelicans and cormorants on theBlackfoot Reservoir and Lake Walcott colonies had fledged
FIGURE 1. American white pelican colonies nearest to the study waters in southern Idaho where American white pelican and double-crested cormorantpredation of hatchery catchable Rainbow Trout was evaluated. Study-water numbers correspond to study-water names in Table 1.
296 MEYER ET AL.
Dow
nloa
ded
by [
Nat
iona
l Cen
tre
for
Ani
mal
Hea
lth]
at 1
2:17
04
Apr
il 20
16

their young; at that time we searched the two colonies (aswell as a few other cormorant roosting and loafing areas)for regurgitated and/or defecated PIT tags. The final stepwas to apportion the recovered tags into those known orassumed to have been consumed by either pelicans orcormorants.
By recovering PIT tags at the colonies from fish stocked inour study waters, we were able to estimate a minimum rate ofpelican predation at each study water, which was simply thenumber of tags recovered from a particular study water (andassigned to pelicans) divided by the number of tagged fishstocked at that water. For the four study waters within 50 kmof the nearest colony, we could similarly estimate a minimumrate of cormorant predation. These minimum rates of preda-tion did not account for stocked fish with tags that wereconsumed by pelicans or cormorants but were either notdeposited on or not recovered at the two colonies.
By recovering tags from fish fed directly to pelicans atvarious study waters, we could directly estimate water-spe-cific tag recovery efficiency for pelicans. This was impor-tant because (1) not all tags consumed by birds nesting atone of the two colonies would necessarily be deposited onthe island where they were nesting, and (2) birds foragingin Idaho that were not nesting at these two colonies (e.g.,
nonbreeding birds and birds nesting at other colonies) hadlittle to no chance of depositing a tag at these colonies.Estimating tag recovery efficiency for each water allowedus to transform (for pelicans only) minimum predationestimates into estimates of total predation on hatcherycatchable trout that included predation by all pelicans, notjust those nesting at the colonies we were studying (cf.Teuscher et al. 2015). Because cormorant feeding wasunsuccessful, tag recovery efficiency was unknown for cor-morants. Thus, all tag recoveries ascribed to cormorantsresulted only in minimum estimates of cormorant predation(cf. Evans et al. 2012; Sebring et al. 2013).
Fish stocking.—To accomplish the first step in themethodology outlined above, we stocked PIT-taggedcatchable Rainbow Trout into each study water inconjunction with regularly scheduled hatchery trout stockingevents. The PIT-tagged fish comprised on average about 2% ofthe total number of hatchery catchable trout stocked in anygiven water in any given year. Mean size of stocked fishaveraged 247 mm TL (SD = 24.9). Prior to tagging, hatcheryfish were sedated with peppermint oil (in a 1:10 stock solutionratio with ethanol, using 0.3–0.5 mL of stock solution per literof water). Once sedated, PIT-tags (23-mm half-duplex tags)were injected using a 7-gauge hypodermic needle inserted into
TABLE 1. Characteristics of the study waters and their distance (km) from the nearest colonies to the waters stocked with PIT-tagged, catchable-sized RainbowTrout that were then exposed to American white pelican and double-crested cormorant predation. Numbers in bold italics indicate study water × colonycombinations where PIT tag recoveries actually occurred at colonies. Numbers also underlined indicate study water × colony combinations where cormorantsmay also have contributed to consumption and deposition of PIT tags (based on maximum foraging range). Numbers assigned to study waters are used forgeographical orientation in Figure 1; Res. = Reservoir
Nearest pelican colonies (km)
Numberassignedto studywater Study waters
Waterbody
size (ha)
Number offish speciespresent
Number ofcatchable troutannually stocked
YellowstoneNationalPark
IslandParkRes.a
BlackfootRes.
LakeWalcott
GreatSaltLake
1 Cascade Res. 10,994 11 62,000 459 363 412 304 4482 CJ Strike Res. 3,035 23 102,000 483 385 354 201 3133 Riley Creek Pond 7 0 17,000 415 323 274 118 2314 Filer Pond 1 0 7,600 403 314 252 95 2025 Magic Res. 1,569 8 6,000 366 268 231 111 2306 Freedom Park Pond 1 0 1,000 346 272 181 32 1547 Rupert Gun Club
Pond4 0 900 347 271 181 32 156
8 Lake Walcott 3,335 11 40,000 315 248 148 0 1529 American Falls Res. 22,369 11 51,000 259 199 95 56 17010 Chesterfield Res. 504 7 57,000 213 174 27 119 18711 Foster Res. 52 5 5,900 275 252 84 140 11112 Glendale Res. 82 6 9,200 275 253 83 141 113
a Pelican nesting is annually attempted here, but successful offspring are rarely produced.
PREDATION BY PELICANS AND CORMORANTS ON HATCHERY TROUT 297
Dow
nloa
ded
by [
Nat
iona
l Cen
tre
for
Ani
mal
Hea
lth]
at 1
2:17
04
Apr
il 20
16

the abdominal cavity; the insertion point was posterior to thepectoral fin, offset slightly to the right or left side dependingon the handedness of the individual tagger. Fish were thentransferred to net pens in the raceways and held for 1–2 d priorto stocking. To reduce the rate of tagging mortality, individualfish were judged, up to the point of release, according towhether they were unfit for this study due to visible signs ofstress from capture and handling procedures (Nielsen 1992).This monitoring protocol applied to the implantation of anchortags as well (see below). Mortality rate for fish tagging beforestocking was <1%, but individual mortalities were noted andsubtracted from the number of fish actually stocked.Postrelease mortality from tagging was assumed to be zero(Acolas et al. 2007).
Pelican feeding.—During this same time frame, we fedhatchery fish (also abdominally tagged with PIT tags)directly to pelicans at many (but not all) of the study waters.Feeding occurred between late May and mid-July, whichencompassed much of the time when breeding pelicans wereforaging and traveling between the breeding colonies andforaging sites to feed their chicks. For each pelican feedingevent, hatchery fish were obtained from a state fish hatcheryand were euthanized with an overdose of peppermint oil whiletraveling to the study water. These fish were injected with aPIT tag into the abdominal cavity along with a small amountof air under the skin before being thrown individually in thedirection of loafing or foraging pelicans. The purpose of theinjected air in the euthanized fish was to help ensure the fishdid not sink after being thrown, thereby increasing thelikelihood that a pelican would consume the PIT-tagged fish.Although loafing and foraging pelicans were initially wary ofour approaching boat, they became more comfortable with ourclose proximity after a few days and readily consumed fishthrown in their direction. Each fish thrown in the direction ofpelicans was monitored with binoculars until a pelicancaptured and swallowed the fish.
Attempts were made to minimize the occurrence of indivi-dual birds consuming more than one tagged fish in any givenday in order to achieve independence in tag recoveries.Although at times 100 or more pelicans were attempting toconsume fish being fed to them, no more than 40 tagged fishwere fed on any given day. This also allowed us to temporallydisperse colony deposition of fed tags throughout more of thepelican breeding season. How many fish were successfully fedto pelicans on any given day was variable depending on thesize and wariness of the pelican flock; thus at most waters,several feeding events were employed each year throughoutthe feeding period.
Loafing and foraging cormorants never allowed us to beclose enough in proximity to engage in direct feeding, sofeeding events targeted at cormorants were abandoned.Consequently, they also did not interfere with pelican feeding.
PIT tag recoveries.—We searched for regurgitated and/ordefecated PIT tags from fed and stocked fish at the Blackfoot
Reservoir and Lake Walcott colonies after the juvenilepelicans and cormorants had fledged in the fall. We used aPIT tag reader (Oregon RFID HDX Backpack Reader) with a0.5-m-diameter hoop antenna attached to the end of a 2-m-long pole. The read range for PIT tags was generally about 0.5m regardless of whether the tag was on the surface or buriedslightly in a nest or below ground level. Searchers scanned theentire colonies by “sweeping” the antenna back and forth justabove the ground while slowly walking in 2-m-wide transectsthat overlapped one another to ensure that all of the groundwas covered once. We also scanned shallow water (<0.3 mdeep) surrounding the islands (submersing the antenna whilesweeping these areas) and cormorant nests in bushes. When atag was detected, surveyors noted the location as being in orvery close to a cormorant nest, in or very close to a pelicannest, or not close to a nest. Surveyors then used a hand troweland sieve to recover and remove the tag, if it was not visibleon the surface in order to avoid interference with other PITtags in the same area or in subsequent years. In the fewinstances where we were unable to recover and remove thetag, attempts were made to ensure no other PIT tags were inthe same location, and individual PIT tag numbers wererecorded. We assumed that any tag we recovered fromstocked fish was from a live fish that a bird consumed, notfrom stocked fish that had died of natural causes and was latereaten by a pelican or cormorant.
Apportioning colony tag recoveries to pelicans orcormorants.—For 8 of the 12 study waters (which produced14 of the 19 individual pelican predation estimates), thenearest colony was presumably outside the foraging range ofall avian predators except pelicans, so all PIT tags recovered atthe colonies from those waters were assigned to pelicanpredation. For one other study water, tag deposition occurredat the Blackfoot Reservoir colony, and this water was withinthe foraging range of that colony for both pelicans andcormorants. However, pelican and cormorant nesting did notoverlap at the Blackfoot Reservoir colony during our study (D.M. Teuscher, unpublished data), so tags recovered from thiswater were assigned to pelican or cormorant predation basedon tag recovery location at the colony. Thus, assigning PITtags recovered at the colonies to pelican or cormorantpredation was unambiguous for 9 of the 12 study waters (or15 of the 19 pelican predation estimates).
For the remaining three study waters (which produced theremaining four pelican predation estimates), tag depositionoccurred at the Lake Walcott colony, and these waters wereall within the foraging range of that colony for both pelicansand cormorants. At this colony, pelicans and cormorants weregenerally segregated in their nesting locations, but there wasnot complete separation. For example, cormorants often nestedin bushes elevated a meter or more off the ground, and theysometimes roosted in willows, while some pelicans nestedunderneath these cormorant nesting or roosting areas.Moreover, some fed tags (known to have been consumed by
298 MEYER ET AL.
Dow
nloa
ded
by [
Nat
iona
l Cen
tre
for
Ani
mal
Hea
lth]
at 1
2:17
04
Apr
il 20
16

pelicans) were recovered closer to a cormorant nest than apelican nest (K. A. Meyer, unpublished data). Also, trailcameras showed that cormorants were occasionally presentamid numerous nesting pelicans, and both birds were seenloafing near one another near the island shores.
It was clear that both birds were foraging at these watersbecause PIT tags from stocked fish were recovered in bothcormorant and pelican nests. However, because pelican andcormorant nesting and loafing was not entirely segregated atLake Walcott, correct tag assignment for these waters at thiscolony was questionable. Consequently, we compared theassignment of predation to pelicans or cormorants usingthree approaches in order to assess variability in tag assign-ment (Table 2). First, recovered tags were assigned to pelicansor cormorants based on the proportional abundance of thesebirds at the colony. This was determined by mounting severalcameras on fence posts placed strategically around the LakeWalcott islands to best capture images of birds present on theislands. The cameras captured images at hourly intervals eachday from May through September each year, resulting in tensof thousands of images. We subsampled the images by ran-domly selecting six photographs (from daylight times only)from each camera for each month (from May to September),for a total of 180 images being used each year. We counted thenumber of pelicans and cormorants visible in each picture(mean = 46 pelicans and cormorants per picture; range,0–253), and estimated the mean number of pelicans and cor-morants present across the entire period from May toSeptember at each island. We used these estimates of birdabundance to proportionally assign tags recovered fromstocked fish to either pelican or cormorant predation(Table 2). This approach assumed that pelicans and cormor-ants were equally successful at foraging on hatchery catchabletrout, and that their energetic demands were equivalent.
A modification of this approach accounted for differencesin energetic demand between these birds, which are reason-ably well defined. Adult double-crested cormorants require
approximately 320 g of fish per day (Hatch and Weseloh1999) compared with 1,500 g for American white pelicans(Ferguson et al. 2011), and cormorant chicks require an esti-mated 8–9 kg of food from hatching to fledging (Seefelt andGillingham 2008) compared with 68 kg for American whitepelican chicks (Hall 1925). Tag assignment based solely onbird abundance was thus modified to account for these ener-getic differences (Table 2).
A final approach for assigning recovered tags from thesethree waters to either pelican or cormorant predation wasbased on tag recovery location relative to the nearest pelicanor cormorant nest (Table 2). Although as noted above, therewas not complete separation in pelican and cormorant nestingand loafing areas at the Lake Walcott colony, we neverthelessrecorded the location of each recovered tag relative to thenearest pelican or cormorant nest. Under this approach, anytags recorded in or very near a pelican or cormorant nest wasassigned according to the nest that the tag was in or closest to;any remaining tags recovered near shore or nowhere near anest were assigned to pelican or cormorant predation based onestimates of bird abundance, as outlined above. This approachassumed that all tags found in or near pelican nests wereconsumed by pelicans and likewise for cormorants.
All three approaches generally resulted in similar numbersof tags being assigned to either pelican or cormorant predation(Table 2). Considering this similarity, we felt that for the threestudy waters in question, assigning pelican or cormorant pre-dation to recovered tags based solely on bird abundance wasthe best approach because it appeared to balance the variousassumptions of these approaches and it resulted in relative tagassignments that were intermediate to the other twoapproaches.
Because only 4 of the 12 study waters were within therange of cormorant foraging from the Blackfoot Reservoir orLake Walcott colonies, basing cormorant predation only on tagrecoveries at colonies would have limited our ability to char-acterize cormorant predation. Therefore, to augment colony
TABLE 2. Summary of PIT tags recovered at the Lake Walcott colony from stocked catchable Rainbow Trout and assigned to predation by either Americanwhite pelican or double-crested cormorant based on three possible tag assignment approaches. Approach one assigned tags proportional to pelican andcormorant abundance at the colonies, approach two assigned tags proportional to abundance with an adjustment for energetic differences between pelicans andcormorants, and approach three assigned tags according to tags recovery location in proximity to pelican and cormorant nesting and loafing areas. See text formore details regarding each apporach.
Number of PIT-tagged fish
Recovered tags assigned to pelicans or cormorants
Hatchery troutstocking water
Approach one Approach two Approach three
Year StockedRecovered atnearest colony Pelicans Cormorants Pelicans Cormorants Pelicans Cormorants
Freedom Park Pond 2013 100 19 16 3 18 1 12 7Rupert Gun Club Pond 2013 99 18 16 2 18 0 14 4Lake Walcott 2013 397 82 65 17 79 3 54 28Lake Walcott 2014 208 63 41 22 58 5 39 24
PREDATION BY PELICANS AND CORMORANTS ON HATCHERY TROUT 299
Dow
nloa
ded
by [
Nat
iona
l Cen
tre
for
Ani
mal
Hea
lth]
at 1
2:17
04
Apr
il 20
16
tag recoveries, at a few waters we scanned for additional tagsat cormorant roosting and loafing areas. We only scannedcormorant roosting and loafing areas that were (1) well definedspatially, (2) rarely if ever visited by other avian predators(namely pelicans and herons), and (3) logistically feasible toscan. We assigned all PIT tags recovered at cormorant roostingand loafing areas to cormorant predation. Recovered tags fromthis step were combined with colony-recovered tags assignedto cormorants before final estimates of cormorant predationwere made.
Calculating pelican predation rates.—For each stockingevent that was coupled with pelican feeding, proportions ofrecovered tags were calculated independently for both the fedtags (FT) and stocked tags (RT), where FT = tag recoveryefficiency, i.e., the number of fed PIT tags found on the colonydivided by the total number of tags fed to pelicans, and RT =number of stocked PIT tags found on the colony (that wereassigned to pelicans) divided by the total number of taggedfish stocked.
Variance for these proportions was calculated according tothe formula in Fleiss (1981) as
Var proportionð Þ ¼ffiffiffiffiffiffiffiffiffiffiffiffiffiffiffiffiffiffiP 1� Pð Þ
n
r
where P is the numerator of a proportion (e.g., FT, RT), and nis the denominator. We calculated the pelican predation rate(Predpel) for each water body when both fed and stocked tagswere recovered at a colony according to the followingformula:
Predpel ¼ RT
FT:
Because the numerator and denominator were both indivi-dual estimates, with their own estimates of variance, we usedthe approximate formula for the variance of a ratio (McFadden1961; Yates 1980) to calculate the variance for Predpel, usingthe following formula:
VarRT
FT
� �¼ RT
FT
� �2
� Var RTð ÞRT2
þ Var FTð ÞFT2
� �:
For each water-specific estimate of the rate of pelicanpredation, we calculated the 90% CI.
For stocking events that were not coupled with pelicanfeeding events, we could not directly estimate total pelicanpredation because tag recovery efficiency was not estimated.Instead, we predicted tag recovery efficiency for these stock-ing events based on a scatterplot of distance to colony (x-axis)and tag recovery efficiency (y-axis) for the stocking eventsthat were coupled with pelican feeding. The relationship wascurvilinear in nature, so we fitted an exponential regression to
the data to evaluate the statistical significance of the relation-ship. Estimates of RT for waters where no feeding occurredwere then adjusted by the predicted tag recovery efficiency inorder to estimate total pelican predation for these waters.
Calculating cormorant predation rates.—Because cormo-rants were not fed directly, tag recovery efficiency could notbe estimated for cormorants for any stocking events.Therefore, all cormorant predation estimates were minimumestimates only, based simply on the number of stocked PITtags found at cormorant loafing and roosting areas or at thecolonies and assigned to cormorants, divided by the totalnumber of tags stocked.
Estimating angler catch.—To estimate angler catch, weattached T-bar anchor tags to the same hatchery catchabletrout that were released with PIT tags in the study waters.Tags were inserted just below the dorsal fin following therecommendations of Guy et al. (1996). Anchor taggingoccurred at the same time as PIT-tagging.
For more details on anchor-tagging methods and estimatingangler catch see Meyer et al. (2012) and Meyer and Schill(2014). In short, anchor tags were fluorescent orange (soanglers could more easily notice them on fish), 70 mm inlength (including 51 mm of tubing), and labeled with theagency and phone number (i.e., IDFG 1-866-258-0338)where tags could be reported. A toll-free automated telephonehotline and website were established through which anglerscould report tags, although some tags were mailed to ordropped off at IDFG offices. Tag reporting by anglers in thisprogram was voluntary, not mandatory.
We tested whether implanting hatchery catchable troutwith fluorescent orange tags made them more visible topelicans and cormorants and therefore more vulnerable tobird predation by implanting one-half of the stocked fishwith dull green anchor tags at six waters in 2013 to evaluatetag recovery by tag color. We recovered a total of 108 and 99PIT tags from fish stocked in these waters with dull greenand fluorescent orange anchor tags, respectively. AWilcoxonsigned rank test indicated that tag recoveries did not differ bycolor (P = 0.50).
Unadjusted angler catch (c) for each stocking event wascalculated as the number of tagged fish reported as caughtby anglers (within 1 year of the stocking event) divided bythe number of fish released with tags; variance for thisproportion was again calculated according to the same for-mulas in Fleiss (1981) as noted above. Adjusted anglercatch (c′) incorporated estimates of angler tag reportingrate (λ), anchor tag loss rate (tagl), and mortality rate offish with tags (Tagm) (estimated to be 49.4, 8.2, and 1%,respectively; see Meyer and Schill 2014) and used thefollowing formula:
c′ ¼ cλ 1� Taglð Þ 1� Tagmð Þ :
300 MEYER ET AL.
Dow
nloa
ded
by [
Nat
iona
l Cen
tre
for
Ani
mal
Hea
lth]
at 1
2:17
04
Apr
il 20
16

Variance estimates for λ, Tagl, and Tagm came from datareported in Meyer and Schill (2014). Variance for the entiredenominator in the above equation was estimated using theapproximate formula for the variance of a product in Yates (1980):
s2x1x2 ¼ x21 � s2x2 þ x22 � s2x1;
where s2x1x2 is the variance of the product, x1 and x2 areindependent estimates being multiplied together, and s2x1 and
s2x2 are their respective variances. Variance for c′ was calcu-lated using the approximate formula for the variance of a ratio,as previously noted, from which 90% CIs were derived.
Scatterplots were constructed to evaluate relationshipsbetween rates of pelican predation and angler catch and ratesof pelican predation and distance from colonies. The relation-ships were more curvilinear than linear in nature (with stron-ger effect sizes), so we fitted exponential regressions to thedata to evaluate the statistical significance of the relationships.We also used a t-test to assess whether angler catch wasreduced when pelican predation was high (i.e., ≥25%) com-pared with when pelican predation was low (<25%); a one-tailed test was used since we assumed that higher pelicanpredation would not positively affect angler catch rates.
We used α = 0.10 for all statistical significance tests and forcalculating CIs. This less-stringent significance level (com-pared with the more standard use of α = 0.05) was adoptedto balance type I and type II errors in our statistical tests(Cohen 1990; Stephens et al. 2005) and because resourcemanagers in our agency were content with the tradeoff ofhaving tighter bounds around the estimates of predation andangler catch at the expense of less confidence in the estimates.
RESULTSWe directly fed a total of 1,073 PIT-tagged hatchery catch-
able trout to pelicans over 3 years and subsequently recovered189 (18%) of the tags at the Blackfoot Reservoir or LakeWalcott pelican colonies (Table 3). For the 13 water × studyyear combinations of pooled feeding events, tag recovery effi-ciency at the colonies averaged 21% and ranged from 0 to 65%(Table 3). There was a strong negative exponential relationshipbetween the distance from a particular study water to the nearestpelican colony and tag recovery efficiency for the feeding eventsin that study water (R2 = 0.80, F = 43.99, P < 0.001; Figure 2).
We stocked a total of 5,565 PIT-tagged hatchery catchabletrout in 19 separate stocking events in our study waters andrecovered 194 (4%) of the tags, which were known or assumedto have been consumed by pelicans, at the Blackfoot Reservoiror Lake Walcott colonies (Table 4). Resulting estimates of totalpelican predation on hatchery catchable trout that were stockedaveraged 18% and ranged from 0 to 48%.
In comparison, a total of 311 PIT tags implanted in stockedfish were recovered at the colonies or at cormorant loafing and
roosting areas and were known or assumed to have beenconsumed by cormorants (Table 5). These tag recoveriescame from 7 of the 19 stocking events; for the remaining 12stocking events, cormorant tag recoveries were not attempted.Resulting estimates of minimum cormorant predation—assuming that 100% of tags consumed by cormorants wererecovered—averaged 14% and ranged from 2% to 38%(Table 5). If we assumed that cormorant tag recovery effi-ciency was equivalent to pelican tag recovery efficiency, totalcormorant predation was estimated to average 21% and rangedfrom 5% to 69%.
The maximum pelican foraging distance we documentedwas 248 km (Table 1). Pelican predation rates at individualwaters declined exponentially at greater distances from thenearest colony (R2 = 0.26, F = 5.93, P = 0.03; Figure 3).
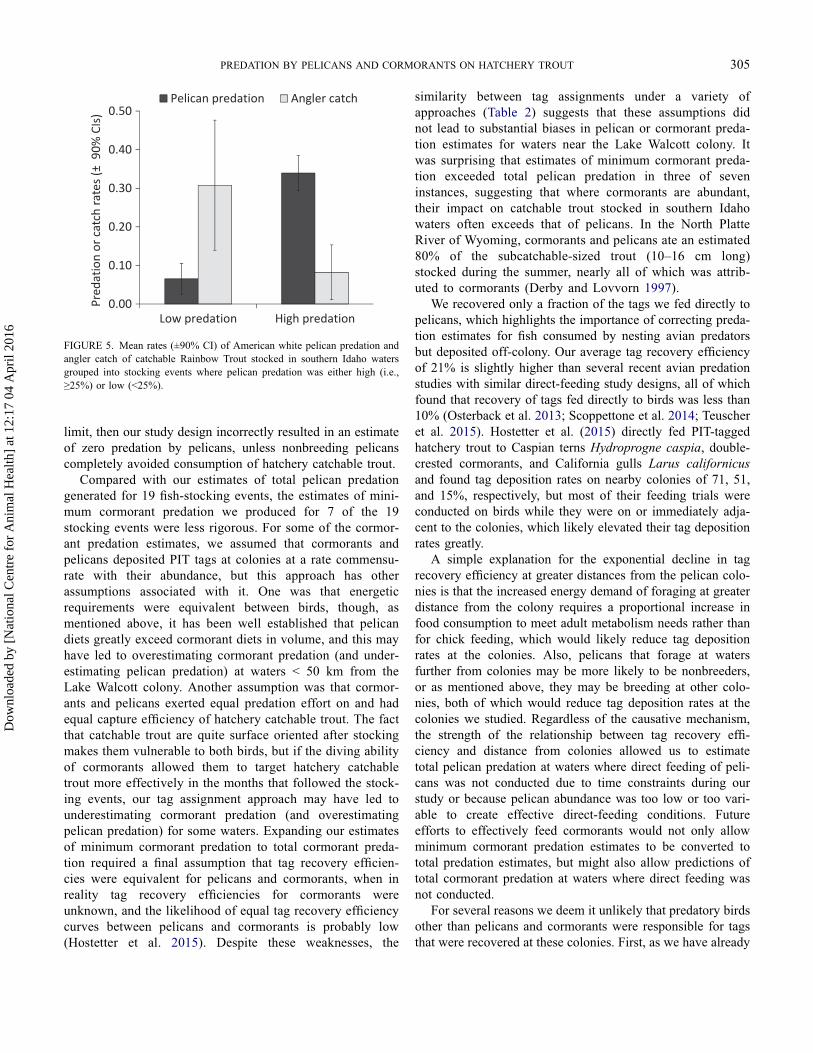
Angler catch of anchor-tagged hatchery catchable troutstocked in study waters averaged 21% and ranged from 0 to82% (Table 4). There was some evidence of a negative expo-nential relationship between pelican predation and anglercatch for individual stocking events (R2 = 0.15, F = 3.11, P= 0.10; Figure 4), although the relationship was weak andquite variable. Nevertheless, for stocking events where pelicanpredation was ≥25%, angler catch averaged only 8%, whereaswhen pelican predation was <25%, angler catch averaged31%; this nearly fourfold difference in mean angler catchwas statistically significant (t = 1.33, df = 17, P = 0.03;Figure 5).
DISCUSSIONOur results suggest that predation by American white peli-
cans and double-crested cormorants on catchable RainbowTrout stocked in southern Idaho waters can be relativelyhigh (i.e., >25%) and often exceeds the total catch of thosefish by anglers who compete directly with avian predators forthe use of stocked trout. Although our study includes resultsfrom only a small sample of locations, our findings support thesupposition that in southern Idaho, pelican predation on hatch-ery catchable trout will negatively affect angler catch rates forthese fish in some waters. In the neighboring state ofWyoming, pelicans quickly increased their focus on troutspecies (relative to other prey species available) as soon ashatchery trout were stocked (Derby and Lovvorn 1997).Rainbow Trout more often display pelagic (i.e., suspended inthe water column) rather than benthic (near the substrate)behavior in lentic waters, making them particularly vulnerableto avian predation compared with other salmonids (Matkowski1989). Moreover, fish reared in production raceways are naïvewith regard to predators and once they are stocked they do notinitiate avoidance behaviors exhibited by wild fish (Berejikian1995).
Estimated predation rates by pelicans on stocked RainbowTrout in the study waters we evaluated were quite variable, butwere nonetheless inversely related to the distance from the
PREDATION BY PELICANS AND CORMORANTS ON HATCHERY TROUT 301
Dow
nloa
ded
by [
Nat
iona
l Cen
tre
for
Ani
mal
Hea
lth]
at 1
2:17
04
Apr
il 20
16

study water to the nearest colony. Declines in avian predationrates related to distance from colonies have been previouslydemonstrated (e.g., Fasola and Bogliani 1990; Osterback et al.2013) and would be expected for birds such as adult pelicansthat rear chicks with high energy needs and that have highenergy demands of their own. The highest observed pelicanpredation rates in this study were usually at waters within 100km of the nearest colony except at CJ Strike Reservoir, whichwas over 200 km from the nearest colony yet still receivedrelatively heavy predation pressure by pelicans in some years.
The maximum recorded distance, of which we are aware, thatAmerican white pelicans can travel one way from colonies toforaging areas is 305 km (Johnson and Sloan 1978), suggest-ing that nearly all of the reservoirs and ponds in southernIdaho are subject to pelican predation. The maximum distanceof travel we observed was 248 km, but in a concurrent relatedstudy we also recovered, at the Lake Walcott colony, a PIT tagimplanted into a Yellowstone Cutthroat Trout at Henrys Lake,278 km away (K.A.M., unpublished data).
Most hatchery catchable trout fisheries in southern Idahoare within the foraging range of pelicans nesting at coloniesother than Lake Walcott and Blackfoot Reservoir. Pelicansfrom Gunnison Island at the Great Salt Lake are particularlyconcerning from a fisheries management perspective due tothe large number of pelicans nesting there (8,000 nesting pairsin 2000: King and Anderson 2005) and their close proximityto southern Idaho fisheries. However, we searched GunnisonIsland in October 2014 and found only 11 PIT tags from fishstocked in three of our study waters (up to 231 km away;Table 1). We also searched Molly Island and found 20 PITtags, but none were from hatchery catchable trout; rather, theywere all from Yellowstone Cutthroat Trout implanted with tagsat Henrys Lake (97 km away). Finally, we searched for PITtags at the Island Park Reservoir colony and found one PIT tagfrom a hatchery catchable trout that was stocked in LakeWalcott in 2014. Taken collectively, the number of pelican-consumed PIT tags recovered at the Lake Walcott andBlackfoot Reservoir colonies (n = 383), compared with thosecolonies at Gunnison Island, Molly Island, and Island ParkReservoir (n = 12), suggests that little of the pelican predation
0.0
0.2
0.4
0.6
0.8
0 100 200 300
Fe
d t
ag
re
co
ve
ry
effic
ien
cy
Distance to nearest colony (km)
y = 0.7952e-0.019x
R² = 0.80
P < 0.001
FIGURE 2. Relationship between the distance of study waters from thenearest American white pelican colony and the recovery efficiency (at thenearest colony) of PIT tags implanted in hatchery catchable Rainbow Troutand fed directly to pelicans at that study water. The line and equation depict anexponential relationship fitted to the data.
TABLE 3. Summary of feeding events for American white pelican at various southern Idaho waters, and subsequent estimates of tag recovery efficiency.
PIT-tagged fish fed to pelicans
Water body YearDistance to nearestpelican colony (km) Number fed
Number recoveredat nearest colony
Fed tagrecovery efficiency
Lake Walcott 2013 0 91 44 0.48Lake Walcott 2014 0 81 53 0.65Chesterfield Reservoir 2013 27 80 19 0.24American Falls Reservoir 2013 56 101 9 0.09American Falls Reservoir 2014 56 83 12 0.14Riley Creek Pond 2012 118 64 16 0.25Riley Creek Pond 2013 118 39 24 0.62Riley Creek Pond 2014 118 10 2 0.20CJ Strike Reservoir 2012 201 100 6 0.06CJ Strike Reservoir 2013 201 100 2 0.02CJ Strike Reservoir 2014 201 95 2 0.02Cascade Reservoir 2012 304 104 0 0.00Cascade Reservoir 2013 304 125 0 0.00
Total 1,073 189
302 MEYER ET AL.
Dow
nloa
ded
by [
Nat
iona
l Cen
tre
for
Ani
mal
Hea
lth]
at 1
2:17
04
Apr
il 20
16

occurring in hatchery trout fisheries in southern Idaho stemsfrom pelicans breeding at colonies other than Lake Walcottand Blackfoot Reservoir. This appears so even after factoringin the decline in tag recovery efficiency we observed at greaterdistances from pelican colonies. Predation from pelicans nest-ing outside of southern Idaho reduces tag deposition rates atLake Walcott and Blackfoot Reservoir, but because our studydesign accounted for off-colony deposition, our pelican pre-dation estimates incorporated all pelican predation that wasoccurring, regardless of the origin of any particular bird.
Several of our estimates of total pelican predation mayhave been biased low. For example, for 4 of our 19 pelicanpredation estimates, we assumed that pelicans and cormorantswere equally successful at foraging on hatchery catchabletrout, and that their energetic demands were equivalent.While the relative foraging success of pelicans and cormorantson hatchery catchable trout is unknown, energetic demands arefour to eight times higher for pelicans (Hall 1925; Fergusonet al. 2011) than for cormorants (Hatch and Weseloh 1999;
Seefelt and Gillingham 2008). By apportioning tags basedsolely on bird abundance without adjusting for differingenergy requirements, we likely underestimated pelican preda-tion (and consequently overestimated cormorant predation)unless cormorants were four to eight times more successfulforagers on our stocked fish.
A limitation to our approach was, if a study water exceededthe foraging range of breeding pelicans, then there would beno chance of recovering a tag at the colony, and pelicanpredation would consequently be estimated to be zero regard-less of whether any hatchery catchable trout were actuallyeaten by a pelican. For example, at Cascade Reservoir, weestimated that pelican predation was zero in 2012 and 2013because no PIT tags were recovered at the Lake Walcottcolony. However, at 304 km from Lake Walcott, CascadeReservoir may indeed have been outside the foraging rangeof pelicans nesting at Lake Walcott (Johnson and Sloan 1978;Trottier et al. 1980; O’Malley and Evans 1982). Nevertheless,pelicans are generally quite abundant at Cascade Reservoir,
TABLE 4. Number of PIT-tags implanted in catchable trout stocked in study waters that were recovered at colonies and known or assumed to have beenconsumed by pelicans; resulting estimates and CIs of pelican predation (i.e., proportion consumed) and angler catch (i.e., proportion caught) are also shown.
Water body YearDistance to
nearest colony (km)
PIT-tagged trout Pelican predation Angler catch
Initially stockedRecovered atnearest colony Estimate 90% CI Estimate 90% CI
Waters outside foraging range of cormorantsAmerican Falls Reservoir 2013 56 396 11 0.31 0.22 0.00American Falls Reservoir 2014 56 398 17 0.30 0.17 0.07 0.03Glendale Reservoir 2013 83 399 0 0.00 0.25 0.07Foster Reservoir 2013 84 293 0 0.00 0.30 0.07Filer Pond 2012 95 100 3 0.23a 0.68 0.18Magic Reservoir 2014 111 449 4 0.09a 0.06 0.04Riley Creek Pond 2012 118 100 2 0.08 0.09 0.82 0.20Riley Creek Pond 2013 118 100 4 0.07 0.05 0.06 0.07Riley Creek Pond 2014 118 99 3 0.15 0.16 0.77 0.20CJ Strike Reservoir 2012 201 399 1 0.04 0.07 0.32 0.07CJ Strike Reservoir 2013 201 400 2 0.25 0.32 0.09 0.05CJ Strike Reservoir 2014 201 400 4 0.48 0.67 0.14 0.05Cascade Reservoir 2012 304 393 0 0.00 0.02 0.02Cascade Reservoir 2013 304 450 0 0.00 0.09 0.03
Waters within foraging range of cormorantsLake Walcott 2013 0 397 65b 0.34 0.09 0.00Lake Walcott 2014 0 208 41b 0.30 0.09 0.04 0.03Chesterfield Reservoir 2013 27 385 5b 0.05 0.04 0.02 0.02Rupert Gun Club Pond 2013 32 99 16b 0.37a 0.00Freedom Park Pond 2013 32 100 16b 0.37a 0.31 0.16
Total 5,565 194
aPelican predation estimate not based on pelican-fed tags but rather on equation from Figure 2; CIs were not calculated for these estimates.bPIT tags assigned based on results presented in Table 2.
PREDATION BY PELICANS AND CORMORANTS ON HATCHERY TROUT 303
Dow
nloa
ded
by [
Nat
iona
l Cen
tre
for
Ani
mal
Hea
lth]
at 1
2:17
04
Apr
il 20
16

and an average of 327 and a maximum of 989 pelicans havebeen counted by numerous ground surveys conducted betweenMay and August 2013; similar numbers were present in 2012.Although pelican predation on catchable trout stocked in
Cascade Reservoir in 2012 and 2013 may indeed have beenzero, the large number of pelicans inhabiting this water sug-gests otherwise. We included Cascade Reservoir in our studyprecisely because it was at or beyond the foraging limit ofpelicans from the Lake Walcott colony; if it exceeded that
TABLE 5. Number of PIT tags implanted in catchable Rainbow Trout stocked in study waters that were recovered at colonies or cormorant loafing and roostingareas and were known or assumed to have been consumed by cormorants; resulting estimates of cormorant predation are also shown.
Hatchery-trout stockingwater
PIT tag recoverylocation Year
Distanceto
nearestcolony(km)
Numberof PIT-taggedfish
stocked
Number of PIT tagsrecovered
Cormorant predationestimates
At nearestcolonyand
assigned tocormorants
At cormorantloafing androosting
areas wherefish werestocked
Assuming100%tag-
recoveryrate
Assumingequivalenttag-recoveryrates by
distance forpelicans andcormorants
Lake Walcott Lake Walcott colony 2013 0 397 17 0.04 0.05Lake Walcott Lake Walcott colony 2014 0 208 22 0.11 0.13ChesterfieldReservoir
Blackfoot colonyand ChesterfieldReservoir
2013 27 385 96 52 0.38 0.69
Rupert GunClub Pond
Lake Walcott colony 2013 32 99 2 0.02 0.05
Freedom ParkPond
Lake Walcott colony 2013 32 100 3 0.03 0.07
GlendaleReservoir
Glendale Reservoir 2013 83 399 0 20 0.05 0.06
FosterReservoir
Foster Reservoir 2013 84 293 0 99 0.34 0.42
0.0
0.2
0.4
0.6
0 100 200 300
Pe
lica
n p
re
da
tio
n
Distance to nearest colony (km)
y = 0.250e-0.013x
R² = 0.26
P = 0.03
FIGURE 3. Relationship between the distance of study waters to the nearestAmerican white pelican colony and the pelican predation rate on catchableRainbow Trout stocked at that water. Predation rates for the waters labeledwith an “×” were predicted (rather than estimated directly) based on therelationship in Figure 2. The line and equation depict an exponential relation-ship fitted to the data.
0.0
0.2
0.4
0.6
0.8
1.0
0.0 0.2 0.4 0.6
An
gle
r c
atch
Pelican predation
y = 0.167e-7.425x
R² = 0.15
P = 0.10
FIGURE 4. Relationship between estimates of American white pelican pre-dation and angler catch of catchable Rainbow Trout stocked in southern Idahostudy waters. Predation rates for the waters labeled with an “×” were predicted(rather than estimated directly) based on the relationship in Figure 2. The lineand equation depict an exponential relationship fitted to the data.
304 MEYER ET AL.
Dow
nloa
ded
by [
Nat
iona
l Cen
tre
for
Ani
mal
Hea
lth]
at 1
2:17
04
Apr
il 20
16
limit, then our study design incorrectly resulted in an estimateof zero predation by pelicans, unless nonbreeding pelicanscompletely avoided consumption of hatchery catchable trout.
Compared with our estimates of total pelican predationgenerated for 19 fish-stocking events, the estimates of mini-mum cormorant predation we produced for 7 of the 19stocking events were less rigorous. For some of the cormor-ant predation estimates, we assumed that cormorants andpelicans deposited PIT tags at colonies at a rate commensu-rate with their abundance, but this approach has otherassumptions associated with it. One was that energeticrequirements were equivalent between birds, though, asmentioned above, it has been well established that pelicandiets greatly exceed cormorant diets in volume, and this mayhave led to overestimating cormorant predation (and under-estimating pelican predation) at waters < 50 km from theLake Walcott colony. Another assumption was that cormor-ants and pelicans exerted equal predation effort on and hadequal capture efficiency of hatchery catchable trout. The factthat catchable trout are quite surface oriented after stockingmakes them vulnerable to both birds, but if the diving abilityof cormorants allowed them to target hatchery catchabletrout more effectively in the months that followed the stock-ing events, our tag assignment approach may have led tounderestimating cormorant predation (and overestimatingpelican predation) for some waters. Expanding our estimatesof minimum cormorant predation to total cormorant preda-tion required a final assumption that tag recovery efficien-cies were equivalent for pelicans and cormorants, when inreality tag recovery efficiencies for cormorants wereunknown, and the likelihood of equal tag recovery efficiencycurves between pelicans and cormorants is probably low(Hostetter et al. 2015). Despite these weaknesses, the
similarity between tag assignments under a variety ofapproaches (Table 2) suggests that these assumptions didnot lead to substantial biases in pelican or cormorant preda-tion estimates for waters near the Lake Walcott colony. Itwas surprising that estimates of minimum cormorant preda-tion exceeded total pelican predation in three of seveninstances, suggesting that where cormorants are abundant,their impact on catchable trout stocked in southern Idahowaters often exceeds that of pelicans. In the North PlatteRiver of Wyoming, cormorants and pelicans ate an estimated80% of the subcatchable-sized trout (10–16 cm long)stocked during the summer, nearly all of which was attrib-uted to cormorants (Derby and Lovvorn 1997).
We recovered only a fraction of the tags we fed directly topelicans, which highlights the importance of correcting preda-tion estimates for fish consumed by nesting avian predatorsbut deposited off-colony. Our average tag recovery efficiencyof 21% is slightly higher than several recent avian predationstudies with similar direct-feeding study designs, all of whichfound that recovery of tags fed directly to birds was less than10% (Osterback et al. 2013; Scoppettone et al. 2014; Teuscheret al. 2015). Hostetter et al. (2015) directly fed PIT-taggedhatchery trout to Caspian terns Hydroprogne caspia, double-crested cormorants, and California gulls Larus californicusand found tag deposition rates on nearby colonies of 71, 51,and 15%, respectively, but most of their feeding trials wereconducted on birds while they were on or immediately adja-cent to the colonies, which likely elevated their tag depositionrates greatly.
A simple explanation for the exponential decline in tagrecovery efficiency at greater distances from the pelican colo-nies is that the increased energy demand of foraging at greaterdistance from the colony requires a proportional increase infood consumption to meet adult metabolism needs rather thanfor chick feeding, which would likely reduce tag depositionrates at the colonies. Also, pelicans that forage at watersfurther from colonies may be more likely to be nonbreeders,or as mentioned above, they may be breeding at other colo-nies, both of which would reduce tag deposition rates at thecolonies we studied. Regardless of the causative mechanism,the strength of the relationship between tag recovery effi-ciency and distance from colonies allowed us to estimatetotal pelican predation at waters where direct feeding of peli-cans was not conducted due to time constraints during ourstudy or because pelican abundance was too low or too vari-able to create effective direct-feeding conditions. Futureefforts to effectively feed cormorants would not only allowminimum cormorant predation estimates to be converted tototal predation estimates, but might also allow predictions oftotal cormorant predation at waters where direct feeding wasnot conducted.
For several reasons we deem it unlikely that predatory birdsother than pelicans and cormorants were responsible for tagsthat were recovered at these colonies. First, as we have already
0.00
0.10
0.20
0.30
0.40
0.50
Low predation High predation
Pre
da
tio
n o
r c
atch
ra
te
s (
±9
0%
CIs
)Pelican predation Angler catch
FIGURE 5. Mean rates (±90% CI) of American white pelican predation andangler catch of catchable Rainbow Trout stocked in southern Idaho watersgrouped into stocking events where pelican predation was either high (i.e.,≥25%) or low (<25%).
PREDATION BY PELICANS AND CORMORANTS ON HATCHERY TROUT 305
Dow
nloa
ded
by [
Nat
iona
l Cen
tre
for
Ani
mal
Hea
lth]
at 1
2:17
04
Apr
il 20
16

pointed out, for most of our predation estimates, pelicans werethe only avian predator capable of foraging at the distanceneeded to consume stocked fish and subsequently transportPIT tags to the colonies. Second, although great blue heronsArdea herodias were present at the Lake Walcott andBlackfoot Reservoir colonies, their abundance was a fractionof the abundance of pelicans and cormorants at both colonies,and their maximum foraging distance from colonies has beenestimated to be only about 15 km (Parris and Grau 1979;Thompson 1979; Dowd and Flake 1985), precluding them asa meaningful source of predation that was unaccounted for.Third, although ring-billed gulls L. delawarensis andCalifornia gulls are also common on both colonies, the fora-ging range for most gulls is generally less than 25 km (Fasolaand Bogliani 1990; Belant et al. 1998), they generally have anonfish diet (York et al. 2000), and the size of catchable troutwe stocked (247 mm on average) is likely too large for thesegulls to effectively consume at a meaningful level, all ofwhich precludes them from being an appreciable source ofpredation as well.
The amount of pelican and cormorant predation that isoccurring on catchable Rainbow Trout stocked in somesouthern Idaho waters as demonstrated in this study, aswell as the low level of angler catch associated with manyof those stocking events, begs the question of whether some-thing can or should be done to either reduce predation orincrease angler catch. Considering that IDFG annuallystocks about 1.8 million hatchery catchable trout state-wideat a cost of about US$2.5 million, maximizing angler catchof these fish by any means possible (including reducingavian predation) is important. In terms of stocking strategies,Derby and Lovvorn (1997) suggest that altering the timingof stocking or the size of fish at release may reduce avianpredation. Indeed, most stocking of catchable trout in south-ern Idaho occurs from April to June, which closely coincideswith peak food requirements for colonial nesting avian pre-dators. However, this also closely coincides with peak anglereffort in southern Idaho fisheries, some of which are largelyor entirely supported by stocking catchable fish. Thus, whilestocking at a later date may reduce avian predation, it mayalso reduce angler catch even further. Moreover, while largerfish (e.g., >350 mm in length) would have a reduced vulner-ability to pelicans and cormorants because of their increasedswimming speed capacity, the added costs associated withraising catchable fish to such a large size for stocking mayeconomically preclude such a strategy. In the BlackfootRiver drainage, an extensive hazing program to reduce peli-can nesting success has been undertaken by IDFG in recentyears to help preserve a wild, native population ofYellowstone Cutthroat Trout that has been diminished bypelican predation (Teuscher and Schill 2010; Teuscheret al. 2015). However, hazing strategizes are not logisticallyfeasible at the scale that would be required to protect catch-able trout from avian predation in hatchery-trout fisheries in
southern Idaho. A more controversial strategy would be tomeasurably reduce the numbers of pelicans and cormorantsin an area using habitat alteration and/or lethal control,including lethal take as well as egg oiling (to reduce hatch-ing survival). Such strategies have been considered andsometimes implemented for pelicans (Mwema et al. 2010;Teuscher et al. 2015) and cormorants (Belant et al. 2000;Glahn et al. 2000). An alternative strategy is the massiveefforts currently underway on the Columbia River to reducepredation by cormorants and Caspian terns on juvenile ana-dromous salmonids by relocating entire colonies to areasoutside of the Columbia River basin (USFWS 2005; NMFS2010; Lyons et al. 2011). Advantages and disadvantages ofeach management action must be considered in light of thecurrent status of cormorants and pelicans in North Americaand their cumulative impacts on economically importantfisheries that anglers and policymakers value.
ACKNOWLEDGMENTSWe thank numerous individuals for their invaluable help in
this project, especially E. Larsen, L. Mamer, D. Daw, T.Lamansky, J. Cassinelli, J. Graham, T. Gibson, and R.Schiferl. M. Corsi and J. Messner provided earlier reviewsof the manuscript. Funding for this work was largely providedby anglers and boaters through their purchase of Idaho fishinglicenses, tags, and permits, and from federal excise taxes onfishing equipment and boat fuel through the Sport FishRestoration Program.
REFERENCESAcolas, M. L., J. M. Roussel, J. M. Lebel, and J. L. Bagliniere. 2007.
Laboratory experiment on survival, growth and tag retention followingPIT injection into the body cavity of juvenile Brown Trout (Salmo trutta).Fisheries Research 86:280–284.
Adkins, J. Y., D. D. Roby, D. E. Lyons, K. N. Courtot, K. Collis, H. R. Carter,W. D. Shuford, and P. J. Capitolo. 2014. Recent population size, trends,and limiting factors for the double-crested cormorant in western NorthAmerica. Journal of Wildlife Management 78:1131–1142.
Anderson, J. G. T. 1991. Foraging behavior of the American white pelican(Pelecanus erythrorhyncos) in western Nevada. Colonial Waterbirds14:166–172.
Barnes, M. E., G. Simpson, and D. J. Durben. 2009. Post-stocking harvest ofcatchable-sized Rainbow Trout enhanced by dietary supplementation witha fully fermented commercial yeast culture during hatchery rearing. NorthAmerican Journal of Fisheries Management 29:1287–1295.
Belant, J. L., S. K. Ickes, and T. W. Seamans. 1998. Importance of landfills tourban-nesting herring and ring-billed gulls. Landscape and UrbanPlanning 43:11–19.
Belant, J. L., L. A. Tyson, and P. A. Mastrangelo. 2000. Effects of lethalcontrol at aquaculture facilities on populations of piscivorous birds.Wildlife Society Bulletin 2000:379–384.
Berejikian, B. A. 1995. The effects of hatchery and wild ancestry and experi-ence on the relative ability of steelhead trout fry Oncorhynchus mykiss toavoid a benthic predator. Canadian Journal of Fisheries and AquaticSciences 52:2476–2482.
Bugajski, A., M. W. Reudink, J. L. Doucette, S. E. Franks, B. Wissel, and C.M. Somers. 2012. The complexity of cormorants: stable isotopes reveal
306 MEYER ET AL.
Dow
nloa
ded
by [
Nat
iona
l Cen
tre
for
Ani
mal
Hea
lth]
at 1
2:17
04
Apr
il 20
16

multiple prey sources and feeding site switching. Canadian Journal ofFisheries and Aquatic Sciences 70:271–279.
Burnett, J. A., N. H. Ringler, B. F. Lantry, and J. H. Johnson. 2002. Double-crested cormorant predation on yellow perch in the eastern basin of LakeOntario. Journal of Great Lakes Research 28:202–211.
Cohen, J. 1990. Things I have learned (so far). American Psychologist45:1304–1312.
Custer, T. W., and C. Bunck. 1992. Feeding flights of breeding double-crestedcormorants at two Wisconsin colonies. Journal of Field Ornithology63:203–211.
Davison, W. 1997. The effects of exercise training on teleost fish, a review ofrecent literature. Comparative Biochemistry and Physiology 117A:67–75.
Derby, C. E., and J. R. Lovvorn. 1997. Predation on fish by cormorants andpelicans in a cold-water river: a field and modeling study. CanadianJournal of Fisheries and Aquatic Sciences 50:1480–1493.
Dorr, B. S., L. W. Burger, S. C. Barras, and K. C. Godwin. 2012. Economicimpact of double-crested cormorant, Phalacrocorax auritus, depredationon Channel Catfish, Ictalurus punctatus, aquaculture in Mississippi, USA.Journal of the World Aquaculture Society 43:502–513.
Dowd, E. M., and L. D. Flake. 1985. Foraging habitats and movements ofnesting great blue herons in a prairie river ecosystem, South Dakota.Journal of Field Ornithology 1985:379–387.
Evans, A. F., N. J. Hostetter, D. D. Roby, K. Collis, D. E. Lyons, B. P.Sandford, and R. D. Ledgerwood. 2012. Systemwide evaluation of avianpredation on juvenile salmonids from the Columbia River based onrecoveries of passive integrated transponder tags. Transactions of theAmerican Fisheries Society 141:975–989.
Fasola, M., and G. Bogliani. 1990. Foraging ranges of an assemblage ofMediterranean seabirds. Colonial Waterbirds 1990:72–74.
Ferguson, T. L., B. J. Rude, and D. T. King. 2011. Nutrient utilization and dietpreference of American white pelicans consuming either a mono- or multi-species diet. Waterbirds 34:218–224.
Fielder, D. G. 2008. Examination of factors contributing to the decline of theYellow Perch population and fishery in Les Cheneaux Islands, LakeHuron, with emphasis on the role of double-crested cormorants. Journalof Great Lakes Research 34:506–523.
Findholt, S. L., and S. H. Anderson. 1995. Diet and prey use patterns of theAmerican white pelican (Pelecanus erythrorhynchos) nesting at PathfinderReservoir, Wyoming. Colonial Waterbirds 18:58–68.
Fleiss, J. L. 1981. Statistical methods for rates and proportions, 2nd edition.Wiley, New York.
Glahn, J. F., M. E. Tobin, and B. F. Blackwell, editors. 2000. A science-basedinitiative to manage double-crested cormorant damage to southern aqua-culture. U.S. Department of Agriculture, Animal and Plant HealthInspection Service, Wildlife Services National Wildlife Research Center,Staff Publications Paper 532, Fort Collins, Colorado.
Guy, C. S., H. L. Blankenship, and L. A. Nielsen. 1996. Tagging andmarking. Pages 353–383 in B. R. Murphy and D. W. Willis, editors.Fisheries techniques, 2nd edition. American Fisheries Society, Bethesda,Maryland.
Hall, E. R. 1925. Pelicans versus fishes in Pyramid Lake. Condor 27:147–160.Hatch, J. J., and D. V. Weseloh. 1999. Double-crested cormorant
(Phalacrocorax auritus). Number 441 in A. Poole and F. Gill, editors.The birds of North America. The Birds of North America, Philadelphia.
Hostetter, N. J., A. F. Evans, B. M. Cramer, K. Collis, D. E. Lyons, and D. D.Roby. 2015. Quantifying avian predation on fish populations: integratingpredator-specific deposition probabilities in tag recovery studies.Transactions of the American Fisheries Society 144:410–422.
IDFG (Idaho Department of Fish and Game). 2009. Management of Americanwhite pelicans in Idaho. Idaho Department of Fish and Game, Boise.
Ivey, G. L., and C. P. Herziger. 2006. Intermountain West waterbird conserva-tion plan, version 1.2. A plan associated with the Waterbird Conservationfor the Americas Initiative. U.S. Fish and Wildlife Service, Portland,Oregon.
Johnson, R. F., and N. F. Sloan. 1978. White pelican production and survivalof young at Chase Lake National Wildlife Refuge, North Dakota. WilsonBulletin 90:346––352.
Kaeding, L. R. 2002. Factors influencing the distribution of American whitepelicans foraging on the Yellowstone River, Yellowstone National Park,USA. Waterbirds 25:305–311.
Keith, J. O. 2005. An overview of the American white pelican. Waterbirds28:9–17.
King, D. T., and D. W. Anderson. 2005. Recent population status of theAmerican white pelican: a continental perspective. Waterbirds 28(SpecialPublication 1):48–54.
Knopf, F. L., and R. M. Evans. 2004. American white pelican (Pelecanuserythrorhynchos). In A. Poole, editor. The birds of North America online.Cornell Lab of Ornithology, Ithaca. Available: http://bna.birds.cornell.edu/bna/. (February 2016).
Knopf, F. L., and J. L. Kennedy. 1980. Foraging sites of white pelicans nestingat Pyramid Lake, Nevada. Western Birds 11:175–180.
Koenig, M. K., and K. A. Meyer. 2011. Relative performance of diploid andtriploid catchable Rainbow Trout stocked in Idaho lakes and reservoirs.North American Journal of Fisheries Management 31:605–613.
Lantry, B. F., T. H. Eckert, C. P. Schneider, and J. R. Chrisman. 2002. Therelationship between the abundance of Smallmouth Bass and double-crested cormorants in the eastern basin of Lake Ontario. Journal ofGreat Lakes Research 28:193–201.
Lyons, D. E., D. D. Roby, A. F. Evans, N. J. Hostetter, K. Collis, and S.Sebring. 2011. Benefits to Columbia River anadromous salmonids frompotential reductions in predation by double-crested cormorants nesting atthe East Sand Island colony. Draft report to U.S. Army Corps ofEngineers, Portland District Office, Portland, Oregon.
Matkowski, S. M. D. 1989. Differential susceptibility of three species ofstocked trout to bird predation. North American Journal of FisheriesManagement 9:184–187.
McFadden, J. T. 1961. A population study of the Brook Trout, Salvelinusfontinalis. Wildlife Monographs 7.
Meyer, K. A., F. S. Elle, J. A. Lamansky, E. R. J. M. Mamer, and A. E. Butts.2012. A reward fish tagging study to estimate angler tag reporting rates inIdaho. North American Journal of Fisheries Management 32:696–703.
Meyer, K. A., and D. J. Schill. 2014. Use of a statewide angler tag reportingsystem to estimate rates of exploitation and total mortality for Idaho sportfisheries. North American Journal of Fisheries Management 34:1145–1158.
Modde, T., A. F. Wasowicz, and D. K. Hepworth. 1996. Cormorant and grebepredation on Rainbow Trout stocked in a southern Utah reservoir. NorthAmerican Journal of Fisheries Management 16:388–394.
Murphy, E. C., and J. C. Tracy. 2005. Century-long impacts of increasinghuman water use on numbers and production of the American whitepelican at Pyramid Lake, Nevada. Waterbirds 28(Special Publication1):61–72.
Mwema M. M., M. de Ponte Machado, and P. G. Ryan. 2010. Breedingseabirds at Dassen Island, South Africa: chances of surviving greatwhite pelican predation. Endangered Species Research 9:125–131.
Nielsen, L. A. 1992. Methods of marking fish and shellfish. AmericanFisheries Society, Special Publication 23, Bethesda, Maryland.
NMFS (National Marine Fisheries Service). 2010. Supplemental consultationon remand for operation of the Federal Columbia River Power System(FCRPS), 11 Bureau of Reclamation projects in the Columbia basin andESA section 10(a)(1)(A) permit for juvenile fish transportation program.NMFS, Northwest Region, Seattle.
O’Malley, J. B. E., and R. M. Evans. 1982. Flock formation in white pelicans.Canadian Journal of Zoology 60:1024–1031.
Osterback, A. M. K., D. M. Frechette, A. O. Shelton, S. A. Hayes, M. H.Bond, S. A. Shaffer, and J. W. Moore. 2013. High predation on smallpopulations: avian predation on imperiled salmonids. Ecosphere [onlineserial] 4:article 116.
PREDATION BY PELICANS AND CORMORANTS ON HATCHERY TROUT 307
Dow
nloa
ded
by [
Nat
iona
l Cen
tre
for
Ani
mal
Hea
lth]
at 1
2:17
04
Apr
il 20
16

Parris, R. W., and G. A. Grau. 1979. Feeding sites of great blue herons insouthwestern Lake Erie. Colonial Waterbirds 2:110–113.
Scoppettone, G. G., P. H. Rissler, M. C. Fabes, and D. Withers. 2014.American white pelican predation on Cui-ui in Pyramid Lake, Nevada.North American Journal of Fisheries Management 34:57–67.
Sebring, S. H., M. C. Carper, R. D. Ledgerwood, B. P. Sandford, G. M.Matthews, and A. F. Evans. 2013. Relative vulnerability of PIT-taggedsubyearling fall Chinook Salmon to predation by Caspian terns and dou-ble-crested cormorants in the Columbia River estuary. Transactions of theAmerican Fisheries Society 142:1321–1334.
Seefelt, N. E., and J. C. Gillingham. 2008. Bioenergetics and prey consump-tion of breeding double-crested cormorants (Phalacrocorax auritus) in theBeaver Archipelago, northern Lake Michigan. Journal of Great LakesResearch 34:122–133.
Skiles, T. D. 2008. Nutrients, cormorants, and Rainbow Trout in an UrbanLake, Reno Nevada. Mater’s thesis. University of Nevada, Reno.
Stephens, P. A., S. W. Buskirk, G. D. Hayward, and C. Martinez Del Rio.2005. Information theory and hypothesis testing: a call for pluralism.Journal of Applied Ecology 42:4–12.
Teuscher, D. M., M. T. Green, D. J. Schill, A. F. Brimmer, and R. W. Hillyard.2015. Predation by American white pelicans on Yellowstone CutthroatTrout in the Blackfoot River drainage, Idaho. North American Journal ofFisheries Management 35:454–463.
Teuscher, D. M., and D. J. Schill. 2010. American white pelican predation onYellowstone Cutthroat Trout in the Blackfoot River System, ID. Pages
133–137 in R. F. Carline and C. LoSapio, editors. Wild Trout X: conser-ving wild trout. Wild Trout Symposium, Bozeman, Montana.
Thompson, D. H. 1979. Feeding areas of great blue herons and great egretswithin the floodplain of the upper Mississippi River. Colonial Waterbirds2:202–213.
Trottier, G. C., R. J. Breneman, and N. A. Young. 1980. Status and foragingdistribution of the white pelicans, Prince Albert National Park,Saskatchewan. Canadian Field Naturalist 94:383–390.
USFWS (U.S. Fish and Wildlife Service). 2005. Caspian tern management toreduce predation of juvenile salmonids in the Columbia River estuary:final environmental impact statement. USFWS, Migratory Birds andHabitat Programs, Portland, Oregon.
Wires, L. R., and F. J. Cuthbert. 2006. Historic populations of the double-crested cormorant (Phalacrocorax auritus): implications for conservationand management in the 21st century. Waterbirds 29:9–37.
Yates, F. 1980. Sampling methods for censuses and surveys, 4th edition.Charles Griffin, London.
York, D. L., J. L. Cummings, J. E. Steuber, P. A. Pochop, and C. A. Yoder.2000. Importance of migrating salmon smolt in ring-billed (Larus dela-warensis) and California gull (L. californicus) diets near Priest RapidsDam, Washington. Western North American Naturalist 60:216–220.
Yule, D. L., R. A. Whaley, P. H. Mavrakis, D. D. Miller, and S. A. Flickinger.2000. Use of strain, season of stocking, and size at stocking to improvefisheries for Rainbow Trout in reservoirs with Walleyes. North AmericanJournal of Fisheries Management 20:10–18.
308 MEYER ET AL.
Dow
nloa
ded
by [
Nat
iona
l Cen
tre
for
Ani
mal
Hea
lth]
at 1
2:17
04
Apr
il 20
16