Embed Size (px)
Citation preview
Prachee Mishra
March 11, 2015
PRS Legislative Research Institute for Policy Research Studies
3rd Floor, Gandharva Mahavidyalaya 212, Deen Dayal Upadhyaya Marg New Delhi – 110002
Tel: (011) 2323 4801-02, 4343 4035-36
www.prsindia.org
Railways Budget 2015-16: Detailed Analysis The Minister of Railways, Mr. Suresh Prabhu, presented
the Railways Budget 2015-16 to Parliament on February
26, 2015. In his address, he assessed the performance of
Railways in 2014-15 and laid out his budget proposals
for 2015-16.
This note gives an overview of Railways‟ finances, and
the changes from last year‟s budget to this year‟s
estimates. The note also looks at the investment plan
proposed in the budget speech, issues that have been
identified with regards to investment in Railways, and
highlights some of the proposals for this year.
Key highlights and proposals
Revenue: Total revenue is expected to increase by
15% to Rs 1,88,557 crore over 2014-15 revised
estimates.
Expenditure: Total expenditure is projected to
increase by 11% to Rs 1,63,480 crore over 2014-15
revised estimates.
Surplus: The railways surplus, after dividends, is
expected to increase by 96% to Rs 14,266 crore.
Operating ratio is projected to decrease by 3.3
percentage points to 88.5% in 2015-16.
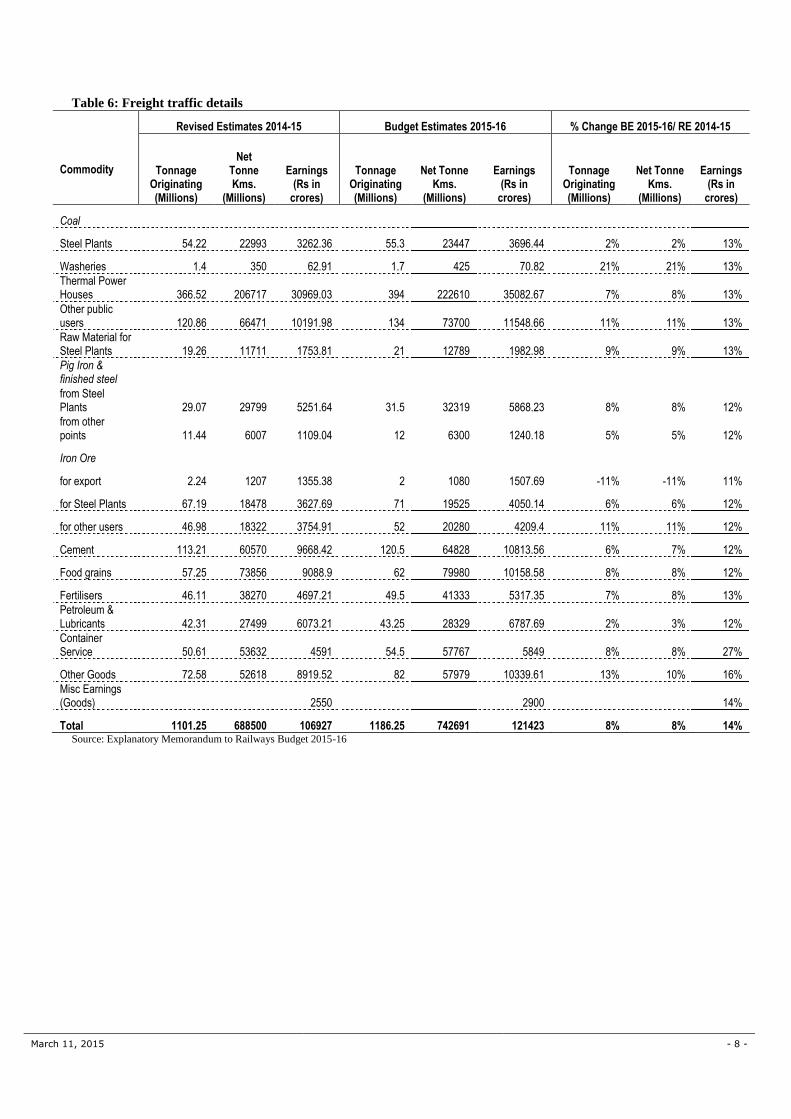
Traffic: Freight traffic is expected to grow by 8%.
Passenger traffic is expected to grow by 6%. Gross
traffic receipts are expected to increase by 15% to Rs
1,83,578 crore.
Plan outlay: The proposed plan outlay for 2015-16 is
Rs 1,00,011 crore which is a 53% increase from
2014-15 budget estimates.
Five year investment plan: The Minister has
proposed an investment of Rs 8.5 lakh crore over the
next five years.
Strategy: Increase investment in Railways to
improve capacity, decongest the network, and in turn
improve efficiency of the system.
Overview of Finances
Budget v/s Revised Estimate 2014-15 (Details in Appendix I)
In the Budget, the Ministry includes revised estimates for
expenditure and revenue for the current year. Some of
the key deviations in the revised estimates compared to
the budget estimates in 2014-15 include:
Total revenue in 2014-15 undershot budget estimates
by Rs 924 crore.
Total expenditure decreased from estimates by Rs
2,178 crore.
After paying dividend of Rs 39 crore, the net surplus
increased by Rs 1,215 crore.
Appropriations to the Railways Capital Fund was
higher by Rs 1,006 crore.
Operating ratio decreased to 91.8% compared to the
Budget Estimate of 92.5%. Operating Ratio is the
ratio of Total Working Expenditure to Gross Traffic
Receipts; a higher ratio indicates a lower ability to
generate a surplus that can be used for capital
investments such as laying new lines, deploying more
coaches etc. Therefore, a smaller surplus (higher
ratio) affects the railway‟s capability to make such
investments.
Budget Estimates 2015-16 (Details in Appendix)
In 2015-16, the railways surplus is expected to increase
by 96% to Rs 14,266 crore thereby decreasing the
operating ratio to 88.5%.
Gross traffic receipts are expected to increase by 15% to
Rs 1,83,578 crore in 2015-16 on account of the hike in
freight rates and falling fuel prices. Total expenditure is
projected to increase by 11% to Rs 1,63,480 crore.
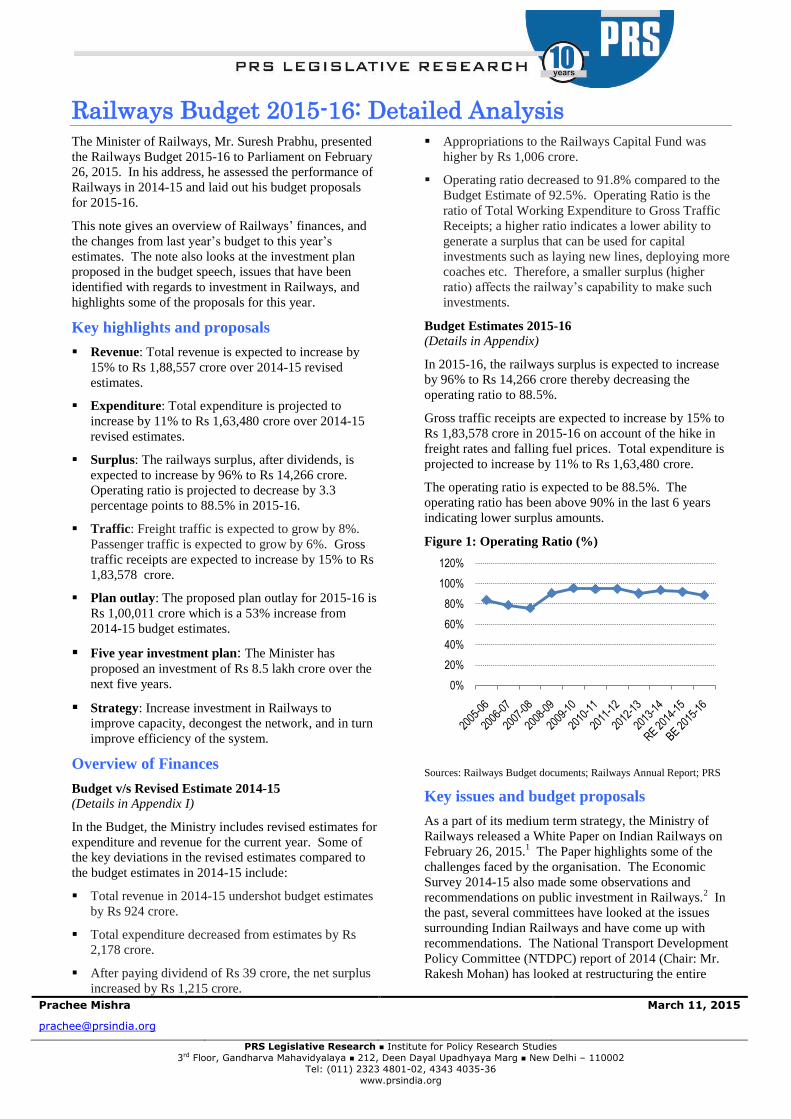
The operating ratio is expected to be 88.5%. The
operating ratio has been above 90% in the last 6 years
indicating lower surplus amounts.
Figure 1: Operating Ratio (%)
Sources: Railways Budget documents; Railways Annual Report; PRS
Key issues and budget proposals
As a part of its medium term strategy, the Ministry of
Railways released a White Paper on Indian Railways on
February 26, 2015.1 The Paper highlights some of the
challenges faced by the organisation. The Economic
Survey 2014-15 also made some observations and
recommendations on public investment in Railways.2 In
the past, several committees have looked at the issues
surrounding Indian Railways and have come up with
recommendations. The National Transport Development
Policy Committee (NTDPC) report of 2014 (Chair: Mr.
Rakesh Mohan) has looked at restructuring the entire
0%
20%
40%
60%
80%
100%
120%

March 11, 2015 - 2 -
railways sector.3 The High Level Safety Review
Committee in 2012 (Chair: Dr. Anil Kakodkar) has
looked at the aspect of safety in Indian Railways and
made certain recommendations.
Key issues and recommendations that have been
addressed in the above reports and related proposals in
the Budget 2015-16 are provided below:
Plan Outlay and investment in Railways
With respect to financing and investments in the
Railways, the following observations and
recommendations have been made:
Indian Railways is primarily financed through Gross
Budgetary Support from the union budget, its own
internal resources (freight and passenger revenue,
leasing of railway land, etc.) and Extra Budgetary
Resources (market borrowings, institutional
financing, etc.). The share of internal resources in
Railways financing has been declining. This has
translated into increasing reliance on borrowings as
well as Gross Budgetary Support, which adversely
impacts the expenditure. Railways also bears a social
service obligation of around Rs 25,000 crore every
year by carrying passenger services below cost.
Recommendations to improve finances include
looking at alternate means of resources for funding of
bankable projects.1
The absence of regulatory mechanisms, no control
over network and tariff, uncertainty of traffic
materialization and delay in processes has hindered
private sector participation in Railways operations. It
has been recommended that Railways should lay
down benchmarks for appraisal, which would be
acceptable to the market, to enable the financing of
relevant projects.1
In the long term, railways must be commercially
viable and public sector support should be restricted
to (i) equity support for investment and (ii) for
funding its universal service obligations. In the
interim, support should be provided through public
sector including assistance via the general budget.
Public sector support should be linked to serious
reform of the structure of Railways, its commercial
practices, rationalisation of tariff and improvements
in technology.2
One of the major issues with Railways revenue has
been the cross-subsidization of passenger fares by
freight.3 Freight traffic is more price sensitive than
passenger traffic. Within passenger traffic, upper
class passengers are less price sensitive than other
passenger classes. Upper class passengers do not
easily switch to airlines as a response to hikes in
railway prices. In freight categories, petroleum
products are more price sensitive than iron ore.2
With regards to investment in Railways, the Minister has
made the following proposals in his speech:
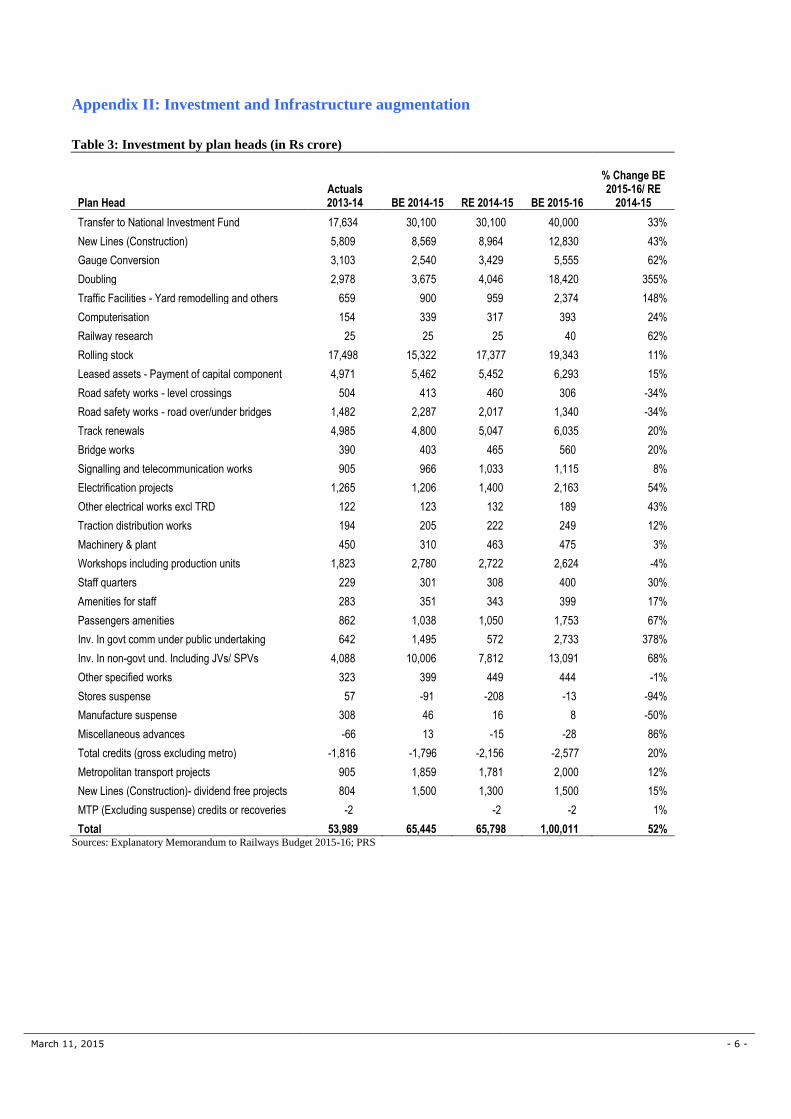
In his budget speech, the Minister has proposed a
plan investment of Rs 1,00,011 crore in 2015-16.
Compared to the estimate for 2014-15, this is a 53%
increase. Table 3 in the annexure shows the details
of the plan investment for 2015-16.
Plan heads for which investments are proposed to be
increased include doubling of tracks (355%), traffic
facilities such as yard modelling (148%), passenger
amenities (67%), and electrification (54%).
Investments in public undertakings have been
increased by 378% and in non-government
undertakings have been increased by 68%.
Investments for road safety works including level
crossings and road over and under bridges
(ROB/RUB) have been decreased by 34%.
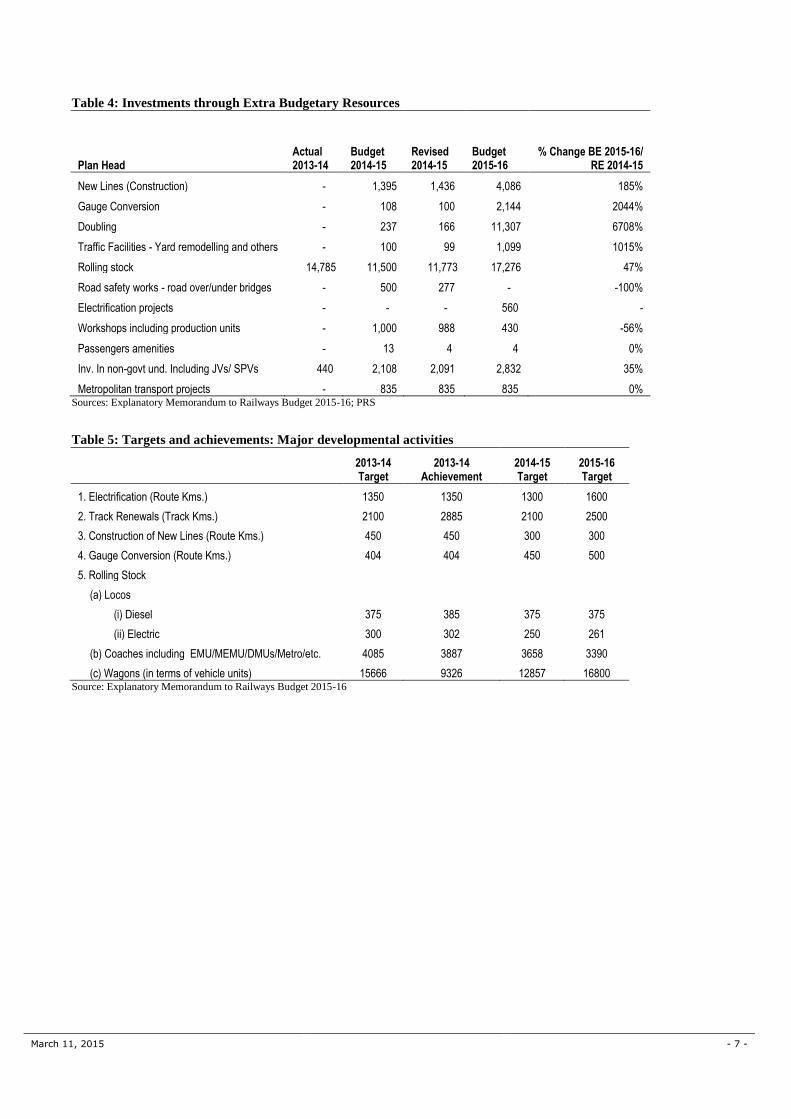
The Minister has also proposed to bring in more
investments through extra budgetary resources
(EBR). Works under doubling, gauge conversion,
new lines and electrification are proposed to be
financed under EBR (Institutional Finance). The
details of EBR (Institutional Finance) are yet to be
worked out, but according to the budget documents it
will be targeted at tapping resources available with
institutions, banks and funding agencies. It will aim
to accelerate completion of capital intensive railway
projects with long gestation periods and also for
capacity augmentation.
In 2014-15, EBR was primarily used to fund rolling
stock (Rs 11,500 crore), non-government
undertakings including joint ventures and special
purpose vehicles (Rs 2,108 crore), and construction
of new lines (Rs 1,395 crore). This year, the Minister
has proposed to extend EBR to doubling of tracks
(Rs 11,307 crore), gauge conversion (Rs 2,144 crore)
and traffic facilities including yard modelling (Rs
1,099 crore) as well. Table 4 in the annexure shows
the details of investments through EBR.
With regards to freight, rates for some commodities
have been increased. The highest increase has been
for urea and grains and pulses at 10% each, followed
by a 6% increase for coal. Other commodities whose
rates have increased include cement (3%), scrap and
pig iron (3%), and groundnut oil (2%). Freight rates
were last increased in June 2014 by 6.5% to help the
Railways meet its annual expenditure. The distance
slabs beyond 1,500 kms are proposed to be reduced
from 250 km to 125 km. These adjustments will be
effective from April 1, 2015.
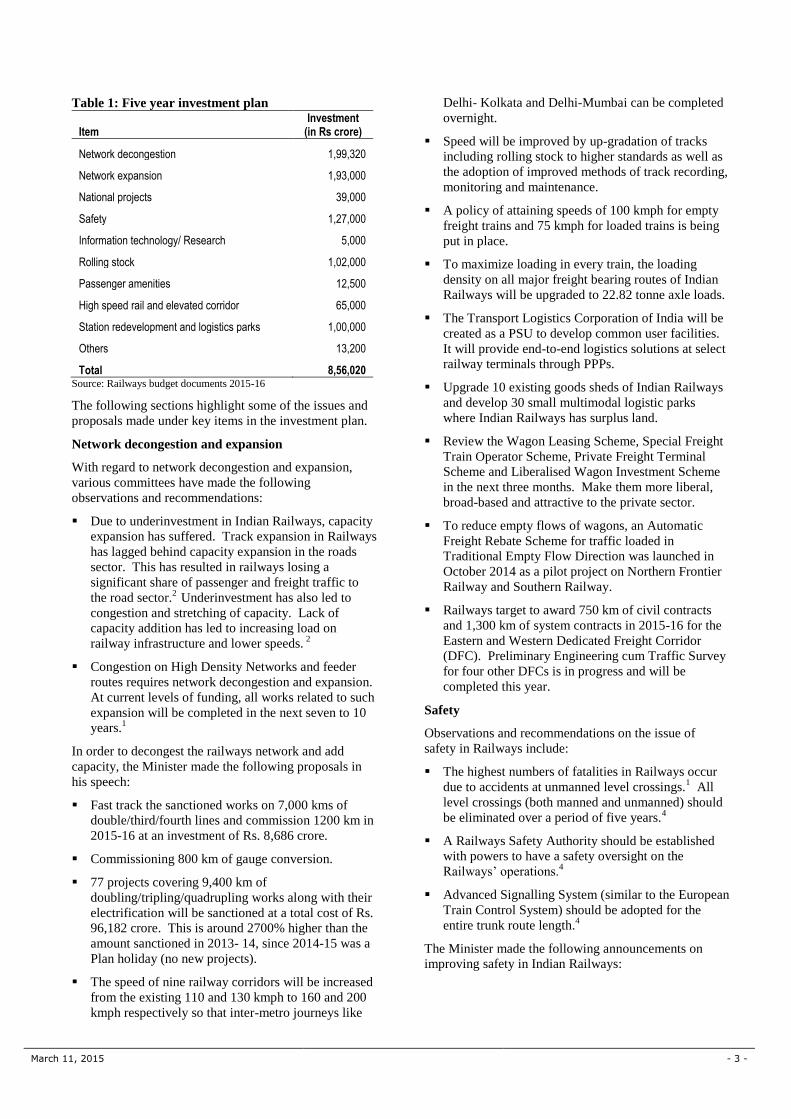
Table 1 on the next page shows the proposed investment
plan over the next five years.
March 11, 2015 - 3 -
Table 1: Five year investment plan
Item Investment
(in Rs crore)
Network decongestion 1,99,320
Network expansion 1,93,000
National projects 39,000
Safety 1,27,000
Information technology/ Research 5,000
Rolling stock 1,02,000
Passenger amenities 12,500
High speed rail and elevated corridor 65,000
Station redevelopment and logistics parks 1,00,000
Others 13,200
Total 8,56,020 Source: Railways budget documents 2015-16
The following sections highlight some of the issues and
proposals made under key items in the investment plan.
Network decongestion and expansion
With regard to network decongestion and expansion,
various committees have made the following
observations and recommendations:
Due to underinvestment in Indian Railways, capacity
expansion has suffered. Track expansion in Railways
has lagged behind capacity expansion in the roads
sector. This has resulted in railways losing a
significant share of passenger and freight traffic to
the road sector.2
Underinvestment has also led to
congestion and stretching of capacity. Lack of
capacity addition has led to increasing load on
railway infrastructure and lower speeds. 2
Congestion on High Density Networks and feeder
routes requires network decongestion and expansion.
At current levels of funding, all works related to such
expansion will be completed in the next seven to 10
years.1
In order to decongest the railways network and add
capacity, the Minister made the following proposals in
his speech:
Fast track the sanctioned works on 7,000 kms of
double/third/fourth lines and commission 1200 km in
2015-16 at an investment of Rs. 8,686 crore.
Commissioning 800 km of gauge conversion.
77 projects covering 9,400 km of
doubling/tripling/quadrupling works along with their
electrification will be sanctioned at a total cost of Rs.
96,182 crore. This is around 2700% higher than the
amount sanctioned in 2013- 14, since 2014-15 was a
Plan holiday (no new projects).
The speed of nine railway corridors will be increased
from the existing 110 and 130 kmph to 160 and 200
kmph respectively so that inter-metro journeys like
Delhi- Kolkata and Delhi-Mumbai can be completed
overnight.
Speed will be improved by up-gradation of tracks
including rolling stock to higher standards as well as
the adoption of improved methods of track recording,
monitoring and maintenance.
A policy of attaining speeds of 100 kmph for empty
freight trains and 75 kmph for loaded trains is being
put in place.
To maximize loading in every train, the loading
density on all major freight bearing routes of Indian
Railways will be upgraded to 22.82 tonne axle loads.
The Transport Logistics Corporation of India will be
created as a PSU to develop common user facilities.
It will provide end-to-end logistics solutions at select
railway terminals through PPPs.
Upgrade 10 existing goods sheds of Indian Railways
and develop 30 small multimodal logistic parks
where Indian Railways has surplus land.
Review the Wagon Leasing Scheme, Special Freight
Train Operator Scheme, Private Freight Terminal
Scheme and Liberalised Wagon Investment Scheme
in the next three months. Make them more liberal,
broad-based and attractive to the private sector.
To reduce empty flows of wagons, an Automatic
Freight Rebate Scheme for traffic loaded in
Traditional Empty Flow Direction was launched in
October 2014 as a pilot project on Northern Frontier
Railway and Southern Railway.
Railways target to award 750 km of civil contracts
and 1,300 km of system contracts in 2015-16 for the
Eastern and Western Dedicated Freight Corridor
(DFC). Preliminary Engineering cum Traffic Survey
for four other DFCs is in progress and will be
completed this year.
Safety
Observations and recommendations on the issue of
safety in Railways include:
The highest numbers of fatalities in Railways occur
due to accidents at unmanned level crossings.1 All
level crossings (both manned and unmanned) should
be eliminated over a period of five years.4
A Railways Safety Authority should be established
with powers to have a safety oversight on the
Railways‟ operations.4
Advanced Signalling System (similar to the European
Train Control System) should be adopted for the
entire trunk route length.4
The Minister made the following announcements on
improving safety in Indian Railways:
March 11, 2015 - 4 -
Preparation of a five-year corporate safety plan by
June 2015, which would indicate annual quantifiable
targets.
All pending recommendations made by High Level
Safety Review Committee headed by Dr. Kakodkar
will be examined by April 2015.
Development of devices to provide audio visual
warning to road users at unmanned railway crossings.
This would be done in collaboration with RDSO,
ISRO and IIT Kanpur.
To facilitate the construction of ROB/RUB, a web
based application has been commissioned with user-
friendly measures for online submission and approval
of drawings within 60 days. An MOU has also been
signed with the Ministry of Road Transport and
Highways in this regard.
970 ROB/RUBs and other safety-related works to
eliminate 3,438 level crossings at a total expense of
Rs. 6,581 crore have been sanctioned for 2015-16.
Passenger amenities
Indian Railways carries about 13 million passengers
every day. The major issues with passenger satisfaction
include long transit times, lack of cleanliness at stations,
and poor reservation facilities.1
With respect to passenger amenities, the following
proposals were made in the budget:
The funding towards passenger amenities has been
increased by 67%.
A new department will be created for keeping
stations and trains clean.
17,000 bio toilets will be constructed to replace
existing toilets. So far 17,388 bio toilets exist.
Designs for bed linen and railway coach interiors will
be improved. Catering services will be improved by
linking it with the IRCTC website.
Leveraging technology by issuing unreserved tickets
on smart phone, providing hand-held terminals to
Travelling Ticket Examiners, introducing a railway
display network at 2,000 stations,
So far, 1052 stations have been identified for
upgradation of Passenger Amenities at Station under
Adarsh station scheme. An additional 200 stations
will be included under this scheme.
Wi-Fi services will be provided at all A1, A and B
category stations.
Capacity in identified trains will be augmented from
the existing 24 coaches to 26 coaches.
Rolling stock
Indian Railways has a total capacity of 10,749
locomotives, with 5,749 diesel ones and 5,000 electric
ones. These are maintained across 71 sheds. Indian
Railways has 63,511 broad gauge coaches of which
9,319 are AC coaches.
Indian Railways has taken up a few initiatives to
improve their rolling stock capacity.1 These include:
Development of wagons with higher pay to tare ratio,
light wagons and special purpose wagons for specific
commodities.
A proposal has also been made to set up new
generation Diesel & Electric Loco Factories in Bihar
under JV/PPP Route.
In his budget speech, the Minister announced developing
partnerships with the private sector to improve last mile
connectivity, expand the fleet of rolling stock, and
modernize station infrastructure.
Station redevelopment and logistics parks
With regards to station redevelopment, the Minister
made the following announcements:
Revamp the station redevelopment policy completely
and simplify processes for faster redevelopment by
inviting open bids from interested parties.
The present stations will be available for
development on “as is where is” basis, to exploit the
space and air rights on concession basis. However,
land will not be sold for such projects. Anyone can
participate by providing the operational requirements
of Railways for running trains at these stations.
Satellite Railway terminals will be developed in
major cities with the twin purpose of decongesting
the city as well as providing service to passengers
residing in suburbs.
A Foreign Rail Technology Cooperation scheme will
be launched to provide technical assistance to railway
authorities on station redevelopment.
1 “Indian Railways – Lifeline of the nation (A white paper)”, Ministry
of Railways, February 26, 2015,
http://www.indianrailways.gov.in/railwayboard/uploads/directorate/finance_budget/Budget_2015-16/White_Paper-_English.pdf. 2 “Putting Public Investment on Track: The Rail Route to Higher Growth”, Economic Survey 2014-15, Ministry of Finance, February
25, 2015, http://indiabudget.nic.in/es2014-15/echapvol1-06.pdf. 3 “Railways”, Sector Reports, Chapter 1, National Transport
Development Policy Committee, February 2014. 4 “Report of High Level Safety Review Committee”, Ministry of
Railways, February 2012.
DISCLAIMER: This document is being furnished to you for your information. You may choose to reproduce or redistribute this report for non-
commercial purposes in part or in full to any other person with due acknowledgement of PRS Legislative Research (“PRS”). The opinions expressed
herein are entirely those of the author(s). PRS makes every effort to use reliable and comprehensive information, but PRS does not represent that the
contents of the report are accurate or complete. PRS is an independent, not-for-profit group. This document has been prepared without regard to the
objectives or opinions of those who may receive it.

March 11, 2015 - 5 -
ANNEXURE
Appendix I: Railways Budget 2015-16 Summary
Table 2: Railways Revenue and Expenditure
Actual (2013-14)
Budget (2014-15)
Revised (2014-15)
% Change RE/BE
(2014-15) Budget
(2015-16)
% Change (2015-16 BE/ 2014-15 RE)
Receipts Passenger - Upper Class 10,820 13,330 12,737 -4% 15,074 18%
Passenger - Second Class 25,712 31,315 30,265 -3% 35,101 16%
Other Coaching 3,679 4,200 4,028 -4% 4,612 14%
Freight 93,906 1,05,770 1,06,927 1% 1,21,423 14%
Sundry 5,721 5,500 5,241 -5% 7,318 40%
Suspense -280 50 50 0% 50 0%
Gross Traffic Receipts 1,39,558 1,60,165 1,59,248 -1% 1,83,578 15%
Miscellaneous 3,656 4,209 4,202 0% 4,979 18%
Total Revenue 1,43,214 1,64,374 1,63,450 -1% 1,88,557 15%
Expenditure Ordinary Working Expenses 97,571 1,12,649 1,08,970 -3% 1,19,410 10%
Appropriation to Depreciation Reserve Fund 7,900 6,850 7,775 14% 7,900 2%
Appropriation to Pension Fund 24,850 28,550 29,225 2% 34,900 19%
Total Working Expenditure 1,30,321 1,48,049 1,45,970 -1% 1,62,210 11%
Miscellaneous 1,144 1,127 1,028 -9% 1,270 24%
Total Expenditure 1,31,465 1,49,176 1,46,998 -1% 1,63,480 11%
Dividend payable to General Revenues 8,009 9,135 9,174 0% 10,811 18%
Net Surplus after payment of Dividend 3,740 6,064 7,278 0 14,266 96%
Operating Ratio 93.6% 92.5% 91.8%
88.5%
Appropriation to Railway Development Fund 3,075 300 1,306 335% 5750 340%
Appropriation to Capital Fund 500 5,663 5,919 5% 7615.71 29%
Appropriation to Debt Service Fund 165 101 54 -47% 900 1573% Source: Budget of Railways Revenue and Expenditure of the Central Government for 2015-16
Explanatory Notes
Other sources of earning
1. Coaching earnings include income from parcels and luggage
2. Sundry earnings represent earnings from lease of railway land, advertisement and publicity etc.
3. Suspense represents unrealized traffic earnings
Performance parameters
4. „Net Surplus after payment of Dividend‟ represents excess of receipts over expenditure after the Dividend liability (payment for
investment in Railway capital) of General Revenues has been paid off
5. „Operating Ratio‟ is the ratio of operating expenses to receipts. A lower ratio indicates higher surplus availability for investments.
Railway Funds
6. Depreciation Reserve Fund – Finances the cost of new assets replacing old assets including the cost of any improved features.
Appropriation to this fund are made on the recommendations of the Railway Convention Committee (RCC)
7. Pension Fund – Finances all pension payments to retired Railway staff
8. Development Fund – Finances expenditure on Passenger and Other Railway Users‟ Amenities Works, Staff Welfare Works, Un-
remunerative operating improvements etc.
9. Capital Fund - Used for capital augmentation. Appropriations to this fund are made only after making necessary appropriations to
other funds.
March 11, 2015 - 6 -
Appendix II: Investment and Infrastructure augmentation
Table 3: Investment by plan heads (in Rs crore)
Plan Head Actuals 2013-14 BE 2014-15 RE 2014-15 BE 2015-16
% Change BE 2015-16/ RE
2014-15
Transfer to National Investment Fund 17,634 30,100 30,100 40,000 33%
New Lines (Construction) 5,809 8,569 8,964 12,830 43%
Gauge Conversion 3,103 2,540 3,429 5,555 62%
Doubling 2,978 3,675 4,046 18,420 355%
Traffic Facilities - Yard remodelling and others 659 900 959 2,374 148%
Computerisation 154 339 317 393 24%
Railway research 25 25 25 40 62%
Rolling stock 17,498 15,322 17,377 19,343 11%
Leased assets - Payment of capital component 4,971 5,462 5,452 6,293 15%
Road safety works - level crossings 504 413 460 306 -34%
Road safety works - road over/under bridges 1,482 2,287 2,017 1,340 -34%
Track renewals 4,985 4,800 5,047 6,035 20%
Bridge works 390 403 465 560 20%
Signalling and telecommunication works 905 966 1,033 1,115 8%
Electrification projects 1,265 1,206 1,400 2,163 54%
Other electrical works excl TRD 122 123 132 189 43%
Traction distribution works 194 205 222 249 12%
Machinery & plant 450 310 463 475 3%
Workshops including production units 1,823 2,780 2,722 2,624 -4%
Staff quarters 229 301 308 400 30%
Amenities for staff 283 351 343 399 17%
Passengers amenities 862 1,038 1,050 1,753 67%
Inv. In govt comm under public undertaking 642 1,495 572 2,733 378%
Inv. In non-govt und. Including JVs/ SPVs 4,088 10,006 7,812 13,091 68%
Other specified works 323 399 449 444 -1%
Stores suspense 57 -91 -208 -13 -94%
Manufacture suspense 308 46 16 8 -50%
Miscellaneous advances -66 13 -15 -28 86%
Total credits (gross excluding metro) -1,816 -1,796 -2,156 -2,577 20%
Metropolitan transport projects 905 1,859 1,781 2,000 12%
New Lines (Construction)- dividend free projects 804 1,500 1,300 1,500 15%
MTP (Excluding suspense) credits or recoveries -2
-2 -2 1%
Total 53,989 65,445 65,798 1,00,011 52% Sources: Explanatory Memorandum to Railways Budget 2015-16; PRS
March 11, 2015 - 7 -
Table 4: Investments through Extra Budgetary Resources
Plan Head Actual 2013-14
Budget 2014-15
Revised 2014-15
Budget 2015-16
% Change BE 2015-16/ RE 2014-15
New Lines (Construction) - 1,395 1,436 4,086 185%
Gauge Conversion - 108 100 2,144 2044%
Doubling - 237 166 11,307 6708%
Traffic Facilities - Yard remodelling and others - 100 99 1,099 1015%
Rolling stock 14,785 11,500 11,773 17,276 47%
Road safety works - road over/under bridges - 500 277 - -100%
Electrification projects - - - 560 -
Workshops including production units - 1,000 988 430 -56%
Passengers amenities - 13 4 4 0%
Inv. In non-govt und. Including JVs/ SPVs 440 2,108 2,091 2,832 35%
Metropolitan transport projects - 835 835 835 0% Sources: Explanatory Memorandum to Railways Budget 2015-16; PRS
Table 5: Targets and achievements: Major developmental activities
2013-14 Target
2013-14 Achievement
2014-15 Target
2015-16 Target
1. Electrification (Route Kms.) 1350 1350 1300 1600
2. Track Renewals (Track Kms.) 2100 2885 2100 2500
3. Construction of New Lines (Route Kms.) 450 450 300 300
4. Gauge Conversion (Route Kms.) 404 404 450 500
5. Rolling Stock
(a) Locos
(i) Diesel 375 385 375 375
(ii) Electric 300 302 250 261
(b) Coaches including EMU/MEMU/DMUs/Metro/etc. 4085 3887 3658 3390
(c) Wagons (in terms of vehicle units) 15666 9326 12857 16800 Source: Explanatory Memorandum to Railways Budget 2015-16
March 11, 2015 - 8 -
Table 6: Freight traffic details
Revised Estimates 2014-15 Budget Estimates 2015-16 % Change BE 2015-16/ RE 2014-15
Commodity Tonnage Originating (Millions)
Net Tonne Kms.
(Millions)
Earnings (Rs in
crores)
Tonnage Originating (Millions)
Net Tonne Kms.
(Millions)
Earnings (Rs in
crores)
Tonnage Originating (Millions)
Net Tonne Kms.
(Millions)
Earnings (Rs in
crores)
Coal
Steel Plants 54.22 22993 3262.36 55.3 23447 3696.44 2% 2% 13%
Washeries 1.4 350 62.91 1.7 425 70.82 21% 21% 13%
Thermal Power Houses 366.52 206717 30969.03 394 222610 35082.67 7% 8% 13%
Other public users 120.86 66471 10191.98 134 73700 11548.66 11% 11% 13%
Raw Material for Steel Plants 19.26 11711 1753.81 21 12789 1982.98 9% 9% 13%
Pig Iron & finished steel
from Steel Plants 29.07 29799 5251.64 31.5 32319 5868.23 8% 8% 12%
from other points 11.44 6007 1109.04 12 6300 1240.18 5% 5% 12%
Iron Ore
for export 2.24 1207 1355.38 2 1080 1507.69 -11% -11% 11%
for Steel Plants 67.19 18478 3627.69 71 19525 4050.14 6% 6% 12%
for other users 46.98 18322 3754.91 52 20280 4209.4 11% 11% 12%
Cement 113.21 60570 9668.42 120.5 64828 10813.56 6% 7% 12%
Food grains 57.25 73856 9088.9 62 79980 10158.58 8% 8% 12%
Fertilisers 46.11 38270 4697.21 49.5 41333 5317.35 7% 8% 13%
Petroleum & Lubricants 42.31 27499 6073.21 43.25 28329 6787.69 2% 3% 12%
Container Service 50.61 53632 4591 54.5 57767 5849 8% 8% 27%
Other Goods 72.58 52618 8919.52 82 57979 10339.61 13% 10% 16%
Misc Earnings (Goods)
2550
2900
14%
Total 1101.25 688500 106927 1186.25 742691 121423 8% 8% 14% Source: Explanatory Memorandum to Railways Budget 2015-16
March 11, 2015 - 9 -
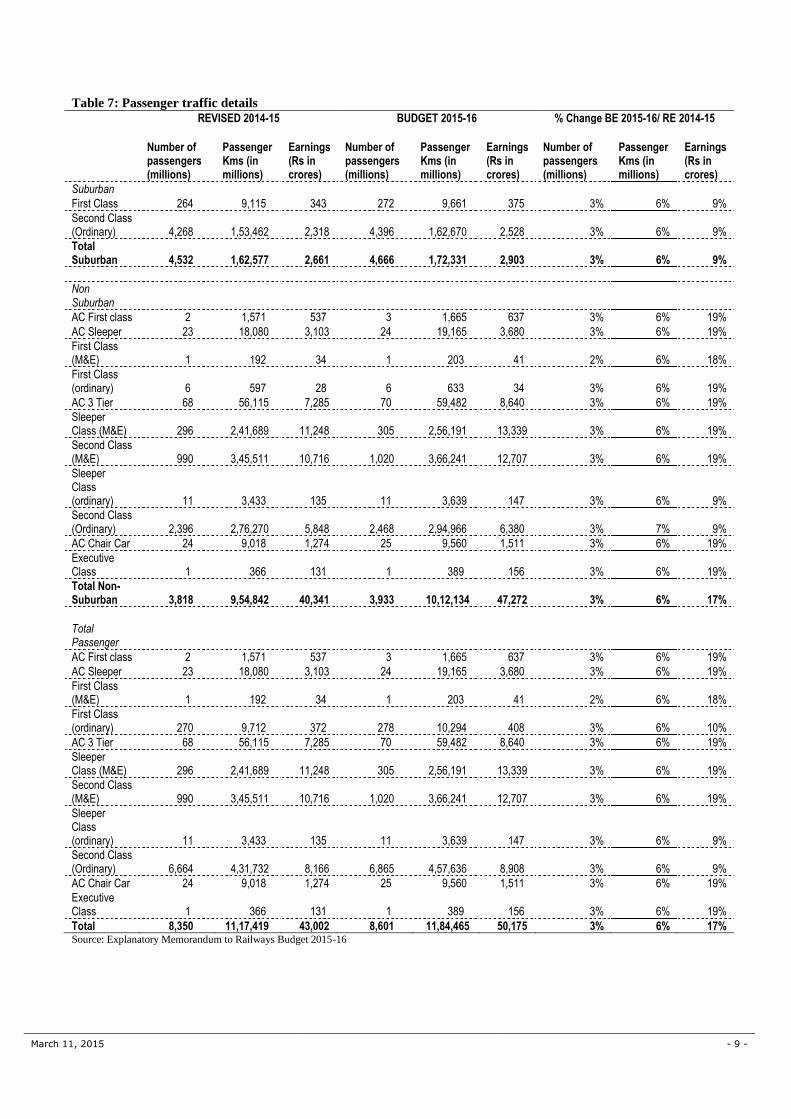
Table 7: Passenger traffic details
REVISED 2014-15 BUDGET 2015-16 % Change BE 2015-16/ RE 2014-15
Number of passengers (millions)
Passenger Kms (in millions)
Earnings (Rs in crores)
Number of passengers (millions)
Passenger Kms (in millions)
Earnings (Rs in crores)
Number of passengers (millions)
Passenger Kms (in millions)
Earnings (Rs in crores)
Suburban First Class 264 9,115 343 272 9,661 375 3% 6% 9%
Second Class (Ordinary) 4,268 1,53,462 2,318 4,396 1,62,670 2,528 3% 6% 9%
Total Suburban 4,532 1,62,577 2,661 4,666 1,72,331 2,903 3% 6% 9%
Non Suburban
AC First class 2 1,571 537 3 1,665 637 3% 6% 19%
AC Sleeper 23 18,080 3,103 24 19,165 3,680 3% 6% 19%
First Class (M&E) 1 192 34 1 203 41 2% 6% 18%
First Class (ordinary) 6 597 28 6 633 34 3% 6% 19%
AC 3 Tier 68 56,115 7,285 70 59,482 8,640 3% 6% 19%
Sleeper Class (M&E) 296 2,41,689 11,248 305 2,56,191 13,339 3% 6% 19%
Second Class (M&E) 990 3,45,511 10,716 1,020 3,66,241 12,707 3% 6% 19%
Sleeper Class (ordinary) 11 3,433 135 11 3,639 147 3% 6% 9%
Second Class (Ordinary) 2,396 2,76,270 5,848 2,468 2,94,966 6,380 3% 7% 9%
AC Chair Car 24 9,018 1,274 25 9,560 1,511 3% 6% 19%
Executive Class 1 366 131 1 389 156 3% 6% 19%
Total Non-Suburban 3,818 9,54,842 40,341 3,933 10,12,134 47,272 3% 6% 17%
Total Passenger
AC First class 2 1,571 537 3 1,665 637 3% 6% 19%
AC Sleeper 23 18,080 3,103 24 19,165 3,680 3% 6% 19%
First Class (M&E) 1 192 34 1 203 41 2% 6% 18%
First Class (ordinary) 270 9,712 372 278 10,294 408 3% 6% 10%
AC 3 Tier 68 56,115 7,285 70 59,482 8,640 3% 6% 19%
Sleeper Class (M&E) 296 2,41,689 11,248 305 2,56,191 13,339 3% 6% 19%
Second Class (M&E) 990 3,45,511 10,716 1,020 3,66,241 12,707 3% 6% 19%
Sleeper Class (ordinary) 11 3,433 135 11 3,639 147 3% 6% 9%
Second Class (Ordinary) 6,664 4,31,732 8,166 6,865 4,57,636 8,908 3% 6% 9%
AC Chair Car 24 9,018 1,274 25 9,560 1,511 3% 6% 19%
Executive Class 1 366 131 1 389 156 3% 6% 19%
Total 8,350 11,17,419 43,002 8,601 11,84,465 50,175 3% 6% 17% Source: Explanatory Memorandum to Railways Budget 2015-16
March 11, 2015 - 10 -
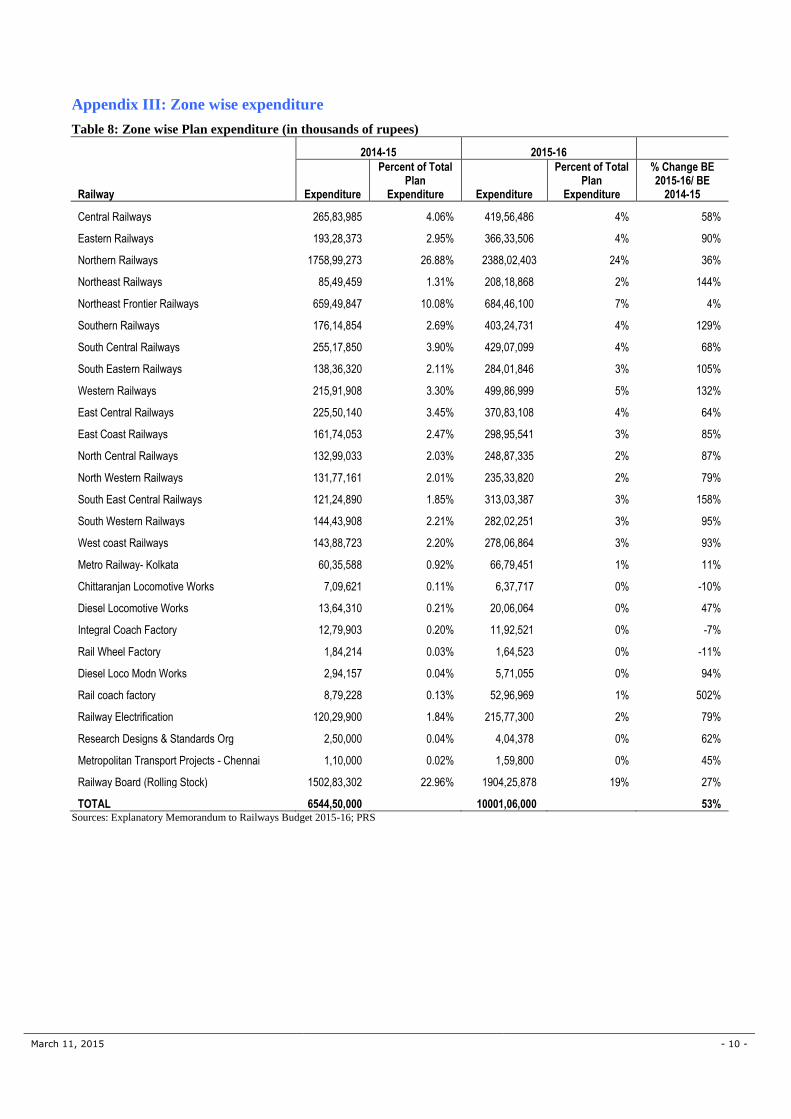
Appendix III: Zone wise expenditure
Table 8: Zone wise Plan expenditure (in thousands of rupees)
2014-15 2015-16
Railway Expenditure
Percent of Total Plan
Expenditure Expenditure
Percent of Total Plan
Expenditure
% Change BE 2015-16/ BE
2014-15
Central Railways 265,83,985 4.06% 419,56,486 4% 58%
Eastern Railways 193,28,373 2.95% 366,33,506 4% 90%
Northern Railways 1758,99,273 26.88% 2388,02,403 24% 36%
Northeast Railways 85,49,459 1.31% 208,18,868 2% 144%
Northeast Frontier Railways 659,49,847 10.08% 684,46,100 7% 4%
Southern Railways 176,14,854 2.69% 403,24,731 4% 129%
South Central Railways 255,17,850 3.90% 429,07,099 4% 68%
South Eastern Railways 138,36,320 2.11% 284,01,846 3% 105%
Western Railways 215,91,908 3.30% 499,86,999 5% 132%
East Central Railways 225,50,140 3.45% 370,83,108 4% 64%
East Coast Railways 161,74,053 2.47% 298,95,541 3% 85%
North Central Railways 132,99,033 2.03% 248,87,335 2% 87%
North Western Railways 131,77,161 2.01% 235,33,820 2% 79%
South East Central Railways 121,24,890 1.85% 313,03,387 3% 158%
South Western Railways 144,43,908 2.21% 282,02,251 3% 95%
West coast Railways 143,88,723 2.20% 278,06,864 3% 93%
Metro Railway- Kolkata 60,35,588 0.92% 66,79,451 1% 11%
Chittaranjan Locomotive Works 7,09,621 0.11% 6,37,717 0% -10%
Diesel Locomotive Works 13,64,310 0.21% 20,06,064 0% 47%
Integral Coach Factory 12,79,903 0.20% 11,92,521 0% -7%
Rail Wheel Factory 1,84,214 0.03% 1,64,523 0% -11%
Diesel Loco Modn Works 2,94,157 0.04% 5,71,055 0% 94%
Rail coach factory 8,79,228 0.13% 52,96,969 1% 502%
Railway Electrification 120,29,900 1.84% 215,77,300 2% 79%
Research Designs & Standards Org 2,50,000 0.04% 4,04,378 0% 62%
Metropolitan Transport Projects - Chennai 1,10,000 0.02% 1,59,800 0% 45%
Railway Board (Rolling Stock) 1502,83,302 22.96% 1904,25,878 19% 27%
TOTAL 6544,50,000
10001,06,000
53% Sources: Explanatory Memorandum to Railways Budget 2015-16; PRS

March 11, 2015 - 11 -
Table 9: Expenditure proposed on Staff welfare (In thousands of Rupees)
2014-15 2015-16
Railway Expenditure Percent of Total
Plan Expenditure Expenditure Percent of Total
Plan Expenditure % Change BE 2015-16/
BE 2014-15
Central Railways 35,28,239 7.56% 41,48,479 8% 18%
Eastern Railways 36,66,346 7.85% 43,16,150 8% 18%
Northern Railways 55,06,441 11.79% 64,64,905 12% 17%
Northeast Railways 17,68,920 3.79% 20,21,618 4% 14%
Northeast Frontier Railways 31,82,610 6.82% 37,50,591 7% 18%
Southern Railways 41,20,283 8.82% 47,13,791 9% 14%
South Central Railways 43,14,070 9.24% 50,97,941 9% 18%
South Eastern Railways 33,03,216 7.07% 35,54,295 6% 8%
Western Railways 37,62,162 8.06% 45,36,806 8% 21%
East Central Railways 24,64,631 5.28% 28,56,303 5% 16%
East Coast Railways 15,92,810 3.41% 19,33,526 4% 21%
North Central Railways 22,97,689 4.92% 27,15,365 5% 18%
North Western Railways 19,25,614 4.12% 23,24,096 4% 21%
South east Central Railways 16,71,333 3.58% 20,12,102 4% 20%
South Western Railways 14,49,914 3.10% 18,55,265 3% 28%
West coast Railways 16,14,915 3.46% 20,08,364 4% 24%
Metro Railway- Kolkata 2,33,112 0.50% 1,50,017 0% -36%
Chittaranjan Locomotive Works 33,578 0.07% 1,16,915 0% 248%
Diesel Locomotive Works 46,792 0.10% 44,100 0% -6%
Integral Coach Factory 92,586 0.20% 1,19,800 0% 29%
Rail Wheel Factory 61,331 0.13% 62,136 0% 1%
Diesel Loco Modn Works 17,746 0.04% 12,000 0% -32%
Rail coach factory 44,013 0.09% 52,100 0% 18%
TOTAL 466,98,351
548,66,665
17% Sources: Explanatory Memorandum to Railways Budget 2015-16; PRS
March 11, 2015 - 12 -
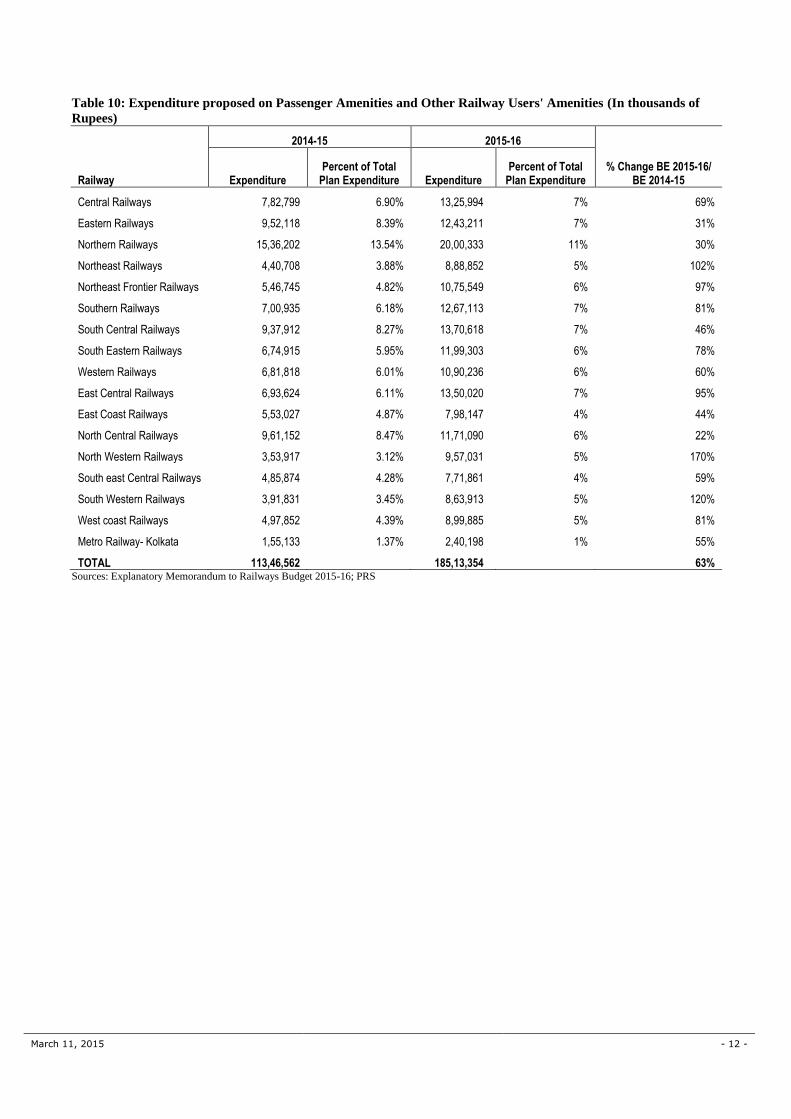
Table 10: Expenditure proposed on Passenger Amenities and Other Railway Users' Amenities (In thousands of
Rupees)
2014-15 2015-16
% Change BE 2015-16/ BE 2014-15 Railway Expenditure
Percent of Total Plan Expenditure Expenditure
Percent of Total Plan Expenditure
Central Railways 7,82,799 6.90% 13,25,994 7% 69%
Eastern Railways 9,52,118 8.39% 12,43,211 7% 31%
Northern Railways 15,36,202 13.54% 20,00,333 11% 30%
Northeast Railways 4,40,708 3.88% 8,88,852 5% 102%
Northeast Frontier Railways 5,46,745 4.82% 10,75,549 6% 97%
Southern Railways 7,00,935 6.18% 12,67,113 7% 81%
South Central Railways 9,37,912 8.27% 13,70,618 7% 46%
South Eastern Railways 6,74,915 5.95% 11,99,303 6% 78%
Western Railways 6,81,818 6.01% 10,90,236 6% 60%
East Central Railways 6,93,624 6.11% 13,50,020 7% 95%
East Coast Railways 5,53,027 4.87% 7,98,147 4% 44%
North Central Railways 9,61,152 8.47% 11,71,090 6% 22%
North Western Railways 3,53,917 3.12% 9,57,031 5% 170%
South east Central Railways 4,85,874 4.28% 7,71,861 4% 59%
South Western Railways 3,91,831 3.45% 8,63,913 5% 120%
West coast Railways 4,97,852 4.39% 8,99,885 5% 81%
Metro Railway- Kolkata 1,55,133 1.37% 2,40,198 1% 55%
TOTAL 113,46,562
185,13,354
63% Sources: Explanatory Memorandum to Railways Budget 2015-16; PRS