Embed Size (px)
Citation preview

UIC16 rue Jean Rey | 75015 ParisTel : +33 (0) 1 44 49 20 20 Fax : +33 (0) 1 44 49 20 29www.uic.org
CER53 Avenue des Arts | 1000 BrusselsTel : +32 (0)2 213 08 70Fax : +32 (0)2 512 52 31www.cer.be
September 2015

ISBN 978-2-7461-2400-4
Warning
No part of this publication may be copied, reproduced or distributed by any means whatsoever, including electronic, except for private and individual use, without the express permission of the International Union of Railways (UIC) and of the Community of European Railway and Infrastructure Companies (CER). The same applies for translation, adaptation or transformation, arrangement or reproduction by any method or procedure whatsoever. The sole exceptions – noting the author’s name and the source – are «analyses and brief quotations justified by the critical, argumentative, educational, scientific or informative nature of the publication into which they are incorporated» (Articles L 122-4 and L122-5 of the French Intellectual Property Code).
© Copyright UIC / CER - Paris, 2015
Published by:UIC - ETF (Railway Technical Publications)
16, rue Jean Rey 75015 Paris - France
Coordination: Andrea Braschi, UIC - Ethem Pekin, CER Content: Matthew Ledbury
Design: Coralie Filippini, UIC-ETF
Photo credit: Fotolia
Dépôt légal September 2015
ISBN 978-2-7461-2400-4

R A I L T R A N S P O R T A N D E N V I R O N M E N T
i
UIC, the International Railway Association founded in 1922, counts 240 members across 5 continents, including railway companies, infrastructure managers & rail-related transport operators & research institutes. UIC’s members represent over 1 million kilometers of tracks, 2,900 billion passenger-km, 10,000 billion tonne-km and a workforce of 7 million railway staff. The UIC mission is to promote rail transport at world level and meet the challenges of mobility and sustainable development.
The UIC Energy Environment & Sustainability (EES) Platform manages 5 expert networks (Energy & CO2, Emissions, Sustainable Mobility, Noise and Sustainable Land Use) and a portfolio of projects focusing on the development of best practice, benchmarking for environmental sustainability and reporting of corporate and social responsibility.
For info www.uic.org
The Community of European Railway and Infrastructure Companies (CER) brings together more than 70 railway undertakings, their national associations as well as infrastructure managers and vehicle leasing companies. The membership is made up of long-established bodies, new entrants and both private and public enterprises, representing 73 % of the rail network length, 80 % of the rail freight business and about 96 % of rail passenger operations in EU, EFTA and EU accession countries. CER represents the interests of its members towards EU policy makers and transport stakeholders, advocating rail as the backbone of a competitive and sustainable transport system in Europe.
For more information, visit www.cer.be or follow us via Twitter at @CER_railways.

FOREwORD
ii
I must thank European rail companies for sharing their environmental performance data with UIC. These data underpin the majority of the figures presented in this publication and lay the foundation for the environmental case for rail transport.
In order to drive continuous improvement, CER and UIC members of the European region have agreed targets and a vision for sustainable mobility in the coming decades. These targets, adopted in 2010 and presented in this publication, have now been updated with increased ambition for greenhouse gas emissions. The targets set at the European level in partnership with CER are fully compatible with those adopted by the UIC global membership and announced at the United Nations Climate Summit in 2014.
This publication provides the evidence to demonstrate why rail is the backbone of sustainable transport.
Jean-Pierre LoubinouxUIC Director-General
iii
Transport, energy, and climate policies can play a very significant role in strengthening Europe’s economic security, its competitiveness and its ability to pursue a robust external policy. Europe needs to move away from imported fossil fuels towards a low-carbon economy while also reaching high efficiency standards. A resilient transport and energy system is crucial to achieving this goal. Rail, as a low-oil and low-carbon transport mode, can make a vital contribution as the backbone of a sustainable transport system for Europe.
The Community of European Railway and Infrastructure Companies (CER) and the International Union of Railways (UIC) have joined forces to compile this booklet. It aims to support decision makers in shaping the future of the European transport system with up-to-date and comprehensive data for all transport modes.
Libor LochmanCER Executive Director

R A I L T R A N S P O R T A N D E N V I R O N M E N T

R A I L T R A N S P O R T A N D E N V I R O N M E N T
1
Table of Contents
1 Climate change ................................................3
2 Energy ............................................................ 11
3 Electricity use ................................................. 19
4 Land use ........................................................23
5 Local air pollution ............................................27
6 Noise ..............................................................33
7 External costs .................................................39
8 Targets and vision ..........................................45
9 European transport: core statistics ................47
10 Glossary .........................................................57
11 References .....................................................59

R A I L T R A N S P O R T A N D E N V I R O N M E N T

R A I L T R A N S P O R T A N D E N V I R O N M E N T
1
3
Climate change
Rail is the most emissions-efficient major mode of transport, and electric trains powered by renewable energy can offer practically carbon-free journeys and transport.
Rail contributes less than 1.5 % of the EU transport sector’s total CO2 emissions even though it has over 8.5 % of total market share.
The European railways will reduce their specific average CO2 emissions from train operation by 40 % by 2020 and by 50 % by 2030 compared to the 1990 base year, measured per passenger-km (passenger service) and tonne-km (freight service).
The European railways will reduce their total CO2 emissions from train operation by 30 % by 2030 and strive towards carbon-free train operation by 2050 in order to provide society with a climate-neutral transport alternative.
Impact of global warmingEvidence for global warming and the challenges caused by its impact contin-ues to grow. In its Fifth Assessment Report in 2013, the Intergovernmental Panel on Climate Change (IPCC) established that warming of the climate system is “unequivocal”, and it is “extremely likely” that human influence has been the dominant cause of warming since the mid-20th century. Continued emissions of greenhouse gases (GHG) will cause further warming it said, adding that “limiting climate change will require substantial and sustained reductions of greenhouse gas emissions.”
There are six gases regulated under the Kyoto Protocol where action is fo-cused: carbon dioxide (CO2), methane (CH4), nitrous oxide (N2O), hydro-fluorocarbons (HFCs), perfluorocarbons (PFCs), and sulphur hexafluoride (SF6). By far the most significant of these is carbon dioxide which represents 82 % of emissions in the EU and 99 % of emissions from transport1.
EU targetsEU policy supports cutting GHG emissions in line with the reductions considered necessary by the IPCC for developed countries, in order to keep the overall increase in average global temperature below 2 ºC. The EU aims to reduce greenhouse gas emissions by 80-95 % by 2050 compared to 1990, and is actively pursuing a global climate agreement at the Paris Climate Change Conference in December 2015.
1. EC 2014a
CLIMATE ChANgE
4
During 2014, the European Commission worked on a 2030 Framework for Climate and Energy Policies Communication to replace the EU’s existing climate and energy policies with more ambitious targets for the post-2020 period. The Commission Communication lists three key goals: a reduction in total domestic GHG emissions of 40 % on the 1990 level by 2030; an EU-level binding target for renewable energy of at least 27 % in total energy consumption; and reducing the EUs energy use by 30 % by 2030.
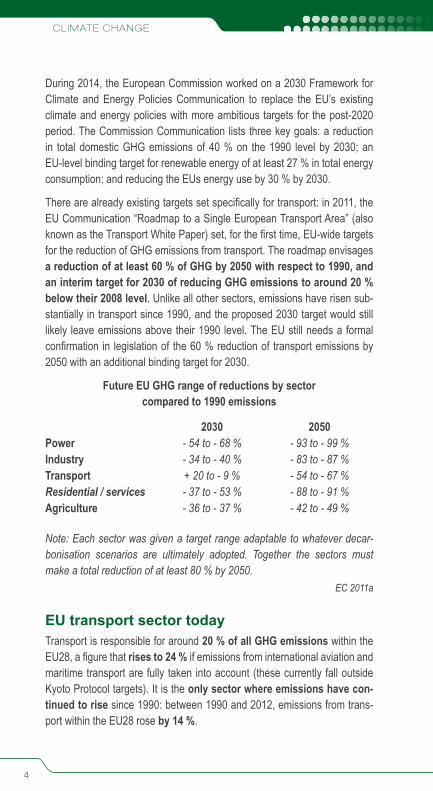
There are already existing targets set specifically for transport: in 2011, the EU Communication “Roadmap to a Single European Transport Area” (also known as the Transport White Paper) set, for the first time, EU-wide targets for the reduction of GHG emissions from transport. The roadmap envisages a reduction of at least 60 % of GHG by 2050 with respect to 1990, and an interim target for 2030 of reducing GHG emissions to around 20 % below their 2008 level. Unlike all other sectors, emissions have risen sub-stantially in transport since 1990, and the proposed 2030 target would still likely leave emissions above their 1990 level. The EU still needs a formal confirmation in legislation of the 60 % reduction of transport emissions by 2050 with an additional binding target for 2030.
Future EU GHG range of reductions by sector compared to 1990 emissions
2030 2050Power - 54 to - 68 % - 93 to - 99 %Industry - 34 to - 40 % - 83 to - 87 %Transport + 20 to - 9 % - 54 to - 67 %Residential / services - 37 to - 53 % - 88 to - 91 %Agriculture - 36 to - 37 % - 42 to - 49 %
Note: Each sector was given a target range adaptable to whatever decar-bonisation scenarios are ultimately adopted. Together the sectors must make a total reduction of at least 80 % by 2050.
EC 2011a
EU transport sector todayTransport is responsible for around 20 % of all GHG emissions within the EU28, a figure that rises to 24 % if emissions from international aviation and maritime transport are fully taken into account (these currently fall outside Kyoto Protocol targets). It is the only sector where emissions have con-tinued to rise since 1990: between 1990 and 2012, emissions from trans-port within the EU28 rose by 14 %.

5
Greenhouse gas emissions by sector in EU28, 2012
Energy Industries
31,0 %
Industry18,8 %
Transport 19,7 %
Commercial/Institutions
3,9 %
Residential 9,4 %
Agriculture, Forestry, Fisheries 12,0 %
Other 5,3 %
Note: percentages exclude LULUCF (Land Use, Land Use Change and Forestry) emissions and international bunkers (international traffic departing from the EU)
EC 2014A
EU27 share of CO2 emissions from fuel combustion by sector, 2011
Electricity and Heat 38,6 %
Manufacturing14,3 %
Residential 10,1 % Other 4,5 %
Agriculture, Forestry and Fishing 1,5 %
Road 70,9 %
Navigation 14,4 %
Aviation 12,6 %
Rail 1,5 %Other Transport
0,6 %
Transport 31 %
Electricity and Heat ManufacturingResidential OtherAgriculture, Forestry and Fishing TransportRoad NavigationAviation RailOther Transport
Note: emissions from electric rail traction, aviation and navigation (maritime) international bunkers are included in the transport sector
UIC/IEA 2014
CLIMATE ChANgE
6
EU27 transport modal share, 2011
Passenger (passenger-km)
Freight (tonne-km)
Total (TU)
ROAD 83.6 % 46.9 % 70.3 %
AVIATION 8.8 % 0.1 % 5.7 %
NAVIGATION 0.6 % 41.9 % 15.5 %
RAIL 7.0 % 11.1 % 8.5 %
UIC/IEA 2014
Rail accounts for just 0.6 % of transport’s GHG emissions through direct usage (diesel) and by around 1.5 % if emissions from electricity generation are taken into account, even though railways represent 8.5 % of transport activity. In contrast, the road sector accounts for 71.9 % of transport CO2 emissions, while aviation and shipping account for 12.6 % and 14.4 % respectively.
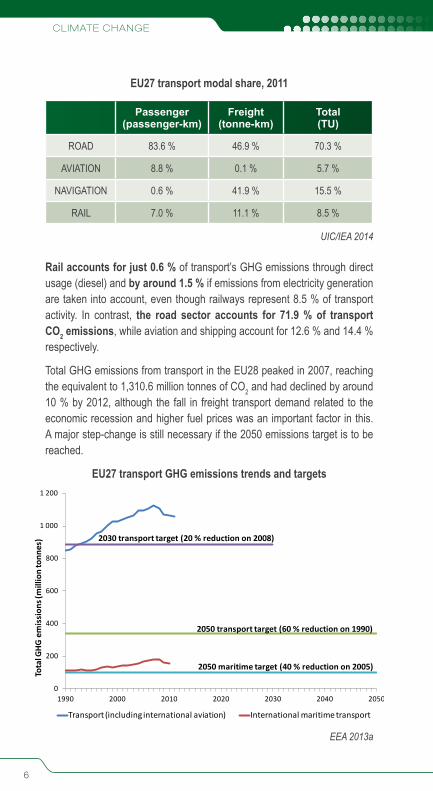
Total GHG emissions from transport in the EU28 peaked in 2007, reaching the equivalent to 1,310.6 million tonnes of CO2 and had declined by around 10 % by 2012, although the fall in freight transport demand related to the economic recession and higher fuel prices was an important factor in this. A major step-change is still necessary if the 2050 emissions target is to be reached.
EU27 transport GHG emissions trends and targets
0
200
400
600
800
1 000
1 200
1990 2000 2010 2020 2030 2040 2050
Tota
l GHG
em
issi
ons (
mill
ion
tonn
es)
Transport (including international aviation) International maritime transport
2030 transport target (20 % reduction on 2008)
2050 transport target (60 % reduction on 1990)
2050 maritime target (40 % reduction on 2005)
EEA 2013a

7
EU transport sector tomorrowThe European Commission made clear in “Roadmap to a Single European Transport Area” that the EU’s transport system is not sustainable, and that change is essential if the GHG reduction targets the roadmap outlined for 2030 and 2050 are to be met. “More resource-efficient vehicles and cleaner fuels are unlikely to achieve on their own the necessary cuts in emissions. They need to be accompanied by the consolidation of large volumes for transfers over long distances,” it said. This would mean greater use of modes that can easily carry large numbers of passengers such as rail, and multimodal solutions for freight that rely on rail and waterborne modes for long hauls.
The Roadmap envisages that the existing high-speed rail network should be tripled in length by 2030 and completed by 2050, so that “the majority of medium-distance passenger transport should go by rail”. For freight, 30 % of road freight over 300 km should shift to other modes such as rail or waterborne transport by 2030, and more than 50 % by 2050.
Rail GHG performanceFrom 1990 to 2010, the total CO2 emissions from the European railway sector were reduced by 39 %. This value was caused in part by the reduc-tion of tonne-km from 1990 onwards, particularly in the freight sector. How-ever, just as significantly, specific emissions (i.e. emissions per passenger-km or tonne-km) also fell during the same period, with passenger specific emissions falling by 27 % and freight specific emissions dropping by 41 %.
To help drive forward further improvement in the rail sector, in 2010 the strat-egy “Moving towards Sustainable Mobility: European Rail Sector Strategy 2030 and beyond” was jointly agreed and endorsed by members of UIC and CER to provide a unified approach in the European rail sector. It outlines how the rail sector should be performing in environmental terms in 2030 and 2050, and provides a framework to allow for suitable long-term plans.
The strategy commits European railways to reduce their specific CO2 emissions by 50 % by 2030, compared to 1990. In addition, by 2030 the European railways will cut their total CO2 emissions from train operation by 30 % compared to the 1990 base year. Furthermore, by 2050 the European railways will strive towards complete carbon-free train operation, pro-viding society with a climate-neutral transport option.
CLIMATE ChANgE
8
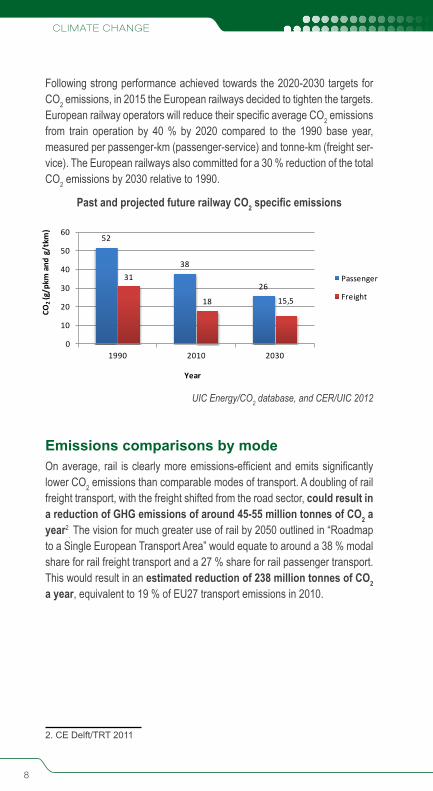
Following strong performance achieved towards the 2020-2030 targets for CO2 emissions, in 2015 the European railways decided to tighten the targets. European railway operators will reduce their specific average CO2 emissions from train operation by 40 % by 2020 compared to the 1990 base year, measured per passenger-km (passenger-service) and tonne-km (freight ser-vice). The European railways also committed for a 30 % reduction of the total CO2 emissions by 2030 relative to 1990.
Past and projected future railway CO2 specific emissions
UIC Energy/CO2 database, and CER/UIC 2012
52
38
2631
18 15,5
0
10
20
30
40
50
60
1990 2010 2030
CO2
(g/p
km a
nd g
/tkm
)
Year
Passenger
Freight
Emissions comparisons by modeOn average, rail is clearly more emissions-efficient and emits significantly lower CO2 emissions than comparable modes of transport. A doubling of rail freight transport, with the freight shifted from the road sector, could result in a reduction of GHG emissions of around 45-55 million tonnes of CO2 a year2
. The vision for much greater use of rail by 2050 outlined in “Roadmap to a Single European Transport Area” would equate to around a 38 % modal share for rail freight transport and a 27 % share for rail passenger transport. This would result in an estimated reduction of 238 million tonnes of CO2 a year, equivalent to 19 % of EU27 transport emissions in 2010.
2. CE Delft/TRT 2011

9
0 20 40 60 80 100 120gCO2/tkm (freight)
gCO2/pkm (passenger)
Freight train
Passenger train
Freight barge
Truck
Passenger car
Airplane
EEA 2013b
Comparing the emissions of different transport modes on a particular jour-ney varies due to factors including fuel source of electricity, overall distance, speed, and weight. Additional indirect emission factors such as emissions caused by the production of vehicles can also be considered to have the full picture. For example, vehicle production accounts for 24 % of combined direct and indirect fuel related GHG emissions for road transport. The Eco-Pasenger and EcoTransIT webtools allow for detailed calculations to com-pare journeys by different modes across Europe.
Freight The chart below compares the total CO2 emissions emitted when transport-ing 100 tonnes of average goods from Basel, Switzerland to the port of Rot-terdam, Netherlands. CO2 emissions from rail are 8 times less than by road and almost 7 times less than inland shipping.
www.ecotransit.org
0
1
2
3
4
5
6
Rail (electric) Rail (diesel) Inland ship Truck (EURO V)
Tons
of C
O2
R A I L T R A N S P O R T A N D E N V I R O N M E N TCLIMATE ChANgE
10
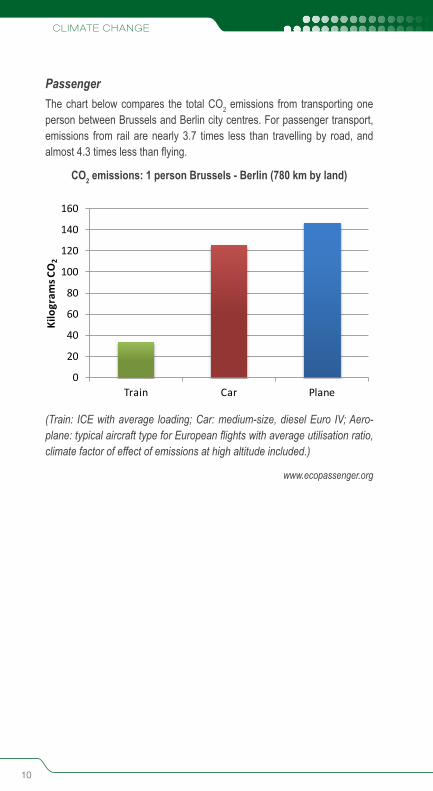
PassengerThe chart below compares the total CO2 emissions from transporting one person between Brussels and Berlin city centres. For passenger transport, emissions from rail are nearly 3.7 times less than travelling by road, and almost 4.3 times less than flying.
CO2 emissions: 1 person Brussels - Berlin (780 km by land)
0
20
40
60
80
100
120
140
160
Train Car Plane
Kilo
gram
s CO
2
(Train: ICE with average loading; Car: medium-size, diesel Euro IV; Aero-plane: typical aircraft type for European flights with average utilisation ratio, climate factor of effect of emissions at high altitude included.)
www.ecopassenger.org

R A I L T R A N S P O R T A N D E N V I R O N M E N T
2
11
Energy
Europe needs to reduce its import dependence for all fossil fuels. By using electricity, which can draw its power from a range of sources, rail is the only major transport mode not dependent almost entirely on fossil fuels.
Rail’s share of transport energy consumption is less than 2 % despite a market share of over 8.5 %.
The European railways will reduce their specific final energy consumption from train operation by 30 % by 2030 and by 50 % by 2050 compared to the 1990 base year, measured per passenger-km (passenger service) and tonne-km (freight service).
EU transport sector today
EU energy policy is closely related to policies on reducing greenhouse gas emissions. Building on the 20-20-20 targets, in 2014 the European Com-mission set targets for the post-2020 period with the 2030 Framework for Climate and Energy Policies. The EU will increase the share of renewable energy to 27 % and realise energy savings of 30 % in the EU’s primary en-ergy consumption compared to 2007. The long-term energy goals for energy envisage a major shift away from oil and gas use in order to meet the 2050 GHG emissions reduction target.
The transport sector poses a major challenge as it accounts for 32 % of final energy consumption in the EU. While transport has become more energy efficient, in the EU it still depends on petrol and diesel for 96 % of its energy needs, and use of these rose by 35 % between 1990 and 2007 before falling back slightly due to the impact of the financial recession.
In 2011, the EU Communication “Roadmap to a Single European Transport Area” made clear that the challenge is now to “use less and cleaner energy” and to break the transport system’s dependence on oil. This position was restated in the “Roadmap to a Resource Efficient Europe”, also adopted by the Commission in 2011, which identified transport as one of three crucial sectors where action is needed. By 2020, overall efficiency in the transport sector needed to “deliver greater value with optimal use of resources”, with transport using less and cleaner energy, exploiting modern infrastruc-ture, and reducing its negative impact on the environment.
ENERgy
12
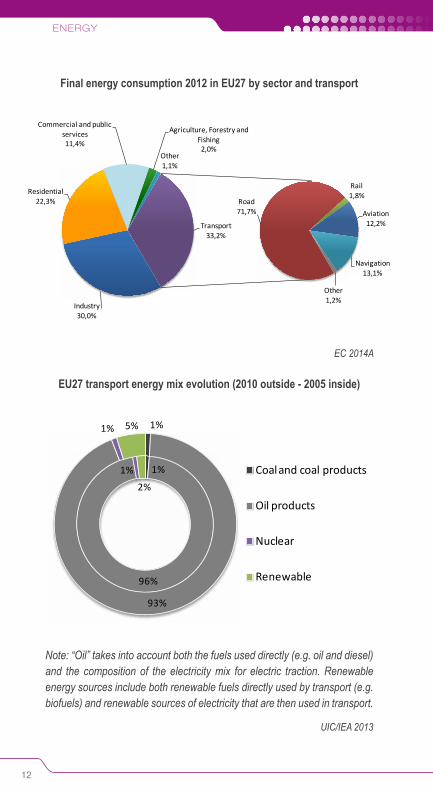
Final energy consumption 2012 in EU27 by sector and transport
Industry30,0%
Residential22,3%
Commercial and public services11,4%
Agriculture, Forestry and Fishing2,0%
Other1,1%
Road71,7%
Rail1,8%
Aviation12,2%
Navigation13,1%
Other1,2%
Transport33,2%
EC 2014A
EU27 transport energy mix evolution (2010 outside - 2005 inside)
1%
96%
1%
2%
1%
93%
1% 5%
Coal and coal products
Oil products
Nuclear
Renewable
Note: “Oil” takes into account both the fuels used directly (e.g. oil and diesel) and the composition of the electricity mix for electric traction. Renewable energy sources include both renewable fuels directly used by transport (e.g. biofuels) and renewable sources of electricity that are then used in transport.
UIC/IEA 2013
13
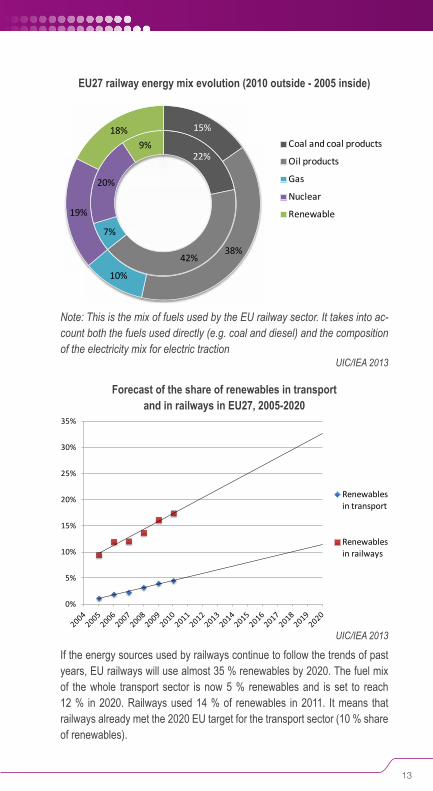
EU27 railway energy mix evolution (2010 outside - 2005 inside)
22%
42%
7%
20%
9%
15%
38%
10%
19%
18%Coal and coal products
Oil products
Gas
Nuclear
Renewable
Note: This is the mix of fuels used by the EU railway sector. It takes into ac-count both the fuels used directly (e.g. coal and diesel) and the composition of the electricity mix for electric traction
UIC/IEA 2013
Forecast of the share of renewables in transport and in railways in EU27, 2005-2020
0%
5%
10%
15%
20%
25%
30%
35%
Renewables in transport
Renewables in railways
UIC/IEA 2013
If the energy sources used by railways continue to follow the trends of past years, EU railways will use almost 35 % renewables by 2020. The fuel mix of the whole transport sector is now 5 % renewables and is set to reach 12 % in 2020. Railways used 14 % of renewables in 2011. It means that railways already met the 2020 EU target for the transport sector (10 % share of renewables).

ENERgy
14
EU transport sector tomorrowFinal energy demand in the transport sector has grown in line with transport activity over recent years. However, despite the projected upward trends in transport activity beyond 2010, the most recent forecasts for the European Commission predict that energy demand in 2050 will be marginally lower than in 2010, with demand decoupling from transport activity beyond 2015.
The main driver of low final energy demand from transport is predicted to be improvements in fuel efficiency and the uptake of more efficient tech-nologies. Operational measures such as energy-efficient driving or optimi-sation of stabling and platforming can also be implemented.
Trends in transport activity and energy consumption 1995 - 2050
80
100
120
140
160
180
200
220
240
260
1995 2000 2005 2010 2015 2020 2025 2030 2035 2040 2045 2050
GDP Freight transport activity Passenger transport activity Energy for Freight transportationEnergy for Passenger transportation
EC 2013
Final energy demand in transport 2010 - 2050
0
50
100
150
200
250
300
350
400Million Tonnes of Oil Equivalent
Inland Navigation
Aviation
Rail
Freight Road Transport
Passenger Road Transport
52 46 43 42
3134 36 36
2 2 3 3
14 16 17 17
2 2 2 2
2010 2020 2030 2050
Shares in %
EC 2013
Inde
x 19
95=1
00

15
The EU aims for oil use in transport to be reduced by 70 % by 2050 from 2008 levels. While transport oil consumption has reduced slightly, over the next few years the rate of reduction will need to accelerate in order not to fall behind the linear target line to the 2050 goal.
Rail traction energyWhile rail’s share of transport energy consumption is less than 3 %, its mar-ket share is around 8.5 %. Railways have improved their energy efficiency in both passenger and freight transport from 1990 to 2009: on average, 13 % less energy is needed now for one passenger-km and 19 % less energy for one tonne-km.
EU27 railway specific energy consumption 1990-2011
150
200
250
300
350
400
450
500
Passenger (kJ/pkm) Freight (kJ/tkm)UIC/IEA 2014
In the 2010 strategy “Moving towards Sustainable Mobility: European Rail Sector Strategy 2030 and beyond” that was jointly agreed by members of UIC and CER, the rail sector agreed that by 2030 the European railways will have reduced their specific final energy consumption from train opera-tions by 30 % compared to 1990. Furthermore, the European rail sector set a vision of reducing by 50 % their specific energic consumption by 2050.
Approximately 85 % of total energy consumed by the rail sector is used directly for rail traction as illustrated below.
Primary energy production, transmission and conver-sion losses, input to rail grid from public substation outlet (100 %)
>Traction energy (85 %), of which catenary losses (5-10 %)
Workshops, buildings, signalling, etc. (15 %)
UIC 2012
ENERgy
16
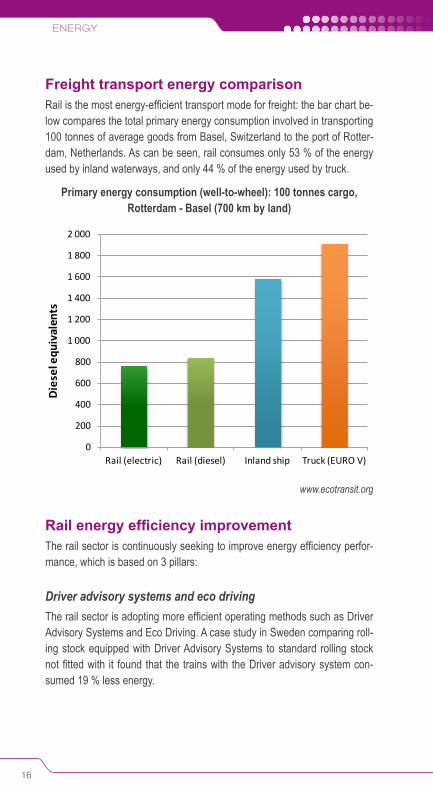
Freight transport energy comparisonRail is the most energy-efficient transport mode for freight: the bar chart be-low compares the total primary energy consumption involved in transporting 100 tonnes of average goods from Basel, Switzerland to the port of Rotter-dam, Netherlands. As can be seen, rail consumes only 53 % of the energy used by inland waterways, and only 44 % of the energy used by truck.
Primary energy consumption (well-to-wheel): 100 tonnes cargo, Rotterdam - Basel (700 km by land)
0
200
400
600
800
1 000
1 200
1 400
1 600
1 800
2 000
Rail (electric) Rail (diesel) Inland ship Truck (EURO V)
Die
sel e
quiv
alen
ts
www.ecotransit.org
Rail energy efficiency improvementThe rail sector is continuously seeking to improve energy efficiency perfor-mance, which is based on 3 pillars:
Driver advisory systems and eco driving The rail sector is adopting more efficient operating methods such as Driver Advisory Systems and Eco Driving. A case study in Sweden comparing roll-ing stock equipped with Driver Advisory Systems to standard rolling stock not fitted with it found that the trains with the Driver advisory system con-sumed 19 % less energy.

17
Electricity metersAll electric trains operated by DB (Germany) have electricity meters in-stalled. SNCF (France), SBB (Switzerland) and SNCB (Belgium) are intend-ing to equip their complete fleet with on-board energy meters by 2019. In total, 25,000 energy meters will be installed by 2020. The new European Technical Specification on Interoperability regarding rolling stock will make on-board energy meters mandatory from 2019 on new, renewed and up-graded rolling stock. All member states must have arrangements by 2019 to collect data coming from such meters and exchange it with relevant parties in the energy market.
Recent EU-funded research and development projects: � Railenergy (2006-2010) www.railenergy.eu
The Railenergy project aimed to achieve a 6 % reduction of the specific energy consumption of the European rail system by 2020. Recommen-dations included predicting the energy performance of new rolling stock using the new technical standard TecRec 100_001, greater use of eco driving (saving potential between 5 % and 15 %), energy efficient traffic management (saving potential between 10 % and 20 %), and parked train management (saving potential of 4 % to 8 %).
� Trainer (2006-2008) tinyurl.com/iee-trainer
� Hyrail (2007) www.hyrail.eu
� ECORailS (2009-2011) www.ecorails.eu
� MERLIN (2012-2015) www.merlin-rail.eu
The MERLIN project is investigating and demonstrating the viability of an integrated management system to achieve a more sustainable energy us-age in European electric mainline railway systems. MERLIN will provide an integrated optimisation approach towards a cost-effective intelligent man-agement of energy and resources, and will also deliver the interface protocol and architecture for energy management systems in the railway domain. A 10 % reduction in energy consumption is expected to be achieved where the results of the project are implemented.

R A I L T R A N S P O R T A N D E N V I R O N M E N T
R A I L T R A N S P O R T A N D E N V I R O N M E N T
3
19
Electricity use
Electric traction accounts for over 80 % of rail activity (passenger-km and tonne-km) in Europe.
Electricity used by railways in Europe is already produced with an average of 30 % from renewable sources.
There are no technical obstacles to a fully-electric rail sector with zero CO2 emissions if electricity is from practically carbon-free sources.
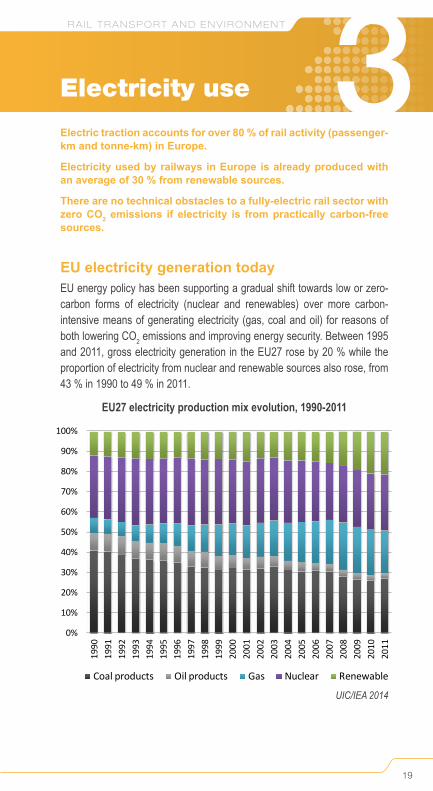
EU electricity generation todayEU energy policy has been supporting a gradual shift towards low or zero-carbon forms of electricity (nuclear and renewables) over more carbon-intensive means of generating electricity (gas, coal and oil) for reasons of both lowering CO2 emissions and improving energy security. Between 1995 and 2011, gross electricity generation in the EU27 rose by 20 % while the proportion of electricity from nuclear and renewable sources also rose, from 43 % in 1990 to 49 % in 2011.
EU27 electricity production mix evolution, 1990-2011
0%
10%
20%
30%
40%
50%
60%
70%
80%
90%
100%
1990
1991
1992
1993
1994
1995
1996
1997
1998
1999
2000
2001
2002
2003
2004
2005
2006
2007
2008
2009
2010
2011
Coal products Oil products Gas Nuclear Renewable
UIC/IEA 2014

ELECTRICITy uSE
20
EU27 gross electricity generation, 2012
Nuclear27%
Coal27%
Gas19% Oil
2%
Other1%
Hydro45,9%
Wind25,8%
Biomass18,7%
Solar9%
Geothermal1%Tidal
0%
Renewables24%
EC 2014b
EU electricity generation tomorrowThe EU proposes that electricity should play a central role in the future low carbon economy. Its analysis envisages that it will largely eliminate CO2 emissions in electricity by 2050, and also offer the prospect of partially re-placing fossil fuels with electricity in transport and heating, resulting in a lower environmental impact and less dependence on imported fuel. The in-creased use of electricity in these two sectors will be achievable as electricity consumption overall will only have to continue to increase at historic growth rates, due to continuous improvements in efficiency. However, in order to ensure that new electricity generation is low carbon, there will likely be a need to ensure that the cost of CO2 in the EU Emissions Trading System is kept at a sufficiently high level that ensures it is not cheaper to produce electricity using coal.

21
Future EU electricity generation, by fuel type
0
500
1000
1500
2000
2500
3000
3500
4000
4500
5000
Net electricity generation by fuel type (TWh)
Solar, tidal etc.
Wind
Hydro
Biomass
Derived gasses
Natural gas
Petroleum products
Coal and lignite
Nuclear27
22 22 21
24
2012
7
3
1
1
1
23
20
20
18
1
1
1
1
4
6
6
8
12
11
11
10
5
15
22
26
1 4 6 9
2010 2020 2030 2050
Shares (%)
EC 2013
Rail’s electricity useDue to its established use of electricity, rail is the only major mode of trans-port that is principally and currently capable of shifting from using fossil fuels to renewable energy without the need for further major technological innova-tion. But therefore a massive investment is required in infrastructure. Over half of the European rail network is already powered by electricity, a figure that continues to increase. With sufficient funding and the political will, it would be possible to electrify the entire European rail network. If electricity is fully decarbonised by 2050 as the EU aims to achieve, then rail would become the first zero-carbon major transport mode.
The emissions from rail’s electricity use are crucially linked with the energy supply in each member state, which is decided by the national energy sectors and by political objectives. However, some railways own dedicated railway electricity production facilities for historic and technical reasons and there-fore can have a different mix. Yet again other railways in countries with fully deregulated electricity markets have made a conscious decision to procure electricity from renewable sources, dedicating this electricity (and its emis-sions) to rail and thus exempting it from being bought by another procurer.

R A I L T R A N S P O R T A N D E N V I R O N M E N TELECTRICITy uSE
22
Furthermore, railways are often the biggest users of electricity in a country, so their purchasing decisions can help shift markets and encourage invest-ment in cleaner forms of energy production. In this setting, a political will is also needed as many national railways are still state-owned.
EU27 railway energy consumption by fuel 1990-2011
0,0%
0,5%
1,0%
1,5%
2,0%
2,5%
3,0%
3,5%
0
50 000
100 000
150 000
200 000
250 000
300 000
350 000
400 000
Coal and coal products Oil products Electricity Rail CO2 share emissions
UIC/IEA 2014
Railway electricity mix evolution in EU27 (2010 outside - 2005 inside)
UIC/IEA 2013
36%
4%11%
33%
16%24%
1%
17%
30%
28%Coal
Oil
Gas
Nuclear
Renewable

R A I L T R A N S P O R T A N D E N V I R O N M E N T
4
23
Land use
Railway infrastructure is responsible for around only 4 % of the total area of land used for transport.
Land take per passenger-km for rail is about 3.5 times lower than for cars.
EU transport sector todayThe negative impact on land use is a significant but often overlooked con-sequence of transport, and can go beyond the land set aside specifically for infrastructure. The actual space taken for infrastructure leads to the sealing of topsoil, as well as disturbances resulting from noise, resource use, waste dumping and pollution. Transport networks can add to the fragmentation and degradation of the natural and urban environment due to the “barrier ef-fects” of infrastructure. Furthermore, the land take by road transport is often disproportionate: land allocated exclusively to car transport and off-street car parking tends, in urban areas, to be out of proportion to the land actually available. This focus on supporting the movement and placement of cars conflicts with other priorities, such as the need for recreational space.
The growth in demand for new transport infrastructure caused in part by growing urbanisation means that land take for transport has been increas-ing in recent years. Road transport is by far the largest consumer of land for transport: the road network occupies 93 % of the total area of land used for transport in the EU15, while rail is responsible for only 4 % of land take. Land-take efficiency (the ratio between land used and the traffic carrying ca-pacity of the infrastructure) varies significantly from one infrastructure type to another. Railways require far less land take per transport unit (passenger-km and tonne-km) than road transport, with land take per passenger-km by rail about 3.5 times lower than for cars.

LAND uSE
24
EU transport sector tomorrowIn the EU’s 2012 Roadmap to a Resource Efficient Europe, transport was identified as one of three crucial sectors where stronger action was needed on increasing resource efficiency. It proposed that by 2020, EU policies should take into account their direct and indirect impact on land use, and the longer-term aim would be for no additional net land take by 2050. The road-map made clear the need to minimise the impacts of transport infrastructure on the sealing of land, a problem most prevalent in road building.
Efficiency of land useAs the graph below shows, rail tracks permit a far higher throughput of peo-ple in a given unit of time than road, and usually require considerably less land than urban roads.
Capacity of a 3.5 m wide lane in a city
ADB/giz 2011
29
20 22
80
100
0
20
40
60
80
100
120
Car Bus Bus Rapid Transit
Light Rail Heavy Rail
Suburban Rail
Peop
le p
er h
our (
thou
sand
s)
The same principle is true in longer, inter-city journeys. Due to high-speed rail’s very high capacity, the land needed for the large traffic volumes car-ried is much reduced. On average, a high-speed line uses 3.2 ha/km, while an average motorway uses 9.3 ha/km. Furthermore, the impact on land use of new high-speed rail lines can be reduced by laying new lines paral-lel to existing motorways. Examples of where this has happened include Paris - Lyon (60 km, 14 % of the total line), Paris - Lille (135 km, 41 % of the total), Cologne - Frankfurt (140 km, 71 % of the total), and Milan - Bologna (130 km, 72 % of the total).

25
2 x 3 lanes75m
1.7 passenger / car 666 passengers / train
4,500 cars per hour 12 trains per hour
Double track25m
HIGH-SPEED RAILWAYMOTORWAY
2 X 7,650 PASSENGERS / H 2 X 8,000 PASSENGERS / H
4,500 12
6661.7
COMPARISONS IN LAND USE
UIC 2011

R A I L T R A N S P O R T A N D E N V I R O N M E N T

R A I L T R A N S P O R T A N D E N V I R O N M E N T
5
27
Local air pollution
Electric rail transport emits no local air pollution at the point of use.
European railways will reduce their total exhaust emissions of NOx and PM10 by 2030 by 40 % in absolute terms, even with projected traffic growth compared to the 2005 base year.
European railways will strive towards zero emission of nitrogen oxides (NOx) and particulate matter (PM10) from non-electric trains by 2050.
EU transport sector todayEU policies on air quality have led to significant reductions in concentra-tions of harmful pollutants, such as particulate matter (PM), sulphur dioxide (SO2), lead, nitrogen oxides (NOx), and carbon monoxide (CO). However, fine (PM10) and very fine (PM2.5) particulates, and ozone (O3) continue to pre-sent significant health risks, and up to one-third of Europeans living in cities are still exposed to air pollutant levels exceeding EU air quality standards. The EU remains well short of its long-term objective outlined in the 7th Envi-ronmental Action Programme, which is to achieve levels of air quality that do not have significant negative impacts on human health and the environment.
Transport is one of the main sources of air pollution in Europe, particularly in cities and urban areas. Key air pollutants emitted from combustion engines in all modes of transport include NOx, PM, CO, and volatile organic com-pounds (VOCs). Non-exhaust emissions of PM are also released due to the mechanical wear of brakes, tyres and road surfaces, but are not currently regulated. During the period 1990 to 2010, the pollutants showed a decreas-ing trend in transport emissions: the largest percentage decreases over this period were for carbon monoxide (76 %) and non-methane volatile organic compounds (NMVOC) (75 %). While changes to fuel and technological and efficiency improvements have reduced transport’s impact on air pollution, transport, and in particular road traffic, continues to play a major role in the generation of particulates and ozone.
LOCAL AIR POLLuTION
28
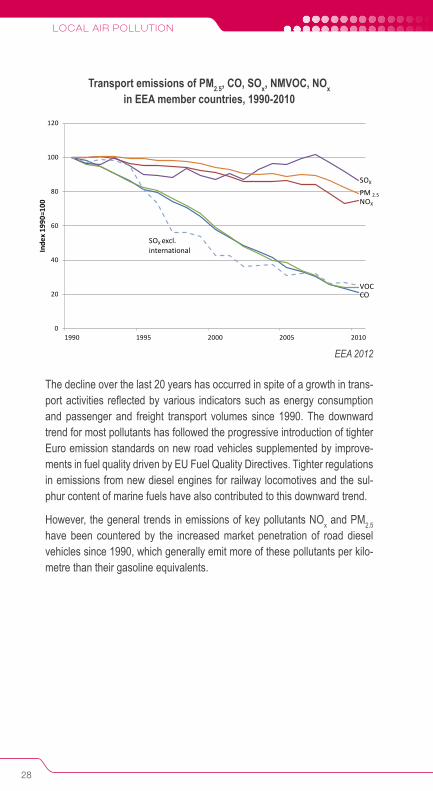
Transport emissions of PM2.5, CO, SOx, NMVOC, NOx in EEA member countries, 1990-2010
0
20
40
60
80
100
120
1990 1995 2000 2005 2010
Transport emissions of PM2.5, CO, SOx, NMVOC, NOx in EEA member countries, 1990-2010
SOX
VOCCO
SOX excl.international
NOX
PM 2.5
Inde
x 19
90=1
00
EEA 2012
The decline over the last 20 years has occurred in spite of a growth in trans-port activities reflected by various indicators such as energy consumption and passenger and freight transport volumes since 1990. The downward trend for most pollutants has followed the progressive introduction of tighter Euro emission standards on new road vehicles supplemented by improve-ments in fuel quality driven by EU Fuel Quality Directives. Tighter regulations in emissions from new diesel engines for railway locomotives and the sul-phur content of marine fuels have also contributed to this downward trend.
However, the general trends in emissions of key pollutants NOx and PM2.5 have been countered by the increased market penetration of road diesel vehicles since 1990, which generally emit more of these pollutants per kilo-metre than their gasoline equivalents.

29
EEA-32 contribution of the transport sector to total emissions of PM2.5 and NOx, 2009
Non-transport sectors
73%
Road transport non-exhaust
17%
International shipping
36%
Road transport exhaust
36%
Domestic shipping 7%International aviation
2%Railways 1%
Transport27%
Primary PM2.5
Non-transport sectors
42%
Road transport non-exhaust
57%
International shipping 26%
Domestic aviation 1%Domestic shipping 7%International aviation
7%Railways 2%
Transport58%
NOx
Note: Rail emissions only include those generated at the point of use (e.g. diesel engine locomotives) and not secondary sources (e.g. electricity power stations)
EEA 2012
EU transport sector tomorrowThe EU estimates that more than 400,000 people are estimated to have died prematurely from air pollution annually in the EU, with an economic cost of the health impacts alone estimated at EUR 330-940 billion (3-9 % of EU GDP). The EU’s 2013 Clean Air Policy Package set out new interim objec-tives for reducing health and environmental impacts from air pollution up to 2030. The proposal included a revised National Emission Ceilings Directive, containing updated national ceilings for six key air pollutants (PM, SO2, NOx, VOCs, NH3 (ammonia) and CH4 (methane)) for 2020 and 2030. The main priority for transport policy will be to ensure that the existing legislation fully delivers on air pollution, in particular with regard to the new Euro 6 stand-ards for road vehicles, and a revision of the Non Road Mobile Machinery Directive, which regulates diesel rail vehicles. Air pollutants and greenhouse gases (including CO2) are often emitted by the same sources, so certain

LOCAL AIR POLLuTION
30
GHG reduction measures can also deliver reductions in air pollutants such as NO2, SO2, and O3. However, decarbonisation does not always reduce emissions of particulate matter (PM).
Rail sector targetsThe total emissions from rail diesel traction have continuously decreased since 1990 and are extremely low today compared to the transport sector as a whole. Diesel traction only accounts for 20 % of European rail traffic but the rail sector is still looking at new combustion technologies, efficient transmission systems and exhaust after-treatment that will ensure that rail diesel traction will remain more environmentally friendly in the future than road or inland waterways. Electrification of remaining lines is also one of the many approaches that may be taken, although rail diesel propulsion is still expected to play an indispensable role for the European transport system in the coming years.
By 2030 the European railway sector has pledged to reduce their total exhaust emissions of NOx and PM10 by 40 % in absolute terms, even with projected traffic growth, compared to 2005. By 2050, the European railways will strive to have zero emission of NOx and PM10.
Freight transport emissions comparisonThe bar chart below compares the NOx and PM caused by transporting 100 tonnes of average goods from the port of Rotterdam, Netherlands, to Basel, Switzerland (666 km by road).
NOx and PM generated by 100 tonnes cargo, Rotterdam - Basel (700 km by land)
1,1
12,7
51,8
0,13
0,45
1,75
0
10
20
30
40
50
60
Train Truck (EURO V) Inland waterway
PM
NOx
www.ecotransit.org

31
Passenger transport NOx and PM comparisonAs suburban and urban railway lines are frequently fully-electric across Eu-rope, the local NOx and PM emissions from rail in urban areas are often zero. The bar chart below compares the NOx and PM caused by a passenger journey from Brussels to Berlin.
NOx and PM generated by passenger transport, Brussels - Berlin (780 km by land)
24,3
238,5
294,2
2,2
6,4
6,2
0
50
100
150
200
250
300
350
Train Car Plane
PM
NOx
(Train: average loading; Car: medium-size, diesel Euro IV, 1.5 passengers; Aeroplane: typical aircraft type for European flights with average utilisation ratio, effect of emissions at high altitude included, transport to and from air-port by car included.)
www.ecopassenger.org

R A I L T R A N S P O R T A N D E N V I R O N M E N TLOCAL AIR POLLuTION
32
Rail sector air pollution reduction projectsThe railways continuously seek to improve their technical, operational, com-mercial and procurement measures. Recent research and development pro-jects to further reduce air pollution levels include:
� GREEN (2006) green.uic.org
GREEN (GREen heavy duty ENgine) was an EU funded research project aiming to develop an intelligent flexible HD engine system able to achieve a maximum fuel conversion efficiency of 45 %, while complying with a zero-impact emission level.
� CleanER-D (2011-2013) www.cleaner-d.eu
Clean European Rail-Diesel (CleanER-D) was an EU-funded research project aiming to develop, improve and integrate emissions reduction tech-nologies for diesel locomotives and rail vehicles. Furthermore, it used in-novative methods and hybrid solutions for the best possible contribution to reductions in CO2 emissions. The project has developed recommendations to all involved stakeholders on how to boost emission reduction of rail diesel traction.
R A I L T R A N S P O R T A N D E N V I R O N M E N T
6
33
Noise
Retrofitting rail freight wagons with low-noise brake blocks can cut noise levels by 8-10 dB, reducing the perceived noise by up to 50 %.
The European railways will strive towards noise and vibrations no longer being considered a problem.
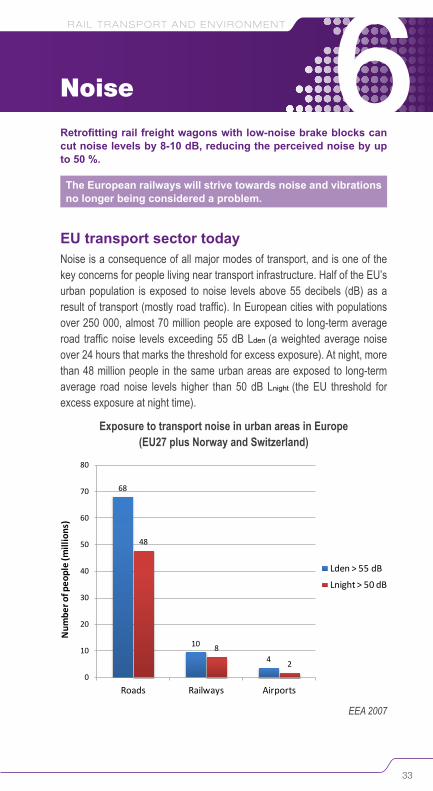
EU transport sector todayNoise is a consequence of all major modes of transport, and is one of the key concerns for people living near transport infrastructure. Half of the EU’s urban population is exposed to noise levels above 55 decibels (dB) as a result of transport (mostly road traffic). In European cities with populations over 250 000, almost 70 million people are exposed to long-term average road traffic noise levels exceeding 55 dB Lden (a weighted average noise over 24 hours that marks the threshold for excess exposure). At night, more than 48 million people in the same urban areas are exposed to long-term average road noise levels higher than 50 dB Lnight (the EU threshold for excess exposure at night time).
Exposure to transport noise in urban areas in Europe (EU27 plus Norway and Switzerland)
68
10
4
48
8
20
10
20
30
40
50
60
70
80
Roads Railways Airports
Num
ber o
f peo
ple
(mill
ions
)
Lden > 55 dB
Lnight > 50 dB
EEA 2007

NOISE
34
Percentage of citizens who are “highly disturbed” when exposed to transport noise at night
0
5
10
15
20
25
30
40 42 44 46 48 50 52 54 56 58 60 62 64 66 68 70
Air Traffic Road Traffic Rail TrafficLnight (outside, facade)
% H
ighl
y di
stur
bed
UIC 2010
Current EU legislation distinguishes between noise creation (the emission of noise at source, best tackled on an EU-wide level), and noise reception (what to do once noise has been emitted, best addressed at national, re-gional or local levels). The Technical Specification for Interoperability relating to rolling stock noise (Noise TSI), which was published at the end of 2014, will ensure that all rolling stock complies with strict noise limits.
The main EU legislative instrument for providing a coherent overview on dealing with noise reception is the Environmental Noise Directive (END). The END provides a common basis for tackling noise across the EU by iden-tifying hotspots. While there are no binding targets at the EU level, the END requires that member states must calculate noise exposure levels, publish noise maps, and adopt action plans to prevent or reduce noise exposure where necessary.
EU transport sector tomorrowNoise will remain one of the key environmental problems for EU transport for a long time due to the inherent nature of the problem and its link to transport growth. To help push forward action in member states, the EU’s 7th Environ-ment Action Programme (2012) stated that it aimed to ensure that by 2020 noise pollution in the EU will have “significantly decreased”, moving closer to World Health Organisation (WHO) recommended levels. While the biggest priority in transport noise is road traffic, the EU is nonetheless making sure
35
that rail noise is also tackled. The European Commission aims to reduce the level of rail noise without jeopardising the competitiveness of the rail sector. A review of the END is ongoing and in the future a revision of the Directive may be realised.
In the Directive 2012/34/EU, a provision on the possible use of track ac-cess charges to account for environmental externalities was enhanced in order to develop an economic incentive to tackle rail freight noise. This type of measure is commonly referred to as Noise-Differentiated Track Access Charges (NDTAC). The introduction of such charges is currently voluntary for each EU member state. However, with the upcoming implementing act of the Commission, harmonised arrangements for NDTAC should be ap-plicable to those member states that have introduced or will in the future introduce infrastructure charging due to railway noise. Currently NDTAC sys-tems, have already been established in Germany and the Netherlands, and also in non-EU Switzerland – these three countries together represent 23 % of the European rail network. Other countries such as Belgium, Italy and Czech Republic are also examining NDTAC systems to consider introducing them in the future.
In 2013, the European Commission issued a roadmap specifically targeting noise generated by rail freight wagons that laid out a series of policy options for further measures. The Commission is expected to produce a Communi-cation in 2015 to set a mid-term strategy for significantly reducing rail freight noise. By 2020, some European countries are likely to impose regulatory measures for noisy freight wagons, in particular Switzerland which is plan-ning to ban cast-iron brake blocks.
Rail’s noise reduction activityThe European rail sector has long recognised that noise from rail activity needs to be further reduced. In particular, the rail sector has made the com-mitment that, by 2030, noise mitigation measures will be integrated naturally in all relevant processes of the railway, offering sustainable and bearable solutions, implemented using a toolbox of various innovative and homolo-gated techniques.
Railway noise measures can be divided into two main categories: rolling stock-related measures such as modified brakes or damped wheels, and in-frastructure-related measures such as rail dampers and noise barriers. The larger potential lies in treating the noise problem at source, which is recog-nised as the most effective solution both in technical and economical terms.
NOISE
36
The biggest challenge in the rail sector is the noise caused by the large remaining fleets of older freight wagons. Passenger traffic (high-speed rail and intercity) is considered to have no noise problem. Since 2006, new and upgraded wagons must be equipped with composite brake blocks reduc-ing pass-by noise, but tens of thousands of older freight wagons continue to operate using cast-iron brake blocks, which in turn cause rough wheels and rails. Noise is a local issue by definition, and rail noise is considered a particular nuisance in densely populated central European countries such as the Netherlands, Germany and Switzerland.
Retrofitting existing freight wagons with low-noise “LL” brake blocks offers a noise reduction potential of 8-10 dB, reducing the perceived noise by up to 50 %. This impact is particularly beneficial at night when a major percent-age of freight trains operate. However, there are significant costs involved in retrofitting existing wagons. The expected cost to retrofit all existing wagons is at least €1 billion. One also has to consider higher operational costs in ret-rofitted wagons, which is estimated at almost €2 billion over the next 7 years.
To have an overview on the operational experience and lifecycle costs of the LL-blocks, the rail sector commissioned the €15 million EuropeTrain project. The test train consisted of 32 wagons fitted with LL-blocks, and spent over a year traversing the continent experiencing the most extreme weather condi-tions found in Europe. The EuropeTrain project was successfully concluded in 2013. Two types of LL-blocks were homologated in July 2013.
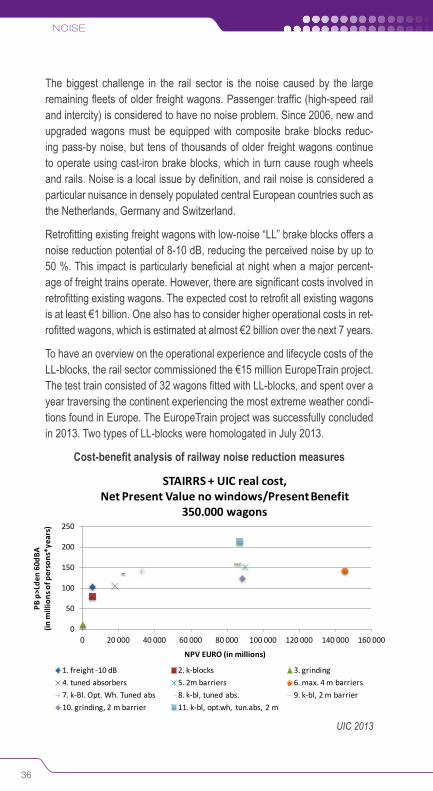
Cost-benefit analysis of railway noise reduction measures
0
50
100
150
200
250
0 20 000 40 000 60 000 80 000 100 000 120 000 140 000 160 000
PB p
>Lde
n 60
dBA
(in m
illio
ns o
f per
sons
*yea
rs)
NPV EURO (in millions)
STAIRRS + UIC real cost, Net Present Value no windows/Present Benefit
350.000 wagons
1. freight -10 dB 2. k-blocks 3. grinding4. tuned absorbers 5. 2m barriers 6. max. 4 m barriers7. k-Bl. Opt. Wh. Tuned abs 8. k-bl, tuned abs. 9. k-bl, 2 m barrier10. grinding, 2 m barrier 11. k-bl, opt.wh, tun.abs, 2 m
UIC 2013

37
As the graph above shows, solutions that involve composite brake blocks both on their own and combined with other measures can save consider-able amounts of money in comparison to noise abatement with only noise barriers.
Railway noise reduction projectsThe rail sector has developed various sector funded or EU co-funded re-search and development projects to understand and mitigate railway noise. Recent significant rail noise projects include:
� Acoutrain (2011-2014) www.acoutrain.eu
Acoutrain is a research programme, which aims at simplifying and improv-ing the acoustic certification process of new rolling stock. The goal of the project is to speed up product authorisation by introducing elements of virtual testing while retaining the same degree of reliability and accuracy.
� Rivas (2011-2013) www.rivas-project.eu
RIVAS (Railway Induced Vibration Abatement Solutions) aimed to reduce the environmental impact of ground-borne vibration and to provide solu-tions to vibration issues for surface lines. The project developed world-leading technologies to ensure efficient control of exposure to vibration and vibration-induced noise from rail.

R A I L T R A N S P O R T A N D E N V I R O N M E N T

R A I L T R A N S P O R T A N D E N V I R O N M E N T
7
39
External costs
Road’s average external costs are more than four times higher than rail for passenger services, and more than six times higher for freight services.
Rail accounts for just 2 % of the total external costs of transport in Europe.
The external costs of transport are the negative effects of transport that are not internalised into the price paid by the user, such as air pollution, ac-cidents and congestion. They cannot be disregarded as they lead to real costs to society, such as climate change, health problems, and delays. If consistent monetary signals are given to users, operators and investors, the most appropriate choices from the point of view of wider society on issues such as the mode of travel, the deployment of new technologies, and the development of infrastructure, will be made.
Various studies have attempted to put values on external costs. The IMPACT report on internalisation of the external costs of transport, carried out for the European Commission in 2007 said: “Although the estimation of external costs has to consider several uncertainties, there is consensus at scientific level that external costs of transport can be measured by best practice ap-proaches and that general figures (within reliable bandwidths) are ready for policy use.”
EU transport sector todayIn 2008, the total external costs in the EU27 (excluding Malta and Cyprus, but including Norway and Switzerland) were estimated at €510 billion, ex-cluding congestion. When congestion was added in, the costs rose to €660-760 billion, depending on whether low or high congestion values were used. The total represented 4 % of the total GDP of the 27 countries considered if congestion was excluded, or between 5 % and 6 % of GDP if congestion was included.
ExTERNAL COSTS
40
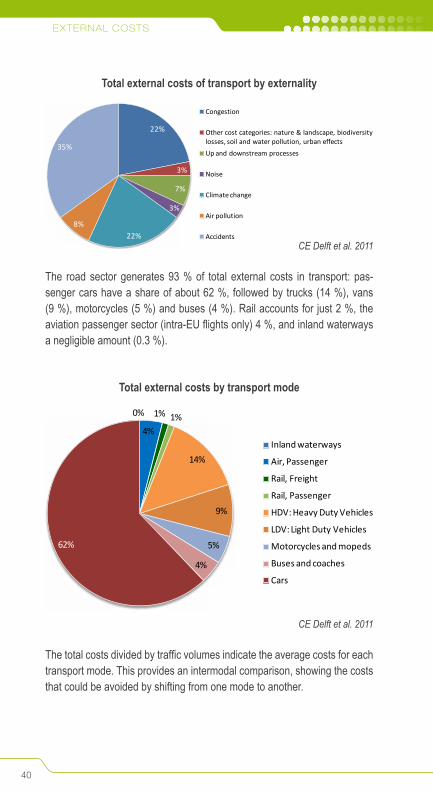
Total external costs of transport by externality
22%
3%
7%
3%
22%8%
35%
Congestion
Other cost categories: nature & landscape, biodiversity losses, soil and water pollution, urban effectsUp and downstream processes
Noise
Climate change
Air pollution
AccidentsCE Delft et al. 2011
The road sector generates 93 % of total external costs in transport: pas-senger cars have a share of about 62 %, followed by trucks (14 %), vans (9 %), motorcycles (5 %) and buses (4 %). Rail accounts for just 2 %, the aviation passenger sector (intra-EU flights only) 4 %, and inland waterways a negligible amount (0.3 %).
Total external costs by transport mode
CE Delft et al. 2011
0%
4%
1% 1%
14%
9%
5%
4%
62%
Inland waterways
Air, Passenger
Rail, Freight
Rail, Passenger
HDV: Heavy Duty Vehicles
LDV: Light Duty Vehicles
Motorcycles and mopeds
Buses and coaches
Cars
The total costs divided by traffic volumes indicate the average costs for each transport mode. This provides an intermodal comparison, showing the costs that could be avoided by shifting from one mode to another.

41
Average EU27 external costs (excluding congestion): passenger transport
32,3
12,3
33,6
0,6 0,5
5,5
6
5,7
2,6 0,9
17,3
9,1
16,3
1,5
46,9
05,7
2,8
5,4
8,1
7,1
2,1
2
2,1
1,3
0,7
0
10
20
30
40
50
60
70
Car Bus/Coach Road Pass. Total Rail Passenger Air PassAccidentsAir pollutionCC HighNoiseUp- and downstreamOther cost categories: nature & landscape, biodiversity losses, soil and water pollution, urban effects
EUR per 1 000 pkm
CE Delft et al. 2011
Average external costs (excluding congestion) for road transport are more than four times higher than rail for passenger services and more than six times higher for freight services.
Average EU27 external costs (excluding congestion): freight transport
10,217
0,2
6,7
8,4
1,15,4
9,8
14,9
0,9
3,6
1,8
2,5
1
3
4,7
4,2
1,3
2,5
3,1
0,50,9
0
10
20
30
40
50
60
HDV Road, Total Rail Inland waterwaysAccidentsAir pollutionCC HighNoiseUp- and downstreamOther cost categories: nature & landscape, biodiversity losses, soil and water pollution, urban effects
EUR per 1 000 tkm
CE Delft et al. 2011

ExTERNAL COSTS
42
The current level of internalisation of external costs varies across the differ-ent modes of transport. For road freight transport, charging is restricted under EU law for HGVs (lorries) in particular. The charging of HGVs is regu-lated by Directive 1999/62/EC (the “Eurovignette” Directive). In the most re-cent revision of the Eurovignette Directive, completed in 2011, EU member states were finally allowed to set charges for air pollution and noise if they wish.
EU transport sector tomorrowThe European Commission has acknowledged that greater internalisation of external costs using market-based instruments would lead to a more ef-ficient use of infrastructure, reduce the negative side effects of transport, and improve fairness between modes. In 2008, the European Commission laid down a common methodology for the charging of all external costs across the whole transport sector. This was developed further in the 2011 Transport White Paper, which emphasised the role that price signals can play. “Trans-port charges and taxes must be restructured in the direction of wider applica-tion of the “polluter-pays” and “user-pays” principle, … the overall burden for the sector should reflect the total costs of transport including infrastructure and external costs,” it stated. It added that full cost charging would generate revenues and allow for a funding stream to finance future transport invest-ments. The White Paper envisages the full and mandatory internalisation of external costs for road and rail transport taking place by 2020.

43
Road-rail comparisonThe bar chart below compares the accident and climate costs generated by 100 tonnes of average goods being transported from London to Warsaw by train and by road. The values are calculated using the online External Cost calculator, which calculates the climate change and accident costs of any freight journey across Europe.
Accident and climate costs generated by road and rail freight, London - Madrid
0
200
400
600
800
1000
1200
1400
1600
1800
Truck Train
Climate cost
Accident cost
(Calculations assume low IMPACT handbook values for climate costs, and marginal accident IMPACT costs for lorries and average accident IMPACT cost for rail.)
www.externalcost.eu
The average external accident costs for rail for this journey are nearly 50 times lower than for road, while the climate costs are four times lower.

R A I L T R A N S P O R T A N D E N V I R O N M E N T

R A I L T R A N S P O R T A N D E N V I R O N M E N T
45
8Targets and vision
In 2008 CER adopted voluntary targets for greenhouse gas emissions. These were later developed and expanded in partnership with UIC to include targets to be achieved by 2020 and 2030 in addition to a vision for 2050. In 2010 both UIC and CER formally approved the targets and vision for the four most important environmental impacts associated with the European rail sector. Following a decade of strong performance, in 2015 the sector agreed to a greater level of ambition for reducing green house gas emissions.
The Sustainable Mobility targets are summarized in the table below.
Topic Baseline Horizon Targets and vision
Climate protection
1990 2020 - 40 % CO2 pkm and tkm*
1990 2030 - 50 % CO2 pkm and tkm
1990 2030 Total CO2 emissions 30 % below the baseline*
2050 Carbon Free Operation
Energy efficiency
1990 2030 - 30 % consumption pkm and tkm
1990 2050 - 50 % consumption pkm and tkm
Air quality2005 2030 - 40 % total PM and NOx
2050 Zero Emission
Noise and vibration 2050 No longer a problem for the
railways* targets updated in 2015
The rail sector vision for 2050 � Rail is at the heart of an integrated, attractive transport system in which each mode plays to its strengths, enabling a more competitive European economy
� Rail is central to delivery of a strategy that has resulted in a massive cut in Greenhouse Gas (GHG) emissions, reduced oil dependency and miti-gated the challenge of congestion
� Rail is the enabling factor for sustainable mobility that underpins economic growth and a dynamic society

R A I L T R A N S P O R T A N D E N V I R O N M E N T
R A I L T R A N S P O R T A N D E N V I R O N M E N T
9
47
European transport: core statistics
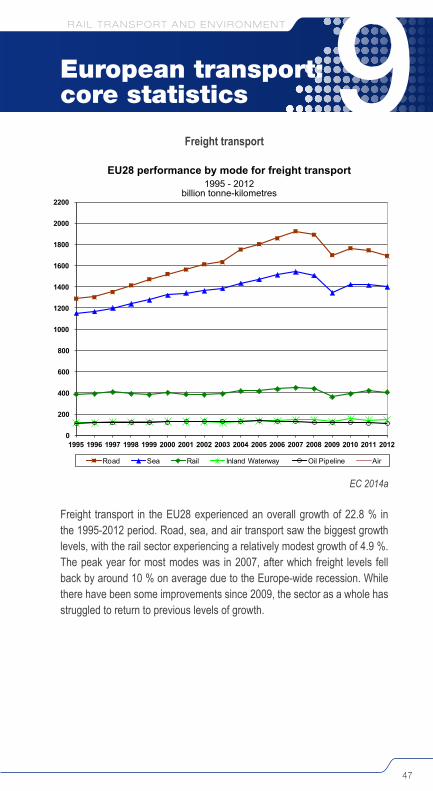
Freight transport
EC 2014a
0
200
400
600
800
1000
1200
1400
1600
1800
2000
2200
1995 1996 1997 1998 1999 2000 2001 2002 2003 2004 2005 2006 2007 2008 2009 2010 2011 2012
EU28 Performance by Mode for Freight Transport1995 - 2012
billion tonne-kilometres
Road Sea Rail Inland Waterway Oil Pipeline Air
Freight transport in the EU28 experienced an overall growth of 22.8 % in the 1995-2012 period. Road, sea, and air transport saw the biggest growth levels, with the rail sector experiencing a relatively modest growth of 4.9 %. The peak year for most modes was in 2007, after which freight levels fell back by around 10 % on average due to the Europe-wide recession. While there have been some improvements since 2009, the sector as a whole has struggled to return to previous levels of growth.
EU28 performance by mode for freight transport1995 - 2012
billion tonne-kilometres

EuropEan transport: corE statistics
48
Freight Transport in EU28 billion tonne-kilometres
Road Rail Inland Water- ways
Pipe- lines Sea Air Total
1995 1289 388 122 115 1154 2 3069
2000 1522 405 134 127 1323 2 3513
2005 1803 416 139 138 1471 3 3969
2010 1764 394 156 122 1424 3 3862
2011 1745 422 142 118 1417 3 3847
2012 1693 407 150 115 1401 3 3768
1995 - 2012 31.3 % 4.9 % 22.8 % - 0.1 % 21.4 % 25.8 % 22.8 %
per year 1.6 % 0.3 % 1.2 % - 0.0 % 1.1 % 1.4 % 1.2 %
EC 2014a
Passenger transport
0
100
200
300
400
500
600
700
800
900
1000
0
500
1000
1500
2000
2500
3000
3500
4000
4500
5000
1995 1996 1997 1998 1999 2000 2001 2002 2003 2004 2005 2006 2007 2008 2009 2010 2011 2012
Scal
e fo
r oth
er m
odes
Pass
enge
r Ca
rs s
cale
EU28 Performance by Mode for Passenger Transport1995 - 2012
billion passenger-kilometres
Passenger Cars Buses & Coaches AirRailways Powered 2-wheelers Tram & MetroSea
EC 2014a
EU28 performance by mode for passenger transport1995 - 2012
billion passenger-kilometres

49
Passenger activity grew slightly slower than freight, at 19 % over the 1995-2012 period, but it weathered the 2007-09 financial downturn much better. The aviation sector experienced the biggest growth, helped by the lack of fuel tax or VAT on ticket sales, although it was also the only sector to experi-ence a significant drop in traffic in the two years following the financial crisis of 2007. The rail sector saw an overall growth of 19 % during 1995-2012 while tram and metro systems saw a growth of nearly 31 %.
Passenger Transport in EU28 billion passenger-kilometres
Passenger cars
Two-wheel engine
Bus & Coach Railway Tram &
Metro Air Sea Total
1995 3 937 116 504 352 72 348 44 5 372
2000 4 358 108 549 372 78 460 42 5 966
2005 4 597 124 541 380 84 530 42 6 297
2010 4 721 122 528 407 92 526 40 6 435
2011 4 703 125 529 415 93 579 39 6 484
2012 4 613 126 526 418 94 577 38 6 391
1995 -2012 17.2 % 8.1 % 4.4 % 19.0 % 30.9 % 65.8 % - 15.1 % 19.0 %
per year 0.9 % 0.5 % 0.3 % 1.0 % 1.6 % 3.0 % - 1.0 % 1.0 %
EC 2014a
Railway track length in use by countryThe reduction in the length of railway lines within Europe over the last four decades - railway lines in the EU28 have shrunken by 13 % since 1970 - is clearly shown in this table. The increases in passenger-km and tonne-km that have occurred over the last 20 years are a sign of the increased ef-ficiency of the European railways, as they have taken place despite a shrink-ing infrastructure.

EuropEan transport: corE statistics
50
1970 1980 1990 2000 2010 2012of which electri-
fied 2012%
EU28 248,269 240,629 237,671 220,583 215,519 215,734 115,508 54EU15 175,274 168,150 162,132 152,446 151,559 151,981 86,957 57
BE 4,605 3,971 3,479 3,471 3,582 3,582 3,064 86BG 4,196 4,341 4,299 4,320 4,097 4,070 2,862 70CZ 9,444 9,468 9,469 3,217 34DK 2,352 2,015 2,838 2,787 2,646 2,628 621 24DE 43,777 42,765 40,981 36,588 33,707 33,509 19,830 59EE 1,227 993 1,026 968 787 792 132 17IE 2,189 1,987 1,944 1,919 1,919 1,919 52 3EL 2,602 2,461 2,484 2,385 2,552 2,554 438 17ES 15,850 15,724 14,539 14,347 15,837 15,922 9,654 61FR 37,582 34,362 34,070 29,272 29,871 30,581 16,583 54HR 2,411 2,437 2,429 2,726 2,722 2,722 984 36IT 16,073 16,138 16,066 16,187 17,022 17,060 12,126 71CY - - - - - - - -LV 2,606 2,384 2,397 2,331 1,897 1,860 250 13LT 2,015 2,008 2,007 1,905 1,767 1,767 122 7LU 271 270 271 274 275 275 262 95HU 8,487 7,836 7,838 8,005 7,893 7,877 3,014 38MT - - - - - - - -NL 3,147 2,880 2,798 2,802 3,013 3,013 2,266 75AT 5,901 5,857 5,624 5,665 5,039 4,894 3,468 71PL 26,678 27,181 26,228 22,560 19,702 19,617 11,860 60PT 3,588 3,609 3,064 2,814 2,842 2,541 1,630 64RO 11,012 11,110 11,348 11,015 10,777 10,777 4,032 37SI 1,055 1,058 1,196 1,201 1,228 1,209 500 41SK 3,660 3,662 3,622 3,593 1,578 44FI 5,804 6,075 5,867 5,854 5,919 5,944 3,172 53SE 12,203 12,006 11,193 11,037 11,160 11,136 8,194 74UK 19,330 18,030 16,914 17,044 16,175 16,423 5,597 34ME 249 239 214 90MK 673 696 699 699 699 234 33RS 3,809 3,809 1,279 34TR 7,985 8,387 8,429 8,671 9,594 9,642 2,840 29IS - - - - - - - -NO 4,242 4,242 4,044 4,413 4,199 4,264 2,489 58CH 3,161 3,178 3,215 3,216 3,597 3,551 3,550 100
UIC data; EC 2014a. Figures in italics are estimates

51
High-speed rail networkHigh-speed lines continue to be built across Europe as they are popular with passengers and politicians alike, and offer a credible alternative to fly-ing. If the EU successfully decarbonises electricity generation by 2050 as is planned, the rail sector will be able to offer carbon-free train operation and provide society with a fast, climate-neutral transport option.
Length of lines (km) or sections of lines on which trains can go faster than 250 km/h at some point during the journey
Belgium Germany Spain France Italy Nether-lands Austria
United King-dom
EU
1981 301 150 451 1983 417 150 567 1984 417 224 641 1985 419 224 6431986 419 224 6431987 419 224 6431988 90 419 224 7331989 90 710 224 1,0241990 90 710 224 1,0241991 199 710 224 1,1331992 199 471 710 248 1,6281993 199 471 831 248 1,7491994 447 471 1,177 248 2,3431995 447 471 1,281 248 2,4471996 447 471 1,281 248 2,4471997 447 471 1,281 248 2,4471998 72 636 471 1,281 248 2,7081999 72 636 471 1,281 248 2,7082000 72 636 471 1,281 248 2,7082001 72 636 471 1,540 248 2,9672002 137 833 471 1,540 248 3,2292003 137 875 1,069 1,540 248 74 3,9432004 137 1,196 1,069 1,540 248 74 4,2642005 137 1,196 1,090 1,540 248 74 4,2852006 137 1,285 1,272 1,540 876 74 5,1842007 137 1,285 1,511 1,872 562 113 5,4802008 137 1,285 1,599 1,872 744 113 5,7502009 209 1,285 1,604 1,872 923 120 113 6,1262010 209 1,285 2,056 1,896 923 120 113 6,6022011 209 1,285 2,144 2,036 923 120 113 6,8302012 209 1,334 2,144 2,036 923 120 113 6,8792013 209 1,334 2,515 2,036 923 120 93 113 7,343
UIC high speed department; EC 2014a

EuropEan transport: corE statistics
52
Rail passenger usage by country
Country Rail Operator Passenger-km (millions) Year
EU
Austria ÖBB 10,667 2014
WB 789 2014
Belgium SNCB/NMBS 10,848 2014
Bulgaria BDZ 1,702 2014
Croatia HZ Passenger 927 2014
Czech Rep. CD 6,952 2014
Denmark DSB 5,765 2014
Estonia EVR 237 2012
Finland VR 3,874 2014
France SNCF 83,914 2014
Germany DB AG 79,340 2014
Greece TRAINOSE 1,413 2014
Hungary GvSEV/RÖEE 298 2014
MAV 5,491 2014
Ireland CIE 1,695 2014
Italy FS 38,612 2014
Latvia LDZ 71 2014
Lithuania LG 372 2014
Luxembourg CFL 373 2012
Netherlands NS 17,018 2014
Poland PKP 11,865 2014
Portugal CP 3,518 2014
Romania CFR Calatori 4,526 2014
Slovakia ZSSK 2,503 2014
Slovenia SZ 696 2014
Spain Euskotren 279 2011
FEVE 183 2011
FGC 804 2012
RENFE 23,753 2014

53
Sweden SJ 6,132 2014United Kingdom ATOC 59,170 2013
Eurostar 4,364 2011
NIR 321 2011
EFTA
Norway NSB 2,965 2014
Switzerland BLS 920 2014
SBB/CFF/FFS 17,570 2014
CEEC Bosnia- Herzegovina ZFBH 22 2014
ZRS 12 2014FYR of Macedonia MZ-T 99 2012
Montenegro ZICG 101 2008
Serbia ZS 617 2014
CIS
Belarus BC 7,796 2014
Moldova CFM 347 2012
Russian Fed. RZD 128,820 2014
Ukraine UZ 49,203 2012
Turkey TCDD 4,393 2012
Note: figures given are for the companies listed only, and will not necessarily cover all operators in each country.
UIC database

EuropEan transport: corE statistics
54
Rail freight usage by country
Country Rail Operator Tonne-km (millions) Year
EU
Austria ÖBB 15,653 2014
GKB 9 2011
Belgium SNCB/NMBS 5,439 2012
Bulgaria BDZ 1,778 2014
BRC 794 2014
Croatia HZ CARGO 2,119 2014
Czech Rep. CD 9,871 2014
Estonia EVR 4,807 2012
Finland VR 9,597 2014
France SNCF 32,012 2014
Germany DB AG 74,818 2014
Greece OSE 538 2009
Hungary FLOYD 243 2011
GySEV CARGO 433 2014
GySEV/RÖEE 692 2012
Ireland CIE 100 2014
Italy FS 10,322 2014
Latvia LDZ 15,257 2014
Lithuania LG 14,307 2014
Luxembourg CFL Cargo 189 2009
Poland PKP 32,017 2014
Portugal CP Carga 2,063 2014
Romania CFR MARFA 5,327 2014
CTV 632 2014
GFR 3,548 20142
TFG 319 2009
Slovakia ZSSK Cargo 6,888 2014
Slovenia SZ 3,847 2014

55
Spain Euskotren 14 2011
FEVE 388 2011
FGC 46 2014
RENFE 7,557 2014
EFTA
Switzerland BLS Cargo 1,035 2013
SBB/CFF/FFS 8,266 2014
CEEC
Bosnia-Herzegovina ZFBH 885 2014
ZRS 425 2014
FYR of Macedonia MZ-T 423 2012
Montenegro MONTECARGO 150 2010
Serbia ZS 2,589 2014
CIS
Belarus BC 44,997 2014
Moldova CFM 944 2012
Russian Fed. RZD 2,298,564 2014
Ukraine UZ 237,722 2012
Turkey TCDD 11,145 2014
Note: figures given are for the companies listed only, and will not necessarily cover all operators in each country.
UIC database

R A I L T R A N S P O R T A N D E N V I R O N M E N T

R A I L T R A N S P O R T A N D E N V I R O N M E N T
57
10Glossary
Term Explanation
Bunker (fuel) Fuel that powers the engine of a ship or aircraftCO2 (carbon dioxide)
A greenhouse gas, and by-product of any carbon combustion process (mostly involving fossil fuels) also exhaled by every living organism
Direct emissions
Emissions related directly to the on-board combustion of diesel or use of electricity
Electrified track Track provided with an overhead catenary or a third rail to permit electric traction
EU15 Members of the European Union as of the 1995 expansion (inclusion of Austria, Sweden and Finland)
EU27 Members of the European Union as of the 2007 expansion (inclusion of Romania and Bulgaria)
EU28 Members of the European Union as of the 2013 expansion (inclusion of Croatia)
Euro IV, V Emission standards for exhaust emissions from heavy duty vehicles sold in EU member states
Final energy demand
The energy (diesel or electricity) to be directly consumed by motive power units: the final energy consumption can be measured in terms of the volume of diesel consumed or electricity consumed at the pantograph
GHG (greenhouse gases)
Atmospheric gases that have a global warming potential. The Kyoto Protocol specifies six greenhouse gases: carbon dioxide (CO2), methane (CH4), nitrous oxide (N2O), hydro-fluorocarbons (HFCs), perfluorocarbons (PFCs), and sulphur hexafluoride (SF6)
HGVs Heavy Goods Vehicles (lorries)High-speed rail Generally assumed to be trains that travel above 250 km/h
on new lines and above 200 km/h on upgraded lines Indirect emissions
Emissions related to the initial energy provision (diesel production or electricity generation)
IPCC Intergovernmental Panel on Climate Change, the United Nations’ scientific advisory panel on climate change (www.ipcc.ch)
K-blocks Low-noise composite brake blocks fitted to all new freight wagons
Kyoto Protocol A 1997 international agreement linked to the United Nations Framework Convention on Climate Change, which sets in-ternationally binding reduction targets to reduce greenhouse gas emissions

R A I L T R A N S P O R T A N D E N V I R O N M E N TgLOSSARy
58
Term Explanation
Land take Area of land needed for a certain activity, e.g. railway tracks or stations, highways, cities, etc.
Lden A weighted average noise level over 24 hours that marks the threshold for excess exposure
Lnight A weighted average night-time noise level as defined in the Environment Noise Directive (2002/49/EC), and calculated over all the night periods of a year, typically 22:00 - 06:00
LL-blocks Low-noise composite brake blocks that can be retrofitted onto existing rail freight wagons
NOx (nitrogen oxides)
Generic term covering NO (nitric oxide) and NO2 (nitrogen dioxide), produced from the reaction of nitrogen and oxygen in the air during fuel combustion
Passenger-km (pkm)
Passenger-kilometres: 1 pkm = 1 passenger transported 1 kilometre
PM10, PM2.5 Particulate Matter – microscopic airborne particles, up to 10 and 2.5 microns in diameter respectively
Rolling stock Collective term for all powered and unpowered vehicles on a railway, including freight wagons, locomotives, passenger coaches, and multiple units
Specific emis-sions, specific consumption
The average emission or consumption rate, expressed in the rail sector per passenger-km or tonne-km
Tonne-km (tkm) Tonne-kilometres: 1 tkm = 1 tonne transported 1 kilometreTrain-km Train-kilometre: unit of measurement representing the move-
ment of a train over one kilometerTSI (Technical Specification for Interoperability)
Technical and operational standards that must be met in order to satisfy the essential requirements and ensure the interoperability of the European railway system
VOCs (Volatile Organic Compounds)
Chemicals used in many products that can evaporate into the air at room temperature
WTW (well-to-wheel)
The full life-cycle analysis of transport fuels and vehicles from extraction to final use
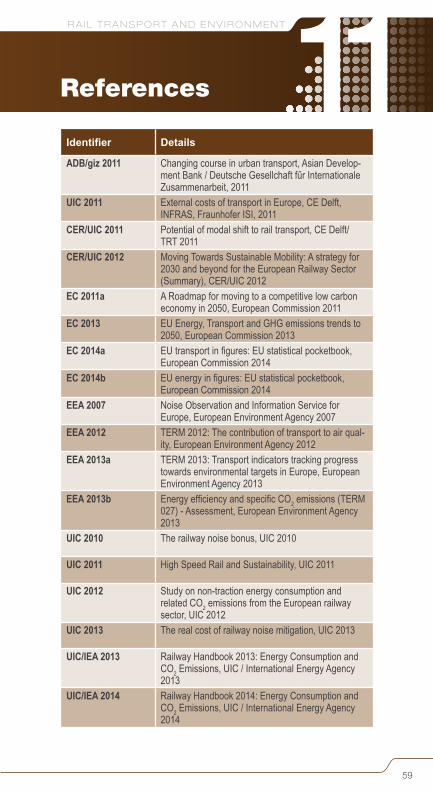
R A I L T R A N S P O R T A N D E N V I R O N M E N T
59
11References
Identifier Details
ADB/giz 2011 Changing course in urban transport, Asian Develop-ment Bank / Deutsche Gesellchaft fűr Internationale Zusammenarbeit, 2011
UIC 2011 External costs of transport in Europe, CE Delft, INFRAS, Fraunhofer ISI, 2011
CER/UIC 2011 Potential of modal shift to rail transport, CE Delft/TRT 2011
CER/UIC 2012 Moving Towards Sustainable Mobility: A strategy for 2030 and beyond for the European Railway Sector (Summary), CER/UIC 2012
EC 2011a A Roadmap for moving to a competitive low carbon economy in 2050, European Commission 2011
EC 2013 EU Energy, Transport and GHG emissions trends to 2050, European Commission 2013
EC 2014a EU transport in figures: EU statistical pocketbook, European Commission 2014
EC 2014b EU energy in figures: EU statistical pocketbook, European Commission 2014
EEA 2007 Noise Observation and Information Service for Europe, European Environment Agency 2007
EEA 2012 TERM 2012: The contribution of transport to air qual-ity, European Environment Agency 2012
EEA 2013a TERM 2013: Transport indicators tracking progress towards environmental targets in Europe, European Environment Agency 2013
EEA 2013b Energy efficiency and specific CO2 emissions (TERM 027) - Assessment, European Environment Agency 2013
UIC 2010 The railway noise bonus, UIC 2010
UIC 2011 High Speed Rail and Sustainability, UIC 2011
UIC 2012 Study on non-traction energy consumption and related CO2 emissions from the European railway sector, UIC 2012
UIC 2013 The real cost of railway noise mitigation, UIC 2013
UIC/IEA 2013 Railway Handbook 2013: Energy Consumption and CO2 Emissions, UIC / International Energy Agency 2013
UIC/IEA 2014 Railway Handbook 2014: Energy Consumption and CO2 Emissions, UIC / International Energy Agency 2014

16 rue Jean Rey - F 75015 PARISwww.uic.org/etf
ETFEditions Techniques FerroviairesRailway Technical PublicationsEisenbahntechnische Publikationen

ISBN 978-2-7461-2400-4
Warning
No part of this publication may be copied, reproduced or distributed by any means whatsoever, including electronic, except for private and individual use, without the express permission of the International Union of Railways (UIC) and of the Community of European Railway and Infrastructure Companies (CER). The same applies for translation, adaptation or transformation, arrangement or reproduction by any method or procedure whatsoever. The sole exceptions – noting the author’s name and the source – are «analyses and brief quotations justified by the critical, argumentative, educational, scientific or informative nature of the publication into which they are incorporated» (Articles L 122-4 and L122-5 of the French Intellectual Property Code).
© Copyright UIC / CER - Paris, 2015
Published by:UIC - ETF (Railway Technical Publications)
16, rue Jean Rey 75015 Paris - France
Coordination: Andrea Braschi, UIC - Ethem Pekin, CER Content: Matthew Ledbury
Design: Coralie Filippini, UIC-ETF
Photo credit: Fotolia
Dépôt légal September 2015
ISBN 978-2-7461-2400-4
UIC16 rue Jean Rey | 75015 ParisTel : +33 (0) 1 44 49 20 20 Fax : +33 (0) 1 44 49 20 29www.uic.org
CER53 Avenue des Arts | 1000 BrusselsTel : +32 (0)2 213 08 70Fax : +32 (0)2 512 52 31www.cer.be
September 2015