Embed Size (px)
Citation preview

PNNL-13624
Radionuclide Activities in Contaminated Soils: Effects of Sampling Bias on Remediation of Coarse-Grained Soils in Hanford Formation S. V. Mattigod W. J. Martin August 2001 Prepared for the U.S. Department of Energy under Contract DE-AC06-76RL01830
DISCLAIMER This report was prepared as an account of work sponsored by an agency of the United States Government. Neither the United States Government nor any agency thereof, nor Battelle Memorial Institute, nor any of their employees, makes any warranty, express or implied, or assumes any legal liability or responsibility for the accuracy, completeness, or usefulness of any information, apparatus, product, or process disclosed, or represents that its use would not infringe privately owned rights. Reference herein to any specific commercial product, process, or service by trade name, trademark, manufacturer, or otherwise does not necessarily constitute or imply its endorsement, recommendation, or favoring by the United States Government or any agency thereof, or Battelle Memorial Institute. The views and opinions of authors expressed herein do not necessarily state or reflect those of the United States Government or any agency thereof. PACIFIC NORTHWEST NATIONAL LABORATORY operated by BATTELLE for the UNITED STATES DEPARTMENT OF ENERGY under Contract DE-AC06-76RL01830
This document was printed on recycled paper. (8/00)

PNNL-13624
Radionuclide Activities in Contaminated Soils: Effects of Sampling Bias on Remediation of Coarse-Grained Soils in Hanford Formation S. V. Mattigod W. J. Martin August 2001 Prepared for the U.S. Department of Energy under Contract DE-AC06-76RL01830 Pacific Northwest National Laboratory Richland, Washington 99352

iii
Executive Summary The Remedial Action Sampling and Analysis Plan (RASAP) for the Hanford Site’s 100 Area soils requires sampling and analyzing the soil material for contaminants of concern (COC). However, the RASAP does not include a protocol for analyzing only a fine-grained fraction (sand, silt, and clay) and then relating the measured COC activities and concentrations in this fraction to those in the predomi-nantly coarse-grained (gravel) whole soils in the 100 Area. Selectively sampling only the finer fractions of a coarse-grained soil would introduce a systematic bias that results in consistently overestimating the actual activities and concentrations of COC in whole soil. Such sampling bias, if uncorrected, would result in over-remediation (remediating below the remedial action goal [RAG] levels) of these soils. Therefore, we conducted a study to assess the scope of this problem by analyzing available particle size-COC activity and concentration data for 100 and 300 Area soils, and determined the effects of sampling bias. Our recommendations include sampling protocols and methods to determine the COC activities and concentrations of the whole soil based on the measurements conducted on a finer size fraction of the whole soil. The important findings of our investigations are that 1. In gravelly soils (100 and 300 Areas), the activity and concentration of any COC per unit mass in any
finer fractional soil material was consistently biased higher than those of the same COC in the whole soil (all grain sizes sampled). The degree of sampling bias for each COC could be quantified as a sampling bias factor (SBF) that relates the activity and concentration in any finer size fraction of a soil to that in the whole soil.
2 The SBF for any COC in a soil increases with decreasing particle size sampled. SBFs for different
COC in a soil can vary significantly (up to an order of magnitude) depending on their chemical properties and affinity for specific mineral surfaces.
3. SBF for a single COC in soil samples obtained from different locations from the same waste site can
be significantly different (two to three times higher than the lowest value), reflecting spatial varia-bility engendered by the source, the type, and the distribution of contamination.
4. The SBF for a COC in soils from different waste sites were different, and these values were affected
by the soil texture, the degree, the source, and the distribution of contamination. 5. Waste site soils would be over-remediated (remediated below remedial action goal values) without
SBF corrections. SBF corrections could be made by using corrected remedial action levels (CRAL) computed from RAG and SBF (for selected particle-size finer) for each COC.
6. The soils in the vicinity of the 116-C-1 waste trench would be over-remediated (excavation of ~57%
to 280% of excess soil volume) without appropriate SBF corrections for contaminant radionuclides 60Co and 152Eu.

iv
Based on our analyses and conclusions, we recommend that
1. A sampling grid should be established (using a geostatistical basis) for each waste site, and represen-tative whole soil sample should be drawn from selected depth intervals as specified in ASTM C-702. The quantities of whole soil selected for analysis should be based on the standard practice as specified in ASTM D-2487-98 (Appendix A).
2. The particle size and COC distribution in soil samples should be determined by wet sieving (ASTM
D 422), and each soil fraction of each sample should be chemically and radiologically characterized. 3. The SBF for each COC for a specified particle size finer and CRAL values for each COC in each
sampling grid should be computed. 4. During remediation, representative soil samples for the same specified particle size finer should be
drawn for monitoring the activity/concentration of each COC and sample grid, and relevant COC-specific CRAL values should be used to establish the limits of remediation.
v
Acknowledgments The authors wish to thank R. Jeff Serne of the Pacific Northwest National Laboratory and Dr. Scott Petersen of Bechtel Hanford, Inc. for providing technical reviews of this document. We also thank Sheila Q. Bennett for editorial assistance and Lila Andor and Kathy Neiderhiser of the Pacific Northwest National Laboratory for text processing.

vii
Acronyms CERCLA Comprehensive Environmental Response, Compensation, and Liability Act COC contaminants of concern cpm counts per minute CRAL corrected remedial action level DOE U.S. Department of Energy DOT Department of Transportation EPA U.S. Environmental Protection Agency NPL National Priorities List OU Operable Unit PQL practical quantitation limit RAG remedial action goal RASAP Remedial Action Sampling and Analysis Plan RAWP Remedial Action Work Plan RDR Remedial Design Report ROD Record of Decision SBF sampling bias factor USCS Unified Soil Classification System WHC Westinghouse Hanford Company

ix
Contents Executive Summary ........................................................................................................................... iii Acknowledgments.............................................................................................................................. v Acronyms........................................................................................................................................... vii 1.0 Introduction ............................................................................................................................... 1.1 2.0 Waste Sites and Soil Samples from the 100 and 300 Areas ...................................................... 2.1 2.1 Location of Waste Sites..................................................................................................... 2.1 2.2 Waste Disposal Sites and Sources of Contamination........................................................ 2.2 2.3 Soil Sample Collection...................................................................................................... 2.8 2.4 Soil Characterization Data Sources................................................................................... 2.9 3.0 Contaminant Activity-Particle Size Data Analysis.................................................................... 3.1 3.1 Particle Size and Contaminant Activity Data Sources ...................................................... 3.1 3.2 Particle Size Distribution .................................................................................................. 3.1 3.3 Particle Size-Contaminant Activity/Concentration Relationships .................................... 3.3 3.4 Sampling Bias Factor ........................................................................................................ 3.3 3.5 Sampling Bias and Over-Remediation of Whole Soils ..................................................... 3.7 4.0 Effects of Sampling Bias on Remediation Limits for 116-C-1 Waste Trench— A Preliminary Assessment......................................................................................................... 4.1 5.0 Conclusions and Recommendations .......................................................................................... 5.1 6.0 References ................................................................................................................................. 6.1 Appendix A – ASTM Specifications for Minimum Sample Quality Needed for Accurate Particle Size Analysis of Soils ................................................................................... A.1 Appendix B – Radionuclide Activity and Mass Relationship ........................................................... B.1

x
Figures 1.1 Location of the Hanford Site ..................................................................................................... 1.2 2.1 Generalized Geologic Cross-Section at 100-B and C Areas at Hanford ................................... 2.1 2.2 Location of 116-C-1 Waste Trench in the 100-BC-1 Operable Unit......................................... 2.2 2.3 An Aerial View of 116-C-1 Waste Trench in 100-BC-1 Operable Unit ................................... 2.3 2.4 Location of the 116-D-1B Liquid and Sludge Waste Trench in the 100-D/DR Area ............... 2.5 2.5 An Oblique Aerial View of 100-D-1B Waste Trench ............................................................... 2.6 2.6 Location of the 116-F-4 Pluto Crib in the 100-FR-1 Operable Unit ......................................... 2.6 2.7 Location of North Process Pond in the 300-FF-1 Operable Unit .............................................. 2.7 2.8 An Oblique View of North and South Process Ponds in the 300-FF-1 Operable Unit ............. 2.8 3.1 Particle Size Distribution for 116-C-1 and 116-D-1B Trenches and 116-F-4 Pluto Crib Soils ................................................................................................................................... 3.2 3.2 Particle Size Distribution for Sediment Samples from North Process Pond in the 300 Area .................................................................................................................................... 3.2 3.3 Particle Size-Radionuclide Activity Relationship for Soil from 116-C-1 Trench..................... 3.4 3.4 Particle Size-Radionuclide Activity Relationship for Soil from 116-D-1B Trench .................. 3.4 3.5 Particle Size-Radionuclide Activity Relationship for Soil from 116-F-4 Pluto Crib ................ 3.4 3.6 Particle Size-Radionuclide Activity Relationship for Soil Samples from North Process Pond Located in 300-FF-1 Operable Unit ................................................................................. 3.4 3.7 Particle Size-Concentration Relationships for Selected Inorganic Constituents in the B01F93-NPT-3 Soil Sample from North Process Pond ............................................................ 3.5 3.8 Sampling Bias Factors for 60Co and 152Eu in Soil from 116-C-1 Trench .................................. 3.6 3.9 Sampling Bias Factors for 60Co, 137Cs, and 152Eu in Soil from 116-D-1B Trench .................... 3.6 3.10 Sampling Bias Factors for 137Cs and 152Eu in Soil from 116-F-4 Pluto Crib............................. 3.6

xi
3.11 Sampling Bias Factor for 238U in North Process Pond Soil ....................................................... 3.6 3.12 Sampling Bias Factors for Selected Trace Metal Contaminants in B01F93-NPT-3 Soil Sample from North Process Pond.............................................................................................. 3.7 3.13 Activity of 60Co in Remediated Whole Soil Without SBF Corrections..................................... 3.8 3.14 Activities of 60Co, 137Cs, and 152Eu in Remediated Whole Soil Without SBF Corrections ....... 3.8 3.15 Activity of 137Cs in Remediated Whole Soil Without SBF Corrections.................................... 3.8 3.16 Activity of 238U in Remediated Whole Soil Without SBF Corrections ..................................... 3.8 4.1 Depth Distribution of Corrected 60Co Activities Along a Longitudinal Transect Through 116-C-1 Waste Trench............................................................................................................... 4.2 4.2 Depth Distribution of Corrected 152Eu Activities Along a Longitudinal Transect Through 116-C-1 Waste Trench............................................................................................................... 4.3 4.3 Estimated Area of Contamination from Radionuclide Distribution Along a Longitudinal Transect Through 116-C-1 Waste Trench ................................................................................. 4.4
Tables 2.1 Average Activities of Radionuclides in Selected Waste Disposal Trenches and a Crib in the 100-BC-1, 100-DR-1, and 100-FR Operable Units......................................................... 2.4 2.2 Characterization Matrix for Soil Samples from Selected Waste Sites from 100 and 300 Areas, Hanford.................................................................................................................... 2.10 3.1 Classification of Selected Soils from the Waste Sites in 100 and 300 Areas at Hanford.......... 3.1 3.2 Sampling Bias Factors for Analytes for Selected Sampling of Silt and Clay Soil Materials .... 3.5 3.3 Radionuclide Activities in Whole Soil Based on Biased Sampling of Soil Material Finer than Sand.......................................................................................................................... 3.9 3.4 Corrections Remedial Action Levels for Contaminant Radionuclides for Biased Sampling of Soil Particles Finer than Gravel and Sand............................................................................. 3.10 4.1 Estimates of Contaminated Soil Volume Surrounding the 116-C-1 Waste Trench .................. 4.5

1.1
1.0 Introduction The Hanford Site is a federal facility that occupies an area of 560 square miles. It is situated within the semiarid Pasco Basin in southeastern Washington State (Figure 1.1). During the years between 1943 and 1990, these facilities were used to produce fissionable nuclear materials. Following the cessation of these activities in 1990, the primary goal at the Hanford Site was shifted towards remediation of contami-nated facilities, soil, and groundwater. The extensive contamination at the Hanford Site resulted in many large areas of the site, the 100, 200, 300, and 1100 Areas, being included on the National Priorities List (NPL) compiled under the Comprehensive Environmental Response, Compensation, and Liability Act (CERCLA) by the U.S. Environmental Protection Agency (EPA). The 100 Area of the Hanford Site contains nine inactive nuclear reactors that were operated for the production of fissionable material. All these water-cooled reactors (B, C, D, DR, F, H, KE, KW, and N) situated along the southern bank of the Columbia River have been shut down and are now being evaluated for decommissioning. Waste streams that were generated during the operation of these reactors were disposed of in the vicinity, resulting in widespread contamination of both soil and water. The bulk of the contamination originated from the disposal of very large volumes of reactor cooling water containing both fission and activation products. As part of the remediation activities in the 100 Area, each of these nine reactor sites has been divided into distinct Operable Units (OU). Records of Decision (ROD) have been concluded for several OU in the 100 Area (EPA 1995, 1997), and the Remedial Design Report/Remedial Action Work Plan (RDR/RAWP) has been completed (DOE 1998a). Also, a Remedial Action Sampling and Analysis Plan (RASAP) for this area has been completed (DOE 1998b). Currently, the RASAP for the 100 Area soils requires sampling and analyzing the soil material for contaminants of concern (COC) during the remediation process. However, the RASAP does not include a protocol for analyzing only a fine-grained fraction (sand, silt, and clay) and relating the measured COC activities/concentrations in this fraction to the COC activities/concentrations in the predominantly coarse-grained (gravel) whole soils in the 100 Area. Selectively sampling finer fractions of a coarse-grained soil would introduce a systematic bias that results in consistently overestimating the actual activities/ concentrations of COC in whole soil. Such sampling bias, if uncorrected, would result in over-remediation (remediating below the remediation action goal [RAG] levels) of these soils. The objectives of this study were to 1) examine currently available particle size-COC activity/ concentration data for 100 and 300 Area soils, 2) assess the effects of sampling bias, 3) suggest sampling protocols, and 4) formulate a method to determine the COC activities/concentrations of the whole soil based on the measurements conducted on a finer size fraction of the whole soil.

1.2
Figure 1.1. Location of the Hanford Site

2.1
2.0 Waste Sites and Soil Samples from the 100 and 300 Areas 2.1 Location of Waste Sites The 100 and 300 Areas of the Hanford Site are located in a structural basin (Pasco Basin) on the Columbia Plateau (see Figure 1.1). A generalized geologic cross-section through the 100-B and C Areas (Figure 2.1) shows a sequence of unconsolidated surfacial sedimentary deposits (Hanford formation). The topmost layer of this formation consists of a thin layer (1 to 15 ft thick) of light brown, fine, slightly silty, eolian deposits. The principal sediments of the Hanford formation underlying the surfacial layer range from 20 ft to several hundred feet in thickness and consist of poorly sorted, unconsolidated glaciofluvial material (Pasco gravels). The origin of these sedimentary deposits is believed to be the periodic cataclysmic floods that occurred during the late Pleiostocene epoch (Baker 1981; Mullineaux et al. 1977). The Pasco gravels are variable mixtures of particle sizes that range from boulders to silt. The bulk of Pasco gravels are very coarse-textured and are classified as silty sandy gravels typically consisting of about 50% gravel, 40% sand, and 10% silt and clay (DOE 1988). Mineralogically, these deposits consist of quartz, feld-spars, and ferromagnesian minerals (DOE 1992a). All the trenches and cribs that were engineered for waste disposal in the 100 and 300 Areas of the Hanford Site were located in the Pasco gravels. The Ringold Formation, ranging up to several hundred feet in thickness, underlies the Hanford formation. This formation, late Miocene to late Pleistocene in age, consists of stratified deposits of material ranging in size from gravel to clay. The uppermost unconfined aquifer system in the Hanford area, ranging up to 300 ft in depth, is located within the Hanford and Ringold Formations. The Saddle Mountain Basalt Formation underlies the stratified Ringold deposits.
Figure 2.1. Generalized Geologic Cross-Section at 100-B and C Areas at Hanford

2.2
2.2 Waste Disposal Sites and Sources of Contamination A literature survey indicated that only a limited set of particle size-contaminant concentration data is available for soils from the Hanford site. These data are based on a series of bench-scale tests conducted on single soil samples from one waste site each in 100-BC-1, 100-DR-1, and 100-FR-1 OUs (Mattigod et al. 1994 a,b), and three samples from the North Pond site of 300-FF-1 OU (Serne et al. 1992). There-fore, all additional data analyses conducted for this report were based on this limited data set. The 116-C-1 liquid waste trench is located in the 100-BC-1 OU of the 100 Area (Figures 2.2 and 2.3). This unlined trench is 500 ft long, 50 ft wide, and 16 ft deep. This trench received reactor cooling effluent from the 116-C-5 retention basin from 1952 to 1958. During this period, this trench received a
Figure 2.2. Location of 116-C-1 Waste Trench in the 100-BC-1 Operable Unit (from BHI-01119)

2.3
Sampling Locations I & II
Figure 2.3. An Aerial View of 116-C-1 Waste Trench in 100-BC-1 Operable Unit total estimated volume of 26 million gallons of effluent that was contaminated with activation and fission products caused by fuel-cladding failures in the 100-C Reactor. The 116-C-1 trench also received chromium-bearing wastes in the form of sodium dichromate (DOE 1992b). This trench was partially filled with rocks to prevent the spread of contamination by wind action. Based on the soil sampling conducted in 1976, the total volume of contaminated soil in this trench was estimated by Dorian and Richards (1978) to be about 100,000 yd3(600 by 150 by 30 ft). The average activities of radionuclides in the 116-C-1 trench are listed in Table 2.1. The activity data for soil in this trench indicate that 60Co, 137Cs, 152Eu, 154Eu, and 90Sr are the potential contaminants of concern. In 1995, about 11,690 m3 of material from this trench was removed as part of a 100-B/C Expedited Response Action Demonstration Project (DOE 1998a). The 116-D-1B liquid waste trench is located in the 100-DR-1 Operable Unit of the 100 Areas (Fig-ures 2.4 and 2.5). This trench is 100 ft long, 10 ft wide, and 15 ft deep. It was used mainly to dispose of radionuclide-contaminated sludge and water from the 118-D-6 fuel storage basin. This material origi-nated as the result of storing ruptured fuel elements in the 118-D-6 basin. The 116-D-1B trench was used from 1953 through 1967 and probably received a major fraction of sludge (estimated to be 110,000 lb) that originated in the fuel storage basin. Other contaminants disposed of in this trench included about

2.4
Table 2.1. Average Activities of Radionuclides in Selected Waste Disposal Trenches and a Crib in the 100-BC-1, 100-DR-1, and 100-FR-1 Operable Units(a)
Radionuclide
116-C-1 Trench (pCi/g)
116-D-1B Trench (pCi/g)
116-F-4 Pluto Crib
(pCi/g)
Hanford Background
(pCi/g)
Remedial Action Goals(c) Medial
Action Goals (pCi/g)60Co 7.6(b) 0.59(b) 0.02(a) 0.008 1.4 137Cs 21.4(b) 24.1(b) 877.6(a) 1.1 6.2 152Eu 31.5(b) 7.5(b) 2.2(a) NA 3.3 154Eu 21.7(b) 1.9(b) 12.9(a) 0.033 3.0 90Sr 5.7(b) 7.3(b) 573.9(a) 0.18 4.5 235U 0.2(c) 0.18(c) 1.3(b) 0.11 1.0 238U (d) (d) (d) 1.1 1.1 239/240Pu 0.74 0.48 35 0.025 33.9 Contaminated soil volume (cubic yards) 100,000 7,800 670 -- - (a) Data Sources: Average activities in trenches and crib (Dorian and Richards 1978), decay
corrected. Particle size of soils used for radionuclide measurements not known. (b) Hanford Background: DOE 1996. (c) RAG values for 100 Area soils: DOE 1998a. (d) Decay corrected to 2000. Samples from 116-D-1B obtained in 1993 near the trench inlet
(south side) indicated average activities of 5.6 pCi/g, for 60Co, 103.5 pCi/g for 137Cs, and 83.7 pCi/g for 152Eu, respectively. The results of the pilot-scale soil washing tests (116-D-1B) showed average activities of 0.34 pCi/g, for 60Co, 11.9 pCi/g for 137Cs, and 4.07 pCi/g for 152Eu, respectively (DOE 1995).
1,540 lb of sodium dichromate, 4,400 lb of either sodium formate or oxalate, and 4,400 lb of sodium sulfamate. After waste discharges were stopped in 1967, the trench was blanketed with a layer of clean soil. As a result of sampling and analyses of soils from this trench, the total volume of contaminated soil was estimated by Dorian and Richards (1978) to be about 7,800 yd3(150 by 40 by 35 ft). The average activities of radionuclides in this trench (Dorian and Richards 1978) are listed in Table 2.1. These data indicate that the radionuclide COC in this trench are 137Cs, 152Eu, and 90Sr. In 1995, a pilot-scale soil washing test was conducted, and 101.1 tons of material from this trench was processed (DOE 1995). The data collected during this field test indicated that the radionuclide COCs in this trench were mainly 137Cs and 152Eu. The 116-F-4 Pluto Crib is located in the 100-FR-1 Operable Unit (Figure 2.6). This Pluto Crib con-sisted of a cobble-filled 55-gal steel container with sealed top and open bottom resting on one end of an 6- by 6- by 6-ft zone of cobble-size aggregate (DOE 1994). This crib was one of the typical liquid disposal structures constructed below the ground surface with open bottoms. A distribution pipe dis-charged wastewater into the rockfill to generate uniform flow over the crib bottom. The top of the crib was backfilled with soil to provide protection from radiation. This structure received water from process tubes in the 100-F Reactor that had failed fuel claddings. This crib was used only for a short time (1952 to 1954) and was contaminated with activation and fission products. Based on the soil sampling con-ducted in 1976, the total volume of contaminated soil in this trench was estimated to be about 670 yd3

2.5
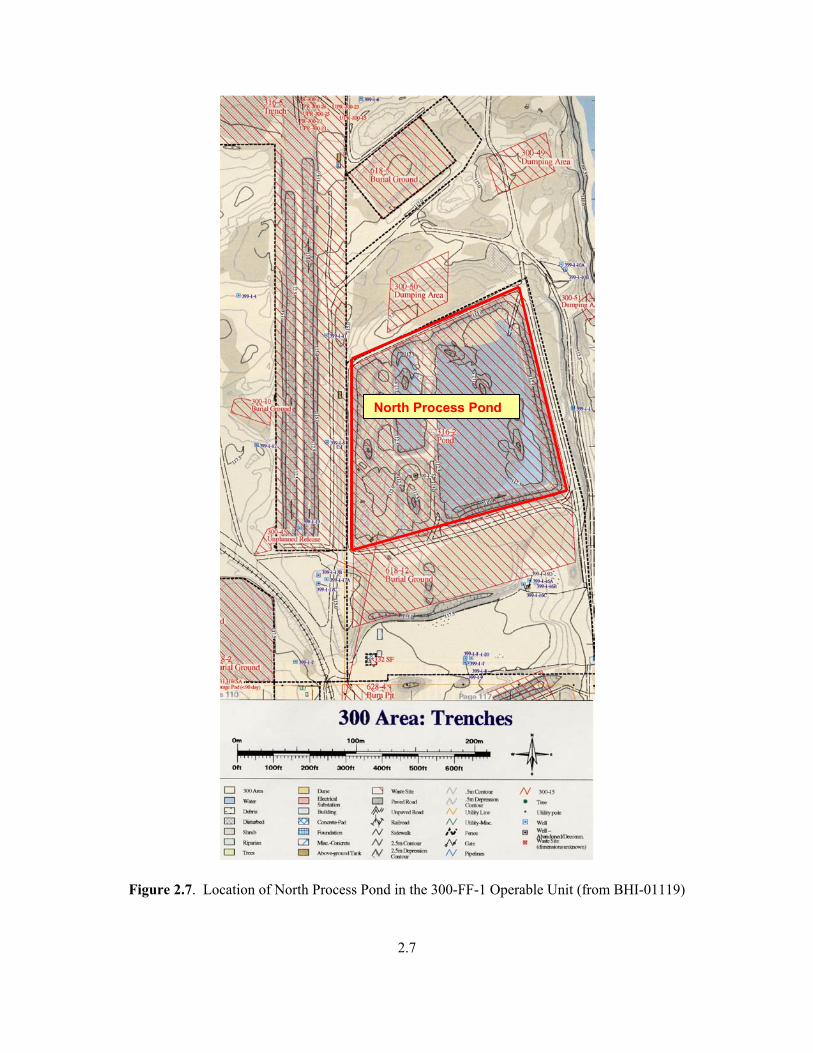
Figure 2.4. Location of the 116-D-1B Liquid and Sludge Waste Trench in the 100-D/DR Area (from BHI-01119) (30 by 30 by 20 ft) (Dorian and Richards 1978). The average activities of radionuclides for the 116-F-4 Pluto Crib are listed in Table 3.1. In 1994, this crib was excavated to a depth of 5.5 m (~4,500 yd3 of material) and the contaminated material was disposed of at the Environmental Restoration Disposal Facility (DOE 1994, 1998a). The North Process Pond (316-2) is in the northern part of 300-FF-1 Operable Unit in the Hanford 300 Area (Figures 2.7 and 2.8). This pond of about 4 hectares (~10 acres) was constructed in 1948 to receive low-level radioactive liquid wastes and sludges from the fuels fabrication process and liquid wastes from other types of operations in the 300 Area. Parts of the North Pond were also used to dispose of fly ash derived from a coal-burning power plant. The pond was dredged periodically to increase the infiltration rate. It was retired in 1974. A detailed description of waste discharge history, pond opera-tions, and organic, inorganic, and radioactive contaminants found in this pond can be obtained from several previously published reports (Dennison et al. 1989; Young et al. 1990; Young and Fruchter 1991). An analysis of the pond sediments conducted in 1992 indicated that activities of 235U and 238U, and con-centrations of Cr, Ni, Cu, Zn, Zr, Ag, and Sr were elevated above the background concentrations found in the uncontaminated sediments from the 300 Area (Serne et al. 1992).

2.6
116-D-1B Trench
Figure 2.5. An Oblique Aerial View of 100-D-1B Waste Trench
116-F-4 Pluto Crib
Figure 2.6. Location of the 116-F-4 Pluto Crib in the 100-FR-1 Operable Unit (from BHI-01119)
2.7
North Process Pond
Figure 2.7. Location of North Process Pond in the 300-FF-1 Operable Unit (from BHI-01119)
2.8
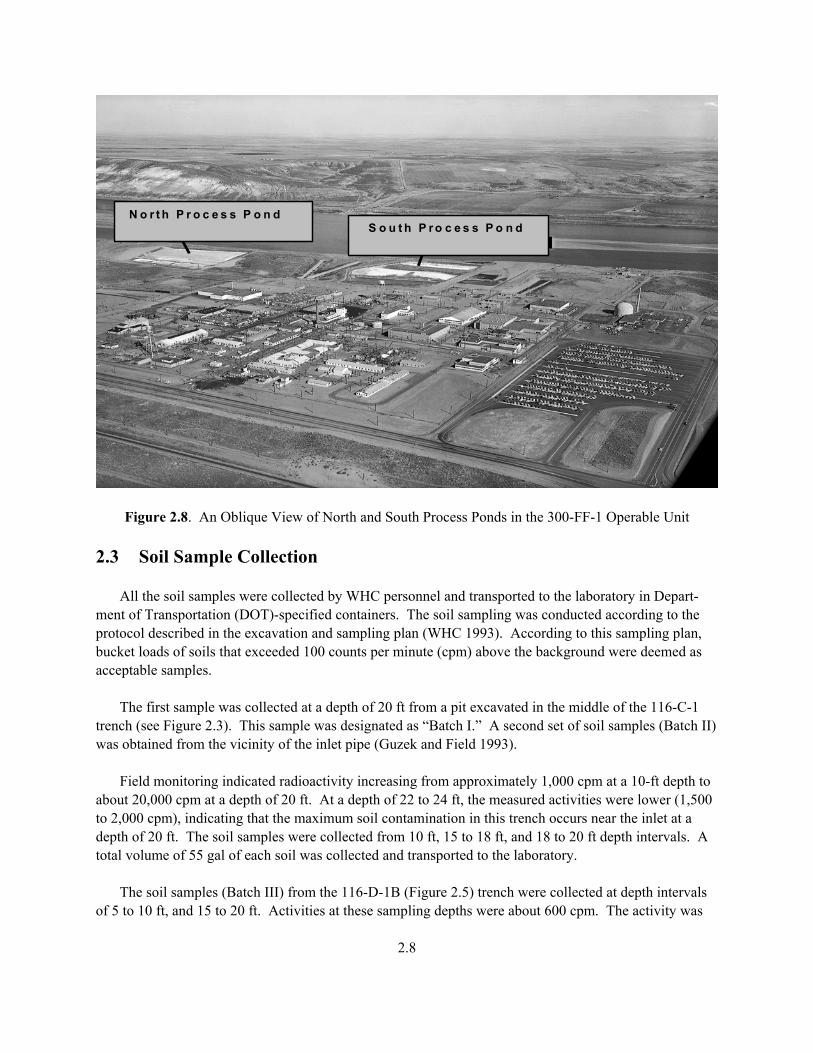
N o r t h P r o c e s s P o n d S o u t h P r o c e s s P o n d
Figure 2.8. An Oblique View of North and South Process Ponds in the 300-FF-1 Operable Unit 2.3 Soil Sample Collection All the soil samples were collected by WHC personnel and transported to the laboratory in Depart-ment of Transportation (DOT)-specified containers. The soil sampling was conducted according to the protocol described in the excavation and sampling plan (WHC 1993). According to this sampling plan, bucket loads of soils that exceeded 100 counts per minute (cpm) above the background were deemed as acceptable samples. The first sample was collected at a depth of 20 ft from a pit excavated in the middle of the 116-C-1 trench (see Figure 2.3). This sample was designated as “Batch I.” A second set of soil samples (Batch II) was obtained from the vicinity of the inlet pipe (Guzek and Field 1993). Field monitoring indicated radioactivity increasing from approximately 1,000 cpm at a 10-ft depth to about 20,000 cpm at a depth of 20 ft. At a depth of 22 to 24 ft, the measured activities were lower (1,500 to 2,000 cpm), indicating that the maximum soil contamination in this trench occurs near the inlet at a depth of 20 ft. The soil samples were collected from 10 ft, 15 to 18 ft, and 18 to 20 ft depth intervals. A total volume of 55 gal of each soil was collected and transported to the laboratory. The soil samples (Batch III) from the 116-D-1B (Figure 2.5) trench were collected at depth intervals of 5 to 10 ft, and 15 to 20 ft. Activities at these sampling depths were about 600 cpm. The activity was

2.9
observed to decline to a level of 150 to 200 cpm at a depth of approximately 22 to 24 ft. A total volume of 55 gal of soil was collected and transported to the laboratory in 11 5-gal containers. About 4,500 yd3 of soil including the material from the 116-F-4 Pluto Crib was excavated as part of an Excavation Treatability Test (DOE 1994). About 500 yd3 of this material was classified as contam-inated soil and stored in a modular storage unit. During excavation, the soils were treated with dust suppressants such as XDCA (a beet polysaccharide) and lignosulfate (a paper manufacturing byproduct). Samples of contaminated soil were collected from the modular storage unit by Westinghouse Hanford Company (WHC) personnel and transported to the laboratory in DOT-specified containers. A total volume of 40 gal of soil was collected and transported to the laboratory in eight 5-gal containers. Three bulk samples of sediments from North Process Pond were collected by WHC and sent to the laboratory. 2.4 Soil Characterization Data Sources The physical, chemical, and mineralogical properties of the soil samples obtained from these waste sites were characterized, and the results were published in a series of reports (Mattigod et al. 1994 a, b; Serne et al. 1992). The types of characterization data collected for these soil samples are listed in Table 2.2.

2.10
Table 2.2. Characterization Matrix for Soil Samples from Selected Waste Sites from 100 and 300 Areas, Hanford
Characterization 116-C-1
I & II 116-D-1B 116-F-4 NPP 316-2
Samples
Physical Characterization Moisture content ● ● ● ● Particle size distribution ● ● ● Specific gravity ● ● ●
Chemical Characterization Total organic carbon ● ● ● Soil pH ● ● ● Cation exchange capacity ● ● ● Total elemental analysis ● ● ● Selected radionuclide analysis as a function of particle size ● I ● ● ●
Metal analysis as a function of particle size ● TCLP ● II ● ● Sequential extraction ● II ● ● Attrition scrubbing of selected particle fractions ● ●
Autogenous grinding of gravel fractions ● II ● Mineralogical Characterization
Optical microscopy ● ● X-ray diffraction analysis ● ● SEM-EDX ● ● Auto radiography ● ●

3.1
3.0 Contaminant Activity-Particle Size Data Analysis 3.1 Particle Size and Contaminant Activity Data Sources Particle size distribution and particle size dependent contaminant activity/concentration data used in this analysis were derived from results of previous studies conducted on soils obtained from 100-C-1 and 100-D-1B waste disposal trenches and 116-F-4 Pluto Crib (Mattigod et al. 1994a, b). Additionally, infor-mation obtained from sampling and characterization of sediments from the North Process Pond disposal site (316-2) in the 300-FF-1 Operable Unit (Serne et al. 1992) was also used in our analysis. It is impor-tant to note that the following data analyses are based on single soil samples each from 116-D-1B, and 116-F-4 sites, one to two soil samples from 116-C-1, and three samples from 300 North Pond site. Therefore, these analyses of particle size-COC activity relationships are relevant only for the soil samples analyzed and do not represent the spatial variability expected at each of these waste sites. 3.2 Particle Size Distribution The particle size distribution data for the six soil samples (Figures 3.1, 3.2; Table 3.1) showed that all the soils are coarse-grained with gravel fractions ranging from ~42 to ~97% by mass. According to the Unified Soil Classification System (USCS) system, the soils from the 116-F-4 Pluto crib and the samples from the 300 Area North Pond were classified as well-graded gravels with sand. In contrast, the 116-C-1 (II) Trench soil was classified as a poorly graded gravel, and the soil from the 116-D-1B (III) Trench was categorized as a well-graded sand with silt and gravel. Except for the 116-D-1B Trench soil, all other soil samples were found to be typically coarser grained (~66-97% gravel and ~2–31% sand) than the average Pasco gravel (~50% gravel and ~40% sand) that constitutes the Hanford formation. Such soil textural differences may be attributable to the fact that waste sites were engineered with coarser soil material to increase rates of infiltration of liquid effluents.
Table 3.1. Classification of Selected Soils from the Waste Sites in 100 and 300 Areas at Hanford
Soil Sample Gravel (wt%)
Sand (wt%)
Silt and Clay (wt%) Group Name(a)
Group Symbol(a)
116-C-1 (II) trench 97.2 1.8 1.0 Poorly graded gravel GP 116-D-1B(III) trench 41.6 51.3 7.1 Well-graded sand with silt and
gravel SW-SM
116-F-4 pluto crib 80.7 17.2 2.1 Well-graded gravel with sand GW BO1F87-NPT-1 North Pond 72.4 27.3 0.3 Well-graded gravel with sand GW BO1F93-NPT-2 North Pond 70.4 25.8 3.9 Well-graded gravel with sand GW BO1F93-NPT-3 North Pond 66.3 30.6 3.1 Well-graded gravel with sand GW (a) Classification according to the Unified Soil Classification System (ASTM D2487-98).

3.2
0
10
20
30
40
50
60
70
80
90
100
0.01 0.1 1 10 100
Particle Size (mm)
Cum
ulat
ive
% F
iner
by
Wei
ght
BO1F87-NPT-1BO1F93-NPT-2BO1F93-NPT-3
GravelSandSilt, Clay
300 North Pond Soils
Figure 3.1. Particle Size Distribution for 116-C-1 and 116-D-1B Trenches and 116-F-4 Pluto Crib Soils
0
10
20
30
40
50
60
70
80
90
100
0.001 0.01 0.1 1 10 100
Particle size (mm)
Cum
ulat
ive
% F
iner
by
Wei
ght
116-F-4 Pluto Crib116-D-1B (III) Trench116-C-1 (II) Trench
GravelSandSilt, Clay
Figure 3.2. Particle Size Distribution for Sediment Samples from North Process Pond in the 300 Area

3.3
3.3 Particle Size-Contaminant Activity/Concentration Relationships The contaminant activity/concentration data for these samples were collected by wet sieving (Samples 116-C-1, 116-D-1B, and 116-F-4) or dry sieving (North Process Pond samples) representative material and counting or measuring the activities/concentrations in each size fraction. These data were used to develop a relationship between the activity/concentration for soil material finer than each selected particle size as follows: Af = Σ(Ai x mi)/mf (3.1) where Af = activity/concentration per unit mass in soil finer than selected particle size Ai = activity per unit mass in each particle size fraction mi = mass of each particle fraction mf = total mass of material finer than the selected particle size. The resulting particle size-contaminant activity/concentration relationships are depicted as a series of graphs (Figures 3.3 through 3.7). The data showed that, in all cases, the activity/concentration per unit mass in any fractional soil material finer than the whole soil were higher than the activity/concentration per unit mass of whole soil. Typically, the distribution curves for all contaminants in a soil are similar in shape, reflecting similar partitioning of each contaminant between particle size fractions in the soil. These data showed that the degree to which the activity/concentration in subfractional material exceeded the whole soil activity/concentrations depended on the particle size distribution and the distribution of COC in each size fraction. As an example, the consequence of such particle size-dependent contaminant activity/concentration relationship can be assessed by examining the 152Eu activity in 116-C-1 Trench soil (Figure 3.3). The 152Eu activities in this sample of whole soil (2.2 pCi/g) is well below the RAG of 3.3 pCi/g. However, if soil material finer than 2 mm is selectively sampled for 152Eu and the measured activity of 16.3 pCi/g is presumed to be representative of the whole soil, one could erroneously conclude that the volume of soil represented by this sample needs to be remediated. Similarly if material finer than medium sand (<0.25 mm) from 116-F-4 Pluto Crib is preferentially sampled and if 152Eu activity in this fraction (6.1 pCi/g) is assumed to represent the activity in whole soil sample, one can again mistakenly conclude that the 152Eu activity in this soil sample exceeds the RAG value of 3.3 pCi/g (Figure 3.5). These data clearly demonstrate that biased sampling of a finer particle size fraction of a soil would lead to the measured contaminant activity/concentration to be biased consistently higher than the actual contaminant activity in a soil. 3.4 Sampling Bias Factor Based on the data from activity/concentration and particle size relationship, it was possible to quantify the degree of bias if only finer particles of soil are sampled for activity/concentration

3.4
Figure 3.3. Particle Size-Radionuclide Activity Figure 3.4. Particle Size-Radionuclide Activity Relationship for Soil from 116-C-1 Trench Relationship for Soil from 116-D-1B Trench Figure 3.5. Particle Size-Radionuclide Activity Figure 3.6. Particle Size-Radionuclide Activity Relationship for Soil from 116-F-4 Pluto Crib Relationship for Soil Samples from North Process Pond (316-2) Located in 300-FF-1 Operable Unit measurements and these values attributed to the whole soil (includes all particle sizes). For each contami-nant in a soil, sampling bias factors (SBF) were calculated as a function of sampling material of less than a specified particle size. The SBF values were calculated as SBFij = [Σ(Ai x mi)/mf)/Ab]-1 (3.2) where SBF = sampling bias factor for ith particle size finer for jth contaminant Ab = activity/concentration per unit mass of whole soil Ai = activity per unit mass in each particle size fraction Mi = mass of each particle fraction mf = total mass of material finer than the selected particle size.
1.0
10.0
100.0
0.01 0.1 1 10 100
Particle Size (mm)
Radi
onuc
lide
Act
ivity
(pC
i/g) i
n Pa
rtic
le S
ize
Fine
rCo-60Eu-152
RAG 1.4 pCi/g
RAG 3.3 pCi/g
1
10
100
1000
0.01 0.1 1 10 100
Particle Size (mm)
Radi
onuc
lide
Act
ivity
(pC
i/g) i
n Pa
rtic
le S
ize
Fine
r
Cs-137Co-60Eu-152
RAG 6.2 pCi/g
RAG 1.4 pCi/g
RAG 3.3 pCi/g
1
10
100
1000
10000
0.01 0.1 1 10 100
Particle Size (mm)
Radi
onuc
lide
Activ
ity (p
Ci/g
) in
Parti
cle
Size
Fine
r
Cs-137Eu-152
RAG 6.2 pCi/g
RAG 3.3 pCi/g
1
10
100
1000
0.01 0.1 1 10 100Particle Size (mm)
U-23
8 Ac
tivity
in P
artic
le S
ize
Fine
r (p
Ci/g
)
BO1F87-NPT-1BO1F93-NPT-2BO1F93-NPT-3
Hanford Background 1.1pCi/g
RAG 350 pCi/g

3.5
For instance, if a representative sample of a whole soil (all particle sizes included) is counted for the activity of a selected radionuclide, the SBF for the radionuclide would be zero, indicating that there is no sampling bias. If, however, only particle sizes finer than the maximum particle size in a soil are sampled, a positive sample bias would result, indicating the degree to which the measured activities/concentrations exceed the activity/ concentration in a whole soil. The SBFs for each contaminant in each soil sample were plotted as a function of particle size finer (Figures 3.8 through 3.12). Also, values of SBF were tabulated (Table 3.2) for each soil for cases when sampling would be consistently conducted on particles finer than sand (<0.075 mm). These data indicated that, for a selected particle size finer sample,
1) SBF for any COC in a soil increases with decreasing particle size sampled.
2) SBFs for different COC in a soil can vary
significantly (up to an order of magnitude) depending on their chemical properties and affinity for specific mineral surfaces.
Table 3.2. Sampling Bias Factors for Analytes for Selected Sampling of Silt and Clay
(<0.075 mm) Soil Materials
100 Area Soil Samples 300 Area North Pond Samples Analyte 116-C-1 116-D-1B 116-F-4 NPT-1 NPT-2 NPT-3
Co60 4.2 7.7 -- -- -- -- Cs137 -- 4.7 7.0 -- -- -- Eu152 22.0 8.8 8.7 -- -- -- U238 -- -- -- 29.6 10.5 10.6 As -- -- -- 1.8 1.8 2.0 Cr -- -- -- 9.0 3.1 6.3 Hg -- -- -- 1.8 1.8 1.0 Pb -- -- -- 5.3 2.3 2.2 Zn -- -- -- 0.8 0.8 0.6
1
10
100
1000
0.01 0.1 1 10 100
Particle Size (mm)
Con
c. (m
g/kg
) in
Par
ticle
Siz
e Fi
ner
HgAsPbZnCr
Figure 3.7. Particle Size-Concentration Rela-tionships for Selected Inorganic Constituents in the B01F93-NPT-3 Soil Sample from North Process Pond (316-2)

3.6
0.00
5.00
10.00
15.00
20.00
25.00
0.01 0.1 1 10 100
Particle Size (mm)
Sam
plin
g Bi
as F
acto
r
Co-60Eu-152
0.00
2.00
4.00
6.00
8.00
10.00
0.01 0.1 1 10 100
Particle Size (mm)
Sam
plin
g Bi
as F
acto
r
Cs-137Co-60Eu-152
3) SBF for a single COC in soil samples obtained in different locations from the same waste site can be significantly different (two to three times higher than the lowest value) reflecting spatial variability engendered by the source, type and distribution of contamination.
4) SBF for COC in soils from different waste sites were different and these values were affected by
the soil texture, the degree, the source, and the distribution of contamination. Figure 3.8. Sampling Bias Factors for 60Co and Figure 3.9. Sampling Bias Factors for 60Co, 137Cs, 152Eu in Soil from 116-C-1 Trench and 152Eu in Soil from 116-D-1B Trench Figure 3.10. Sampling Bias Factors for 137Cs Figure 3.11. Sampling Bias Factor for 238U in and 152Eu in Soil from 116-F-4 Pluto Crib North Process Pond (316-2) Soil
0.00
2.00
4.00
6.00
8.00
10.00
0.01 0.1 1 10 100Particle Size (mm)
Sam
plin
g Bi
as F
acto
r
Cs-137Eu-152
0.0
5.0
10.0
15.0
20.0
25.0
30.0
35.0
0.01 0.1 1 10 100
Particle Size (mm)
U-23
8 Sa
mpl
ing
Bias
Fac
tor BO1F87-NPT-1
BO1F93-NPT-2BO1F93-NPT-3

3.7
3.5 Sampling Bias and Over-Remediation of Whole Soils
As discussed in previous section, bias sampling of a selected particle fraction results in overesti-mating COC activities/concentrations in whole soil. One of the major consequences of bias sampling is over-remediation of contaminated soils. Over-remediation is defined as the degree to which the activity/concentration of a contaminant in the remediated whole soil is lower than the specified RAG. The degree to which the over-remediation occurs can be calculated from using RAG and SBF values as follows: WSj = RAGj /(SBFij +1) 3.4 where WSj = activity/concentration of jth COC in whole soil RAGj = remedial action goal for jth COC SBFij = sampling bias factor for jth COC in ith particle size finer fraction. Calculated whole soil values for each contaminant radionuclide were graphed as a function of sampled particle size finer (Figures 3.13 through 3.16) and listed (Table 3.3) for particle size finer than sand (<0.075 mm). These data showed that, for samples of any particle size finer than the whole soil, the radionuclide activity in remediated whole soil would be consistently less than the specified RAG value. The degree of over-remediation increases with decreasing particle size sampled (Figure 3.13 through 3.16). As an example, if soil particles finer than sand are sampled preferentially, the activity of radionu-clides in remediated whole soil would be up to an order of magnitude lower than the RAG (Table 3.3). In some cases, the radionuclide activities in remediated whole soil would be up to an order of magnitude lower than the Hanford background activity (238U activity in 300 Area North Pond soil) and, in some cases, (60Co in 116-C-1 trench soil) lower than the rapid turnaround practical quantitation limit (PQL). Practical considerations dictate that whole soil from 100 and 300 Hanford Areas (containing gravel and even cobble-size material) cannot be sampled representatively and quantified rapidly under field conditions. Therefore, field sampling for rapid turnaround quantitation needs to be restricted specifically to soil particles finer than gravel or sand. To meet this requirement, it is essential to establish a relation-ship between measured activity/concentration in the sampled soil size fraction and the RAG for the whole
0.00
1.50
3.00
4.50
6.00
7.50
9.00
0.01 0.1 1 10 100
Particle Size (mm)
Sam
plin
g B
ias
Fact
or
HgAsPbZnCr
Figure 3.12. Sampling Bias Factors for Selected Trace Metal Contaminants in B01F93-NPT-3 Soil Sample from North Process Pond (316-2)

3.8
Figure 3.13. Activity of 60Co in Remediated Figure 3.14. Activities of 60Co, 137Cs, and 152Eu Whole Soil (116-C-1 Waste Trench) Without in Remediated Whole Soil (116-D-1B Waste SBF Corrections Trench) Without SBF Corrections Figure 3.15. Activity of 137Cs in Remediated Figure 3.16. Activity of 238U in Remediated Whole Soil (116-F-4 Pluto crib) Without SBF Whole Soil (Sample BO1F87-NPT-1 from North Corrections Process Pond, 316-2) Without SBF Corrections soil. These sampling bias corrected remedial action levels (CRAL) for the specified particle size finer (that would meet the whole-soil RAG) can be calculated using the appropriate RAG and SBF values as follows: CRALij = RAGj x (SBFij + 1) (3.5) where CRALij = Corrected remediation action level for jth contaminant in ith particle size finer RAGj = Remedial action goal for jth contaminant SBFij = Sampling bias factor for jth contaminant in ith particle size finer.
0.001
0.01
0.1
1
10
0.01 0.1 1 10 100
Particle Size (mm)
Co-
60 A
ctiv
ity (p
Ci/g
) in
Who
le S
oil
Hanford Background
RAG 1.4 pCi/g
0.001
0.01
0.1
1
10
0.01 0.1 1 10 100Particle Size (mm)
Radi
onuc
lide
Act
ivity
(pC
i/g) i
n W
hole
Soi
l
Cs-137Co-60Eu-152
Remedial Action Goal Hanford Background
0.1
1
10
0.01 0.1 1 10 100
Particle Size (mm)
Cs-
137
Act
ivity
(pC
i/g) i
n W
hole
Soi
l
RAG 6.2 pCi/g
Hanford Background
1
10
100
1000
0.01 0.1 1 10 100Particle Size (mm)
U-23
8 Ac
tivity
in W
hole
Soi
l (pC
i/g)
Hanford Background 1.1 pCi/g
RAG 350 pCi/g

3.9
Table 3.3. Radionuclide Activities in Whole Soil Based on Biased Sampling of Soil Material Finer than Sand (<0.075 mm)
100 Area Soil Samples (pCi/g)
300 Area NP Sample (pCi/g) Radio-
nuclide 116-C-1 116-D-1B 116-F-4 NPT-1 RAG
(pCi/g)
Hanford Background
(pCi/g) PQL
(pCi/g)
Co60 0.3 0.2 -- -- 1.4 0.008 0.7 Cs137 -- 1.1 0.8 -- 6.2 1.1 0.7 Eu152 -- 0.3 -- -- 3.3 NA(b) 0.1(c)
U238 -- -- -- 11.4 350(a) 1.1 1.0(c)
(a) RAG values are 350 pCi/g for 300 Area soils (DOE 1997) and 1.1 pCi/g for 100 Area soils (DOE 1998a).
(b) Not Available, not measured during background study. (c) Practical Quantitation Limit (PQL) not attainable for rapid turnaround measurements,
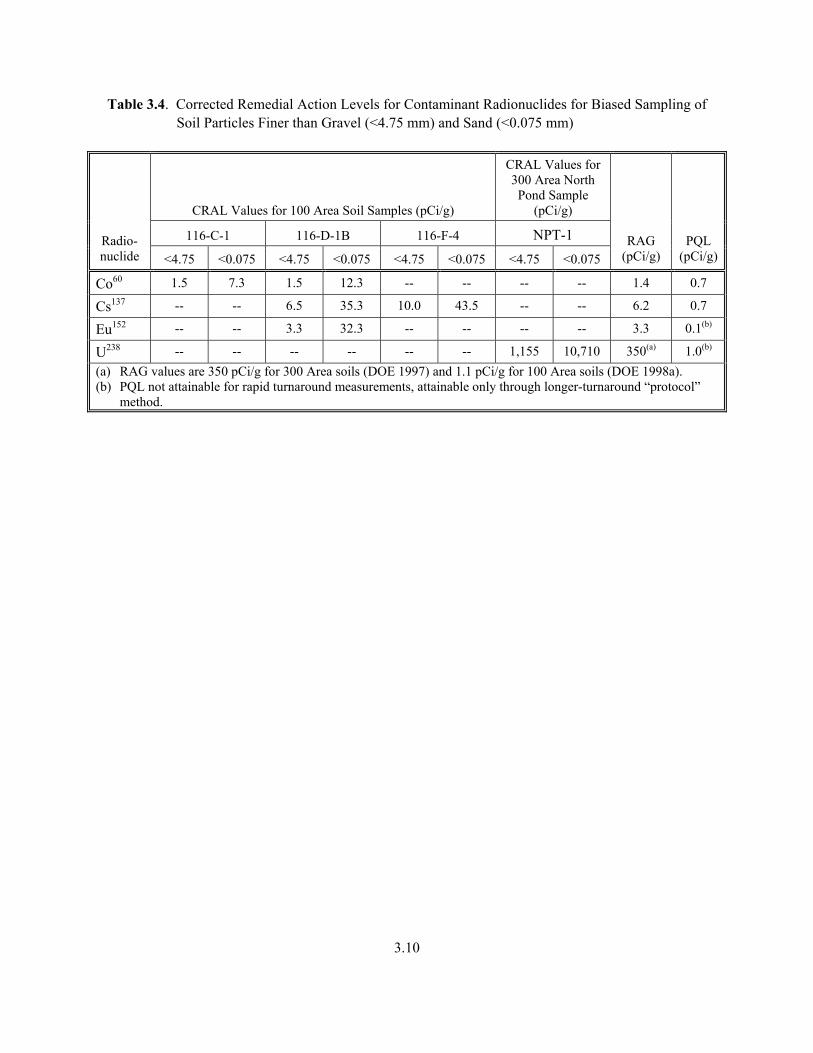
attainable only through longer turnaround “protocol” method. The CRAL for particle sizes sampled finer than gravel (<4.75 mm) and finer than sand (<0.075 mm) are listed in Table 3.4. The results indicated that, depending on radionuclide, soil type, and the degree of contamination, the CRAL values for biased sampling would be 0 to ~3 times the RAG values for finer-than-gravel material and ~5 to ~30 times the RAG values for finer-than-sand material. These assessments, based on detailed particle-size and activity distribution data for selected 100 and 300 Area waste site soils, suggested that
1. SBFs should be determined for each waste site prior to excavation. 2. A protocol needs to be established to consistently obtain representative soil samples of selected
particle size (finer than gravel or sand).
3. From the predetermined SBF for each contaminant in soil CRAL, values need be established for each waste site.
4. CRAL values need be established for each COC to significantly attenuate the risk of over-
remediation of waste sites.
3.10
Table 3.4. Corrected Remedial Action Levels for Contaminant Radionuclides for Biased Sampling of Soil Particles Finer than Gravel (<4.75 mm) and Sand (<0.075 mm)
CRAL Values for 100 Area Soil Samples (pCi/g)
CRAL Values for 300 Area North Pond Sample
(pCi/g)
116-C-1 116-D-1B 116-F-4 NPT-1 Radio- nuclide <4.75 <0.075 <4.75 <0.075 <4.75 <0.075 <4.75 <0.075
RAG (pCi/g)
PQL (pCi/g)
Co60 1.5 7.3 1.5 12.3 -- -- -- -- 1.4 0.7
Cs137 -- -- 6.5 35.3 10.0 43.5 -- -- 6.2 0.7
Eu152 -- -- 3.3 32.3 -- -- -- -- 3.3 0.1(b)
U238 -- -- -- -- -- -- 1,155 10,710 350(a) 1.0(b)
(a) RAG values are 350 pCi/g for 300 Area soils (DOE 1997) and 1.1 pCi/g for 100 Area soils (DOE 1998a). (b) PQL not attainable for rapid turnaround measurements, attainable only through longer-turnaround “protocol”
method.

4.1
4.0 Effects of Sampling Bias on Remediation Limits for 116-C-1 Waste Trench—A Preliminary Assessment
Analysis of particle size-contaminant activity/concentration data in Section 3 showed that biased sampling of a finer size fraction (assuming that the measured activity/concentrations of a contaminant in this fraction represents the actual contaminant activity/concentration of a whole soil) results in potential over-remediation of the soil. The analysis also showed that if detailed particle size distribution and activity/concentration data for a contaminated soil are available, it is possible to correct the sampling bias and thus reduce the probability of over-remediating the soil. We conducted a preliminary assessment of effects of sampling bias using a set of historical borehole data for 116-C-1 waste trench. The location, and the waste disposal history for this trench is described in Section 2. For the assessment, we used 60Co and 152Eu activity data for soil samples selected from various depths along a SW-NE transect of the trench (collected in 1974, Dorian and Richards 1978). Because these data were collected in 1974 (60Co half-life, 5.263 yr and 152Eu half-life, 12.7 yr) we decay-corrected the reported values. The preliminary assessment was conducted using the following assumptions:
1. All reported activities were measured using soil fractions finer than gravel. 2. The particle size distribution and contaminant partitioning data obtained on a single sample from
the middle of the trench in 1993, is representative of the soil in the whole waste trench.
3. Contaminant distribution measured along a single longitudinal transect is representative of contaminant distribution along the width of the trench.
To display the distribution of 60Co and 152Eu activities in this waste trench, the corrected whole soil activities for these contaminants were plotted and contoured (Figures 4.1 and 4.2). The distribution data indicates that the highest activities of 60Co and 152Eu are found in two locations within the trench. The first “hot spot” is a location about 100 ft downstream from the effluent inlet and at a depth of about 30 ft. The second “hot spot” is located near the northeast end of the trench at a depth of about 20 ft. It appears that these contaminants have moved deeper into soil profile near the inlet possibly due to higher rate of effluent infiltration at this location. The second location showing the highest activities were encountered near the northeast end of the trench at a depth of about 20 ft where the effluent flow rate was probably the lowest within the trench. These 60Co and 152Eu activity distribution data were used to estimate soil volumes that require remediation because they exceed RAG values of 1.4 and 3.3 pCi/g for these radionuclides respectively. Calculations were also made to estimate the volumes of soil that would be needlessly remediated if soil sampling were to be conducted selectively to exclude all particle sizes coarser than sand (>4.75 mm) without any corrections for sampling bias.

4.2
NESW Effluent Inlet
Figure 4.1. Depth Distribution of Corrected 60Co Activities Along a Longitudinal Transect Through 116-C-1 Waste Trench

4.3
NE SW Effluent Inlet
Figure 4.2. Depth Distribution of Corrected 152Eu Activities Along a Longitudinal Transect Through 116-C-1 Waste Trench

4.4
The contaminated areas surrounding the 116-C-1 waste trench were estimated according to each of the scenarios (Figure 4.3). First approximation estimates of the volumes of contaminated soil are listed in Table 4.1. The estimates indicate that excess soil volume to be remediated without sampling bias
Figure 4.3. Estimated Area of Contamination from Radionuclide Distribution Along a Longitudinal Transect Through 116-C-1 Waste Trench. Blue lines mark the RAG limits for (<3.3 pCi/g) 152Eu activity in whole soil. The green lines mark the RAG limits (<1.4 pCi/g) for 60Co activity in whole soil. The red lines mark the estimated limits of 60Co and 152Eu contamination without SBF corrections.

4.5
corrections is about 57% for 60Co and about ~280% for 152Eu. These estimates showed that excess reme-diation volumes are a function of radionuclide distribution in the soil and their SBF for the contaminated site. This preliminary assessment showed that, higher SBF values leads to estimates of greater contami-nated soil volumes and, if uncorrected, would result in over-remediation of a waste site.
Table 4.1. Estimates of Contaminated Soil Volume Surrounding the 116-C-1 Waste Trench
Radionuclide
Vol w/o SBF Corrections
(yd3)
Vol SBF Corrections
(yd3) Excess Vol
Remediated (yd3) 60Co ~296,600 ~189,300 ~107,300 152Eu ~189,300 ~66,800 ~122,500

5.1
5.0 Conclusions and Recommendations A detailed analysis of particle size-radionuclide distribution data for selected coarse-grained soils from 100 and 300 Hanford Area waste sites indicated that
• In these gravelly soils, the activity/concentration of any COC per unit mass in any finer fractional soil material was consistently biased higher than the activity/concentration of the same COC in the whole soil (all grain sizes sampled).
• The degree of sampling bias for each COC could be quantified as an SBF that relates the activity/
concentration in any finer size fraction of a soil to the activity/concentration in the whole soil.
• SBF for any COC in a soil increases with decreasing particle size sampled. SBFs for different COCs in a soil can vary significantly (up to an order of magnitude) depending on their chemical properties and affinity for specific mineral surfaces.
• SBF for a single COC in soil samples obtained from different locations from the same waste site can
be significantly different (two to three times higher than the lowest value), reflecting spatial variability engendered by the source, type, and distribution of contamination.
• SBF for a COC in soils from different waste sites were different, and these values were affected by
the soil texture, the degree, the source, and the distribution of contamination.
• Waste site soils would be over-remediated (remediated below RAG values) without SBF corrections. SBF corrections could be made by using CRAL computed from RAG and SBF (for selected particle-size finer) for each COC.
• The soils in the vicinity of 116-C-1 waste trench would be over-remediated (excavation of ~57% to
280% of excess soil volume) without appropriate SBF corrections for contaminant radionuclides 60Co and 152Eu.
Based on these analyses and conclusions, we recommend that
• A sampling grid should be established (using a geostatistical basis) for each waste site, and repre-sentative whole soil sample should be drawn from selected depth intervals as specified in ASTM C-702. The quantities of whole soil selected for analysis should be based on the standard practice as specified in ASTM D-2487-98 (Appendix A).
• The particle size and COC distribution in soil samples should be determined by wet sieving
(ASTM D 422), and each soil fraction of each sample should be chemically and radiologically characterized.

5.2
• The SBF for each COC for a specified particle size finer, and CRAL values for each COC in each sampling grid should be computed.
• During remediation, representative soil samples for the same specified particle size finer should be
drawn for monitoring the activity/concentration of each COC and sample grid, and relevant COC-specific CRAL values should be used to establish the limits of remediation.

6.1
6.0 References ASTM D2487-98. 2000. “Standard Test Method for Classification of Soils for Engineering Purposes.” Annual Book of ASTM Standards, Vol. 4.08. American Society of Testing Materials, Philadelphia. ASTM D 422-63. 2000. “Standard Test Method for Particle-Size Analysis of Soils.” Annual Book of ASTM Standards, Vol 4.08. American Society of Testing Materials, Philadelphia. ASTM C 702-87. 2000. “Standard Practice for Reducing Samples of Aggregate to Testing Size.” Annual Book of ASTM Standards, Vol. 4.02. American Society of Testing Materials, Philadelphia. Baker VR ed. 1981. “Catastrophic Flooding, the Origin of the Channeled Scabland.” Benchmark Papers in Geology, Vol 55. Dowden, Hutchinson, and Ross, Inc., Stroudsberg, Pennsylvania. Dennison DI, DR Sherwood, and JS Young. 1989. Status Report on Remedial Investigation of the 300 Area Process Ponds. PNL-6442, Pacific Northwest Laboratory, Richland, Washington. DOE. 1988. Final Status Post-Closure Permit Application: 183-H Solar Evaporation Basins. DOE/RL-88-09, U.S. Department of Energy, Richland Operations Office, Richland, Washington. DOE. 1992a. Hanford Site Soil Background. DOE/RL-92-24 Rev. 0, U.S. Department of Energy, Richland Operations Office, Richland, Washington. DOE. 1992b. 100 Area Soil Washing Treatability Test Plan. DOE/RL-92-51 Rev. 0, U.S. Department of Energy, Richland Operations Office, Richland, Washington. DOE. 1994. 100 Area Excavation Treatability Study Report. DOE/RL-94-16, U.S. Department of Energy, Richland Operations Office, Richland, Washington. DOE. 1995. Soil Washing Pilot Plant Treatability Test for the 100-DR-1 Operable Unit. DOE/RL-95-46, U.S. Department of Energy, Richland Operations Office, Richland, Washington. DOE. 1996. Hanford Site Background: Part 2, Soil Background for Radioactive Analytes, DOE/RL-96-12 Rev. 0, U.S. Department of Energy, Richland Operations Office, Richland, Washington. DOE. 1997. 300-FF-1 Remedial Design Report/Remedial Action Work Plan. DOE/RL-96-17 Rev. 0, U.S. Department of Energy, Richland Operations Office, Richland, Washington. DOE. 1998a. Remedial Design Report/Remedial Action Work Plan for the 100 Area. DOE/RL-96-17 Rev. 1, U.S. Department of Energy, Richland Operations Office, Richland, Washington. DOE. 1998b. 100 Area Remedial Action Sampling and Analysis Plan. DOE/RL-96-22 Rev. 1, U.S. Department of Energy, Richland Operations Office, Richland, Washington.

6.2
Dorian JJ and VR Richards. 1978. Radiological Characterization of the Retired 100 Areas. UNI-946, United Nuclear Industries Inc, Richland, Washington. EPA. 1995. Interim Action Record of Decision for the 100-BC-1, 100-DR-1, 100-HR-1 Operable Units, Hanford Site, Benton County, Washington, September 1995. U.S. Environmental Protection Agency, Region 10, Seattle. EPA. 1997. Amended Record of Decision, Decision Summary and Responsiveness Summary, Benton County, Washington, September 1995. U.S. Environmental Protection Agency, Region 10, Seattle. Hanford Site Atlas. BHI-01119 Rev 1. Bechtel Hanford, Inc., Richland, Washington. Guzek SJ and JG Field. 1993. 100 Area Soil Washing. Field Note Book. EFL-1069, Westinghouse Hanford Company, Richland, Washington. Mattigod SV, RJ Serne, and HD Freeman. 1994a. 100 Area Soil Washing Bench-Scale Tests. DOE/RL-93-107, U.S. Department of Energy, Richland Operations Office, Richland, Washington. Mattigod SV, RJ Serne, and HD Freeman. 1994b. 100 Area Soil Washing: Bench-Scale Tests on 116-F-4 Pluto Crib Soil. WHC-SD-EN-TI-268 Rev. 0, Westinghouse Hanford Company, Richland, Washington. Mullineaux DR, RE Wilcox, WF Ebaugh, R Fryxell, and M Rubin. 1977. “Age of the Last Major Scabland Flood of Eastern Washington, as Inferred from Associated Ash Beds of Mount St. Helens Set S.” Geological Society of America Abstracts with Programs 5(7):1105. Serne RJ, CW Lindenmeier, PK Bhatia, and VL Legore. 1992. Contaminant Concentration Versus Particle Size for 300 Area North Process Pond Sediments. WHC-SD-EN-TI-049 Rev. 0, Westinghouse Hanford Company, Richland, Washington. WHC. 1993. 100 Area Test Pit Sampling for Soil Washing Bench-Scale Test, Description of Work. WHC-SD-EN-AP-118 Rev. 0a, Westinghouse Hanford Company, Richland, Washington. Young JS, RM Fruland, and JS Fruchter. 1990. Data Compilation Task Report for the Source Investigation of the 300-FF-1 Operable Unit Phase I Remedial Investigation. PNL-7241, Pacific Northwest Laboratory, Richland, Washington. Young JS and JS Fruchter. 1991. Addendum to Data Compilation Task Report for the Source Investigation of the 300-FF-1 Operable Unit Phase I Remedial Investigations. EMO-1026, Environmental Management Operations, Pacific Northwest Laboratory, Richland, Washington.

Appendix A
ASTM Specifications for Minimum Sample Quantity Needed for Accurate Particle Size Analysis of Soils

A.1
Appendix A
ASTM Specifications for Minimum Sample Quantity Needed for Accurate Particle Size Analysis of Soils
According to ASTM D2487-98, the quantity of soil sample to be used for accurate particle size distribution determination depends on the maximum particle size of the soil. The recommended mini-mum quantities are listed in Table A.1. The quantity of field sample would be reduced to minimum sample quantity needed for analysis by using a sample splitter or by coning and quartering as per ASTM C 702-87.
Table A.1. Minimum Soil Sample Quantity Size Needed for Particle Size Analysis of Soils
Maximum Particle Size
(mm)
Sieve Opening
(in.)
Minimum Analytical
Sample Size – Dry wt (kg)
Field Sample Size – Dry
wt (kg)
75 3.0 60 120-240 38.1 1.5 8 16-32 19 3/4 1 2-4 9.5 3/8 0.2 0.4-0.8
4.75 3/16 (#4) 0.1 0.2-0.4

Appendix B
Radionuclide Activity and Mass Relationship

B.1
Appendix B
Radionuclide Activity and Mass Relationship
Mass in grams of a radionuclide with an activity of 1 Ci is calculated as follows. A unit of radioactivity in Ci is defined as the mass of any radionuclide in which there are 3.70 x 10¹⁰ disintegrations per second (-dN/dt). The mass of a radionuclide is related to the number of atoms N, by the following relationship:
M = (N x atomic wt of the isotope)/NA where M = mass of the isotope in grams N = number of atoms of isotope NA = Avogadro’s number = 6.022 x 10²³ moles. The number of atoms of a radionuclide is a function of decay rate and the decay constant:
N = (-dN/dt)/λ where -dN/dt = number of disintegrations per second = 3.70 x 10¹⁰ λ = decay constant = 0.693/(radionuclide half-life in years, t1/2 ) x 3.156 x 10⁷ Therefore, M = ((3.7 x 10¹⁰) x atomic wt of the isotope x t1/2)/ (2.1958 x 10-8) x (6.022 x 1023) = (2.7981 x 10⁻⁶) x atomic wt of the isotope x t1/2 1 Ci of activity = [(2.7981 x 10⁻⁶) x atomic wt of the isotope x t1/2] g of radionuclide.