Embed Size (px)
Citation preview
Radio Security/Privacy andcomplexity Trade-o�s for 4G
Group No. 08gr1120
Mathieu Gobeaut
Richard Tchissambou
June 2008
Aalborg University

Aalborg UniversityE-StudyboardMobile Communications 10th semester
TITLE:
Radio Security/Privacy and complexity Trade-o�s for 4G
THEME:
Mobile RadioCommunications
PROJECT PERIOD:
4th February 20085th June 2008
PROJECT GROUP:
08gr1120
GROUP MEMBERS:
Mathieu GobeautRichard tchissambou
SUPERVISORS:
Xin ZhouPatrick Eggers
COPIES: 3
PAGES: 73
Abstract:
In wireless communications, transmissions aresusceptible to be intercepted by eavesdroppers. Assecurity implies links reliability, the purpose of thisproject is to secure communications at the physicallayer to prevent the home user from con�guring hiswireless connection security application by himself.The idea is to apply a beam-hopping pattern atan access point, which will allow to choose thedirection in which to send a signal and combine itwith a power control to guarantee the target userwith receiving the same amount of power during awhole communication.
This project mainly includes two aspects.
� Evaluate the performance of the beam hop-ping pattern. In this part, we try to dete-riorate the signal received by the eavesdrop-per by orienting the beam towards the targetuser.
� Investigate the e�ciency of a power con-trol processing called Automatic Gain Con-trol (AGC) and combine it with the previ-ous technique to perturbate the eavesdroppersignal even more and make it very di�cultfor him to decode a signal sent by the accesspoint to the target user.

Contents
Table of Contents . . . . . . . . . . . . . . . . . . . . . . . . . . . . iiList of Figures . . . . . . . . . . . . . . . . . . . . . . . . . . . . . ivList of Tables . . . . . . . . . . . . . . . . . . . . . . . . . . . . . . vAbbreviations . . . . . . . . . . . . . . . . . . . . . . . . . . . . . . viPreface . . . . . . . . . . . . . . . . . . . . . . . . . . . . . . . . . ixAcknowledgement . . . . . . . . . . . . . . . . . . . . . . . . . . . . x
1 Introduction 1
1.1 Security overview . . . . . . . . . . . . . . . . . . . . . . . . . 11.1.1 Security terms . . . . . . . . . . . . . . . . . . . . . . 11.1.2 OSI model . . . . . . . . . . . . . . . . . . . . . . . . 3
1.2 Target user and eavesdropper: di�erentiation . . . . . . . . . 61.3 Single Input Single Output (SISO), Single Input Multiple
Output (SIMO), Multiple Input Single Output (MISO) andMultiple Input Multiple Output (MIMO) system . . . . . . . 8
1.4 Problem De�nition . . . . . . . . . . . . . . . . . . . . . . . . 91.4.1 Motivation . . . . . . . . . . . . . . . . . . . . . . . . 91.4.2 Previous works on security at the physical layer level . 101.4.3 What can be further investigated in the physical layer
security? . . . . . . . . . . . . . . . . . . . . . . . . . . 111.4.4 Our problem choice . . . . . . . . . . . . . . . . . . . . 12
2 System description and Environment 14
2.1 System layout . . . . . . . . . . . . . . . . . . . . . . . . . . . 142.1.1 System . . . . . . . . . . . . . . . . . . . . . . . . . . . 142.1.2 Antenna system . . . . . . . . . . . . . . . . . . . . . . 152.1.3 Channel . . . . . . . . . . . . . . . . . . . . . . . . . . 162.1.4 Power consideration . . . . . . . . . . . . . . . . . . . 17
2.2 Algorithm . . . . . . . . . . . . . . . . . . . . . . . . . . . . . 19
3 Implementation 23
3.1 Simulation conditions . . . . . . . . . . . . . . . . . . . . . . 233.2 Parameters de�nition and scenarios . . . . . . . . . . . . . . . 243.3 Procedure . . . . . . . . . . . . . . . . . . . . . . . . . . . . . 25
i

3.3.1 Acquisition phase . . . . . . . . . . . . . . . . . . . . . 253.3.2 Sending of the information . . . . . . . . . . . . . . . . 26
4 Results 27
4.1 In�uence of the number of clusters . . . . . . . . . . . . . . . 304.1.1 First scenario : Fixed beam . . . . . . . . . . . . . . . 304.1.2 Second scenario : Beam-Hopping . . . . . . . . . . . . 334.1.3 Third scenario : Beam-Hopping + Automatic Gain
Control (AGC) . . . . . . . . . . . . . . . . . . . . . . 424.1.4 Comparison . . . . . . . . . . . . . . . . . . . . . . . . 49
4.2 In�uence of the radius of clusters . . . . . . . . . . . . . . . . 494.3 In�uence of the beamwidth . . . . . . . . . . . . . . . . . . . 504.4 Conclusion . . . . . . . . . . . . . . . . . . . . . . . . . . . . . 52
5 Conclusion and future work 55
5.1 Conclusion . . . . . . . . . . . . . . . . . . . . . . . . . . . . . 555.1.1 Conclusion for the �rst part . . . . . . . . . . . . . . . 565.1.2 Conclusion for the second part . . . . . . . . . . . . . 575.1.3 Conclusion for the third part . . . . . . . . . . . . . . 57
5.2 Future work . . . . . . . . . . . . . . . . . . . . . . . . . . . . 58
Bibliography 61
ii

List of Figures
1.1 Open System Interconnection (OSI) Model . . . . . . . . . . . 31.2 Di�erence between user and eavesdropper [1] . . . . . . . . . 71.3 SISO, MISO, SIMO andMIMO systems . . . . . . . . . . . . 91.4 Conventional SISO system . . . . . . . . . . . . . . . . . . . . 91.5 Beam Hopping applied by AP . . . . . . . . . . . . . . . . . . 13
2.1 System layout . . . . . . . . . . . . . . . . . . . . . . . . . . . 152.2 How scattering a�ects the average channel impulse response . 182.3 Aquisition phase . . . . . . . . . . . . . . . . . . . . . . . . . 202.4 Directional power pro�le . . . . . . . . . . . . . . . . . . . . . 212.5 Operation phase . . . . . . . . . . . . . . . . . . . . . . . . . 21
4.1 Environment response . . . . . . . . . . . . . . . . . . . . . . 294.2 Fixed beam oriented in the 90° direction . . . . . . . . . . . . 314.3 Average power received by the target user and the eavesdrop-
per after 10 simulations (0°) . . . . . . . . . . . . . . . . . . . 324.4 Average power received by the target user and the eavesdrop-
per after 10 simulations (90°) . . . . . . . . . . . . . . . . . . 324.5 Power received by the target user and the eavesdropper after
1 simulation (0°) . . . . . . . . . . . . . . . . . . . . . . . . . 334.6 Power received by the target user and the eavesdropper after
1 simulation (90°) . . . . . . . . . . . . . . . . . . . . . . . . . 344.7 Cumulative Distribution Function (CDF) of the Signal to Eaves-
dropper Ratio (SER) (0°)[dB] . . . . . . . . . . . . . . . . . . 354.8 CDF of the SER (90°)[dB] . . . . . . . . . . . . . . . . . . . . 364.9 CDF of the Signal to Noise Ratio (SNR) (0°)[dB] . . . . . . . 374.10 CDF of the SNR (90°)[dB] . . . . . . . . . . . . . . . . . . . . 384.11 Power received by both TU and Eavesdropper over 1 simula-
tion (5cl vs 3cl) . . . . . . . . . . . . . . . . . . . . . . . . . . 384.12 CDF of the SER [dB] (5cl vs 3cl) . . . . . . . . . . . . . . . . 394.13 CDF of the SNR [dB] (5cl vs 3cl) . . . . . . . . . . . . . . . . 394.14 Power received by both TU and Eavesdropper over 1 simula-
tion (4cl vs 4cl) . . . . . . . . . . . . . . . . . . . . . . . . . . 404.15 CDF of the SER [dB] (4cl vs 4cl) . . . . . . . . . . . . . . . . 40
iii

4.16 CDF of the SNR [dB] (4cl vs 4cl) . . . . . . . . . . . . . . . . 414.17 Power received by both TU and Eavesdropper over 1 simula-
tion (3cl vs 5cl) . . . . . . . . . . . . . . . . . . . . . . . . . . 414.18 CDF of the SER [dB] (3cl vs 5cl) . . . . . . . . . . . . . . . . 424.19 CDF of the SNR [dB] (3cl vs 5cl) . . . . . . . . . . . . . . . . 424.20 Power received by both TU and Eavesdropper over 1 simula-
tion (5cl vs 3cl) . . . . . . . . . . . . . . . . . . . . . . . . . . 434.21 CDF of the SER [dB] (5cl vs 3cl) . . . . . . . . . . . . . . . . 444.22 CDF of the SNR [dB] (5cl vs 3cl) . . . . . . . . . . . . . . . . 454.23 Power received by both TU and Eavesdropper over 1 simula-
tion (4cl vs 4cl) . . . . . . . . . . . . . . . . . . . . . . . . . . 454.24 CDF of the SER [dB] (4cl vs 4cl) . . . . . . . . . . . . . . . . 464.25 CDF of the SNR [dB] (4cl vs 4cl) . . . . . . . . . . . . . . . . 464.26 Power received by both TU and Eavesdropper over 1 simula-
tion (3cl vs 5cl) . . . . . . . . . . . . . . . . . . . . . . . . . . 474.27 CDF of the SER [dB] (3cl vs 5cl) . . . . . . . . . . . . . . . . 484.28 CDF of the SNR [dB] (3cl vs 5cl) . . . . . . . . . . . . . . . . 484.29 SER comparison between the reference �xed beam (left) and
the hopping antenna system without AGC (right) (4cl vs 4cl)[dB] . . . . . . . . . . . . . . . . . . . . . . . . . . . . . . . . 49
4.30 SER comparison between the reference �xed beam (left), thehopping antenna system without AGC (right) and the hoppingantenna system with AGC (down) (4cl vs 4cl)[dB] . . . . . . 50
4.31 CDF of the SER [dB]: In�uence of radius (4cl vs 4cl) . . . . . 514.32 CDF of the SNR [dB] comparison between the radius in sce-
nario 2 (4cl vs 4cl) . . . . . . . . . . . . . . . . . . . . . . . . 514.33 CDF of the SNR [dB] comparison between the radius in sce-
nario 3 (4cl vs 4cl) . . . . . . . . . . . . . . . . . . . . . . . . 514.34 3 di�erent patterns [dB] . . . . . . . . . . . . . . . . . . . . . 524.35 CDF of the SER with a Half-Power Beamwidth (HPBW) of
10° (top left), 25° (top right) and 60° (down) [dB] . . . . . . . 534.36 CDF of the SNR with a HPBW of 10° (top left), 25° (top
right) and 60° (down)(scenario 3) . . . . . . . . . . . . . . . 53
iv

List of Tables
1.1 Security protocols used in the di�erent layers . . . . . . . . . 4
4.1 Simulations parameters table . . . . . . . . . . . . . . . . . . 274.2 Clusters parameters table . . . . . . . . . . . . . . . . . . . . 284.3 Radius parameters table . . . . . . . . . . . . . . . . . . . . . 294.4 Beamwidth parameters table . . . . . . . . . . . . . . . . . . 29
v

Abbreviations
AGC Automatic Gain Control
AOA Angle Of Arrival
AOD Angle Of Departure
AP Access Point
BLAST Bell Labs Ayered Space Time
BPSK Binary Phase Shift Key
CDF Cumulative Distribution Function
CDMA Code Division Multiple Access
CIA Communication Integrity Availability
CSI Channel State Information
DSSS Direct Sequence Spread Spectrum
FDD Frequency Division Duplex
FDMA Frequency Division Multiple Access
FHSS Frequency Hopping Spread Spectrum
HPBW Half-Power Beamwidth
IEEE Institute of Electrical and Electronics Engineers
IP Internet Protocol
IPsec Internet Protocol Security
ISI InterSymbol Interference
vi

ISO International Organization for Standardization
IT Information Technology
LAN Local Area Network
C
LLC Logical Link Control
MAC Media Access Control
MIMO Multiple Input Multiple Output
MISO Multiple Input Single Output
OFDM Orthogonal Frequency Division Multiplex
OSI Open System Interconnection
PAN Personal Area Network
PDU Protocol Data Unit
PIN Personal Identi�cation Number
P
PPP Point-to-Point Protocol
PSK Phase Shift Key
QAM Quadrature Amplitude Modulation
QoS Quality of Service
QPSK Quadrature Phase Shift Key
Rx Receiver
SCSI Small Computer Systems Interface
SCTP Stream Control Transmission Protocol
SDU Session Data Unit
SER Signal to Eavesdropper Ratio
SIMO Single Input Multiple Output
vii

SISO Single Input Single Output
SIR Signal to Interference Ratio
SINR Signal to Interference plus Noise Ratio
SNR Signal to Noise Ratio
STC Space Time Code
SVD Singular Value Decomposition
TCP Transmission Control Protocol
TDMA Time Division Multiple Access
TLS Transport Layer Security
Tx Transmitter
UDP User Datagram Protocol
WAN Wide Area Network
WPA Wi-Fi Protected Access
WEP Wired Equivalent Privacy
viii

Preface
This report is the result of the 10th semester project which has been workedfrom the 4th February to the 4th of june 2008 by the students of Mobile com-munications group 08gr1120 at the APNet department of Electronic Systems,Aalborg University, Denmark. This report is an investigation on the way tosecure wireless communications by acting on the physical layer using a Beam-Hopping technique. The project has been achieved on the space domain innarrowband, and is based on the mechanical Beam-Hopping technique ap-plied to the Access Point antenna system. This report includes the problemdelimitation, and the understanding of the di�erent parameters used in theproject.Once the technical review has been introduced, several scenarios are de�nedto be investigated, and the simulation model used, "the single scatteringmodel", is detailed. Finally, using the "MATLAB" software simulator, thede�ned scenarios are simulated in the "single scattering model" to explorethe security robustness of the Beam-Hopping method. Then this method isoptimized.
MOBcom group 08gr1120
June 2008Aalborg University
ix

Acknowledgement
We would like to express our gratitude to our supervisors Xin Zhou andPatrick Eggers for their valuable guidance throughout this project and allthose people who directly or indirectly helped us to �nish this project.
Mathieu Gobeaut Richard Tchissambou
x

Chapter 1
Introduction
1.1 Security overview
1.1.1 Security terms
Security is "the precautions taken to ensure against theft, espionage, orother danger, or the state of being free from danger, damage, or worry con-dition" [2]. In the general sense, security is a concept similar to safety. Thenuance between the two is an added emphasis on being protected from dan-gers that originate from outside. Individuals or actions that encroach uponthe condition of protection are responsible for the breach of security. Inour domain, we could de�ne security as the condition that results from es-tablishement and maintenance of protective measures that ensure a state ofinviolability from hostile acts of in�uences [3].As far as communications security is concerned, [4] de�nes this term by themeasures and controls taken to deny unauthorized persons information de-rived from telecommunications and ensure the authenticity of such telecom-munications. Communications security includes several steps:
� cryptosecurity to ensure message con�dentiality and authenticity.
� emission security to deny unauthorized persons from intercepting andanalysing information.
� physical security to safeguard classi�ed equipments, materials and doc-uments from access or observation by unauthorized persons.
� tra�c-�ow security to conceal the presence and properties of valid mes-sages on a network.
� transmission security to protect transmissions from interception andexploitation by means such as frequency hopping or spectrum analysis.
1

Because protecting con�dential information is a business requirement andalso an ethical and legal requirement, in this report we aim at protectinginformation from interception by eavesdroppers. First of all we need tode�ne several terms which are parts of security in order to choose which oneto investigate. Basically, the information security can be divided into threemain goals known as the Communication Integrity Availability (CIA) triad:
� Con�dentiality of information which means that this informationmust only be accessed, used, copied or disclosed by persons who havebeen authorized to do so and only when there is a genuine need to doso. It is required for maintaining the privacy of the people informationheld by an organization.
� Integrity of information which implies that data cannot be created,modi�ed or deleted without authorization. For example when a virusis set up on a computer, there is a loss of integrity because this virusmight erase data or �les on this computer.
� Availability of information which requires that when information isneeded, it is available and that the computing systems and the securitycontrols of it function correctly.
To respect those three basics, we could investigate the access control partof a transmission. Of course, only people who are authorized should be ableto access protected information. To do so, it is mandatory to explore thefoundation on which access control mechanisms are built, which means iden-ti�cation and authentication.
� Identi�cation is "the act of determining the properties of something,usually by research or calculation" [5].
� Authentication is "the act of validating, �nding or testing the truthof something" [6].
� Once a person, a program or a device has been identi�ed and authen-ticated, it is necessary to determine which resources they are allowedto access and which actions they are allowed to perform. This processis known as authorization.
As an important point in protection, security controls should be improve-able and upheld. Besides, a log journal should be held as to keep track of
2

failed and granted attempts of authentication. The most e�ective way toprotect information is to transform it into a form unusable by anyone otherthan an authorized user. Encryption allows it. The concept of encryp-tion is to allow only an authorized user to decrypt information thanks toa cryptographic key he is the only one to possess. Cryptography protectsinformation while this is in transit and in storage. For instance, wirelesscommunications can be encrypted using Wired Equivalent Privacy (WEP)or Wi-Fi Protected Access (WPA) protocols.
1.1.2 OSI model
Working on security aspects requires some knowledge about communicationsand computer network protocol design. This network protocol design is of-ten represented by a layered, abstract description and referred to as theOSI model. OSI is an International Organization for Standardization (ISO)standard for worldwide communications. This standard in�uences the de-sign of computer networking protocols in several layers for the InformationTechnology (IT) Industry [7]. The OSI model is illustrated in Figure 1.1where the nature of the data controlled at a level is shown. In Table 1.1.2,we can see a sum up of the layers with their functions and some commonsecurity protocols used at each level of the stack. The aim of the OSI modelis to divide networks into several components so that it becomes easier tosecure them, level by level, and reduces their vulnerabilities.
Figure 1.1: OSI Model
3

Data Unit Layer Function SecurityProtocols
Data 7.Application Network process to ap-plication
6.Presentation Data representation andencryption
5.Session Interhost communica-tion
SSH, SCP,CHAP [8][9] [10]
Segment 4.Transport End-to-end connectionsand reliability
TLS,SSL [11]
Packet,Datagram
3.Network Path determination andlogical addressing(IP)
IPSec [12]
Frame 2.Data link Physical addressing(MAC, LLC)
WEP,WPA,WPA2 [13]
Bit 1.Physical Media, signal and bi-nary transmission
Table 1.1: Security protocols used in the di�erent layers
Application layer
This layer provides application services for the application processes. It doesnot perform services to the end user but to user-de�ned application processes.To maintain security in this layer, anti-virus softwares and �rewall systemshave been developed to respectively prevent the user from external attacksand to control the access of applications to the network. Finally, applicationscan also implement their own security controls (assuming that communica-tions will be subject to attack) by requiring the use of strong authenticationand encryption to validate and protect data as it travels across the network.
Presentation layer
The presentation layer is susceptible to use di�erent syntaxes and semantics.In fact, the presentation layer allow the data to pass from the applicationlayer into the network. To maintain the security, input should be checkedvery carefully before being passed into functions that use the input to controloperations.
4

Session layer
Dialogues and connections between computers are controlled by the sessionlayer, which means established, managed and terminated. In the OSI model,this session is responsible for graceful close of sessions, and also for sessioncheckpointing and recovery [14]. Accounts have speci�c expirations for cre-dentials and authorization. Finally, a limited failed session attempts can beimplemented to avoid brute-force attacks on access credentials.
Transport layer
The transfer of data between end users is made transparent and reliable tothe upper layers through the transport layer. The reliability of a link iskept thanks to di�erent processes such as �ow control, segmentation andde-segmentation, and error control [15]. To maintain security, a protocolnamed Transport Layer Security (TLS) has been developed to prevent eaves-dropping, tampering and message forgery. TLS involves three basic phases:
1. Peer negotiation for algorithm support
2. Key exchange and authentication
3. Symmetric cipher encryption and message authentication
Network layer
The Network layer provides functional and procedural means of transferringvariable length data sequences from a source to a destination via one ormore networks while maintaining the Quality of Service (QoS) requested bythe Transport layer. The most famous protocol of this layer is the InternetProtocol (IP) one which manages the connectionless transfer of data onehop at a time, from end system to destination end system through severalrouters. Internet Protocol Security (IPsec) is a suite of protocols for securingIP communications by authenticating and/or encrypting each IP packet ina data stream. IPsec also includes protocols for cryptographic key establish-ment.
Data link layer
The data link layer is responsible for the procedures of data transfer betweennetwork entities and for detection and correction of errors occuring in thephysical layer. Some protocols have been developed on this layer to maintainsecurity, such as WEP or WPA protocols. But these protocols seem not to bestrong enough and also di�cult to manage for the domestic user. That's why
5

we need to investigate a way to secure the physical layer in a transparent andinherent way for the user as a complement security to the security featuresobtained in higher layers.
Physical layer
This layer sets all the physical and electrical speci�cations for devices andparticularly the relationship between a device and a physical medium, e.g.layouts of pins, voltages, cable speci�cations, hubs, repeaters, network adapters,and more. The physical layer guarantees the establishment and terminationof a connection to a communication medium, and also its participation in theprocess whereby the communications resources are e�ectively shared amongmultiple users. This layer is in charge of the modulation or the conversionbetween the digital representation of data in users equipment and the corre-sponding signals transmitted over a communication channel. These signalsoperate over the physical cabling, e.g. copper, optical �ber, or over a radiolink.
Each layer of the OSI model owns weaknesses and vulnerabilities, but as thisthesis refers only to physical layer security, we will only mention about thislayer known vulnerabilities and several means to control them. The physicallayer can present weaknesses, as listed in [16], such as loss of power, lossof environment control, physical theft of data and hardware, physical dam-age or destruction of data and hardware, unauthorized changes to the func-tional environment (data connections, removable media, adding/removingresources), disconnection of physical data links, undetectable interception ofdata. To control those aforementioned vulnerabilities, it is possible to usesome solutions like locked perimeters and enclosures, electronic lock mech-anisms for logging and detailed authorization, video and audio surveillance,Personal Identi�cation Number (PIN) and password secured locks, biometricauthentication systems, data storage cryptography, or even electromagneticshielding.
1.2 Target user and eavesdropper: di�erentiation
The goal of our project is to prevent an eventual eavesdropper from intercept-ing the information intended to the target user and we focus on the physicallayer security aspect. There are several ways to distinguish the target userfrom the eavesdropper using:
� space
� time
6

� or frequency domain.
Figure 1.2: Di�erence between user and eavesdropper [1]
Figure 1.2 from [1] represents the positions of the access point, thetarget user and the eavesdropper. This �gure di�erenciates the user fromthe eavesdropper using two dimensions, i.e. time τ , or frequency f , andspace X . The target user and the eavesdropper are spatially separated, sowe will be able to di�erenciate them spatially due to their di�erent spatiallocations by nature. Typically, the Access Point (AP) needs to know theusers' locations to di�erenciate them and this is possible by applying in anopen loop system. The channel impulse response can be:
� either instantaneous Channel State Information (CSI).
� or averaged CSI.
Given this assumption, the AP is now able to know unique frequency andtime pro�les for each of the users.We will use a function called impulse response as the response of our sys-tem. The Fourier transform of the impulse response is known as the transferfunction. It is usually easier to analyze systems using transfer functions (infrequency domain) as opposed to impulse responses (in time domain), be-cause the calculation are much more easier. Actually we do not have to use aconvolution but only a product to calculate the received signal. The Fouriertransform of a system's output may be determined by the multiplicationof the transfer function with the input function in the complex plane, also
7

known as the frequency domain. The Fourier transform can be representedthrough this form:
h(τ,Xt, xe)F→ H(f, xt, xe) (1.1)
where h is the impulse response of the system, H is the transfer function, τis the propagation delay, xt and xr are the space locations of the transmitter
and the receiver. TheF→ represents the Fourier transform. The underlined
symbols denote vectors. We can easily distinguish with the transfer functionthe di�erences between the eavesdropper and the target user.
Then, we have to distinguish two types of system, the closed loop andthe open loop one.
� A closed loop system is a system where the transmitter needs to havea feedback. Let us give an example. The AP will send the informationto the mobile phone using a downlink connection and will wait for thefeedback of the mobile phone through uplink connection.
� An open loop system is a system where the transmitter does not needa feedback from a receiver to proceed. An open loop system is e�-cient and has low complexity when coupled with average coding. Theassumption is that the Uplink is known by the AP and that the Down-link is considered as the same as the Uplink because the movement ofthe target users and the eavesdropper is quite small in space domain(small area). So the system is quite stable between uplink and down-link because the average response is the same. Scrambling coding isan option of average technique.
1.3 SISO, SIMO, MISO and MIMO system
SISO systems in control engineering usually refer to a simple control systemwith one input and one output. In radio, it is the use of only one antennaboth at the transmitter and receiver side. It is opposed to MISO, SIMOand MIMO systems, which use multiple antennas either at transmitter side,or receiver side or both. It is obvious that MISO, SIMO andMIMO sys-tems present some advantages. They are more robust against a possibleeavesdropper because the information will be sent using several antennas,so they improve the transmission performances in terms of diversity, array,multiplexing and interference reduction gains. They are also more robustregarding to the equipment. Indeed, if one antenna is not working, the in-formation can still be sent using the other antennas. The �gure 1.3 showsthe four di�erent kinds of system. Figure 1.4 shows us a SISO system. Onthis �gure, h denotes the CSI from the AP to the target user. x is the signalsent by the the AP.
8

Figure 1.3: SISO, MISO, SIMO andMIMO systems
Figure 1.4: Conventional SISO system
1.4 Problem De�nition
1.4.1 Motivation
In 2007 a survey [17] sponsored by RSA Security showed that in LondonBusiness Center, companies' networks had grown with a 62% factor but that36% of those networks were vulnerable. This proportion of possibly weaksystems becomes bigger if we focus on domestic networks, considering thathome users do not spend the same amount of money as companies to securetheir network. The home users do not hire specialized technicians to setup their network and be sure that the security level is high enough. Homeusers usually con�gure their equipment by themselves and the result is often
9

not su�cient to guarantee the con�dentiality and/or the integrity of theirinformation. Setting up a WEP key to control access to a network is notwithin the range of everybody and even when it is, this security protocol canbe broken using a mere free software that you can �nd on the web. A WPAencryption protocol has been developed to improve the WEP. However itinvolves longer sequences of encryption and WEP is nowadays the defaultprotocol of encryption so end users have to activate WPA on their own.Complete beginners in the realm of networks spend a huge amount of timeand money on their hotline trying to get through this problem.To avoid this kind of situations to the common end users who do not havea clue about the security aspects involved during the con�guration of theirnetworks, we choose to investigate the security aspect at a lower level sothat this process becomes totally transparent to them. In this thesis, weconcentrate on smart processes applied in the physical layer to ensure safeand protected data transmissions.
1.4.2 Previous works on security at the physical layer level
In [18], the authors investigate a way to secure communications via wave-form coding in MIMO systems. To improve the security of the link, they pro-pose to use multiple antenna systems and to code information. In a studentproject [1], the main idea is to apply a Singular Value Decomposition (SVD)scheme in a MIMO system between the access-point and the target user, andto avoid the interception and decoding of the signal by eavesdroppers, whichmeans security of the data information in the physical layer in this case. Theauthors evaluated the performance of the SVD scheme in a MIMO narrow-band system, investigated the security of the system regarding the eaves-dropper interceptions and �nally proposed a trade-o� between capacity ofthe target user and the electronic message. In [19], the authors investigatea way to enhance the security of wireless sensor network, using two ran-domized array transmission schemes to secure wireless sensor network at thephysical layer. They assume that the unauthorized user have a good receivedquality of the signal and is aware about all the transmission protocols. [20]proposes an interesting method to secure the transmission at the physicallayer as well. The idea is to induce a deterministic noise-like interferenceto the undesired receivers. The results are shown through simulations bymeasuring the upper bound of the information-theoretical secrecy and errorperformances.Many works were already driven on physical layer wireless security, but thereis still some interesting point to investigate. [18] , [1], [19], [20], [21], [22]
10

1.4.3 What can be further investigated in the physical layer
security?
While reading several works on the subject, we pointed out three main as-pects of the physical layer wireless security which could be interesting todevelop.
Fingerprinting
Fingerprinting can be implemented in several ways. It can:
� consist of using the medium to carry overlay information on top of thebaseline information. This overlay information can be either a part ofthe transmitted data in order to increase the rate performance or anencryption key to improve the link security [18]. This can be referredto as "stream �ngerprinting".
� consider modulation of bits with several modulations techniques suchas two Binary Phase Shift Key (BPSK) modulations instead of oneQuadrature Phase Shift Key (QPSK) to decode the transmitted sig-nal. The bit rate is decreased but the security is increased because aneavesdropper does not know which kind of modulation has been used.This can be referred to as "`modulation �ngerprinting".
It would be interesting to investigate this latter part to see if su�cient secu-rity level can be achieved and if eavesdropping can be prevented. Basically,we could focus on the bit level to check if data may be corrupted as previouswork [18] on the former part showed some satisfying results at block andsymbol levels.
Imperfect CSI
The di�culty considering imperfect CSI is to di�erenciate the eavesdropperfrom the target user. It is possible that in this case, the eavesdropper has abetter signal than the target user and some smart technique should help tosolve this problem. It is very interesting to investigate this work because itis very close to the reality. Moreover, all previous works on physical securityhad always taken into account a perfect CSI.
Beam Hopping
Using average CSI would allow us to spend less time on measuring instan-taneous CSI. Basically, the smart point would be to apply a beam hopping
11

pattern to the system so that the AP would 'jump' from a beam to anotherto reach the target user, trying to avoid interception of his signal by aneavesdropper.
1.4.4 Our problem choice
Previous works on security at physical layer [1], [18]- [22] introducedclosed loop systems with multiple input antennas at the transmitter side asto be able to estimate instantaneous channel impulse responses. As a secu-rity aspect, we want to investigate a more simple model requiring an openloop system which allows us to use average CSI by assuming that the CSI indowlink is the same as the uplink ones. To do that, we will test the e�ciencyof a beam-hopping pattern applied to the AP who would jump from a beamto another to reach a given target user represented by several clusters in thefar-�eld of the AP's indoor service area. It might create a very turbulentstate at a possible eavesdropper.
Since the AP has no feedback from any user because of open loop as-sumption, it can only deal with directional CSI. Thanks to this directionalconsideration, a SISO system can be applied, which means that both AP andusers are equipped with a single port antenna. This ensures low hardwarecomplexity at both sides, assuming that the receiver is a mobile station suchas a handportable device. The AP is able to scan the environment thanksto a beam pattern A(θ) it will sweep along the service area in order to getdirectional CSI and compute the power response E(θ) of the environment.Several clusters are randomly located in the service area and each clusteris constituted of 20 scatterers, so the AP could change the direction of thebeam with respect to the directional response of the environment. A targetuser and a possible eavesdropper are distinguished in this open loop SISOsystem by their clusters' spatial location, but we don't know anything aboutthe eavesdropper as he is only listening and not broadcasting.
Figure 1.5 represents our scenario considering only the AP and the targetuser represented by his di�erent clusters. One beam A(θ) is created by theAP and swept along the service area. The average CSI over all the scatterersfrom each cluster allows the AP to estimate the response of the environmentE(θ) with respect to the directions θ it scanned.
We consider the presence of an eavesdropper in the simulation environ-ment who stays completely transparent to the AP. We will estimate theaverage power received by the target user and the eavesdropper over severalpositions of the clusters in the room. Then, we will process a power controlto guarantee the target user with receiving the same amount of power duringhis whole communication. This should make the power received by the eaves-
12

dropper more erratic. The results of these cases will be compared with a �xedbeam applied to the AP to conclude about the e�ciency, con�dentiality andintegrity of data guaranteed by the beam hopping technique to a target user.
Figure 1.5: Beam Hopping applied by AP
13

Chapter 2
System description andEnvironment
2.1 System layout
2.1.1 System
Our system is described in Figure 2.1. The goal of the AP is to maintaina stable link to the target user, as we don't know anything about the eaves-dropper. This can be done assuming that the downlink CSI is equal to theuplink CSI, i.e. an open loop system is applied because of very few changes inthe space location of the target user and consequently in the channel impulseresponse which can be averaged. The AP is constituted by a single inputantenna. It will be able to generate a beam and sweep it along the servicearea of dimensions (D1, D2). The randomly located target user is composedof only one antenna for low hardware complexity and cost. This target useris associated with several randomly located uniformly distributed clusters inthe service area with an angle θcluster from the AP, and a radius of 1m. Weassume that this assumption of the radius �ts to di�erent things we can �ndin an indoor environment, as for example a bookcase, a table or a bed. Sev-eral scatterers are randomly located on these circular clusters in the servicearea to establish multipath and are uniformly distributed. All the scatterershave the same amplitude but their phase are di�erent with uniform distri-bution, assuming uncorrelated scattering which means incoherent voltagesummation, i.e. non coherent power summation. Finally the eavesdropper isalso randomly located in the service area, composed of a single antenna andassociated with its own randomly located uniformly distributed clusters ofscatterers. Its goal is to intercept the signal sent by the AP to the target user.
Our system can be considered as a SISO system, because we have a single
14

Figure 2.1: System layout
antenna at both transmitter (the AP) and receiver sides (the target user andthe eavesdropper).
For a general SISO system, the transmitted signal is:
y(t) = hk(t)⊗ x(t) (2.1)
where y(t) denotes the output of the AP's antenna, hk(t) is the averagechannel impulse response relative to the AP's antenna and the cluster k.x(t) is the signal sent by AP.
2.1.2 Antenna system
One important aspect of our project is the characterization of the beam.Therefore, the sort of pattern we will create is not important, we can con-
15
sider a pattern with only one beam. Indeed, we will consider this kind ofpattern for simplicity in our scenarios. What we need to consider here is theHPBW, i.e. the angle covered by the pattern of the AP and associated tothe halved power transmitted.In our scenarios, we will vary the width of thebeams to see the in�uence on the power received by both target user andeavesdropper.As we only need to deal with directional responses, we will use a simple di-rectional antenna with a directional pattern. Moreover, a mechanical systemwill allow us to steer the pattern in the chosen direction.
2.1.3 Channel
Before going into the channel model, we will explain how the signal can bemodi�ed when it is sent from the transmitter to the receiver. Three kinds ofmechanism can perturb a signal: re�ections from large object, di�ractionsof electromagnetic waves, and signal scattering:
� We can observe re�ections when a wave impinges on a smooth surfacewith very large dimensions compared to the Radio Frequency signalwavelength.
� We can observe di�raction when the path between transmitter andreceiver is obstructed by a dense body with large dimensions comparedto the wavelength.
� Finally, we can observe scattering when a wave impinges on either alarge rough surface or any surface whose dimension are on the order ofthe wavelength.
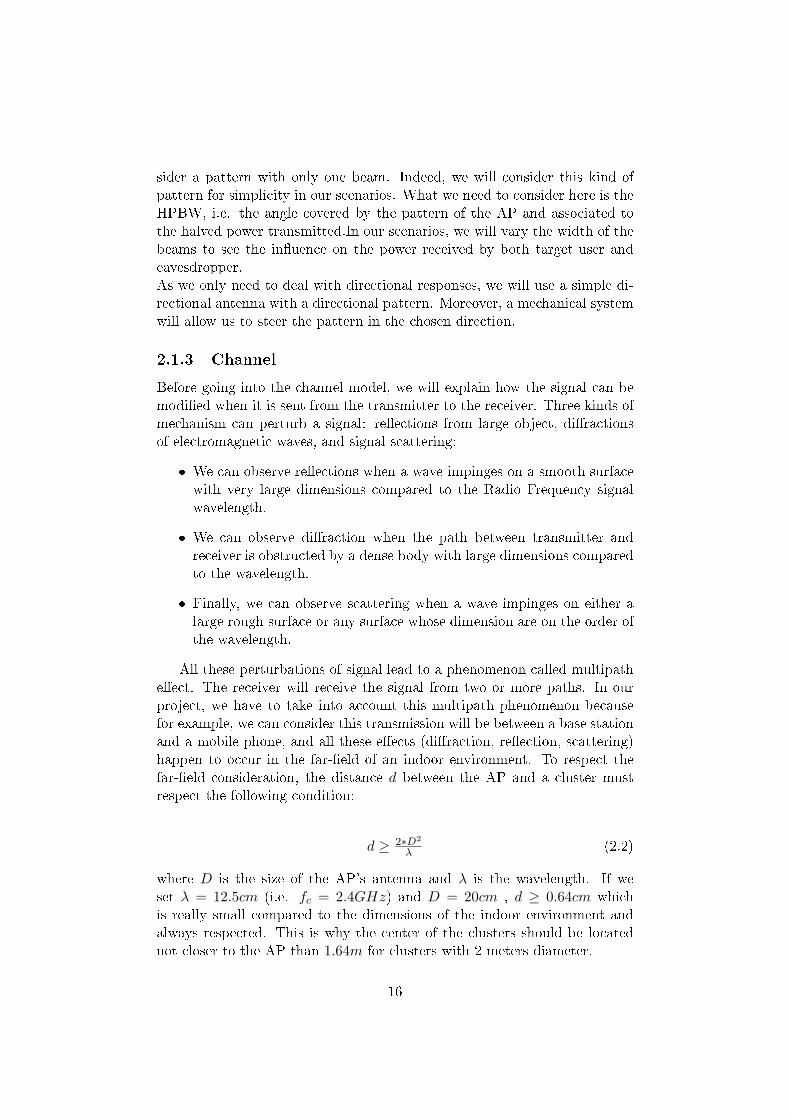
All these perturbations of signal lead to a phenomenon called multipathe�ect. The receiver will receive the signal from two or more paths. In ourproject, we have to take into account this multipath phenomenon becausefor example, we can consider this transmission will be between a base stationand a mobile phone, and all these e�ects (di�raction, re�ection, scattering)happen to occur in the far-�eld of an indoor environment. To respect thefar-�eld consideration, the distance d between the AP and a cluster mustrespect the following condition:
d ≥ 2∗D2
λ (2.2)
where D is the size of the AP's antenna and λ is the wavelength. If weset λ = 12.5cm (i.e. fc = 2.4GHz) and D = 20cm , d ≥ 0.64cm whichis really small compared to the dimensions of the indoor environment andalways respected. This is why the center of the clusters should be locatednot closer to the AP than 1.64m for clusters with 2 meters diameter.
16

We will consider an indoor service area of dimensions (D1 � λ,D2 � λ),e.g. an amphitheater, and an average CSI, because of open loop SISO sys-tem. The target user's small movements imply fading channel manifesta-tions called "small-scale fading". Indeed, motion causes doppler shift in thereceived signal components. To build our channel model, we can use theRayleigh fading channel model. Rayleigh fading is a model used when thereare many objects in the environment which scatter the radio signal before itarrives at the receiver. Rayleigh fading is most applicable when there is nodominant propagation along a line of sight between transmitter and receiver.This model assumes that the magnitude of a signal will vary randomly, orfade, according to a Rayleigh distribution. We consider narrowband case forsimplicity.
2.1.4 Power consideration
We will use a power modelling to model the quality of signal received bythe target user. What the target user receives fully depends on what thecluster gets. As the AP only broadcasts towards what he can see, i.e. theclusters, the power received by a cluster from the AP will represent the powerreceived by the target user with respect to our previous small-scale fadingassumption. It means that we do not need to consider the signal from thescatterer to the target user, we just take into account the signal from theAP to the di�erent scatterers.
The instantaneous and average CSI are calculated as following:
hi,k = A× exp(jφi,k)× exp( j×2π×L1i,k
λ ) (2.3)
hk =
√(∑Nscatt
i=1 |hi,k|2)
Nscatt(2.4)
where hi,k is the instantaneous channel impulse response from AP rela-tive to the scatterer i in cluster k, A is the amplitude of the scatterer andφi,k represents the phase of the scaterrer i in cluster k. L1i,k is the distancefrom AP to the the scatterer i in cluster k, λ is the wavelength. Nscatt is thenumber of scatterers in one cluster (Nscatt = 20 in our case), and hk is theaverage impulse response from AP to cluster k.
Knowing the average CSI allows us to calculate the average power re-ceived by AP from each target user's clusters (uplink communication)
Pri,k = |hi,k|2 × PtTU (2.5)
Prk = (∑Nscatt
i=1 Pri,k)Nscatt
(2.6)
17

where Pri,k is the received power at AP's antenna from the scatterer iin cluster k, PtTU is the normalized power sent by the target user and hi,kis the instantaneous channel impulse response (see equation (2.3)). Nscatt isthe number of scatterers in one cluster (Nscatt = 20 in our case) and Prk isthe average power received by AP from cluster k.
To obtain the average power received at a cluster, we compute the Friistransmission equation in far-�eld which is:
Prclusterk = Pt×GAP (θclusterk)×(
λ4π×L1i,k
)2(2.7)
where Pt is the transmitted power by the AP's antenna set to 20dBm,GAP (θclusterk) is the antenna gain of the AP towards cluster k, λ is thewavelength, L1i, k is the distance between AP and the scatterer i in thetarget user's cluster k.
As our system is considered as an open loop, we assume that the down-link(from AP to target user) is the same as the uplink because of a smallchange in the space location of the target user. So if we look at Figure 2.2,we can see what happens during an uplink communication when a scatterera�ects the average channel impulse response with its proper amplitude Aand phase phi with respect to distances L1 and L2.
Figure 2.2: How scattering a�ects the average channel impulse response
Our main parameters for our channel model are:
� center frequency: fc = 2.4GHz
� service area dimensions: D1 = 30m,D2 = 30m
18

� number of target user: nbuser = 1
� number of eavesdropper: nbeaves = 1
� radius of cluster: 1m
� transmitted power by the AP's antenna: Pt = 20dBm
� noise �oor: N = −80dBm
� number of clusters according to ref. [23], [24]
� Scenario 1
* number of target user's clusters: nbusercluster = 5* number of eavesdropper's clusters: nbeavescluster = 3
� Scenario 2
* number of target user's clusters: nbusercluster = 4* number of eavesdropper's clusters: nbeavescluster = 4
� Scenario 3
* number of target user's clusters: nbusercluster = 3* number of eavesdropper's clusters: nbeavescluster = 5
� number of scatterers per cluster: nbscatt = 20
2.2 Algorithm
The system performance can be divided in two types as referred in [25].
� The Acquisition Phase is the state when the array is sweeping hispattern (or beam) along the environment. At the beginning, the APcreates a beam in a direction and gets the directional channel responsefrom the clusters. Then it sweeps this beam to another direction andgets another directional channel response from the clusters as shown inFigure 2.3. In this Figure, any eavesdropper is represented as we don'thave any directional response from him. When all the directions havebeen explored, the AP obtains the directional power pro�le (Figure2.4) of the service area and goes to the Operation Phase. The sweepingmeasurement response is calculated as following:
M(θ) =∮θ E(θ).A(θ − θcluster)dθ (2.8)
As we assume uncorrelated scattering, which means incoherent powersummation, the equation ( 2.8) reduces to:
19

M(θ) = E(θ)⊗A(θ − θcluster) (2.9)
Figure 2.3: Aquisition phase
� The Operation Phase (after the Acquisition Phase) is a state wherethe array chooses the direction corresponding to the best directionalchannel response (consequently the highest power) to sweep his beamand send his signal (Figure 2.5). Finally, to guarantee the target usera good quality of signal throughout the sweeping process which meansa constant power received, we apply to the array a power control algo-rithm. This power control is making sure that the target user alwaysreceives the same amount of power by sending an appropriate amountof power in the direction of a given cluster. This process would avoidthe eavesdropper to receive a decent and constant power and so to lis-ten to the target user's communication.
We can remark in our algorithm that for each position of the clusters,we are sweeping the pattern along the whole environment to get thedirectional responses which will be used to jump from a cluster to
20

Figure 2.4: Directional power pro�le
Figure 2.5: Operation phase
21

another to send the desired signal to the target user. It consists of ourbeam sweeping/hopping algorithm.
The implementation parameters of the Matlab code are given in thenext part of this report.
22

Chapter 3
Implementation
3.1 Simulation conditions
The service area is de�ned thanks to the AP, which is set up at theorigin of the axes as shown in Figure 2.1. The service area will notexceed 30m*30m, as we consider an indoor environement such as anamphitheater. The AP is constituted by a single antenna.
The target user is randomly located in the de�ned service area, and hiscircular clusters are constituted by 20 scatterers located on the circle.The radius of the circle is set to 1m and changed to 1.5m for compar-ison. The scatterers are randomly uniformly distibuted on the circle.The amplitude of each scatterer is 1dB but their phase is randomlychosen.The eavesdropper is also randomly located in the de�ned service area,and his circular clusters are constitued by 20 scatterers located on acircle. However, we don't know anything about the eavesdropper, likehis position or his power as he is not emmiting any signal. The eaves-dropper is only listening and trying to intercept any other signals.A Rayleigh fading environment is assumed and the angular spread isset to 0°. To represent the Rayleigh distribution we will consider 20waves (because of the 20 scatteres) arriving at the AP (knowing thata minimum of 8 waves are necessary to represent a Rayleigh distribu-tion) [26]. The amplitude of each of these waves is the same while arandom phase is generated for each of them.
As a reminder, the average power received at a cluster is calculated asfollowing:
23

Prclusterk = Pt×GAP (θclusterk)×(
λ4π×L1i,k
)2(3.1)
where Pt is the transmitted power of the AP set to 20dBm in oursimulations, GAP (θclusterk) is the gain of the AP set to either 5dBi,8dBi, 9dBi, or 10dBi depending on the beamwidth of its beam pattern.L1i, k is the distance between the AP and the cluster concerned. Thegain of the cluster is set to 1 or 0dBi so this is why it does not appearin the equation.
In our project, we evaluate and compare the power received by thetarget user and the power received by the eavesdropper when the APis equipped with a mechanically sweeping antenna. All the results willbe shown in the next chapter.
3.2 Parameters de�nition and scenarios
The noise �oor in our simulations is set to−80dBm which seems to be arealistic threshold for an indoor service area as shown in [27] and [28].
The SER is a parameter we will use to check when the amount ofpower received by the target user is superior to the power received bythe eavesdropper. This parameter is given by the relationship:
SER = SE (3.2)
where S is the power received by the target user, E is the power re-ceived by the eavesdropper. We will plot the CDF of the SER.
The SNR is an absolute parameter we will check to evaluate the e�-ciency of our results as the SER is just a relative value. This parameteris given by the relationship:
SNR = SN (3.3)
where S is the power received by the target user or eavesdropper, Nis the noise �oor in the service area set to −80dBm. We will plot theCDF of the SNR.
24

The power received by the target user Puser (resp. eavesdropper Peaves)is a parameter used to evaluate the amount of power received after onesimulation, knowing that we consider 200 di�erent positions of bothtarget user and eavesdropper's clusters in one simulation. We will plotthis curve and check how often the power of the eavesdropper is higherthant the target user's one. Then we will make an average of this powerover 10 simulations. One point of this curve will represent an averageof the power received by the target user Puser (resp. eavesdropperPeaves) over 200 positions of clusters. Afterwards, we will make thesame simulations using a power control, which will allow us to adjustthe power sent by the AP so that each cluster receives the same amountof power. All these results will be compared with a reference, which isa non hopping antenna.
To do that we will consider 3 scenarios:
� Fixed beam: This �rst scenario will be the reference, what will allowus to see if the solution we propose will perturbate the signal receivedby the eavesdroper.
� Beam hopping: In this scenario, we will use a beam hopping systemto send the signal to the target user. The algorithm described belowwill allow us to jump between clusters to send this signal to the onereceiving the highest power.
� Beam hopping + AGC: We will add to the previous scenario a powercontrol, which makes the power of the signal received by the targetuser always constant.
3.3 Procedure
Let us describe the procedure we will follow to plot the results of oursimulations. This procedure is divided in two steps:
� acquisition phase
� operation phase
We will repeat these two steps each time we will repeat our algorithm.
3.3.1 Acquisition phase
� for each position of the clusters
� sweep the service area
25

� �nd the directional responses of the clusters of the target user
� estimating the average CSI from each cluster of the target user toAP (see equation (2.3))
� adapt the beam towards the cluster, which presents the best CSI
3.3.2 Sending of the information
� for each position of the clusters
� computing the power received by the AP from each cluster (seeequation (2.6))
� computing the gain towards the cluster with the best CSI
� estimating the received power at this chosen cluster of the targetuser (see equation (3.1))
� adapting the power so that each cluster receives the same amountof power (Power control)
� estimating the received power at each cluster of the target userand eavesdropper (see equation (3.1))
� comparing those received signals to the noise �oor.
26

Chapter 4
Results
This chapter is dedicated to the results of our Matlab simulation. Weare going to present all the results of the di�erent scenarios. The resultswill be presented for each scenario regarding the number of clusters forboth target user and eavesdropper, the radius of these clusters and thebeamwidth of the main beam in the radiation pattern of the AP. Table4.1 below, is a brief reminder of the di�erent parameters we changedduring the simulations of all the scenarios.
Simulation parametersScenario 1: Scenario 2 Scenario 3Reference
Power management Fixed Beam Beam Hopping Beam Hopping +AGC
Number of positions of the 200 200 200clusters in 1 simulationNumber of simulations 10 10 10
Table 4.1: Simulations parameters table
The AGC power management consists of guaranteeing the target userwith a constant amount of power received, i.e. a dynamic power al-location at AP before transmitting its signal. The number of posi-tions of the clusters per simulation is set to 200 for both target userand eavesdropper's clusters which means that these clusters will bemoved 200 times to uniformly distributed random locations in the ser-vice area during 1 simulation. The number of simulations representshow many times both target user and eavesdropper are moved to uni-formly distributed random locations in the service area. As we con-sider 10 simulations, this means that the clusters will change positions
27

200 ∗ 10 = 2000 times over all the simulations.
Below is a Table 4.2 summarizing the parameters related to bothtarget user and eavesdropper's clusters .
Clusters parametersScenario 1 Scenario 2 Scenario 3
Number of scatterers per cluster 20 20 20Number of target user's clusters 4 5/4/3 5/4/3Number of eavesdropper's clusters 4 3/4/5 3/4/5Radius of clusters [m] 1 1 1
Table 4.2: Clusters parameters table
For scenario 2 and scenario 3 the results will be divided in three parts:
� when the target user is associated with more clusters than theeavesdropper
� when the target user and eavesdropper are associated with thesame number of clusters
� when the target user is associated with less clusters than theeavesdropper
Inside each of these parts we will focus on three representative �gures.The �rst interesting plot to check is the average power received by bothtarget user and eavesdropper for each movement of the clusters withinone simulation. This tells us about the e�ciency of the antenna pat-tern. Then we focus on the average power received by both target userand eavesdropper for every movement of the clusters over all the sim-ulations which allows us to have a more general view of the amount ofpower received over a huge number of locations considerations. Thenwe look at the CDF of SER to check how often the target user hasa better signal than the eavesdropper. Obviously, the more often thetarget user has a better signal, the more e�cient is the antenna patternmanagement. Finally, we observe the SNR for both target user andeavesdropper to see if the eavesdropper's clusters are located close tothe target user's ones.
Afterwards, we will focus on the e�ects of the radius and the beamwidthof the antenna pattern on the power received by both target user andeavesdropper's clusters.
Below are two Table 4.3 (resp.Table 4.4) summarizing the parametersrelated to both target user and eavesdropper's radius (resp. beamwidth).
28

Radius parametersScenario 1 Scenario 2 Scenario 3
Number of scatterers per cluster 20 20 20Number of target user's clusters 4 4 4Number of eavesdropper's clusters 4 4 4Radius of clusters [m] 1/1.5 1/1.5 1/1.5
Table 4.3: Radius parameters table
Beamwidth parametersScenario 1 Scenario 2 Scenario 3
Number of scatterers per cluster 20 20 20Number of target user's clusters 4 4 4Number of eavesdropper's clusters 4 4 4Beamwidth [°] 60° 10°/25°/60° 10°/25°/60°
Table 4.4: Beamwidth parameters table
The last part of this chapter will compare the results obtained with areference.
Figure 4.1 below represents the response of the environment. We takeinto account this information in every scenario to be able to choosethe direction of the pattern. We observe that the best received powerfrom the environment comes from the direction 100-120° on this �gureso the AP will mechanically hop its beam towards this direction. This�gure is quite �at because in this case, the target user's clusters arequite close to each other, which leads to a smooth response of the en-vironment.
Figure 4.1: Environment response
29

4.1 In�uence of the number of clusters
4.1.1 First scenario : Fixed beam
This �rst scenario will be used as a reference for the next scenarios.Indeed, we will consider a �xed beam pattern, which will be used tosend the information towards the target user and the eavesdropper. Inthis simulation, we consider 4 clusters for both target user and eaves-dropper. The radius of the cluster is set to 1m. The signal will besent in a random direction and we will estimate the power received byboth target user and eavesdropper, using two di�erent orientations ofthe beam: 0° and 90°.
Beam pattern
Figure 4.2 represents one of the two �xed patterns used in this scenario,this one being oriented at 90°. We will compare the results obtainedusing a pattern oriented in the 90° direction and a pattern oriented inthe 0° direction. Their half-power beamwidth is of 60° for an antennagain of 5dBi. Making a comparison of the results we will obtain withthis two �xed beams is interesting because we should theoritically ob-tain the same SER for the two orientations of the beam as the clustersfor both target user and eavesdropper are randomly uniformly located.
Average power received
Figure 4.3 (resp. Figure 4.4) represents the average power receivedby both target user (full line with stars) and eavesdropper (dotted linewith diamonds) considering a beam with an orientation of 0° (resp.90°). The shape and value obtained are similar on both �gures. Theorientation of the beam doesn't in�uence the results, because we areconsidering the same number of clusters for both target user and eaves-dropper and all the clusters are randomnly located. So the closer tothe AP one cluster is, the higher power he receives during the simula-tion. It is relevant that the received power is slightly higher (around1dB better) with a beam oriented at 90° since the maximum values ofthe gain can be reached on both sides of the beam whereas it can onlyhappen on the left side of the beam for a 0° oriented beam (the servicearea is 180° wide from the AP's point of view).Figure 4.5 and Figure 4.6) showing the power received for each newposition of the clusters lead to the same observation with a minimum
30

Figure 4.2: Fixed beam oriented in the 90° direction
value of received power by the target user of −79dBm for a 90° ori-ented beam and −89dBm for a 0° oriented beam which exceeds thenoise �oor and is not usedul to the target user. The same di�erence isobservable for the minimum power received by the eavesdropper.
SER
Figure 4.7 and Figure 4.8 represent the CDF of the SER with anorientation of the beam of 0° and 90°. The results are in compliancewith what we expected. Indeed, the power received by the targetuser is equal or higher than the power received by the eavesdropperon both curves 50% of the time. This is because all the clusters arerandomnly located, so we have equal chances to have a cluster of atarget user (resp.eavesdropper) closer than a cluster of an eavesdropper(resp.target user) to the AP. These results will be considered as areference for the others scenarios.
SNR
In Figure 4.9 and Figure 4.10 are shown the CDF of the SNR forboth orientations of the beam. The target user and the eavesdropperpresent almost the same curves still because of the randomness of theirclusters location. Their maximum SNR is of 60dB for both of them.
31

Figure 4.3: Average power received by the target user and the eavesdropperafter 10 simulations (0°)
Figure 4.4: Average power received by the target user and the eavesdropperafter 10 simulations (90°)
32
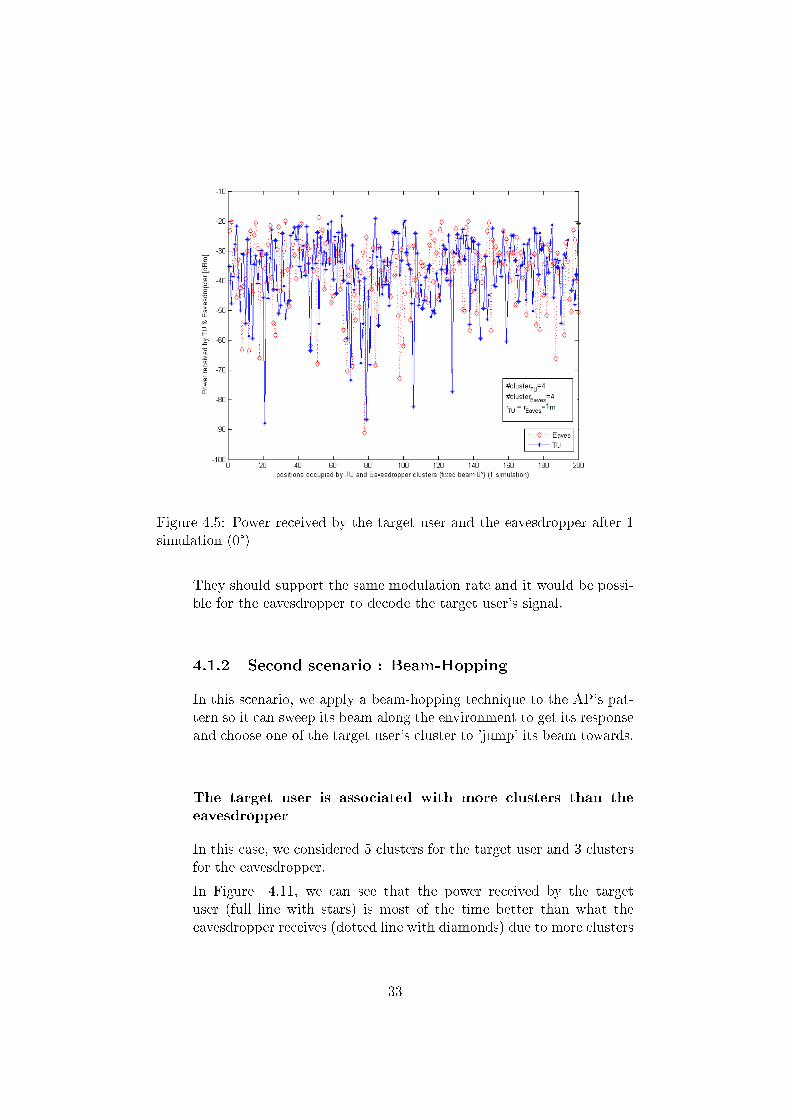
Figure 4.5: Power received by the target user and the eavesdropper after 1simulation (0°)
They should support the same modulation rate and it would be possi-ble for the eavesdropper to decode the target user's signal.
4.1.2 Second scenario : Beam-Hopping
In this scenario, we apply a beam-hopping technique to the AP's pat-tern so it can sweep its beam along the environment to get its responseand choose one of the target user's cluster to 'jump' its beam towards.
The target user is associated with more clusters than the
eavesdropper
In this case, we considered 5 clusters for the target user and 3 clustersfor the eavesdropper.
In Figure 4.11, we can see that the power received by the targetuser (full line with stars) is most of the time better than what theeavesdropper receives (dotted line with diamonds) due to more clusters
33

Figure 4.6: Power received by the target user and the eavesdropper after 1simulation (90°)
located in the service area giving less chances to the eavesdropper tocatch the signal sent by the AP towards one of the target user's cluster.
Then, the plotted CDF in Figure 4.12 shows that the eavesdropperreceives a higher power from the AP than the target user in less than18% of the cases. In other terms, the target user has a better qualityof signal in 82% of the simulations with a bigger number of clustersassociated with him. As another reference, the target user reaches a30 dB higher power than the eavesdropper in 10% of the simulations.
In Figure 4.13, it is obvious that the SNR (steeper curve on the right)of the target user is very good and steep (i.e. stable signal) comparedto the eavesdropper (curve on the left) and always above 40dB. How-ever for the eavesdropper this ratio happens to be negative in a fewcases, i.e. the eavesdropper is unable to catch any exploitable signaland its curve is really �at compared to the target user's one meaningthat its signal is erratic. Besides, in 20% of the cases considered, thedi�erence between the 2 ratios is bigger than 18dB which is quite in-teresting if we consider a suitable modulation rate for the target user'ssignal.
34

Figure 4.7: CDF of the SER (0°)[dB]
The target user and eavesdropper are associated with the
same number of clusters
In this case, we considered 4 clusters for the target user and 4 clustersfor the eavesdropper.
In Figure 4.14, we can see that the power received by the target user(full line with stars) is most of the time better than what the eaves-dropper receives (dotted line with diamonds) due to to the orientationof the beam in the direction of the target user. However, the curve ofthe power received by the eavesdropper is more often over the targetuser one than on the Figure 4.11, because we are considering one clus-ter less for the target user and one cluster more for the eavesdropperthan the previous case (5 clusters for the target user and 3 for theeavesdropper). Meanwhile, the eavesdropper still presents low powerlevels down to −85dBm, i.e. below the noise �oor.
The CDF in Figure 4.15 shows that the eavesdropper receives a higherpower from the AP than the target user 27% of the time. In otherterms, the target user has a better quality of signal in 73% of thesimulations with the same number of clusters associated with him. Asan other reference, the target user reaches a 20 dB higher power thanthe eavesdropper in 16% of the simulations.
35

Figure 4.8: CDF of the SER (90°)[dB]
In Figure 4.16 the di�erence between the two curves in 20% of thesimulations is of approximately 14dB. This variation leads to a quitegood SER on Figure 4.15 as the target user's clusters are obviouslycloser to the AP. Besides the eavesdropper's curve is very �at andmakes its signal unstable with poor SNR (lower than 0dB) in almost5% of the cases. The target user's curve is steep, sign of stability, andalways above 40dB, guaranteeing him with a good and stable signal.
The target user is associated with less clusters than the eaves-
dropper
In this case, we consider 3 clusters for the target user and 5 clustersfor the eavesdropper.
In Figure 4.17, we can see that the power received by the target user(full line with stars) is almost two thirds of the time better than whatthe eavesdropper receives (dotted line with diamonds) due to direc-tional pattern towards one of his cluster but since the eavesdropperhas more clusters associated, it still has good chances to catch the sig-nal sent by the AP towards one of the target user's cluster. Whereasthe power levels for the eavesdropper happen to be really low and down
36

Figure 4.9: CDF of the SNR (0°)[dB]
to the noise �oor sometimes.
The CDF in Figure 4.18 shows that the eavesdropper receives a higherpower from the AP than the target user in 40% of the cases. In otherterms, the target user has a better quality of signal in 60% of thesimulations with a smaller number of clusters associated with him. Asan other reference, the target user reaches a 20 dB higher power thanthe eavesdropper in 12% of the simulations.
In Figure 4.19, the target user has a better SNR (steeper curve onthe right) than the eavesdropper (curve on the left) but the di�erenceis not that big since in 20% of the simulations the target user's SNRis only 6dB higher than the eavesdropper's one. Of course, the tar-get user's curve is always above 40dB and the eavesdropper's curve isquite �at but these two curves tend to equalize around 20% of the timealso. This is quite bad for the target user who can have is transmissiondecoded quite often in this case.
37

Figure 4.10: CDF of the SNR (90°)[dB]
Figure 4.11: Power received by both TU and Eavesdropper over 1 simulation(5cl vs 3cl)
Conclusion for the second scenario
Considering more clusters associated with the target user than withthe eavesdropper leads to the best results in terms of power received
38

Figure 4.12: CDF of the SER [dB] (5cl vs 3cl)
Figure 4.13: CDF of the SNR [dB] (5cl vs 3cl)
over each simulation, in terms of SER and also SNR.Besides, considering the same number of clusters for both target userand eavesdropper or less clusters for the target user still shows thatthe latter receives a higher power in both cases. It is clear that adding
39

Figure 4.14: Power received by both TU and Eavesdropper over 1 simulation(4cl vs 4cl)
Figure 4.15: CDF of the SER [dB] (4cl vs 4cl)
more and more clusters for the eavesdropper would make the SERtend to 0dB in 50% of the simulations and the SNR of the eavesdrop-per approaching the target user's one more and more often, but thisnecessitates a huge number of clusters for the eavesdropper comparedto the target user and has not been reached in our simulations yet.Obviously, the Beam-Hopping technique deteriorates the SNR of the
40

Figure 4.16: CDF of the SNR [dB] (4cl vs 4cl)
Figure 4.17: Power received by both TU and Eavesdropper over 1 simulation(3cl vs 5cl)
eavesdropper while improving the one of the target user, and at thesame time provides better results than when a �xed beam is appliedat the AP.
The two main points of the second scenario are:
� Optimizing the pattern in the direction of the target user's clus-ters
� Checking if the directional pattern makes it more di�cult for theeavesdropper to catch a stable signal
41

Figure 4.18: CDF of the SER [dB] (3cl vs 5cl)
Figure 4.19: CDF of the SNR [dB] (3cl vs 5cl)
4.1.3 Third scenario : Beam-Hopping + AGC
Besides the fact that the AP is still jumping its beam towards oneof the target user's cluster, it is also applied a process called AGCthat can guarantee the target user with receiving the same amount ofpower for any position of his clusters. Indeed the AP will adapt hispower transmitted so that the target user will always receive a power
42

of −25dBm.
The target user is associated with more clusters than the
eavesdropper
In this case, the target user is associated with 5 clusters while theeavesdropper is associated with 3.
The average received power level after AGC is set to −25dBm for thetarget user in Figure 4.20. We can see that variance of the eaves-dropper's power is really big with a maximum value of −12dBm anda minimum of −88dBm which is happening due to the fact that hisclusters are located at the edge of the service area with great anglesbetween them and the target user's clusters with respect to the AP.It can happen that the eavesdropper receives more than −25dBm whenthe target user is very far from the AP and the eavesdropper is veryclose to it with an angle approaching the direction of the target user.In this case, the AP will send a lot of power so that the target userreceive −25dBm. As a consequence, the eavesdropper will receive ahigher power than −25dBm.
Figure 4.20: Power received by both TU and Eavesdropper over 1 simulation(5cl vs 3cl)
Concerning the CDF of the SER, we can see in Figure 4.21 that theeavesdropper receives a higher power from the AP than the target userin less than 18% of the cases. In other terms, the target user has abetter quality of signal in 82% of the simulations with a bigger numberof clusters associated with him. As an other reference, the target userreaches a 30 dB higher power than the eavesdropper in 18% of thesimulations. This is re�ected in Figure 4.22 where the SNR of the
43

target user is always 55dB due to the noise �oor set at −80dBm. In20% of the cases, the di�erence between the power received by thetarget user and the one receive by the eavesdropper is 20dB. Thetarget user's clusters receive a lot more power than the eavesdropper'sthanks to AGC and the orientation of the beam.
Figure 4.21: CDF of the SER [dB] (5cl vs 3cl)
The target user and eavesdropper are associated with the
same number of clusters
In this case, the target user is associated with 4 clusters and the eaves-dropper is associated with 4 clusters as well.
The average received power level after AGC is set to −25dBm for thetarget user in Figure 4.23. We can see that variance of the eaves-dropper's power is still big with a maximum value of −9dBm anda minimum of −77dBm which is happening due to the fact that hisclusters are located at the edge of the service area with great anglesbetween them and the target user's clusters with respect to the AP assaid previously.
Concerning the CDF of the SER, we can see in Figure 4.24 that theeavesdropper receives a higher power from the AP than the target user
44

Figure 4.22: CDF of the SNR [dB] (5cl vs 3cl)
Figure 4.23: Power received by both TU and Eavesdropper over 1 simulation(4cl vs 4cl)
in less than 27% of the cases. In other terms, the target user has abetter quality of signal in 73% of the simulations. As an other reference,the target user reaches a 20 dB higher power than the eavesdropper in15% of the simulations. These quite good results are con�rmed by theSNR plot in Figure 4.25 which shows us that the eavesdropper has30% of the chances to get a SNR smaller than 40dB while the targetuser has always a 55dB SNR. Finally, the di�erence between the powerreceived by the target user and the one received by the eavesdropperis 17dB in 20% of the cases.
45

Figure 4.24: CDF of the SER [dB] (4cl vs 4cl)
Figure 4.25: CDF of the SNR [dB] (4cl vs 4cl)
The target user is associated with less clusters than the eaves-
dropper
In this case, the target user is associated with 3 clusters while theeavesdropper is associated with 5.
46

The average received power level after AGC is set to −25dBm forthe target user in Figure 4.26. The eavesdropper receives a betterpower for much more positions than previously because of his goodchances over the target user to catch the signal from the AP with 2more clusters randomly located in the service area. We can see thatthe variance of the eavesdropper's power is still big with a maximumvalue of −10dBm and a minimum of −89dBm.
Figure 4.26: Power received by both TU and Eavesdropper over 1 simulation(3cl vs 5cl)
Concerning the CDF of the SER, we can see in Figure 4.27 that thatthe eavesdropper receives a higher power from the AP than the targetuser in less than 40% of the cases. In other terms, the target user has abetter quality of signal in 60% of the simulations. As an other reference,the target user reaches a 10 dB higher power than the eavesdropperin 23% of the simulations. The results are con�rmed in Figure 4.28where the SNR of the eavesdropper is better than the target user's onein 40% of the cases. Finally, the di�erence between the power receivedby the target user and the one received by the eavesdropper is 12dBin 20% of the cases.
Conclusion for the third scenario
The Beam Hopping pattern combined with an AGC process lead to aconstant power level delivered to the target user while the eavesdropperreceives an erratic signal oscillating in a big range of values all thetime. Of course these observations are emphasized when the targetuser bene�ts from a bigger number of clusters. Besides, the CDF ofthe SER in both cases are really steep which attests the e�ciencyof the AGC process making eavesdropping more di�cult. The same
47

Figure 4.27: CDF of the SER [dB] (3cl vs 5cl)
Figure 4.28: CDF of the SNR [dB] (3cl vs 5cl)
observation can be made on the SNR of the target user. The two mainpoints of the third scenario are:
� Applying an AGC process to the optimized directional beam pat-tern.
� Checking if the AGC combined with the directional pattern makesit more di�cult for the eavesdropper to catch a stable signal while
48

always guaranteeing the target user with a constant amount ofpower.
4.1.4 Comparison
These simulations o�ered two techniques to perturb the signal receivedby the eavesdrooper.The �rst part showed that the use of a mechanical hopping antennabrings a big improvement in the perturbation of the signal received bythe eavesdropper. Indeed, the chances that the average power receivedby the eavesdropper would be equal or higher that the one received bythe target user decrease from 50% to 27% (Figure 4.29) when usingBeam-Hopping. It allows us to say that it is more di�cult for theeavesdropper to catch the signal sent by the AP.
Figure 4.29: SER comparison between the reference �xed beam (left) andthe hopping antenna system without AGC (right) (4cl vs 4cl) [dB]
Finally, the Figure 4.30 displays the results of the three scenariosregarding the SNR. Adding the AGC to the beam hopping patternsystem makes the life more di�cult for the eavesdropper, which meansthat it will be very hard for him to catch the signal. Moreover, if atarget user's cluster is very close to the AP and the eavesdropper's onefarther, the power sent by the AP would be very weak. As a conse-quence, the power received by the eavesdropper's cluster will be evenweaker than without AGC.
4.2 In�uence of the radius of clusters
This section is dedicated to the in�uence of the radius of the clusterson the power received by both target user and eavesdropper's clusters.
49
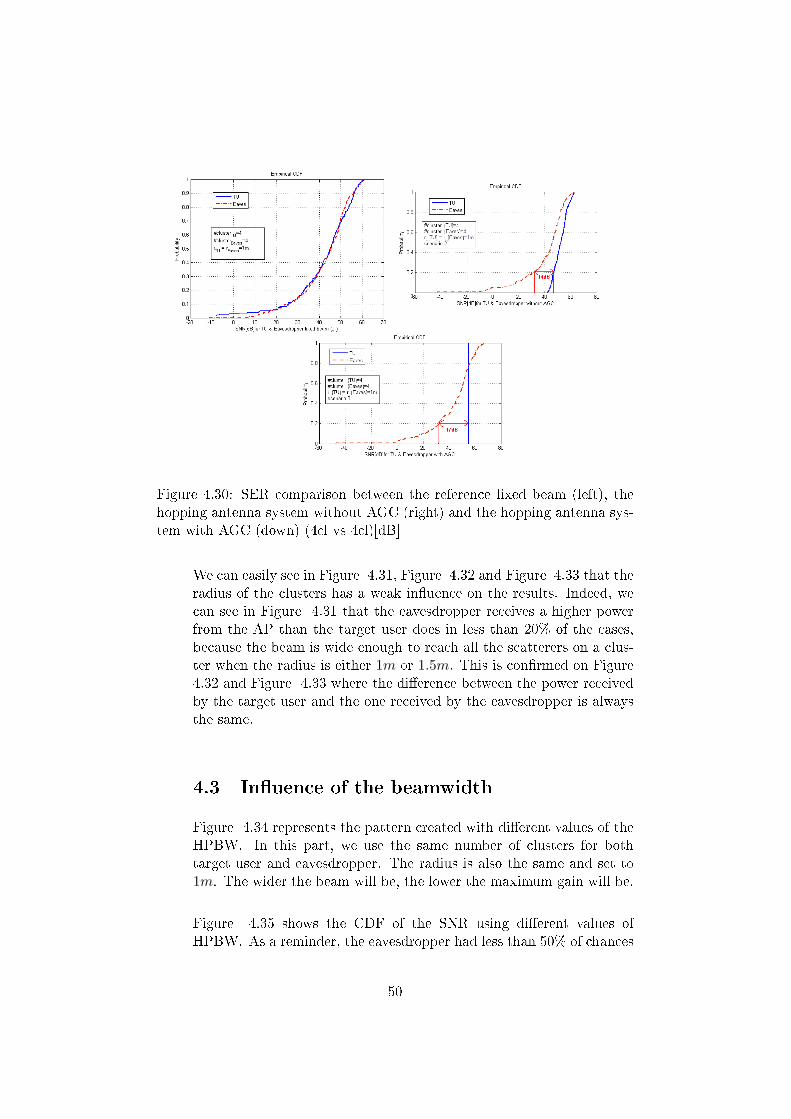
Figure 4.30: SER comparison between the reference �xed beam (left), thehopping antenna system without AGC (right) and the hopping antenna sys-tem with AGC (down) (4cl vs 4cl)[dB]
We can easily see in Figure 4.31, Figure 4.32 and Figure 4.33 that theradius of the clusters has a weak in�uence on the results. Indeed, wecan see in Figure 4.31 that the eavesdropper receives a higher powerfrom the AP than the target user does in less than 20% of the cases,because the beam is wide enough to reach all the scatterers on a clus-ter when the radius is either 1m or 1.5m. This is con�rmed on Figure4.32 and Figure 4.33 where the di�erence between the power receivedby the target user and the one received by the eavesdropper is alwaysthe same.
4.3 In�uence of the beamwidth
Figure 4.34 represents the pattern created with di�erent values of theHPBW. In this part, we use the same number of clusters for bothtarget user and eavesdropper. The radius is also the same and set to1m. The wider the beam will be, the lower the maximum gain will be.
Figure 4.35 shows the CDF of the SNR using di�erent values ofHPBW. As a reminder, the eavesdropper had less than 50% of chances
50
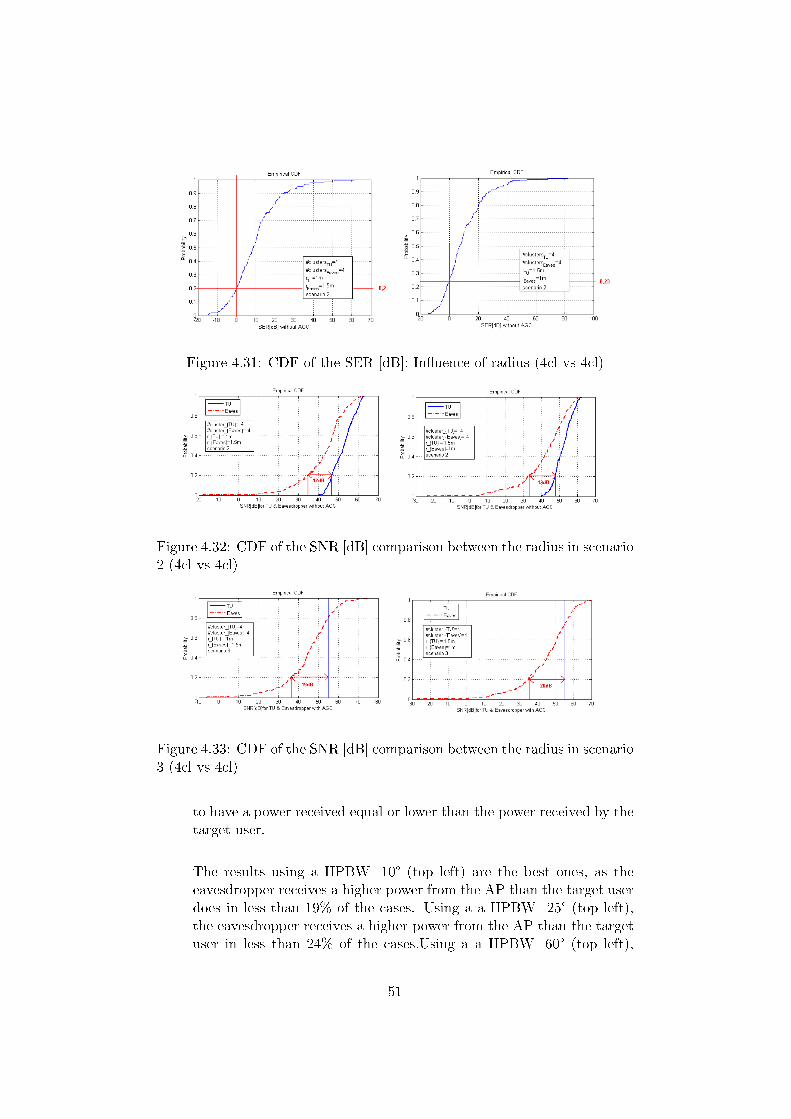
Figure 4.31: CDF of the SER [dB]: In�uence of radius (4cl vs 4cl)
Figure 4.32: CDF of the SNR [dB] comparison between the radius in scenario2 (4cl vs 4cl)
Figure 4.33: CDF of the SNR [dB] comparison between the radius in scenario3 (4cl vs 4cl)
to have a power received equal or lower than the power received by thetarget user.
The results using a HPBW=10° (top left) are the best ones, as theeavesdropper receives a higher power from the AP than the target userdoes in less than 19% of the cases. Using a a HPBW=25° (top left),the eavesdropper receives a higher power from the AP than the targetuser in less than 24% of the cases.Using a a HPBW=60° (top left),
51

Figure 4.34: 3 di�erent patterns [dB]
the eavesdropper receives a higher power from the AP than the targetuser in less than 27.% of the cases. Indeed, the narrower the beam is,the higher the gain will be for the target user. As a consequence, thepower received by the target user will be higher. Morever, the beam iswide enough to reach all the scattererd on the cluster.
4.4 Conclusion
To conclude on this simulation, it is obvious to say that combininga beam-hopping pattern technique with a AGC is already quite ro-bust against eavesdroppers. Indeed, the results in this case are betterthan the reference and also than the case when we only use the beam-hopping pattern. Therefore, it can happen that the eavesdropper staysa certain period with receiving a very good average power. This lets ussuppose that he would be able to catch some information during thisperiod.
52

Figure 4.35: CDF of the SER with a HPBW of 10° (top left), 25° (top right)and 60° (down) [dB]
Figure 4.36: CDF of the SNR with a HPBW of 10° (top left), 25° (top right)and 60° (down)(scenario 3)
53

One interesting technique which would have been interesting to testis the use of a threshold applied to the environmental power pro�lewhich would have allowed us to send the signal towards more than onecluster at the same time.
54

Chapter 5
Conclusion and future work
5.1 Conclusion
This project presents one aspect of the security in a transmission be-tween a target user and an AP. What is the key topic in wirelesscommunications is how to guarantee the target user with con�dential-ity and integrity of his data. In this purpose, we investigated a wayto optimize the security level at the physical layer so that con�den-tiality is delivered to the target user in a transparent way. To do so,our project is based on Beam-Hopping techniques applied to the APradiation pattern. These techniques were investigated to check if aneavesdropper would be able to catch a stable signal in a multipath in-door environment, assuming that the AP would broadcast its signal inoptimized directions for the target user. The other goal was to achievea certain trade-o� between security/privacy and hardware complexityso that the solution could be realizable and reach the market.
1. First chapter.First of all, we had to restrict our problem to a certain domainof work (space domain), a certain type of system (SISO) and tonarrow down to a problem that has not been dealt with yet bysearching for previous works on the subject.
2. Second chapter.In this chapter, we focused on describing the technical process-ings that we would like to apply to our system and especially tothe AP. An entire description of the antenna system (mechanicalsteering pattern), the channel (average CSI, open-loop, far-�eld
55

and Rayleigh fading considerations), the power modelling (powersummation because of non-coherent scattered responses) and thebeam-hopping algorithm is made.
3. Third chapter.This third step is used to describe the simulation environmentand the several scenarios we plan to investigate in this environ-ment.
4. Fourth and last chapter.This last chapter displays the results obtained from the di�erentMatlab simulations we ran.
Our simulations are divided into thre main parts. The �rst part ana-lyzes the in�uence of the number of clusters associated with the targetuser and the eavesdropper on the SER considering a �xed beam (stan-dard) AP, a beam-hopping AP and another beam-hopping AP with again control algorithm applied to it.The second part observes the same SER parameter and the averagepower received by both target user and eavesdropper when di�erentradius of clusters are chosen and considering the same three kinds ofscenarios as previously. Finally, the last part deals with the in�uenceof the beamwidth for the pattern over the same curves considering thesame kind of APs.
5.1.1 Conclusion for the �rst part
� Best type of antenna system for AP.The most e�cient type of antenna for the AP is the beam-hopping system combined with an AGC that allows the targetuser to get a stable signal while the eavesdropper receives an er-ratic signal with a great variance no matter if the eavesdropperis associated with more clusters than the target user.
� Beam-Hopping technique alone is not su�cient.The Beam-Hopping technique provides results favouring the tar-get user but the eavesdropper is still able to catch a good signalin almost 30% of the cases which is not su�cient to trust thetechnique applied without another algorithm to optimize it. Be-sides, the SNR of the target user could be stabilized while theSNR of the eavesdropper would be deteriorated.
56
� Beam-Hopping technique combined with AGC improves signi�-cantly the standard AP with a �xed beam pattern.Considering uniformly distributed random locations for both tar-get user and eavesdropper leads to equal probabilities of havinga good signal for both if the AP has its radiation pattern �xed.However, applying Beam-Hopping techniques and adding gaincontrol processing hugely improves the chances of the target userto catch a stable signal and so make it more secure for his com-munications by increasing the di�erence between the target userand the eavesdropper SNR (0dB for the �xed beam to 17dB inthe best case for beam hopping with AGC) .
5.1.2 Conclusion for the second part
� Best type of antenna system for AP.The most e�cient type of antenna for the AP is still the beam-hopping system combined with an AGC no matter if the eaves-dropper's clusters have a bigger radius than the target user'sones.
� The radius of the clusters is not a signi�cant parameter in thesimulations.Considering uniformly distributed random locations for both tar-get user and eavesdropper's clusters leads to equal probabilitiesof having a good signal for both if the AP has its radiation pat-tern �xed. However, the Beam-Hopping techniques and aboveall adding gain control processing hugely improves the chancesof the target user to catch a good stable signal even though theeavesdropper's clusters are considered bigger.
5.1.3 Conclusion for the third part
� Best type of antenna system for AP.The most e�cient type of antenna for the AP is still the beam-hopping system combined with an AGC no matter if the beamis wide or narrow.
� The beamwidth of the pattern is an important parameter.Considering uniformly distributed random locations for both tar-get user and eavesdropper's clusters leads to equal probabilities
57

of having a good signal for both if the AP has its radiation pat-tern �xed. However, the Beam-Hopping techniques and aboveall adding gain control processing hugely improves the chancesof the target user to catch a good stable signal. But in casesof a small beamwidth, the results are better because the powerreceived by the target user will be higher thanks to a bigger gainand the eavesdropper would have to be really close to the targetuser to catch a decent signal.
5.2 Future work
The Beam-hopping technique (beam steering) combined with the gaincontrol processing have shown some interesting results in terms of sta-bility of target user's signal and security but a few cases could beinvestigated more deeply to proof the method e�ciency such as:
1. More antenna elements at the AP.The AP could be equipped with more antenna elements to im-prove the precision of the beam pattern.
2. Several target users and/or several eavesdroppers.It could be interesting to simulate the system with more usersinvolved to get an idea of the e�ciency of the techniques in a realmobile network situation with several customers to protect frompossible eavesdropping.
3. Apply a threshold to the response of the environment to be ableto send the signal toward more than one cluster.
4. Adaptive beamwidth with respect to the response of the environ-ment
58

Bibliography
[1] J. Berthod and L. My, �Radio security potential in wlan applica-tion,� Master thesis Aalborg University, June 2007.
[2] C. Dictionary, �Security,� March 2008.
[3] Wikipedia, �Security,� p. access: February 208, June 2007.
[4] U. Government, �Federal standard 1037c, mil-std-188,� NationalInformations Systems Security Glossary and DoD Dictionary ofMilitary and Associated Terms, 2001.
[5] C. Dictionary, �Identi�cation,� March 2008.
[6] ��, �Authentication,� March 2008.
[7] FrameIP, �Osi model,� March 2008.
[8] openSSH, �http://www.openssh.org,� September 2007.
[9] M. Prikryl, �http://www.winscp.net,� March 2007.
[10] B. Lloyd and W. Simpson, �Ppp challenge handshake authentica-tion protocol (chap),� August 1996.
[11] T. Dierks and E. Rescorla, �The transport layer security (tls) pro-tocol version 1.1,� April 2006.
[12] K. G. Paterson and A. K. L. Yau, �Cryptography in theory andpractice: The case of encryption in ipsec,� March 2006.
[13] N. Borisov, I. Goldberg, and D. Wagner, �Intercepting mobile com-munications: the insecurity of 802.11,� April 2001.
[14] Wikipedia, �Osi model,� 2006, access: February 2008.
[15] G. Surnam, �Understanding security using the osi model,� GSECPractical version 1.3, March 2002.
59

[16] D. Reed, �Applying the osi seven layer network model to informa-tion security,� SANS Institute, GIAC GSEC Practical Assigne-ment version 1.4b, November 2003.
[17] R. Security, �Wireless adoption leaps ahead, advanced encryptiongains ground in the post-wep era,� http://www.rsa.com/, June2007.
[18] X. Zhou, P. Kyritsi, P. Eggers, and F. Fitzek, �The medium is themessage: Secure communications via waveform coding in mimosystems.�
[19] X. E. Li, M. Chen, and E. P. Ratazzi, �Array-transmission basedphysical-layer security techniques for wireless sensor networks,�IEEE International Conference on Mechatronics Automation, pp.1618�1623, July 2005.
[20] M. L. Jørgensen, B. R. Yanakiev, G. E. Kirkelund, P. Popovski,H. Yomo, and T. Larsen, �Shout to secure: Physical-layer wirelesssecurity with known interference,� IEEE GLOBECOM 2007, pp.33�38, 2007.
[21] X. Li, M. Chen, and E. Ratazzi, �Array-transmission basedphysical-layer security techniques for wireless sensor networks,�Mechatronics and Automation, 2005 IEEE International Confer-ence, 2005.
[22] P. M. N. Islam, �Information assurance in wdm networks: Physicallayer security,� Department of Electrical Engineering and Com-puter Science University of Michigan, Ann Arbor, MI, 2003.
[23] G. Sanguinetti, J. Laidler, and N. D. Lawrence, �Automatic de-terminantion of the number of clusters using spectral algortihms.�
[24] N. Czink, M. Herdin, H. Özcelik, and E. Bonek, �Number of mul-tipath clusters in indoor mimo propagation environments.�
[25] S.Haykin, �Cognitive radio:brain-empowered wireless communi-cations,� IEEE Journal on Selected Areas in Communications,February 2005.
[26] R. D. Taranto, H. Yomo, P. Popovski, K. Nishimori, andR. Prasad, �Cognitive mesh network under interference from pri-mary user,� August 2007.
[27] J. E. Håkegård, �Typical coverage and capacity of multi-cell wire-less lans,� December 2006.
60

[28] D.Malone, P. Cli�ord, D.Reid, and D.J.Leith, �Experimental im-plementation of optimal wlan channel selection without commu-nication.�
61


![The Complexity of Di erential Privacy · 2016-08-09 · Computational Complexity in February 2014, at the Bellairs Institute in Holetown, Barbados [1]. Written in part while visiting](https://img.pdfslide.us/doc/110x75/5f6fef6d7ed4f96bf23bc7e6/the-complexity-of-di-erential-privacy-2016-08-09-computational-complexity-in-february.jpg)