Embed Size (px)
Citation preview
9
Radar Systems for Glaciology
Achille Zirizzotti, Stefano Urbini, Lili Cafarella and James A.Baskaradas Istituto Nazionale di Geofisica e Vulcanologia
Italy
1. Introduction
This chapter deals with radar systems, measurements and instrumentation employed to study the internal core and bedrock of ice sheets in glaciology . The Earth's ice sheets are in Greenland and Antarctica. They cover about 10% of the land surface of the planet. The total accumulated ice comprises 90% of the global fresh water reserve. These ice sheets, associated with the ocean environment, provide a major heat sink which significantly modulates climate. Glaciology studies aim to understand the various process involved in the flow (dynamics), thermodynamics, and long-term behaviour of ice sheets. Studies of large ice masses are conducted in adverse environmental conditions (extreme cold, long periods of darkness). The development of remote sensing techniques have played an important role in obtaining useful results. The most widely used techniques are radar systems, employed since the 1950s in response to a need to provide a rapid and accurate method of measuring ice thickness. Year by year, polar research has become increasingly important because of global warming. Moreover, the discovery of numerous subglacial lake areas (water entrapped beneath the ice sheets) has attracted scientific interest in the possible existence of water circulation between lakes or beneath the ice (Kapitsa et al., 2006; Wingham et al., 2006; Bell et al., 2007). Recent studies in radar signal shape and amplitude could provide evidence of water circulation below the ice (Carter 2007, Oswald & Gogineni 2008). In this chapter the radar systems employed in glaciology, radio echo sounding (RES), are briefly described with some interesting results. RES are active remote sensing systems that utilize electromagnetic waves that penetrate the ice. They are used to obtain information about the electromagnetic properties of different interfaces (for example rock-ice, ice-water, seawater-ice) that reflect the incoming signal back to the radar. RES systems are characterized by a high energy (peak power from 10 W to 10 KW) variable transmitted pulse width (about from 0.5 ns to several microseconds) in order to investigate bedrock characteristics even in the thickest zones of the ice sheets (4755 m is the deepest ice thickness measured in Antarctica using a RES system). Changing the pulse length or the transmitted signal frequencies it is possible to investigate particular ice sheet details with different resolution. Long pulses allows transmission of higher power than short pulses, penetrating the thickest parts of the ice sheets but, as a consequence, resolution decreases. For example, the GPR system, commonly used in geophysics for rock, soil, ice, fresh water, pavement and structure characterization, employs a very short transmitted pulse (0.5 ns to 10 ns) that allow detailing of the shallow parts of an ice sheet (100-200 m in depth) (Reynolds 1997).
Source: Radar Technology, Book edited by: Dr. Guy Kouemou, ISBN 978-953-307-029-2, pp. 410, December 2009, INTECH, Croatia, downloaded from SCIYO.COM
www.intechopen.com
Radar Technology
164
Consequently, in recent years, GPR systems are also employed by explorers to find hidden crevasses on glaciers for safety. RES surveys have been widely employed in Antarctic ice sheet exploration and they are still an indispensable tool for mapping bedrock morphologies and properties of the last unexplored continent on Earth. The advantage of using these remote sensing techniques is that they allow large areas to be covered, in good detail and in short times using platforms like aeroplanes and surface vehicles.
2. Glaciological radar
2.1 Summary of physical and electromagnetic properties of ice The difference in electromagnetic properties at an interface between two different media can reflect radio waves. Air-ice, ice-bedrock surfaces and internal layers are targets for RES systems, forming interfaces that reflect a transmitted radar signal back to the receiver antenna. The radar technique is widely used in glaciology to obtain information about electromagnetic properties of the reflecting layers and their position (Bogorodsky, 1985). RES data can give information on ice thickness, bedrock depth, position of internal ice layers, and water content of bedrock interfaces. The electromagnetic properties of materials are described by the relative complex electrical permittivity εc, the relative magnetic permeability ┤r (magnetic permeability with
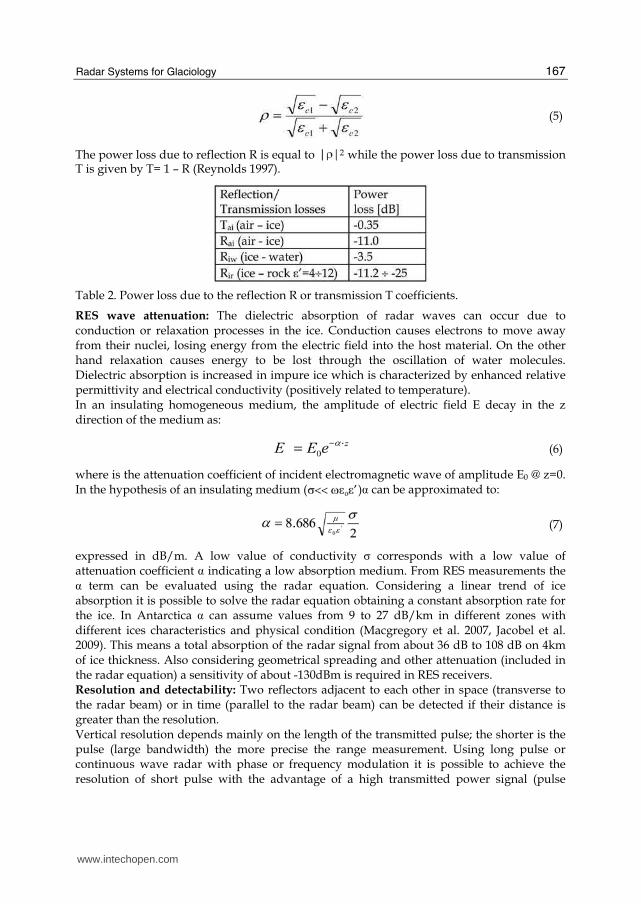
) and the conductivity p. Conductivity and permittivity depend on bulk physical state and chemical composition (for example: porosity, water content) while the relative permeability is always ┤r=1 for non-magnetic materials. The propagation of an electromagnetic wave in materials is characterized by its attenuation and velocity. In particular, radio waves are easily transmitted in air (good dielectric, low attenuation) but they propagate very little in sea water (poor dielectric, high attenuation). Table 1 reports some dielectric properties of the materials of the glaciological environment. Electromagnetic wave propagations is described using Maxwell equations. Compact solution, in general, can be obtained defining the relative complex permittivity
where is the vacuum
permittivity. Based on their electromagnetic properties, materials can be separated into isulating the complex permittivity is mainly real) and conductive media
the complex permittivity is mainly imaginary).
Table 1. Electromagnetic properties of the materials of the glaciological environment
The complex permittivity of the ice in glaciers and ice sheets depends on several factors including crystal orientation fabrics, density, impurity concentration (internal layers of dust from major volcanic events are always present in glaciers) or sea salt (acidity), water content and temperature.
www.intechopen.com
Radar Systems for Glaciology
165
Several ice core drilling, under the framework of climatological projects in Greenland and Antarctic base stations, allow an assessment of ice composition and its main physical characteristics (Stauffer 1991, Epica 2004). As regards the polar ice temperature, the upper and lower layers have constant heat sources (air and bedrock respectively). The temperature profile in the ice sheet changes with depth due to the heat conduction of ice. From the ice surface, the ice temperature increases up to a value that depends on the ice thickness, pressure and geothermal heat contributions. At Concordia Station (Dome C, Antarctica) the mean ice surface temperature is -55°C (annual average temperature of the site) while it reaches -3°C at 3225 m of ice depth (Epica 2004, Laurent A., 2003). Observing physical properties and DiElectric Profile (DEP) directly on the ice core obviously represent the best way to acquire this kind of information (Wolff 2004). These measurements are usually made in the LF frequency spectrum at a fixed temperature and must be extended to the frequencies used and temperature (Corr & Moore, 1993). An alternative approach for investigating ice properties is using doped ice in the laboratory. A possible disadvantage of this approach is that the artificial ice properties may not be the same as those of natural ice. The relative permittivity measurements on doped ice grown in laboratory, ranges between 3.2 to 3.13 over a wide temperature range and for a wide radar frequency range ( Fujita et al. 2000). In the same conditions, the conductivity measured in ice containing acids (impurities) varies from 0.03 mS/m (@ -10°C f < 1 GHz ) to 0.0008 mS/m (@ -80°C f<600MHz). Based on these results the ice can be considered as an insulating media (low absorption) for frequencies greater than 600 kHz ( ); the ice conductivity is virtually independent of frequency below about 600 MHz. As a consequence, electromagnetic waves velocity in artificial ice ranges between 167.7 to 169.5 m/┤s (Fujita et al. 2000) while the in situ measurements, determined by different methods, show a wider range of values due to the fact that natural ice is inhomogeneous.
2.2 Introduction to RES principles Electromagnetic wave velocity (at radio frequencies) in ice can be approximated (for an insulating low absorption medium) as:
(1)
where c is the speed of light 3· 108 m/s. Accurate determination of radar wave velocity in ice is fundamental to derive the depth of the various reflecting interfaces, and is established from radar measurements with the simple equation h=v· t/2 where t is the two-way traveling time of the radar echoes. Bearing in mind that electromagnetic waves have different velocities through firn and snow layers (213 m/┤s), this may introduce an error in the order of 10% of the firn layer thickness (Rees 1992). In addition to laboratory measurements, electromagnetic wave velocity can be estimated in many different ways using radar data. These can be divided into direct and indirect methods. Lowering a probe into a borehole with source and receiving sensors measuring speeds at several intervals is a direct way to obtain velocity information. Wide Angle Reflection and Refraction or Common Mid Point (WARR or CMP) are another indirect techniques for measuring wave velocity and are widely employed in seismic reflection procedures. They consist measurements of arrival time of the reflections at several source-receiving distances. It is possible to reconstruct the hyperbola describing the arrival
www.intechopen.com
Radar Technology
166
times of a reflected event. Sometimes, when a single antenna (transmitting-receiving) or fixed geometry between transmitting and receiving antenna (as in airborne assemblies) are used it is not possible to carry out a WARR/CMP profile. In the absence of any other kind of information, recognized diffractions (hyperbolas) from particular points along the profiles could be used to estimate velocity with a similar procedure to the previous method (Daniels 1996, Reynolds 1997). RES radar equation: dry and wet bedrock ice interfaces are important in subglacial exploration and hydrological studies on ice sheets. The physical condition of the ice interfaces can be estimated from the RES measurement by studying the reflectivity coefficient of the radar equation. The radar equation allows the estimation of signal power of received echoes (Skolnik 1990, Borogosky 1985). In the case of a coherent flat reflector, neglecting noise and scattering due to inhomogeneities and multiple reflections between layers, it can be expressed as:
(2)
where pt and pr are the transmitted and received power, Ga is the antenna gain, ┣ is the RES signal wavelength, r is the range from transmitting antenna, the square term is the spherical divergence of the electromagnetic signal power in a far field condition. The gain term gf depends on the refractive effect due to the change in the relative permittivity from air to ice an airborne RES system:
(3)
where h is the aeroplane flight altitude, r is the radar range in the ice and n12 is the refractive index between the two media air and ice. This term provides little dB gain in the radar equation, for example @ h=300m and r=300 m gf =2.2 dB (gf < 5 dB for r<3000 m). The power loss term lp in decibel (Lp) can be expressed as the sum of several contributions
(4)
where the subscripts a, i and r are for air, ice and rock respectively. In this equation Li is the ice absorption of the electromagnetic wave, and T and R are the losses due to the transmission and reflection coefficients at the different interfaces (Peters et al., 2005) where T and L are considered twice because of the double passage of the reflected signal in the medium. Recently, a linear trend of ice absorption (in decibels ) with depth has been observed with a constant absorption rate that differ according to variation of chemical content and temperature of ice (Raymond 2009, Jacobell et al 2009). Reflection and transmission coefficients: in order to investigate the different properties of reflecting surfaces, the simple case of homogeneous, horizontal surfaces can be considered. For example, the electromagnetic power reflected by the subglacial homogeneous, horizontal ice-water interface depends only on the reflection coefficients, i.e. on the physical nature of the two media. In table 2 the power losses due to the reflection R or transmission T coefficients at the relative interfaces are summarized. The reflection coefficient ρ at the surface separating two media 1 and 2 is:
www.intechopen.com
Radar Systems for Glaciology
167
(5)
The power loss due to reflection R is equal to while the power loss due to transmission T is given by T= 1 – R (Reynolds 1997).
Table 2. Power loss due to the reflection R or transmission T coefficients.
RES wave attenuation: The dielectric absorption of radar waves can occur due to conduction or relaxation processes in the ice. Conduction causes electrons to move away from their nuclei, losing energy from the electric field into the host material. On the other hand relaxation causes energy to be lost through the oscillation of water molecules. Dielectric absorption is increased in impure ice which is characterized by enhanced relative permittivity and electrical conductivity (positively related to temperature). In an insulating homogeneous medium, the amplitude of electric field E decay in the z direction of the medium as:
(6)
where is the attenuation coefficient of incident electromagnetic wave of amplitude E0 @ z=0. In the hypothesis of an insulating medium ( ) can be approximated to:
(7)
expressed in dB/m. A low value of conductivity p corresponds with a low value of attenuation coefficient indicating a low absorption medium. From RES measurements the term can be evaluated using the radar equation. Considering a linear trend of ice absorption it is possible to solve the radar equation obtaining a constant absorption rate for the ice. In Antarctica can assume values from 9 to 27 dB/km in different zones with different ices characteristics and physical condition (Macgregory et al. 2007, Jacobel et al. 2009). This means a total absorption of the radar signal from about 36 dB to 108 dB on 4km of ice thickness. Also considering geometrical spreading and other attenuation (included in the radar equation) a sensitivity of about -130dBm is required in RES receivers. Resolution and detectability: Two reflectors adjacent to each other in space (transverse to the radar beam) or in time (parallel to the radar beam) can be detected if their distance is greater than the resolution. Vertical resolution depends mainly on the length of the transmitted pulse; the shorter is the pulse (large bandwidth) the more precise the range measurement. Using long pulse or continuous wave radar with phase or frequency modulation it is possible to achieve the resolution of short pulse with the advantage of a high transmitted power signal (pulse
www.intechopen.com
Radar Technology
168
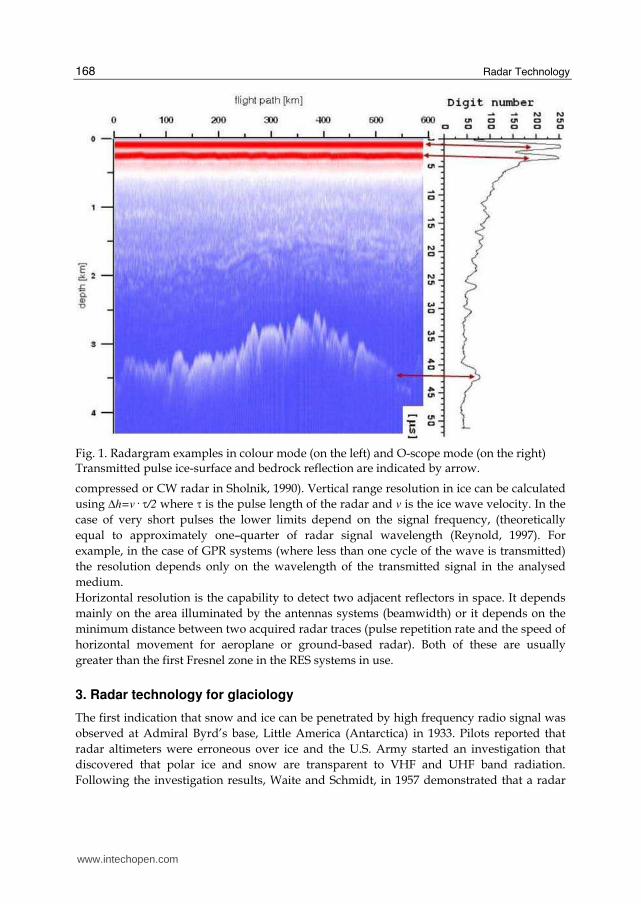
Fig. 1. Radargram examples in colour mode (on the left) and O-scope mode (on the right) Transmitted pulse ice-surface and bedrock reflection are indicated by arrow.
compressed or CW radar in Sholnik, 1990). Vertical range resolution in ice can be calculated
using ∆h=v· q/2 where q is the pulse length of the radar and v is the ice wave velocity. In the
case of very short pulses the lower limits depend on the signal frequency, (theoretically
equal to approximately one–quarter of radar signal wavelength (Reynold, 1997). For
example, in the case of GPR systems (where less than one cycle of the wave is transmitted)
the resolution depends only on the wavelength of the transmitted signal in the analysed
medium.
Horizontal resolution is the capability to detect two adjacent reflectors in space. It depends
mainly on the area illuminated by the antennas systems (beamwidth) or it depends on the
minimum distance between two acquired radar traces (pulse repetition rate and the speed of
horizontal movement for aeroplane or ground-based radar). Both of these are usually
greater than the first Fresnel zone in the RES systems in use.
3. Radar technology for glaciology
The first indication that snow and ice can be penetrated by high frequency radio signal was
observed at Admiral Byrd’s base, Little America (Antarctica) in 1933. Pilots reported that
radar altimeters were erroneous over ice and the U.S. Army started an investigation that
discovered that polar ice and snow are transparent to VHF and UHF band radiation.
Following the investigation results, Waite and Schmidt, in 1957 demonstrated that a radar
www.intechopen.com
Radar Systems for Glaciology
169
altimeter could be used to measure the thickness of polar glaciers (Waite & Schmidt, 1961).
In 1963 at Cambridge University’s Scott Polar Research Institute (SPRI) the first VHF radar
system specifically for radio echo sounding was developed and subsequently around the
world various national institutions involved in Arctic and Antarctic polar researches started
developing and using RES systems. These first RES systems implemented short pulse
envelope radar operating from 30 MHZ to 150 MHz and were used in Greenland and
Antarctica. The acquired radar trace was displayed on an oscilloscope. The received radar
trace represented on the right of fig. 1 is still named an “O-scope” view from “oscilloscope”
while the radargram on the left is a colour map of trace amplitude. The recording system
was a motor-driven 35 mm camera with adjustable film velocity, synchronized to the
surface speed. Position determination was obtained initially by observation of discernible
landmarks by system operator and subsequently by inertial navigation systems using
motion-sensing devices.
Technological improvements made these RES systems more powerful. Today digital acquisition of radar traces allows a higher number of recorded traces in fast digital mass storage devices, allowing wide area investigations with improved horizontal resolution. Signal processing of the acquired traces significantly improve dynamic range and signal to noise level. Moreover differential GPS measurements allow precise determination of the geographical position of the acquired traces, reducing uncertainties to ±5 m and ±10 cm in post-processing. In 1990 the first coherent RES system was developed by the University of Kansans and tested in Antarctica (Raju 1990, Cogineni 1998). A coherent radar detects both the amplitude and phase of the radar signal. Coherent systems allow pulse compression with a net gain in the received signal to noise ratio. This increased sensibility of the received signal level permits a reduction in the transmitted peak power. Furthermore a coherent integration of moving airborne platform forms a synthetic aperture radar (SAR) which improves along-track (horizontal) resolution (Peters et al., 2005). Multi channel synthetic-aperture radar (SAR) systems for bedrock imagining have been
used in Greenland to produce maps of basal backscatter over an area extending 6 km × 28
km. Interferometric processing of data from this 8-channel system also permitted the
discrimination of off-nadir scattering source providing further insight into basal topography
(Plewes et al. 2001, Paden et al. 2005; Allen et al. 2008).
Different type of radar have been developed to focus on ice sheet details. The following categorisations have been based on the transmitted radar waveform. Pulsed radar: Historically the first RES systems developed were all short-pulse-type radar
systems. A short sine wave pulse of constant amplitude is transmitted with operating
frequencies ranging from 30 MHz to 600 MHz. An envelope (logarithmic) receiver detects
the received echoes as peaks of amplitude from the ambient noise level (see O-scope radar
trace in fig 1). These systems typically used incoherent receivers that only detected the
power (or amplitude) of the received radar signal. Incoherent radar is suitable for range
determination and certain echo strength analyses. In general, echo amplitudes statistics are
the primary means of determining the level of reflection and scattering.
FM-CW (Frequency Modulated Continuous Wave) radar: A FM-CW radar transmits a
continuous waveform in which the carrier frequency increases linearly with time. The
modulation bandwidth, which determines range resolution, is the difference between the
www.intechopen.com
Radar Technology
170
start and stop frequencies of the transmitted signal. In an FM-CW radar a sample of
transmitted signal is mixed with the received signal to generate a beat signal. The frequency
of transmitted and received signals will be different because of time delay, which is directly
proportional to the range, associated with signal propagation to the target and back. The
beat signal contains the range, amplitude and phase information of the target. These RES
systems working at high frequency C band and X band (Arcone 1997) were designed for
cryopheric research, to profile frozen lakes and temperate glacier (Arcone 2000) in Alaska.
Airborne and ground based UHF radar systems were used to map the accumulation rate
variability in Greenland (Kanagaratnam et al, 2004)
Impulse radar: Pulsed radar in the UHF frequency ranges is limited in penetration depths on temperate glaciers due to scattering and absorption of electromagnetic waves in warm ice. As seen in paragraph 2.1, ice conductivity increases with temperature and decrease at lower frequencies. For these reasons, to increase depth penetration in temperate glaciers, a radar working at frequencies lower than 10 MHz was developed. In order to increase the vertical resolution, the pulse length was reduced, transmitting approximately one cycle (monopulse radar) at a centre frequency determined by the antenna length. These radars use resistively loaded dipole antennae (Wu 1965), coupled with an avalanching transistor circuit (Cook, 1960), and more recently, using MOSFETs (metal oxide semiconductor field effect transistors) (Conway 2009) to increase the stability of the transmitted power, making it possible to generate high-voltage pulses. These systems are similar to GPR radar systems with a higher transmitted power and working at lower frequencies. Ground Penetrating Radar (GPR): GPR is a widely used radar system to explore various media from a few to several hundred meters in depth using two methods: discrete (fixed points measurement) or continuous profile to investigate a media subsurface. Fixed point measurement is generally used to measure ice properties (for example WARR or CMP velocity measurements) or to carry out a multi-fold acquisition (Reynolds 1997). Continuous profile is used to maximize the productivity of a survey. Commercial GPR systems, commonly used in geophysics for rock, soil, ice, fresh water, pavement and structure characterization, employ a very short transmitted pulse (about from 0.3 ns to 300 ns) to study the shallow portion of terrain in detail. GPRs have also been used for ice probing. Since the 1970’s, surface-based surveys have been performed on permafrost and frozen soils, glacial ice, sea ice, sedimentary environments, rock, riverbeds, and lakebed deposits, snow accumulations for internal layering detection. The low transmitted energy of the GPR signal does not allow it to reach deeper ice levels. For this reason GPR systems are used to analyze shallow parts of ice sheets as a useful tool that avoids deeper internal layer detection and for finding buried crevasses on glaciers for safety (see next paragraph). GPR radar systems, similarly to impulse radar, employ resistively loaded dipole antenna arrangements which produce a 1-2 cycle wavelet in the HF-UHF (3-3000 MHz) frequency range to obtain the required short pulse that gives GPR its good depth resolution. GPR antennas are the most important part of the GPR system. In fact, because of the wide spectrum of the transmitted waveform GPR needs broadband antennas. Moreover, to cover the range of working frequencies, GPR systems employ several different antennas each working at a particular frequency range. Commercially available or special purpose antennas are either strings of resistors or resistively coated and flared dipoles, either unshielded or in compact transmit-receive units with a conductive shielding to mitigate above ground radiation (Reynolds 1997).
www.intechopen.com
Radar Systems for Glaciology
171
4. Radar applications in Glaciology
4.1 Ice depth and bedrock elevation. Since the first RES system were used in ice-sheet surveys to estimate ice thickness, the measurements were controlled by seismic and gravity based measurements. A RES system is able to achieve an echo reflection from the ice surface and from the ice-bedrock interface. Calculating the difference in time (or depth) between them it is possible to estimate the ice thickness to a high degree of accuracy. Bedrock elevation can then be obtained adding the ice surface elevation (obtained from radar satellite measurements (EARS1 and other available Digital Elevation Models) to the ice thickness. Ice thickness measurement is the most widespread application of radar systems. Most of this dataset comes from airborne radar investigations undertaken by the United States National Science Foundation NSF, the Scott Polar Research Institute, United Kingdom (SPRI), the British Antarctic Survey, the Alfred Wegener Institute, Germany, the Technical University of Denmark (TUD) and, in recent years, the Italian Antarctic Program (PNRA). RES measurements have been extensively used to investigate the grounding line (GL is the point where continental ice, flowing toward the open sea, starts to float) of many outlet Antarctic glaciers. Bedrock gate shapes together with ice velocity information enables estimation of ice mass discharge into the sea. This estimate plays an important role in the mass balance calculation for the Antarctic ice cap modulated by climatological changes. Another application, when very detailed RES survey are indispensable, is for ice core site selection. In recent years, ice coring in the thickest areas of ice sheets has allowed the reconstruction of about 1 million years of the climate history of our planet. This analysis clearly revealed how human activities have changed the percentage of greenhouse gases and how this has influenced the recent climate. Precise information on bedrock depth, topography, and internal layering behavior are as important as surface topography and ice flow speed when choosing the best drilling point. Examples of this kind of application are the definition of EPICA, (Dome C, Antarctica) and TALDICE (Talos Dome, Antarctica) ice drilling points (Bianchi et al. 2003). The first allowed reconstruction of climate history for about 900 thousand years B.P. reaching 3270 m of ice cored. The second was less deep (1620 m) and allowed reconstruction of climate history of about 250 thousands year but, due to a higher rate of snow accumulation, with increased detail. This site was also chosen in order to improve knowledge of the response of near coastal sites to climate changes. In figure 2 the ice thickness data is used to construct a three-dimensional view of the main bedrock morphology of the area. As shown in the figure, the bedrock topography consists of a mountainous region with NW-SE trending ridges and depressions interposed between higher relief to the NE and a deeper basin to the south. The thickness of the ice sheet on the area ranges from 1000 to 2000 m. Focusing under the topographic summit (Fig. 2), bedrock morphology and ice layer slope
made it clear that the original drilling position (black triangle) could have led to a wrong ice
core interpretation. Based on RES data (Urbini et al 2006), the point was so shifted to ID1
(black square) which is 5 km from original point (TD summit).
RES technique has been used over wide areas in Antarctica and Greenland with the aim of geomorphological studies. Detailed bedrock maps permitted hypotheses on the main geological features of a continent buried under thousands of meters of ice. An example (Fig. 3) of this type of study is the analysis of the Aurora trench, close to the Dome C region. Data was collected during the 1999 and 2001 Italian Antarctic Expeditions (Zirizzotti, 2009),
www.intechopen.com

Radar Technology
172
Fig. 2. Talos Dome flight paths (on the left) and bedrock and ice surface from RES measurements (on the right).
(about 6000 km of radar traces were acquired). The radar data was used to determine ice thickness and bedrock topography for the entire area; in addition, analysis of the shape and amplitude of bottom reflections allowed the detection of sub-glacial “lake” mirror features in 30 radar tracks (Tabacco et al., 2003). The deepest point in the Aurora trench (Fig. 3), located at 118.328° E; 76.054°S, has a bed elevation of -1549 m and an ice thickness of 4755 m. This location must be included among the thickest ice cover areas ever discovered in Antarctica (Cafarella, et al. 2006).
Fig. 3. The Aurora trench deepest point
www.intechopen.com
Radar Systems for Glaciology
173
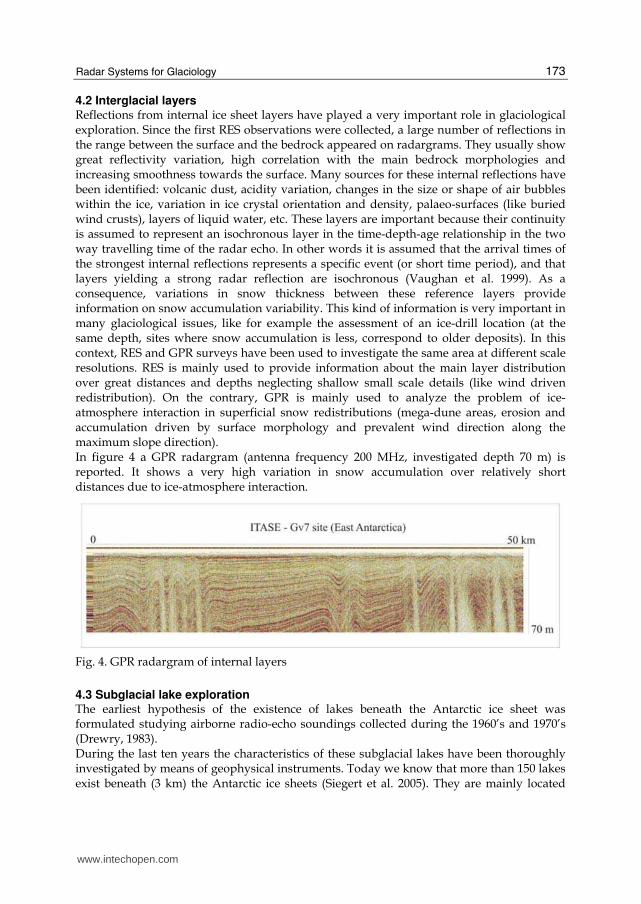
4.2 Interglacial layers Reflections from internal ice sheet layers have played a very important role in glaciological exploration. Since the first RES observations were collected, a large number of reflections in the range between the surface and the bedrock appeared on radargrams. They usually show great reflectivity variation, high correlation with the main bedrock morphologies and increasing smoothness towards the surface. Many sources for these internal reflections have been identified: volcanic dust, acidity variation, changes in the size or shape of air bubbles within the ice, variation in ice crystal orientation and density, palaeo-surfaces (like buried wind crusts), layers of liquid water, etc. These layers are important because their continuity is assumed to represent an isochronous layer in the time-depth-age relationship in the two way travelling time of the radar echo. In other words it is assumed that the arrival times of the strongest internal reflections represents a specific event (or short time period), and that layers yielding a strong radar reflection are isochronous (Vaughan et al. 1999). As a consequence, variations in snow thickness between these reference layers provide information on snow accumulation variability. This kind of information is very important in many glaciological issues, like for example the assessment of an ice-drill location (at the same depth, sites where snow accumulation is less, correspond to older deposits). In this context, RES and GPR surveys have been used to investigate the same area at different scale resolutions. RES is mainly used to provide information about the main layer distribution over great distances and depths neglecting shallow small scale details (like wind driven redistribution). On the contrary, GPR is mainly used to analyze the problem of ice- atmosphere interaction in superficial snow redistributions (mega-dune areas, erosion and accumulation driven by surface morphology and prevalent wind direction along the maximum slope direction). In figure 4 a GPR radargram (antenna frequency 200 MHz, investigated depth 70 m) is reported. It shows a very high variation in snow accumulation over relatively short distances due to ice-atmosphere interaction.
Fig. 4. GPR radargram of internal layers
4.3 Subglacial lake exploration The earliest hypothesis of the existence of lakes beneath the Antarctic ice sheet was formulated studying airborne radio-echo soundings collected during the 1960’s and 1970’s (Drewry, 1983). During the last ten years the characteristics of these subglacial lakes have been thoroughly investigated by means of geophysical instruments. Today we know that more than 150 lakes exist beneath (3 km) the Antarctic ice sheets (Siegert et al. 2005). They are mainly located
www.intechopen.com
Radar Technology
174
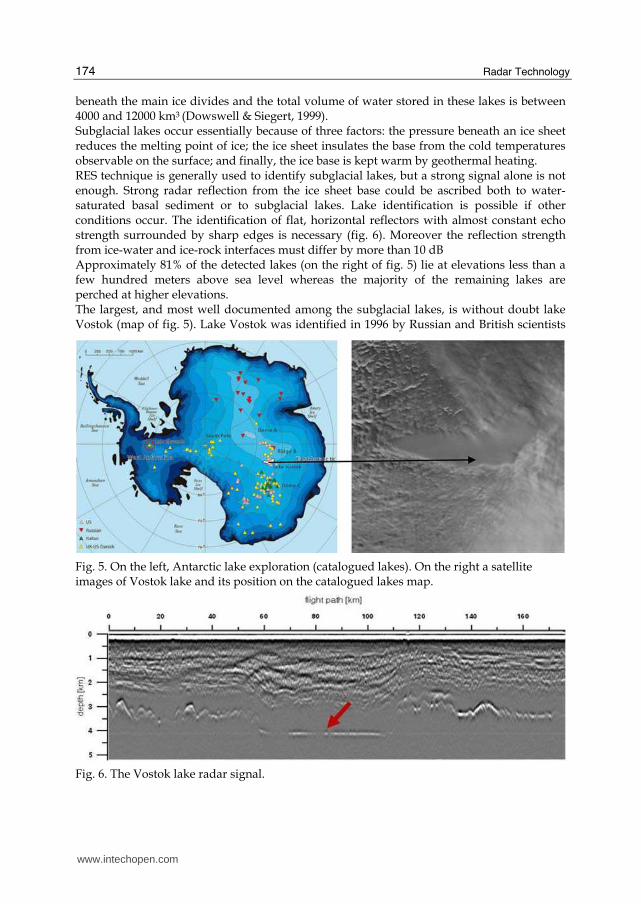
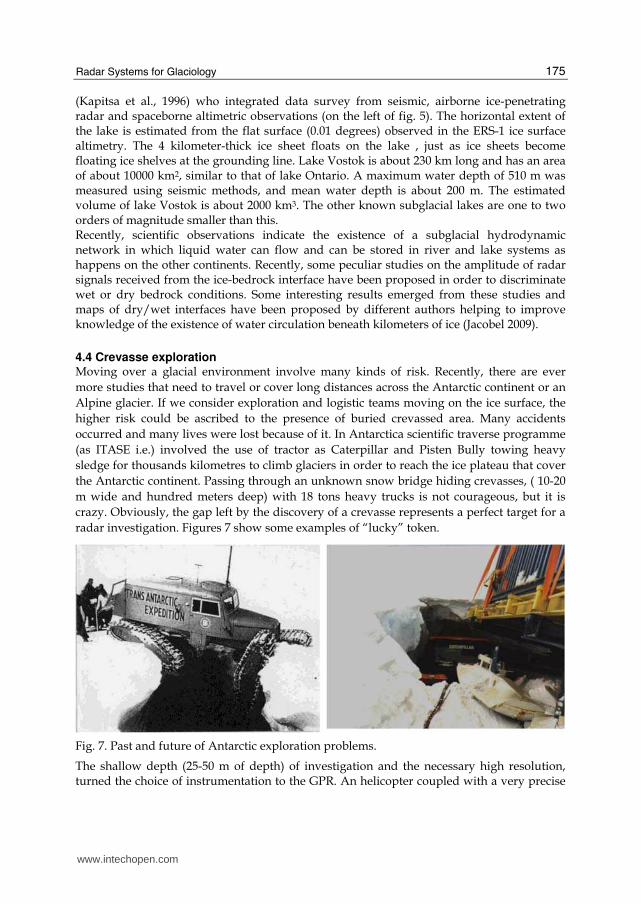
beneath the main ice divides and the total volume of water stored in these lakes is between 4000 and 12000 km3 (Dowswell & Siegert, 1999). Subglacial lakes occur essentially because of three factors: the pressure beneath an ice sheet reduces the melting point of ice; the ice sheet insulates the base from the cold temperatures observable on the surface; and finally, the ice base is kept warm by geothermal heating. RES technique is generally used to identify subglacial lakes, but a strong signal alone is not enough. Strong radar reflection from the ice sheet base could be ascribed both to water-saturated basal sediment or to subglacial lakes. Lake identification is possible if other conditions occur. The identification of flat, horizontal reflectors with almost constant echo strength surrounded by sharp edges is necessary (fig. 6). Moreover the reflection strength from ice-water and ice-rock interfaces must differ by more than 10 dB Approximately 81% of the detected lakes (on the right of fig. 5) lie at elevations less than a few hundred meters above sea level whereas the majority of the remaining lakes are perched at higher elevations. The largest, and most well documented among the subglacial lakes, is without doubt lake Vostok (map of fig. 5). Lake Vostok was identified in 1996 by Russian and British scientists
Fig. 5. On the left, Antarctic lake exploration (catalogued lakes). On the right a satellite images of Vostok lake and its position on the catalogued lakes map.
Fig. 6. The Vostok lake radar signal.
www.intechopen.com
Radar Systems for Glaciology
175
(Kapitsa et al., 1996) who integrated data survey from seismic, airborne ice-penetrating radar and spaceborne altimetric observations (on the left of fig. 5). The horizontal extent of the lake is estimated from the flat surface (0.01 degrees) observed in the ERS-1 ice surface altimetry. The 4 kilometer-thick ice sheet floats on the lake , just as ice sheets become floating ice shelves at the grounding line. Lake Vostok is about 230 km long and has an area of about 10000 km2, similar to that of lake Ontario. A maximum water depth of 510 m was measured using seismic methods, and mean water depth is about 200 m. The estimated volume of lake Vostok is about 2000 km3. The other known subglacial lakes are one to two orders of magnitude smaller than this. Recently, scientific observations indicate the existence of a subglacial hydrodynamic network in which liquid water can flow and can be stored in river and lake systems as happens on the other continents. Recently, some peculiar studies on the amplitude of radar signals received from the ice-bedrock interface have been proposed in order to discriminate wet or dry bedrock conditions. Some interesting results emerged from these studies and maps of dry/wet interfaces have been proposed by different authors helping to improve knowledge of the existence of water circulation beneath kilometers of ice (Jacobel 2009).
4.4 Crevasse exploration Moving over a glacial environment involve many kinds of risk. Recently, there are ever
more studies that need to travel or cover long distances across the Antarctic continent or an
Alpine glacier. If we consider exploration and logistic teams moving on the ice surface, the
higher risk could be ascribed to the presence of buried crevassed area. Many accidents
occurred and many lives were lost because of it. In Antarctica scientific traverse programme
(as ITASE i.e.) involved the use of tractor as Caterpillar and Pisten Bully towing heavy
sledge for thousands kilometres to climb glaciers in order to reach the ice plateau that cover
the Antarctic continent. Passing through an unknown snow bridge hiding crevasses, ( 10-20
m wide and hundred meters deep) with 18 tons heavy trucks is not courageous, but it is
crazy. Obviously, the gap left by the discovery of a crevasse represents a perfect target for a
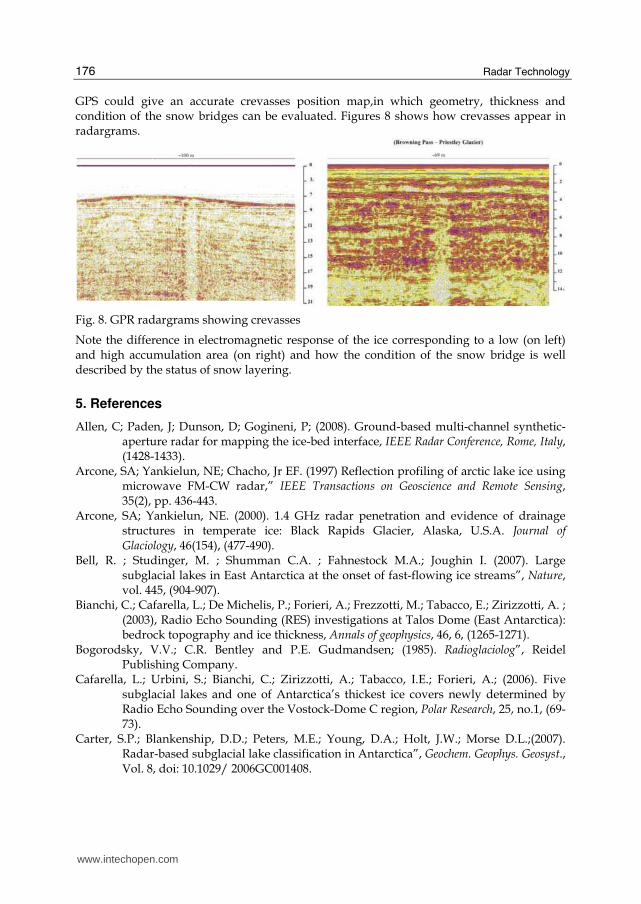
radar investigation. Figures 7 show some examples of “lucky” token.
Fig. 7. Past and future of Antarctic exploration problems.
The shallow depth (25-50 m of depth) of investigation and the necessary high resolution, turned the choice of instrumentation to the GPR. An helicopter coupled with a very precise
www.intechopen.com
Radar Technology
176
GPS could give an accurate crevasses position map,in which geometry, thickness and condition of the snow bridges can be evaluated. Figures 8 shows how crevasses appear in radargrams.
Fig. 8. GPR radargrams showing crevasses
Note the difference in electromagnetic response of the ice corresponding to a low (on left) and high accumulation area (on right) and how the condition of the snow bridge is well described by the status of snow layering.
5. References
Allen, C; Paden, J; Dunson, D; Gogineni, P; (2008). Ground-based multi-channel synthetic-aperture radar for mapping the ice-bed interface, IEEE Radar Conference, Rome, Italy, (1428-1433).
Arcone, SA; Yankielun, NE; Chacho, Jr EF. (1997) Reflection profiling of arctic lake ice using microwave FM-CW radar,” IEEE Transactions on Geoscience and Remote Sensing, 35(2), pp. 436-443.
Arcone, SA; Yankielun, NE. (2000). 1.4 GHz radar penetration and evidence of drainage structures in temperate ice: Black Rapids Glacier, Alaska, U.S.A. Journal of Glaciology, 46(154), (477-490).
Bell, R. ; Studinger, M. ; Shumman C.A. ; Fahnestock M.A.; Joughin I. (2007). Large subglacial lakes in East Antarctica at the onset of fast-flowing ice streams”, Nature, vol. 445, (904-907).
Bianchi, C.; Cafarella, L.; De Michelis, P.; Forieri, A.; Frezzotti, M.; Tabacco, E.; Zirizzotti, A. ; (2003), Radio Echo Sounding (RES) investigations at Talos Dome (East Antarctica): bedrock topography and ice thickness, Annals of geophysics, 46, 6, (1265-1271).
Bogorodsky, V.V.; C.R. Bentley and P.E. Gudmandsen; (1985). Radioglaciolog”, Reidel Publishing Company.
Cafarella, L.; Urbini, S.; Bianchi, C.; Zirizzotti, A.; Tabacco, I.E.; Forieri, A.; (2006). Five subglacial lakes and one of Antarctica’s thickest ice covers newly determined by Radio Echo Sounding over the Vostock-Dome C region, Polar Research, 25, no.1, (69-73).
Carter, S.P.; Blankenship, D.D.; Peters, M.E.; Young, D.A.; Holt, J.W.; Morse D.L.;(2007). Radar-based subglacial lake classification in Antarctica”, Geochem. Geophys. Geosyst., Vol. 8, doi: 10.1029/ 2006GC001408.
www.intechopen.com
Radar Systems for Glaciology
177
Conway, H; Smith, B; Vaswani, P; Matusuoka, K; Rignot, E; Claus, P. (2009). A low-frequency ice-penetrating radar system adapted for use from an airplane: test results from Bering and Malaspina Glaciers, Alaska, USA. Annals of Glaciology 50 (51) (93–97).
Cook, J.C. (1960). Proposed monocycle-pulse VHF radar for airborne ice and snow measurement. Commun. Electr., 5 l: (588-594) [ also AIEE Trans., 79].
Corr, H.; Moore, J.C.; Nicholls, K.W. (1993). Radar absorption due to impurities in Antarctic ice”, Geophys. Res. Lett., vol. 20, num.11, (1071-1074).
Daniels, D. J. (1996) Surface-penetrating Radar Institution of Electrical Engineers, ISBN 0852968620, 9780852968628.
Dowdeswell, J.A.; Siegert ,M.J. (2002). The physiography of modern Antarctic subglacial lakes, Global and Planetary Change, 35, (221-236).
Drewry, D.J. (Editor), (1983), Antarctica: Glaciological and Geophysical Folio Scott Polar Research Institute, Cambridge.
Eisen, O.; Wilhelms, F.; Seinhage, D.; Schander, J. (2006). Instruments and Methods Improved method to determine radio-echo sounding reflector depths from ice-core profiles of permittivity and conductivity”, J. Glaciology., vol. 52, no. 177.
EPICA community members (2004). Eight glacial cycles from an Antarctic ice core, Nature, vol. 429, (623-628).
Fujita, S.; Matsuoka, T.; Ishida, T.; Matsuoka, K.; Mae, S. (2000). A summary of the complex dielectric permittivity of ice in the megahertz range and its applications for radar sounding of polar ice sheets”, Physics of Ice Core Records, (185-212).
Gogineni, S.; Chuah, T.; Allen, C; Jezek, K; Moore, R.K. (1998). An improved coherent radar depth sounder. Journal of Glaciology Vol. 44:148, (659-669).
Jacobel, R.W.; Welch, B.C.; Osterhouse, D.; Pettersson, R.; Macgregor, J.A. (2009). Spatial variation of radar-derived basal conditions on Kamb Ice Stream, West Antarctica. Annals of Glaciology 50(51), (10–16).
Kanagaratnam, P; Gogineni, SP; Ramasami, V; Braaten, D. (2004). A wideband radar for high-resolution mapping of near-surface internal layers in glacial ice,” IEEE Transactions on Geoscience and Remote Sensing, 42(3), ( 483-490).
Kapitsa, A.P.; Ridley, J.K.; Robin, G.D.; Siegert, M.J; Zotikov I.A. (2006). A large deep freshwater lake beneath the ice of central East Antarctica” Nature, vol. 381, ( 684-686). Laurent, A. ( 2003). EPICA Dome C DRILLING SEASON. 2002-2003 Field Season Report.
MacGregor, J.A.; Winebrenner, D.P.; Conway, H.; Matsuoka, K.; Mayewski, P.A. Clow, G.D. (2007). Modeling englacial radar attenuation at Simple Dome, West Antarctica, using ice chemistry and temperature data, J. Geophysics Res., 112, F03008, doi:10.1029/2006JF000717.
Oswald, G.K.A.; Gogineni, S.P. (2008). Recovery of subglacial water extent from Greenland radar survey data, J. Galcyology, vol. 54, num. 184, (94-106).
Paden, J.D.; Allen, C.T.; Gogineni, S.; Jezek, K.C.; Dahl-Jensen, D.; Larsen, L.B. (2005). Wideband measurements of ice sheet attenuation and basal scattering“, Geoscience and Remote Sensing Letters IEEE 2, 2, (164 – 168).
Peters, M.E.; Blankenship, D.D., Morse D.L. (2005). Analysis techniques for coherent airborne radar sounding: Application to West Antarctic ice streams, J. Geophys. Res., 110, B06303, doi: 10.1029/2004JB003222, 2005.
www.intechopen.com
Radar Technology
178
Plewes, L.A.; Hubbard B. (2001). A review of the use of radio-echo sounding in glaciology Progress in Physical Geography, vol. 25, num. 2, (203-236).
Raju, G.; Xin, W.; Moore, R. K. (1990). Design, development, field operations and preliminary results of the coherent Antarctic radar depth sounder (CARDS) of the University of Kansas, USA. J. Glaciology, vol. 36,123, (247-258).
Rees, W.G.; Donovan, R.E. (1992). Refraction correction for radio-echo sounding of large ice masses. Journal of Glaciology 32, (192-194).
Reynold J.M. (1997). An introduction to Applied and Enviromental geophysics. Chichester: Wiley. Raymond, C.F.; Catania, G.A.; Nereson, N.; van der Veen, C.J. (2006) Bed radar reflectivity
across the north margin of Whillans Ice Stream, West Antarctica, and implications for margin processes. Journal of Glaciology, 52, 176, (3-10)
Siegert, M.J.; Carter, S.P.; Tabacco, I.E.; Popov, S.; Blankenship, D.D. (2005). A revised inventory of Antarctic subglacial lakes. Antarctic Science, 17(3), ( 453-460).
Skolnik M. (1990). Radar Handbook McGraw-Hill,1990, 2nd edn. Stauffer, B. (1991). The Greenland Icecore Project (GRIP). Communications. The Journal of the
European Science Foundation, 24, (12-13). Tabacco, I.E.; Passerini, A.; Corbelli, F.; Gorrnan M. (1998). Determination of the surface and
bed topography at Dome C, East Anatrctica. Journal of Glaciology, 39, (495-506). Tabacco, I.E.; Forieri, A.;Vedova, A.D.; Zirizzotti, A.; Bianchi, C. (2003) . Evidence of 13 new
subglacial lakes in the Dome C-Vostok area, Terra Antarct. 8, (175–179). Urbini, S; Cafarella, L; Zirizzotti, A; Bianchi, C; Tabacco, I ; Frezzotti, M. (2006). A Location
of a new ice core site at Talos Dome (East Antarctica). Annals of Geophysics 49, 4-5 (1133-1138).
Vaughan, D.G.; Bamber J.L.; Giovinetto M.; Russell J.; Cooper A.P.R. (1999). Reassessment of Net Surface Mass Balance in Antarctica. J. Climate, 12, (933–946).
Waite, AH; Schmidt; SJ. (1961). Gross errors in Height Indication from Radio Altime- ters Operating Over Thick Ice or Snow. Institute of Radio Engineers International Convention Record, 5, (38-53)
Wingham, D.; Siegert, J.; Shepherd, A.; Muir A.S. (2006). Rapid discharge connects Antarctic subglacial lakes. Nature, vol. 440, (1033-1036).
Wolff, E. (2004). EPICA Dome C Core EDC99 Dielectric Profiling Data. IGBP PAGES/World Data Center for Paleoclimatology Data Contribution. Series # 2004-037, NOAA/NGDC, Paleoclimatology Program, Boulder CO, USA, 2004.
Wu, R.; King W.. P. (1965). The cylindrical antenna with nonre- flecting resistive loading,” IEEE Trans. Antennas Propagat., vol. 13, (369-373).
Zirizzotti, A.;. Baskaradas, J.A; Bianchi, C.; Sciacca, U.; Tabacco, I.E.; Zuccheretti, E. (2008), Glacio RADAR system and results, IEEE Radar Conference, 2008. RADAR ‘08., 1-3, 26, doi: 10.1109/RADAR.2008.472099
www.intechopen.com

Radar TechnologyEdited by Guy Kouemou
ISBN 978-953-307-029-2Hard cover, 410 pagesPublisher InTechPublished online 01, January, 2010Published in print edition January, 2010
InTech EuropeUniversity Campus STeP Ri Slavka Krautzeka 83/A 51000 Rijeka, Croatia Phone: +385 (51) 770 447 Fax: +385 (51) 686 166www.intechopen.com
InTech ChinaUnit 405, Office Block, Hotel Equatorial Shanghai No.65, Yan An Road (West), Shanghai, 200040, China
Phone: +86-21-62489820 Fax: +86-21-62489821
In this book “Radar Technology”, the chapters are divided into four main topic areas: Topic area 1: “RadarSystems” consists of chapters which treat whole radar systems, environment and target functional chain. Topicarea 2: “Radar Applications” shows various applications of radar systems, including meteorological radars,ground penetrating radars and glaciology. Topic area 3: “Radar Functional Chain and Signal Processing”describes several aspects of the radar signal processing. From parameter extraction, target detection overtracking and classification technologies. Topic area 4: “Radar Subsystems and Components” consists ofdesign technology of radar subsystem components like antenna design or waveform design.
How to referenceIn order to correctly reference this scholarly work, feel free to copy and paste the following:
Achille Zirizzotti, Stefano Urbini, Lili Cafarella and James A.Baskaradas (2010). Radar Systems for Glaciology,Radar Technology, Guy Kouemou (Ed.), ISBN: 978-953-307-029-2, InTech, Available from:http://www.intechopen.com/books/radar-technology/radar-systems-for-glaciology

© 2010 The Author(s). Licensee IntechOpen. This chapter is distributedunder the terms of the Creative Commons Attribution-NonCommercial-ShareAlike-3.0 License, which permits use, distribution and reproduction fornon-commercial purposes, provided the original is properly cited andderivative works building on this content are distributed under the samelicense.

![Modeling englacial radar attenuation at Siple Dome, West ...earthweb.ess.washington.edu/Glaciology/projects/... · [2] Radio-echo sounding is a proven tool for character-izing the](https://img.pdfslide.us/doc/110x75/60c98d6c595d4e64680762ee/modeling-englacial-radar-attenuation-at-siple-dome-west-2-radio-echo-sounding.jpg)