Embed Size (px)
Citation preview
econstorMake Your Publications Visible.
A Service of
zbwLeibniz-InformationszentrumWirtschaftLeibniz Information Centrefor Economics
Chatterji, Pinka; Joo, Heesoo; Lahiri, Kajal
Working Paper
Racial/ethnic and education-related disparities incontrol of risk factors for cardiovascular diseaseamong diabetics
CESifo Working Paper, No. 3448
Provided in Cooperation with:Ifo Institute – Leibniz Institute for Economic Research at the University ofMunich
Suggested Citation: Chatterji, Pinka; Joo, Heesoo; Lahiri, Kajal (2011) : Racial/ethnic andeducation-related disparities in control of risk factors for cardiovascular disease amongdiabetics, CESifo Working Paper, No. 3448, Center for Economic Studies and Ifo Institute(CESifo), Munich
This Version is available at:http://hdl.handle.net/10419/46323
Standard-Nutzungsbedingungen:
Die Dokumente auf EconStor dürfen zu eigenen wissenschaftlichenZwecken und zum Privatgebrauch gespeichert und kopiert werden.
Sie dürfen die Dokumente nicht für öffentliche oder kommerzielleZwecke vervielfältigen, öffentlich ausstellen, öffentlich zugänglichmachen, vertreiben oder anderweitig nutzen.
Sofern die Verfasser die Dokumente unter Open-Content-Lizenzen(insbesondere CC-Lizenzen) zur Verfügung gestellt haben sollten,gelten abweichend von diesen Nutzungsbedingungen die in der dortgenannten Lizenz gewährten Nutzungsrechte.
Terms of use:
Documents in EconStor may be saved and copied for yourpersonal and scholarly purposes.
You are not to copy documents for public or commercialpurposes, to exhibit the documents publicly, to make thempublicly available on the internet, or to distribute or otherwiseuse the documents in public.
If the documents have been made available under an OpenContent Licence (especially Creative Commons Licences), youmay exercise further usage rights as specified in the indicatedlicence.
www.econstor.eu

Racial/Ethnic and Education-Related Disparities in Control of Risk Factors for Cardiovascular
Disease among Diabetics
Pinka Chatterji Heesoo Joo Kajal Lahiri
CESIFO WORKING PAPER NO. 3448 CATEGORY 3: SOCIAL PROTECTION
MAY 2011
An electronic version of the paper may be downloaded • from the SSRN website: www.SSRN.com • from the RePEc website: www.RePEc.org
• from the CESifo website: Twww.CESifo-group.org/wp T

CESifo Working Paper No. 3448
Racial/Ethnic and Education-Related Disparities in Control of Risk Factors for Cardiovascular
Disease among Diabetics
Abstract Objectives: To estimate racial/ethnic and education-related disparities and examine trends in uncontrolled cardiovascular (CVD) risk factors among adults with diabetes. Methods: The analysis samples include adults aged 20 and over from NHANES III, 1988-1994 and NHANES 1999-2008 who self-report having diabetes (n =1,107, NHANES III; n = 1,933, NHANES 1999-2008). Using logistic regression models, we examine correlates of binary indicators measuring: (1) high blood glucose; (2) high blood pressure; (3) high cholesterol; and (4) smoking. Results: Control of blood glucose, blood pressure, and cholesterol improved among diabetics between NHANES III and NHANES 1999-2008, but there was no change in smoking prevalence. In NHANES 1999-2008, racial/ethnic minorities and individuals without some college were more likely to have poorly controlled blood glucose compared to non-Latino whites and those with some college. Also, diabetics with some college were less likely to smoke and had better blood pressure control compared to diabetics without some college. Conclusions: Trends in CVD risk factors among diabetics improved over the past two decades, but racial/ethnic and education-related disparities have emerged in some areas.
JEL-Code: I120.
Keywords: cardiovascular (CFD) risk factors, diabetes, health disparity, NHANES.
Pinka Chatterji Department of Economics University at Albany / USA
Heesoo Joo Department of Economics University at Albany / USA
Kajal Lahiri Department of Economics University at Albany / USA
March 29, 2011 This research was supported by the National Center on Minority Health and Health Disparities, National Institutes of Health (grant number P20MD003373). The content is solely the responsibility of the authors and does not necessarily represent the official views of the National Center on Minority Health and Health Disparities or the National Institutes of Health.

3
INTRODUCTION
Diabetes is a leading cause of morbidity and mortality in the U.S, and the prevalence of
this disease is rising.1 The Centers for Disease Control and Prevention (CDC), based on data
from the National Health Interview Survey, estimate that the age-adjusted prevalence of
diagnosed diabetes increased from 3.7% in 1980 to 7.7% in 2008.2 The total direct and indirect
costs associated with diabetes in the U.S. was estimated to be $174 billion in 2007, with about
33% ($58 billion) of the total cost being attributed to treatment of medical complications.3
Cardiovascular disease (CVD) is a widely-documented potential complication of diabetes, and a
leading cause of mortality among diabetics.4,5,6 Although rates of CVD events have declined in
recent decades among both diabetics and non-diabetics, diabetics are still twice as likely as non-
diabetics to experience a CVD event, 4 and diabetics have heart disease mortality rates that are 2-
4 times greater than those of non-diabetics.6
To prevent CVD and other complications of diabetes, the American Diabetes Association
(ADA) in 2009 published updated standards for diabetes screening, diagnosis, and therapeutic
care.7 These guidelines, which reflect new evidence from epidemiological studies and
randomized controlled trials (RCTs), included targets for glycemic control, blood pressure
control, lipid control, and smoking.7 The ADA recommends most diabetic adults maintain: a
HbA1C (a measure of blood glucose) level below or around 7.0%; blood pressure under 130/80
mmHg; and LDL cholesterol under 100mg/dl (2.6mmol/l).7 All patients with diabetes are
advised not to smoke.7 In addition, the National Cholesterol Education Program Adult Treatment
Panel III recommends that diabetics keep LDL under 100mg/dl and total cholesterol under
200mg/dl.8

4
Given that successful management of diabetes requires a coordinated team of health
providers7 and access to health insurance,9continuity of care,10 as well as patient knowledge and
self-management skills,11 there may be differences across socio-demographic groups within the
diabetic population in control of CVD risk factors. Much of what we know about national trends
in and socio-demographic correlates of control of CVD risk factors among diabetics comes from
the National Health and Nutrition Examination Survey (NHANES), one of the only national
surveys available which includes a medical examination. Based on data from NHANES 1999-
2000, prior researchers report that only 7.3% of those who have diagnosed diabetes achieve all
three of the ADA (2009) targets for control of blood sugar, blood pressure and total cholesterol.12
Between NHANES III (1988-1994) and NHANES 1999-2000, trends in control of blood
cholesterol among diagnosed diabetics improved, but there was no change in control of blood
glucose levels and blood pressure levels.12 Racial/ethnic and education-related disparities in
glycemic control have been noted in prior studies, but not all of these relationships persist in
regression models which include controls for other potentially confounding factors.13-15
Previous studies have documented the prevalence of CVD risk factors among diabetics
using data from NHANES III (1988-1994) and NHANES 1999-200012 but these studies are
based on information which is now more than 10 years old, and thus may not capture current
dynamics in these outcomes. Given the mounting body of evidence showing the importance of
controlling diabetics’ CVD risk factors,7 and the increasing focus on prevention in the 2010
health care reform law,16 it is critical to document current trends in control of CVD risk factors
among diabetics, and to examine whether any improvements have been concentrated in
particular socio-demographic groups. This paper uses the most recent data available - data from
NHANES III and NHANES 1999-2008 - to examine the prevalence of poor control of risk

5
factors for CVD (specifically, high blood glucose, high blood pressure, high total cholesterol or
current smoking) among adults with diagnosed diabetes. We examine trends in control of risk
factors, and focus on evolving patterns of racial/ethnic and education-related disparities in the
control of such factors among diabetics.
METHODS
Study Population and Analysis Samples.
We use two samples, a sample from NHANES III (1988-1994) and a sample from
NHANES 1999-2008. The NHANES survey uses a stratified, multistage probability sampling
frame and represents the civilian, non-institutionalized US population. The NHANES III
interviewed 18,825 individuals aged 20 or older. We limit our NHANES III sample to 1,503 of
these respondents who report having been diagnosed with diabetes. In NHANES 1999-2008,
26,246 individuals aged 20 or older were interviewed, and we limit our NHANES 1999-2008
sample to 2,802 of these respondents who report having been diagnosed with diabetes. Among
those reporting diabetes, we further limit NHANES III and NHANES 1999-2008 samples to
those who have information regarding all four CVD risk factors (blood glucose, blood pressure,
lipids, and current smoking). Blood glucose, blood pressure, and lipids information are available
only for those NHANES respondents who participated in the medical examination portion of the
survey, which included a blood draw. Smoking information is obtained from the interview.
These sample restrictions yield 1,149 respondents in the NHANES III sample and 2,056
respondents in the NHANES 1999-2008 sample. After dropping respondents with missing socio-
demographic characteristics used in the analysis, our final analysis samples include 1,107
respondents from NHANES III and 1,933 respondents from NHANES 1999-2008.

6
Definitions and Measures
We consider an individual to have diagnosed diabetes if s/he answered yes to an
interview question “Have you ever been told by a doctor or health professional that you have
diabetes or sugar diabetes?” We do not consider respondents who report having diabetes only
during pregnancy to have diagnosed diabetes. When we estimate prevalence rates of diagnosed
diabetes, we use all respondents from the NHANES III and NHANES 1999-2008 samples who
provided a response to this question.
To define poor control of blood glucose and blood pressure, we follow the ADA 2009
guidelines. We define poor glycemic control using a binary indicator of having a HbA1C 7%.
To define poor blood pressure control, we use a binary indicator of having a systolic blood
pressure 130mmHg or diastolic blood pressure 80mmHg. The NHANES medical examination
includes three or more readings of systolic and diastolic blood pressure. We use the average of
the 2nd and 3rd readings. For NHANES 1999-2008, we additionally use average of the 3rd and 4th
measure and the average of the 2nd and 4th measure of blood pressure in cases where the 2nd or 3rd
measure of blood pressure is missing. We define a dichotomous indicator of current smoking,
which equals 1 if a respondent reports “yes” to the question “Have you smoked at least 100
cigarettes in your entire life?” and does not answer “not at all” to the “Do you now smoke
cigarettes…” question in NHANES 1999-2008. In NHANES III, we define a current smoker as
someone who reports “yes” to both “Have you smoked at least 100 cigarettes during your entire
life?” and “Do you smoke cigarettes now?”
To measure lipid control, we use the total cholesterol level which follows the ATP III
panel guidelines instead of LDL cholesterol as suggested by ADA 2009 because of the small

7
sample sizes with available LDL cholesterol information in NHANES (n=360 in NHANES III,
n=785 in NHANES 1999-2008). The small sample sizes result from the LDL cholesterol
measurement only being available for those who were assigned an NHANES medical
examination scheduled in the morning. We use a binary indicator for total cholesterol being
200mg/dl or higher as an indicator for poor lipid control.
Analyses
Initially, we examine trends in the prevalence of diagnosed diabetes and the socio-
demographic characteristics of the diagnosed diabetes populations in the NHANES III and the
NHANES 1999-2008 samples. We report age-gender adjusted as well as unadjusted prevalence
rates of diagnosed diabetes (Table 1). Standardization is based on 2000 Census population using
6 age-gender groups (20-39, 40-59, and 60 or more years old; male and female). We then
examine sample characteristics of the diagnosed diabetic population in NHANES III and
NHANES 1999-2008 (Table 2) and, in Table 3, estimate rates of poor control of CVD risk
factors in the NHANES III and the NHANES 1999-2008 samples, and by racial/ethnic and
education groups. In Table 2-3, NHANES III percentages have been standardized according to
NHANES 1999-2008 diagnosed diabetic population using 6 age-gender groups and the
corresponding weights.12 We compare the rates of poor control of CVD risk factors between
NHANES III and NHANES 1999-2008 (Table 3).17
We use logistic models estimated with survey weights to test for racial/ethnic and
education-related disparities in poorly controlled risk factors for CVD among diagnosed
diabetics (Table 4). The models include controls for race/ethnicity (African-American, Latino,
Other race/ethnicity vs. non-Latino white), age categories (40-59 years, 60years vs. 20-39

8
years), gender (female vs. male), marital status (married vs. not married), years since diagnosis
of diabetes (2-5years, 6-10 years, 11-15 years, 16 years vs. 0-1 years), obesity (BMI 25-29
(overweight), BMI 30 (obese) vs. BMI<25 (normal BMI)) , access to routine care (has routine
access vs. does not have routine access), health insurance type (public, public and private,
uninsured vs. private only), and indicators for survey year. All analyses in this paper were
performed using STATA software, version 11.1.
RESULTS
Trends in diagnosed diabetes and characteristics of the diagnosed diabetic population
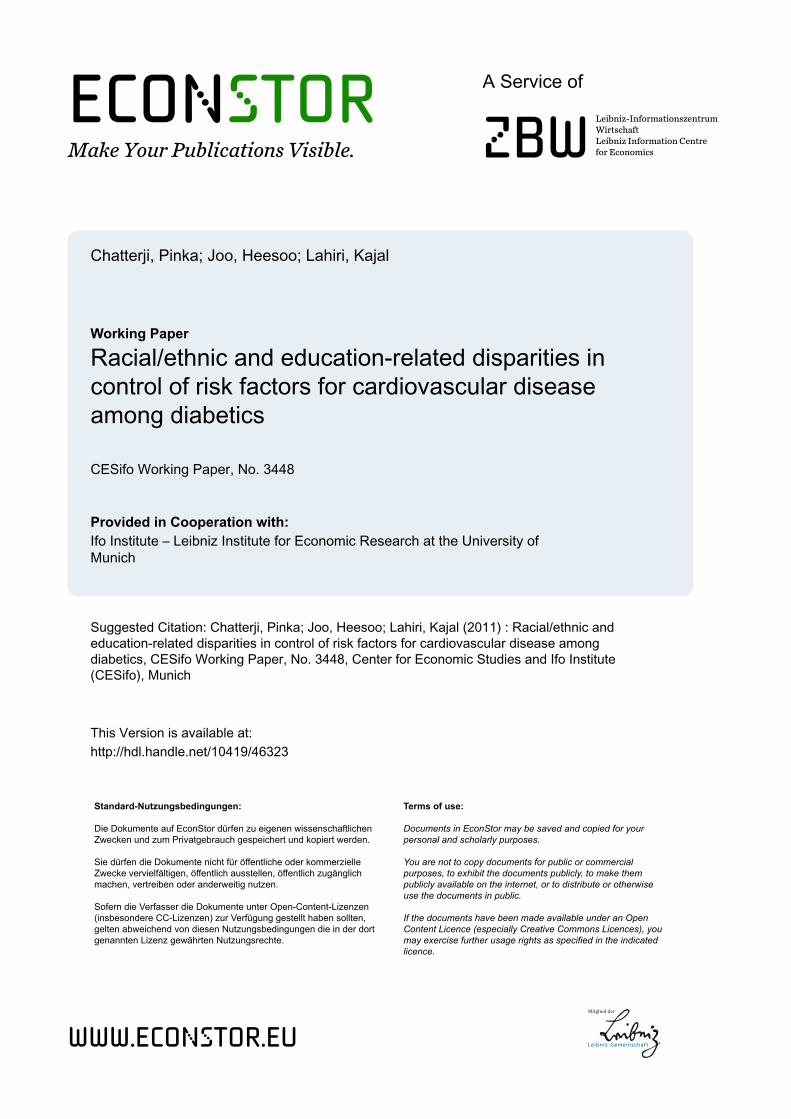
As others have reported,2,12,18 the prevalence of diagnosed diabetes has increased
appreciably over time (Table 1). The age-gender standardized prevalence rate of diagnosed
diabetes in NHANES 1999-2008 was 7.4%, while it was 5.3% in NHANES III (1988-1994)
(P<0.001). The unadjusted prevalence of diagnosed diabetes shows the same pattern, increasing
from 5.1% in NHANES III (1988-1994) to 7.5% in NHANES 1999-2008 (P<0.001), which is
consistent with prior research.19,20 Between NHANES III and NHANES 1999-2008, the
incidence of diabetes (diagnosed and undiagnosed) increased from 7.7% to 9.9% (results not
shown). We find that among those with diabetes (diagnosed and undiagnosed), the rate of
undiagnosed diabetes decreased from 38.4% to 28.4% (results not shown), suggesting that
diagnosis has improved over time.
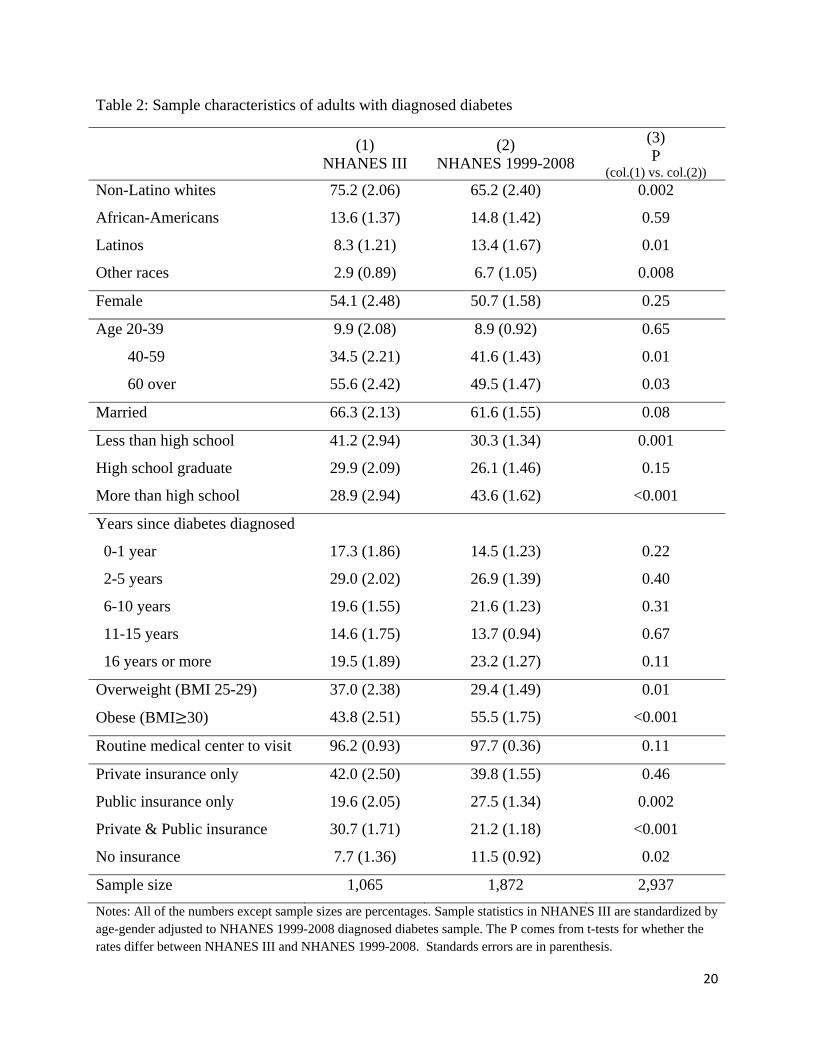
One of the most significant changes in the characteristics of the diagnosed diabetic
population between NHANES III and NHANES 1999-2008 is the race/ethnicity distribution.
Table 2 shows the increases over time in the proportions of Latinos (8.3% 13.4%, P=0.01)
and individuals from the Other race/ethnicity group (2.9% 6.7%, P=0.008) in the diagnosed

9
diabetic population while the proportion of non-Latino whites declined (75.2% 65.2%,
P=0.002). For African-Americans, there is no statistically significant change between NHANES
III and NHANES 1999-2008 (Table 2).
The age distribution of the diagnosed diabetic population also changed between
NHANES III and NHANES 1999-2008 (Table 2). The proportion of middle-aged individuals
increased over time (40-59 years old, 34.5%41.6%, P=0.01) while the proportion of elderly
individuals declined (60 or more years old, 55.649.5%, P=0.03). This trend may result from
earlier diagnosis of diabetes and/or earlier onset of diabetes in recent years. In fact, we find that
mean age at the time of diabetes diagnosis is higher in NHANES III than in NHANES 1999-
2008 (50.0 vs. 47.3, P<.001), and the number of years since diabetes is diagnosed is 9.1 years in
NHANES III vs. 11.4 in NHANES 1999-2008 (P<.001).
In addition, the education profile of diagnosed diabetics changed remarkably between
NHANES III and NHANES 1999-2008 (Table 2). The proportion of high school dropouts
among diagnosed diabetics decreased from 41.2% to 30.3% (P=0.001), while the percentage with
some post-secondary education increased from 28.9% to 43.6% (P<0.001). To some extent, this
change results from an increasing level of education in the population as a whole. Between
NHANES III and NHANES 1999-2008, the age-gender standardized percentage of NHANES
respondents aged 20 and older with at least some post-secondary education rose from 43.0% in
NHANES III to 54.0% in NHANES 1999-2008 (P<0.001). However, we note that while the
diagnosed diabetes population becomes more educated between NHANES III and NHANES
1999-2008, the same tilt in the education distribution is not observed in the undiagnosed diabetic
population (results not shown). This may imply that improvements in diagnosis of diabetes

10
have been strongest among the educated, making diagnosed diabetics as a group more educated
over time.
Finally, the diabetic population has become more obese over time, with obesity levels
increasing from 43.8% in NHANES III to 55.5% in NHANES 1999-2008 (P<0.001). The
percentage of people who are either obese or overweight also increased between NHANES III
(80.8%) and NHANES 1999-2008 (84.9%).
Trends in Poor Control of CVD Risk Factors
Our findings suggest that control of CVD risk factors among diagnosed diabetes has
improved markedly over the past two decades (Table 3). The percentage of diagnosed diabetics
not achieving glycemic control (HbA1C over 7%) was 49.4% in NHANES 1999-2008, an
improvement from NHANES III (1988-1994) when 56.6% of diagnosed diabetics did not meet
this target (P=0.03). The percentage of diagnosed diabetics who do not achieve blood pressure
control (130/80mmHg or higher) decreased from 60.5% in NHANES III (1988-1994) to 54.2%
in NHANES 1999-2008 (P=0.04). The percentage of diagnosed diabetics who do not have total
cholesterol under 200mg/dl also significantly fell from 66.7% in NHANES III (1988-1994) to
41.9% in NHANES 1999-2008. These improvements contrast with previous work that also
reports improvements in cholesterol control, but finds no change in glycemic control or blood
pressure control, among diagnosed diabetics in NHANES III (1988-1994) and NHANES 1999-
2000.9 Rates of current smoking among diagnosed diabetics, however, did not change between
NHANES III (18.2%) and NHANES 1999-2008 (18.3%, P=0.98).
Notably, our analyses show a trend of improvement not only in the control of each risk
factor individually but also in the number of controlled risk factors. In NHANES III (1988-

11
1994), only 6.1% of diagnosed diabetes had control of all of the four risk factors we examined.
In NHANES 1999-2008, however, 13.8% of diagnosed diabetics had control of all of four risk
factors (P <0.001). Also, the percentage of diagnosed diabetics who had control of three of the
four risk factors increased from 24.1% to 31.0% (P=0.02) between NHANES III (1988-1994)
and NHANES 1999-2008. Nevertheless, in NHANES 1999-2008, more than half of the
diagnosed diabetic population (55.2%) still has more than two uncontrolled risk factors.
Racial/ethnic and education-related disparities in poor control of CVD risk factors
In NHANES III (1988-1994), we find no racial/ethnic or educated related disparities in
glycemic control among diagnosed diabetics (Table 4, panel 1). In NHANES 1999-2008,
however, we find that African-Americans and Latinos with diagnosed diabetes are about 50%
more likely than non-Latino whites with diagnosed diabetes to be in poor glycemic control
(African-American vs. non-Latino white, OR=1.57, CI=1.17-2.12; Latino vs. non-Latino white,
OR=1.55, CI=1.06-2.26). Also, in NHANES 1999-2008, we find that individuals with post-
secondary education are less likely to be in poor glycemic control compared to those without
post-secondary education (OR=0.70, CI=0.51-0.96). In sum, these results indicate that while
glycemic control has improved in the diabetic population at large, these improvements have been
concentrated among non-Latino white and more educated diabetics, such that new health
disparities have emerged.
We do not find racial/ethnic differences in blood pressure control among diagnosed
diabetics in either NHANES III (1988-1994) or NHANES 1999-2008 (Table 4, panel 2).
However, although there is no education gradient in blood pressure control in NHANES III,
using NHANES 1999-2008, we find that diagnosed diabetics with post-secondary education are

12
less likely than those without post-secondary education to be in poor control of blood pressure
(OR=0.66, CI=0.49-0.89). This finding suggests that improvements in blood pressure control
over time may be concentrated among more educated diabetics.
There are no racial/ethnic or education-related disparities in total cholesterol control
among diagnosed diabetics in either NHANES III (1988-1994) or NHANES 1999-2008 (Table
4, panel 3). In the case of smoking, post-secondary education and Latino ethnicity are associated
with lower risk of smoking in NHANES 1999-2008 (Table 4, panel 4; Latino vs. non-Latino
white, OR=0.62, CI=0.40-0.97; post-secondary education vs. no post-secondary education,
OR=0.63, CI=0.41-0.96). We do not find these ORs in NHANES III; surprisingly, having 12
years of education (compared to less than 12 years) is associated with higher risk of smoking in
NHANES III, although the CI is very wide for this estimate (Table 4, panel 4, OR=2.24,
CI=1.01-4.95).
DISCUSSION
In the newly released Healthy People 2020, three objectives in the area of diabetes are to
improve glycemic, lipid, and blood pressure control among individuals with diagnosed disease.21
These objectives reflect mounting evidence that control of these risk factors prevents CVD
complications and mortality among diabetics. 7, 22-24 In addition, reducing smoking is a Healthy
People 2020 objective for all adults. Our results show favorable trends in all of these areas
except smoking rates. Between NHANES III (1988-1994) and NHANES 1999-2008, the
proportion of diagnosed diabetics with poor glycemic, blood pressure, and lipid control fell by
13%, 10%, and 37% respectively. The prevalence of current smoking among diagnosed
diabetics, however, remained stable during the time period we examined. Our findings differ

13
from research based on data from the 1990’s, which shows improvements in cholesterol control,
but no changes in glycemic control and blood pressure control between NHANES III and
NHANES 1999-2000.12
Our results suggest that, in some areas, improvements in control of CVD risk factors
appear to have benefitted all racial/ethnic and education groups. In the case of cholesterol levels,
for example, all racial/ethnic and education groups experienced significant improvements in
control between NHANES III and NHANES 1999-2008. In fact, we find no evidence of
racial/ethnic or education related disparities in poor control of cholesterol in either NHANES III
or NHANES 1999-2008. In addition, there were no racial/ethnic disparities in blood pressure
control in NHANES III or NHANES 1999-2008.
However, in the case of glycemic control, improvements over time were driven by
improvements among non-Latino white and more educated diabetics. Rates of poor glycemic
control fell by 17% among non-Latino whites, and by 23% among those with 12 years of
education between NHANES III and NHANES 1999-2008, but rates of glycemic control
remained stable during this time period among African-Americans and Latinos, and among those
with less than a high school education. Results from our regression analysis, which includes
controls for a number of confounding factors, suggest that African-Americans and Latinos with
diagnosed diabetes in NHANES 1999-2008 are 50% more likely to have poor glycemic control
than non-Latino whites with diagnosed diabetes. The existence of racial/ethnic disparities in
glycemic control among diagnosed diabetics in NHANES 1999-2008 is consistent with research
based on NHANES 1999-2002.14

14
Moreover, in NHANES 1999-2008, diabetics with at least some college education were
less likely to have uncontrolled blood pressure than those without any college education,
controlling for other factors. It is also notable that smoking rates among diagnosed diabetics
have not improved over time and remain high in some sub-groups – in NHANES 1999-2008,
22% of diagnosed diabetics without a high school education are current smokers. This high rate
of smoking among the least educated diabetics is consistent with other data.26
In sum, our findings show that important progress has been made in reducing CVD risk
factors among diagnosed diabetics over the past decade, but this progress in some cases has been
uneven across socio-demographic groups. There are several potential reasons why
improvements in glycemic control may have been concentrated among non-Latino white and
more educated populations. First, some groups may have better access than other groups to the
type of integrated, comprehensive medical care that diabetics need in order to successfully
manage their illness. Although we adjust for insurance status and access to routine care in our
regression models, there still may exist unmeasured aspects of quality and access that are
correlated with race/ethnicity and education. Second, more educated diabetics may have been
better able to obtain and understand new information related to diabetes treatment compared to
less educated diabetics. There is evidence that more educated people adopt medical technologies
more rapidly than less educated people.27 Third, culture and language may play a role in diabetes
management practices, and these factors may underlie racial/ethnic disparities in outcomes.11
Although the mechanisms through which socio-demographic characteristics affect control
of CVD risk factors are unclear, our findings underscore the need to remediate these emerging
racial/ethnic and education-related disparities in this area of health care. Moreover, while our
findings show marked improvements in control of CVD risk factors among diabetics, it is also

15
true that only a small group (13.8%) of diagnosed diabetics in NHANES 1999-2008 have control
of all four CVD risk factors we examined. Continued public health efforts need to be made to
address the large majority of diagnosed diabetics with uncontrolled risk factors for CVD.

16
REFERENCES
1. Engelgau MM, Geiss LS, Saaddine JB, et al. The evolving diabetes burden in the United
States. Ann Intern Med. 2004;140:945-950.
2. Centers for Disease Control and Prevention. Diabetes Data & Trend. Available at:
http://www.cdc.gov/diabetes/statistics/prev/national/figageadult.htm. Accessed March 23, 2011.
3. American Diabetes Association. Economic costs of diabetes in the U.S. in 2007. Diabetes
Care. 2008; 31:596-615.
4. Fox CS, Coady S, Sorlie PD, et al. Trends in cardiovascular complications of diabetes. JAMA.
2004;292:2495-2499.
5. Buse JB, Ginsberg HN, Bakris GL, et al. Primary prevention of cardiovascular diseases in
people with diabetes mellitus: a scientific statement from the American Heart Association and
the American Diabetes Association. Circulation. 2007;115:114-126.
6. Centers for Disease Control and Prevention. National diabetes fact sheet: national estimates
and general information on diabetes and prediabetes in the United States, 2011. Atlanta, GA:
U.S. Department of Health and Human Services, Centers for Disease Control and Prevention,
2011.
7. American Diabetes Association. Standards of medical care in diabetes-2009. Diabetes Care.
2009; 32:S13-S61.
8. National Cholesterol Education Program. Third report of the National Cholesterol Education
Program (NCEP) expert panel on detection, evaluation, and treatment of high blood cholesterol
in adults (Adult Treatment Panel III) final report. NIH Publication No.02-5215. 2002.
9. Zhang JX, Huang ES, Drum ML, et al. Insurance status and quality of diabetes care in
community health center. Am J Public Health. 2009;99:742-747.
10. Mainous AG III, Koopman RJ, Gill JM, Baker R, Pearson WS. Relationship between
continuity of care and diabetes control: Evidence from the Third National Health and Nutrition
Examination Survey. Am J Public Health. 2004;94:66-70.

17
11. Two Feathers J, Kieffer EC, Palmisano G, et al. Racial and Ethnic Approaches to
Community Health (REACH) Detroit partnership: Improving diabetes-related outcomes among
African American and Latino adults. Am J Public Health, 2005;95:1552-1560.
12. Saydah SH, Fradkin J, Cowie CC. Poor control of risk factors for vascular disease among
adults with previously diagnosed diabetes. JAMA. 2004;291:335-342.
13. Harris MI. Flegal KM. Eastman RC. et al. Racial and ethnic differences in glycemic control
of adults with type 2 diabetes. Diabetes Care. 1999;22:403-408.
14. Saydah S, Cowie C, Eberhardt MS, et al. Race and ethnic differences in glycemic control
among adults with diagnosed diabetes in the United States. Ethnicity & Disease. 2007; 17:529-
535.
15. Boltri JM, Okosun IS, Davis-Smith M, Vogel RL. Hemoglobin A1c levels in diagnosed and
undiagnosed black, Hispanic, and white persons with diabetes: results from NHANES 1999-
2000. Ethnicity & Disease. 2005; 15:562-567.
16. The Henry J. Foundation . Kaiser Family. Focus on health reform. Available at:
http://www.kff.org/healthreform/upload/8061.pdf. Accessed March 23, 2011.
17. Heeringa SG, West BT, Berglund PA. Comparing means over time. In: Applied survey data
analysis. Boca Raton, FL: Chapman & Hall/CRC Press; 2010:143-144.
18. Gregg EW, Cheng YJ, Cadwell BL, et al. Secular trends in cardiovascular disease risk
factors according to body mass index in US adults. JAMA. 2005; 293:1868-1874.
19. Cowie CC, Keith FR, Mark SE, et al. Full accounting of diabetes and pre-diabetes in the U.S.
population in 1988-1994 and 2005-2006. Diabetes Care. 2009;32:287-294.
20. Cowie CC, Keith FR, Byrd-Holt DD, et al. Prevalence of diabetes and impaired fasting
glucose in adults in the U.S. population. Diabetes Care. 2006;29:1263-1268.
21. Healthy People 2020: 2020 Topics & Objectives. Available at:
http://www.healthypeople.gov/2020/topicsobjectives2020/objectiveslist.aspx?topicid=8.
Accessed March 23, 2011.

18
22. Stamler J, Vaccaro O, Neaton JD, Wentworth D. Diabetes, other risk factors, and 12-yr
cardiovascular mortality for men screened in the Multiple Risk Factor Intervention Trial.
Diabetes Care. 1993;16:434-444.
23. Haffner SM, Lehto S, Ronnemaa et al. Mortality from coronary heart disease in subjects with
type 2 diabetes and in nondiabetic subjects with and without prior myocardial infarction. N Engl
J Med. 1998;339:229-234.
24. DECODE Study Group, European Diabetes Epidemiology Group. Is the current definition
for diabetes relevant to mortality risk from all causes and cardiovascular and noncardiovascular
disease? Diabetes Care. 2003;26:688-696.
25. Heisler M, Smith DM, Hayward RA et al. Racial disparities in diabetes care processes,
outcomes, and treatment intensity. Medical Care. 2003;41:1221-1232.
26. Karter AJ, Stevens MR, Gregg EW, et al. Educational disparities in rate of smoking among
diabetic adults: The translating research into action for diabetes study. Am J Public Health,
2008;98:365-370.
27. Lleras-Muney A, Lichtenberg FR. Are the more educated more likely to use new drugs? In:
Miresse J, Trajtenberg M, eds. NBER book Contributions in Memory of Zvi Griliches. Annales
D D'Économie et de Statistique;2010:671-696.
19
Table 1: Prevalence rates of diagnosed diabetes among adults aged 20 or older
(1)
NHANES III
(2)
NHANES 1999-2008
(3) P
(col.(1) vs. col.(2))
Total Sample 16,552 24,674 -
Unadjusted Diagnosed Diabetes
Race
non-Latino white
African-American
Latino
Education
Less than high school
High school graduate
More than high school
5.1 (0.26)
4.9 (0.35)
6.9 (0.43)*
4.8 (0.53)
8.5 (0.49)
4.8 (0.43)*
3.2 (0.35)*
7.5 (0.26)
6.7 (0.32)
11.5 (0.49)*
8.1 (0.57)*
12.1 (0.44)
7.6 (0.44)*
5.8 (0.31)*
<0.001
<0.001
<0.001
<0.001
<0.001
<0.001
<0.001
Standardized Diagnosed Diabetes
Race
non-Latino white
African-American
Latino
Education
Less than high school
High school graduate
More than high school
5.3 (0.24)
4.8 (0.31)
8.4 (0.42)*
7.1 (0.69)*
7.5 (0.44)
5.4 (0.46)*
3.8 (0.34)*
7.4 (0.25)
6.1 (0.29)
12.6 (0.45)*
10.9 (0.59)*
10.7 (0.38)
7.3 (0.41)*
6.0 (0.32)*
<0.001
0.004
<0.001
<0.001
<0.001
0.003
<0.001 Notes: All numbers except sample sizes are percentages. The age-gender adjusted rates for diagnosed diabetes are adjusted using data from the 2000 US Census. The P comes from t-tests for whether the rates differ between NHANES III and NHANES 1999-2008. Standards errors are in parentheses. * denotes that the difference between the reference group (non-Latino white for race and less than high school for education) and each race or education group within same period is statistically significant with P<0.05.
20
Table 2: Sample characteristics of adults with diagnosed diabetes
(1) NHANES III
(2) NHANES 1999-2008
(3) P
(col.(1) vs. col.(2)) Non-Latino whites
African-Americans
Latinos
Other races
75.2 (2.06)
13.6 (1.37)
8.3 (1.21)
2.9 (0.89)
65.2 (2.40)
14.8 (1.42)
13.4 (1.67)
6.7 (1.05)
0.002
0.59
0.01
0.008
Female 54.1 (2.48) 50.7 (1.58) 0.25
Age 20-39
40-59
60 over
9.9 (2.08)
34.5 (2.21)
55.6 (2.42)
8.9 (0.92)
41.6 (1.43)
49.5 (1.47)
0.65
0.01
0.03
Married 66.3 (2.13) 61.6 (1.55) 0.08
Less than high school
High school graduate
More than high school
41.2 (2.94)
29.9 (2.09)
28.9 (2.94)
30.3 (1.34)
26.1 (1.46)
43.6 (1.62)
0.001
0.15
<0.001
Years since diabetes diagnosed
0-1 year
2-5 years
6-10 years
11-15 years
16 years or more
17.3 (1.86)
29.0 (2.02)
19.6 (1.55)
14.6 (1.75)
19.5 (1.89)
14.5 (1.23)
26.9 (1.39)
21.6 (1.23)
13.7 (0.94)
23.2 (1.27)
0.22
0.40
0.31
0.67
0.11
Overweight (BMI 25-29)
Obese (BMI 30)
37.0 (2.38)
43.8 (2.51)
29.4 (1.49)
55.5 (1.75)
0.01
<0.001
Routine medical center to visit 96.2 (0.93) 97.7 (0.36) 0.11
Private insurance only
Public insurance only
Private & Public insurance
No insurance
42.0 (2.50)
19.6 (2.05)
30.7 (1.71)
7.7 (1.36)
39.8 (1.55)
27.5 (1.34)
21.2 (1.18)
11.5 (0.92)
0.46
0.002
<0.001
0.02
Sample size 1,065 1,872 2,937 Notes: All of the numbers except sample sizes are percentages. Sample statistics in NHANES III are standardized by age-gender adjusted to NHANES 1999-2008 diagnosed diabetes sample. The P comes from t-tests for whether the rates differ between NHANES III and NHANES 1999-2008. Standards errors are in parenthesis.

21
Table 3: Poor control of risk factors among adults with diagnosed diabetes
(1) NHANES III
(2) NHANES 1999-2008
(3) P
(col.(1) vs. col.(2)) Poor glycemic control (HbA1c 7%) 56.6 (2.61) 49.4 (1.80) 0.03 non-Latino white (n=418,754)
African-American (n=288,473)
Latino (n=349,578)
55.5 (2.93)
59.2 (2.80)
56.1 (5.79)
45.9 (2.49)
55.9 (2.23)*
56.1 (2.95)*
0.01
0.35
1.00
Less than high school (n=624,825)
High school graduate (n=246,413)
More than high school (n=195, 643)
53.1 (3.19)
62.2 (4.64)
54.9 (5.22)
55.5 (2.79)
48.1 (3.45)
45.3 (2.59)*
0.57
0.02
0.10
Poor blood pressure control ( 130/80 mmHg) 60.5 (2.43) 54.2 (1.87) 0.04 non-Latino white
African-American
Latino
58.6 (3.12)
69.1 (3.24)*
55.0 (4.76)
52.1 (2.66)
59.5 (2.18)*
53.7 (2.78)
0.12
0.02
0.82
Less than high school
High school graduate
More than high school
67.5 (3.27)
58.1 (3.34)*
56.0 (5.31)
58.6 (2.53)
56.7 (3.18)
48.5 (3.01)*
0.03
0.77
0.22
Poor total cholesterol control ( 200 mg/dl) 66.7 (1.97) 41.9 (1.60) <0.001 non-Latino white
African-American
Latino
68.6 (2.50)
64.7 (3.29)
59.3 (3.96)
41.2 (2.37)
41.8 (2.22)
48.7 (2.65)
<0.001
<0.001
0.03
Less than high school
High school graduate
More than high school
67.8 (2.28)
60.7 (4.03)
75.3 (2.48)*
44.0 (2.56)
39.4 (3.10)
40.5 (2.43)
<0.001
<0.001
<0.001
Current Smoking 18.2 (2.43) 18.3 (1.04) 0.98 non-Latino white
African-American
Latino
18.1 (3.19)
23.7 (3.21)
19.4 (2.72)
18.2 (1.59)
21.4 (2.39)
17.4 (2.03)
0.98
0.57
0.57
Less than high school
High school graduate
More than high school
15.3 (3.11)
26.8 (4.30)*
12.9 (3.82)
22.0 (2.18)
21.9 (2.57)
14.8 (1.50)*
0.08
0.33
0.65 Notes: See notes to Tables 1 and 2. Figures standardized using method described in Table 2.

22
Table 4: Poorly controlled CVD risk factors among adults with diagnosed diabetes in NHANES III and NHANES 1999-2008
(1) Blood Glucose
HbA1c 7%
(2) Blood Pressure
130/80 mmHg
(3) Total Cholesterol
200 mg/dl
(4) Current Smoking
NHANES III
NHANES 1999-2008
NHANES III
NHANES 1999-2008
NHANES III
NHANES 1999-2008
NHANES III
NHANES 1999-2008
non-Latino white
(Reference)
African-American
Latino
1.00
1.23
[0.84-1.80]
1.08
[0.62-1.88]
1.00
1.57*
[1.17-2.12]
1.55*
[1.06-2.26]
1.00
1.31
[0.82-2.08]
0.71
[0.41-1.24]
1.00
1.31
[0.96-1.79]
0.91
[0.64-1.30]
1.00
0.85
[0.57-1.28]
0.73
[0.43-1.24]
1.00
0.95
[0.72-1.23]
1.08
[0.75-1.55]
1.00
1.43
[0.72-2.87]
0.89
[0.45-1.78]
1.00
1.07
[0.73-1.58]
0.62*
[0.40-0.97]
Less than high school
(Reference)
High school graduate
More than high school
1.00
1.40
[0.83-2.39]
0.96
[0.61-1.52]
1.00
0.79
[0.55-1.13]
0.70*
[0.51-0.96]
1.00
0.76
[0.49-1.18]
0.61
[0.32-1.16]
1.00
0.96
[0.65-1.42]
0.66*
[0.49-0.89]
1.00
0.84
[0.51-1.36]
1.42
[0.94-2.12]
1.00
1.05
[0.74-1.47]
1.07
[0.79-1.43]
1.00
2.24*
[1.01-4.95]
0.93
[0.39-2.23]
1.00
1.03
[0.65-1.62]
0.63*
[0.41-0.96] Notes: Table shows odds ratios and confidence intervals from logistic models in which a dichotomous indicator of poor control of a risk factor is the dependent variable. Only odds ratios related to race/ethnicity and education are shown. The models also include controls for age, gender, marital status, years since diagnosis of diabetes, obesity, if the respondent has a routine place to visit for health care, insurance type, and survey year. Other racial/ethnic minorities are included in the non-Latino white reference group because of small number of observations (n=10 for NHANES III and n=67 for NHANES 1999-2008). * denotes that the difference between the reference group (non-Latino white for race and less than high school for education) and each race or education group within same period is statistically significant with P<0.05.