Embed Size (px)
Citation preview

Racial Disparities in
Marijuana Arrests in Virginia
(2003-2013)
Prepared By:
Jon Gettman, Ph.D.
Shenandoah University
Drug Policy Alliance
131 W 33rd Street
15th Floor
New York, NY 10001
212.613.8020
drugpolicy.org
2 Racial Disparities in Marijuana Arrests in Virginia
(2003-2013)
drugpolicy.org
Introduction
Marijuana possession arrests in Virginia have increased
dramatically over the last ten years, especially among
black communities. Indeed, in the three years from 2011
to 2013, marijuana possession arrests increased by 1,987
in the Commonwealth – from 19,697 arrests in 2011 to
21,684 in 2013 – and black Virginians accounted for
82% (or 1,627) of this increase.
The net effect of consistent annual increases in
marijuana arrests and related criminal justice costs can
be assessed both in terms of the failure of this approach
to curtail marijuana’s use and availability in Virginia and
more prominently with respect to increasing racial
disparities in marijuana possession arrests.
Increasing marijuana arrests have not resulted in a
decrease in marijuana use. According to data from the
National Survey on Drug Use and Health, 9.1% of
Virginians used marijuana on (at least) an annual basis in
2002 and 2003. By the years 2010/2011 annual
marijuana use in the state had increased to 9.7%.
According to the same survey, more than half (57.6%)
of Virginians found marijuana to be easy or fairly easy to
obtain in 2010/2011 – including three-quarters (76.3%)
of those age 18 to 25.
Police throughout Virginia have been enforcing
marijuana laws in racially disparate ways that have
steadily increased the arrest of black people much more
so than the arrests of white people. Overall marijuana
possession arrests in Virginia consistently increased from
2003 to 2013. However, the racial disparity in arrest rates
in the state has increased as well. In 2003 the arrest rate
for black residents was 344 per 100,000 people,
compared to 144 for whites – a ratio of 2.4 to 1. By 2012
the arrest rate for black residents had risen to 636, while
the arrest rate for white residents had increased to 191 –
a ratio of 3.3 to 1.
This report is based primarily on data from the Federal
Bureau of Investigation’s Uniform Crime Reporting
(UCR) program. It documents the statewide increase in
marijuana arrests from 2003 to 2013, and provides
greater detail on marijuana arrests by race in the 50
jurisdictions (counties and cities) that account for 90%
of Virginia’s marijuana possession arrests.
State Level Marijuana Possession Arrests
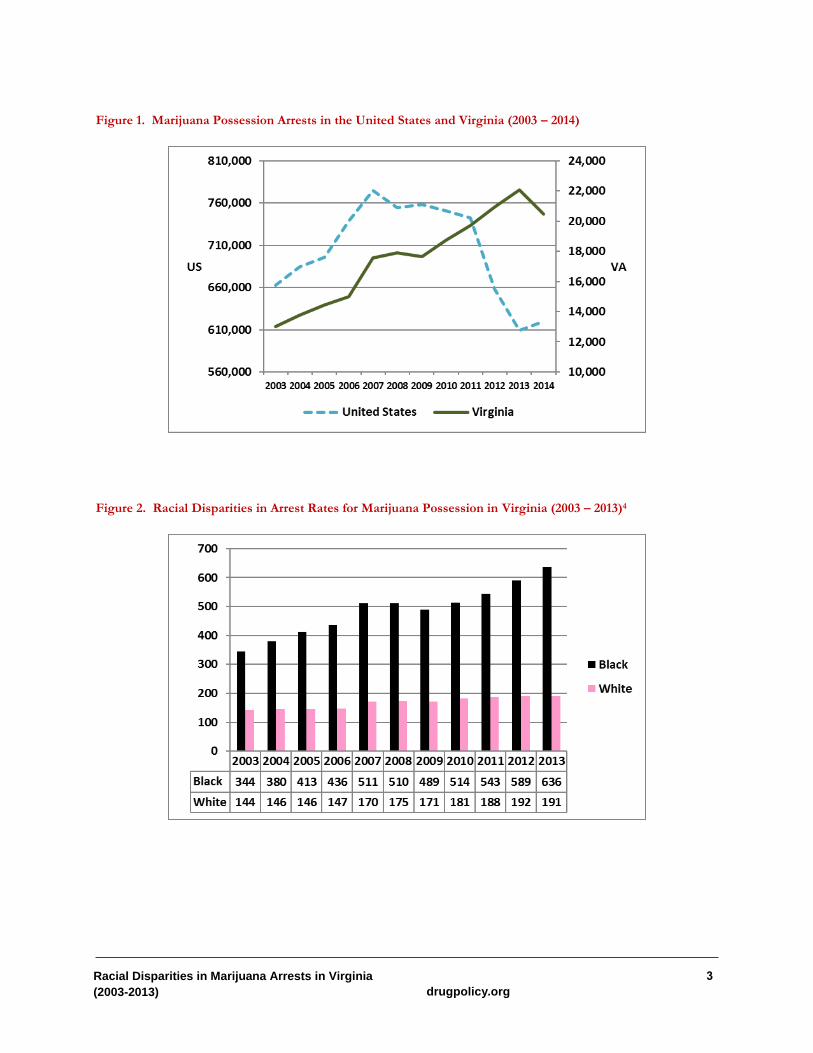
Marijuana possession arrests in Virginia increased from
13,032 in 2003 to 22,948 in 2014 – an increase of 76% --
according to data from the Uniform Crime Reporting
(UCR) Program1 and the Virginia State Police.2 National
marijuana possession arrests, by contrast, decreased by
6.5% from 2003 to 2014 (to about 660,000), but this
masks an overall change in arrests nationally
characterized by increasing arrests for five years
followed by six years of decline before increasing 1.7%
in 2014. From 2003 to 2008 national arrests increased by
13.8%, and in Virginia possession arrests increased by
37.4%, 2.7 times the national increase, from 13,032 to
17,905. From 2009 to 2013 national arrests decreased by
nearly 18.3% while Virginia’s marijuana possession
arrests continued to increase by 15.8%, from 17,635 to
20,461. (See Figure 1.) Between 2003 and 2014, the
arrest rate for marijuana possession arrests in Virginia
increased by 39%, from 176 to 246 per 100,000
population.
During the eleven-year period from 2003 to 2013,
arrests of black people in Virginia for marijuana
possession increased from 4,991 to 10,293 – a 106%
increase. By comparison, arrests of white people
increased by 44% during this period. One way to
measure racial disparities in marijuana possession arrests
is to compare a group’s percentage of arrests with their
percentage of the overall population. In 2003 black
Virginians comprised 39% of marijuana possession
arrests but only 20% of the state population. In 2013
black Virginians accounted for nearly half (47%) of
possession arrests but remained only 20% of the state
population.
The racial disparity in possession arrests in Virginia is
best demonstrated through a comparison of arrest rates
(per 100,000 people) for black and white residents. In
2003 the arrest rate for black residents for marijuana
possession in Virginia was 344 per 100,000, while for
white residents it was 144 per 100,000 – or a ratio of 2.4
to 1. By 20133 this disparity had grown, and the ratio of
arrest rates of black versus white residents grew as well –
to 3.3 to 1.
The arrest rate for marijuana possession for black
Virginians in 2013 has grown to 636 per 100,000 while
the arrest rate for white Virginians was 191 per 100,000.
The arrest rate for both groups has increased over this
eleven-year period, but the arrest rate for black residents
has grown at a faster pace. (See Figure 2.)
3 Racial Disparities in Marijuana Arrests in Virginia
(2003-2013)
drugpolicy.org
Figure 1. Marijuana Possession Arrests in the United States and Virginia (2003 – 2014)
Figure 2. Racial Disparities in Arrest Rates for Marijuana Possession in Virginia (2003 – 2013)4
4 Racial Disparities in Marijuana Arrests in Virginia
(2003-2013)
drugpolicy.org
The disparity in arrest rates for black and white residents
stands in stark contrast to survey data on the prevalence
of marijuana use in these demographic groups.
According to the National Survey on Drug Use and
Health (NSDUH) over the extended period from 2002
to 2009, marijuana was used on an annual basis by 11.3
percent of black respondents in Virginia compared to
9.1% of white respondents.5 While marijuana use among
black people was 24% greater than among white people,
this does not explain why arrest rates in 2013 were 233%
higher for black Virginians compared to white
Virginians.
Furthermore, marijuana remains easy or fairly easy to
acquire in Virginia. According to 2010/2011 data from
the National Survey on Drug Use and Health, 57.6% of
Virginians age 12 and older report that marijuana is easy
to obtain – including 76.3% of respondents age 18 to
25.6
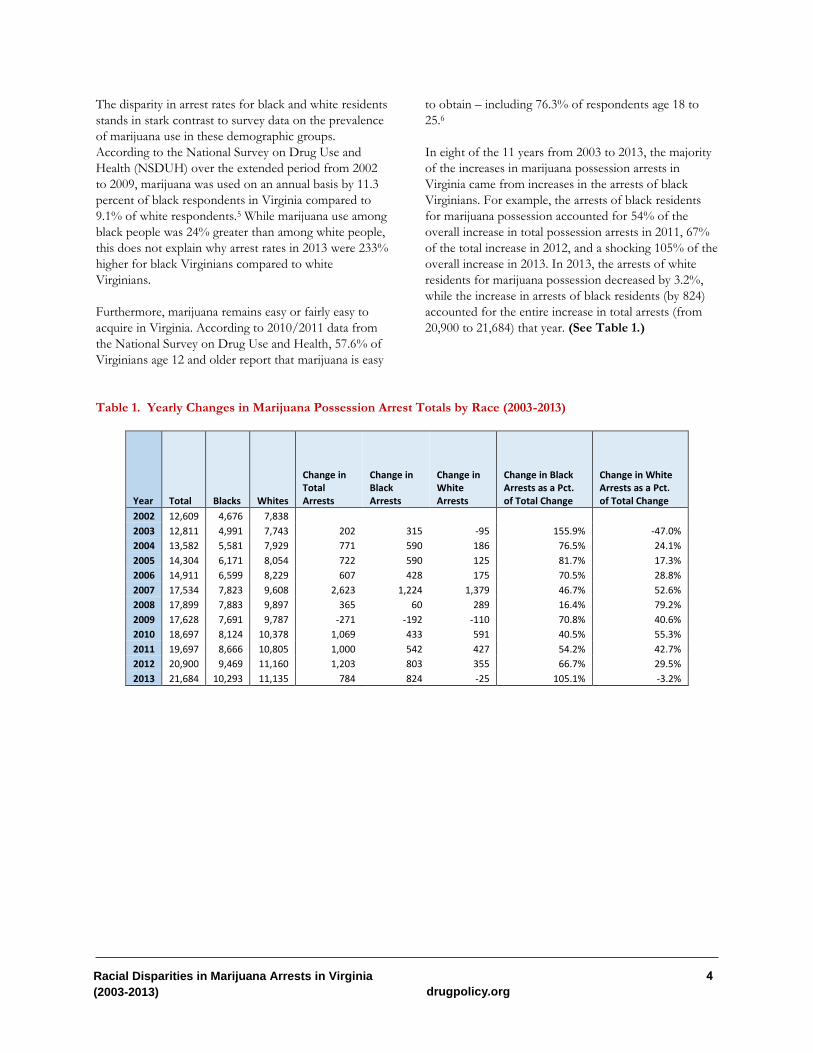
In eight of the 11 years from 2003 to 2013, the majority
of the increases in marijuana possession arrests in
Virginia came from increases in the arrests of black
Virginians. For example, the arrests of black residents
for marijuana possession accounted for 54% of the
overall increase in total possession arrests in 2011, 67%
of the total increase in 2012, and a shocking 105% of the
overall increase in 2013. In 2013, the arrests of white
residents for marijuana possession decreased by 3.2%,
while the increase in arrests of black residents (by 824)
accounted for the entire increase in total arrests (from
20,900 to 21,684) that year. (See Table 1.)
Table 1. Yearly Changes in Marijuana Possession Arrest Totals by Race (2003-2013)
Year Total Blacks Whites
Change in Total Arrests
Change in Black Arrests
Change in White Arrests
Change in Black Arrests as a Pct. of Total Change
Change in White Arrests as a Pct. of Total Change
2002 12,609 4,676 7,838
2003 12,811 4,991 7,743 202 315 -95 155.9% -47.0%
2004 13,582 5,581 7,929 771 590 186 76.5% 24.1%
2005 14,304 6,171 8,054 722 590 125 81.7% 17.3%
2006 14,911 6,599 8,229 607 428 175 70.5% 28.8%
2007 17,534 7,823 9,608 2,623 1,224 1,379 46.7% 52.6%
2008 17,899 7,883 9,897 365 60 289 16.4% 79.2%
2009 17,628 7,691 9,787 -271 -192 -110 70.8% 40.6%
2010 18,697 8,124 10,378 1,069 433 591 40.5% 55.3%
2011 19,697 8,666 10,805 1,000 542 427 54.2% 42.7%
2012 20,900 9,469 11,160 1,203 803 355 66.7% 29.5%
2013 21,684 10,293 11,135 784 824 -25 105.1% -3.2%
County and City Level Marijuana Possession
Arrests
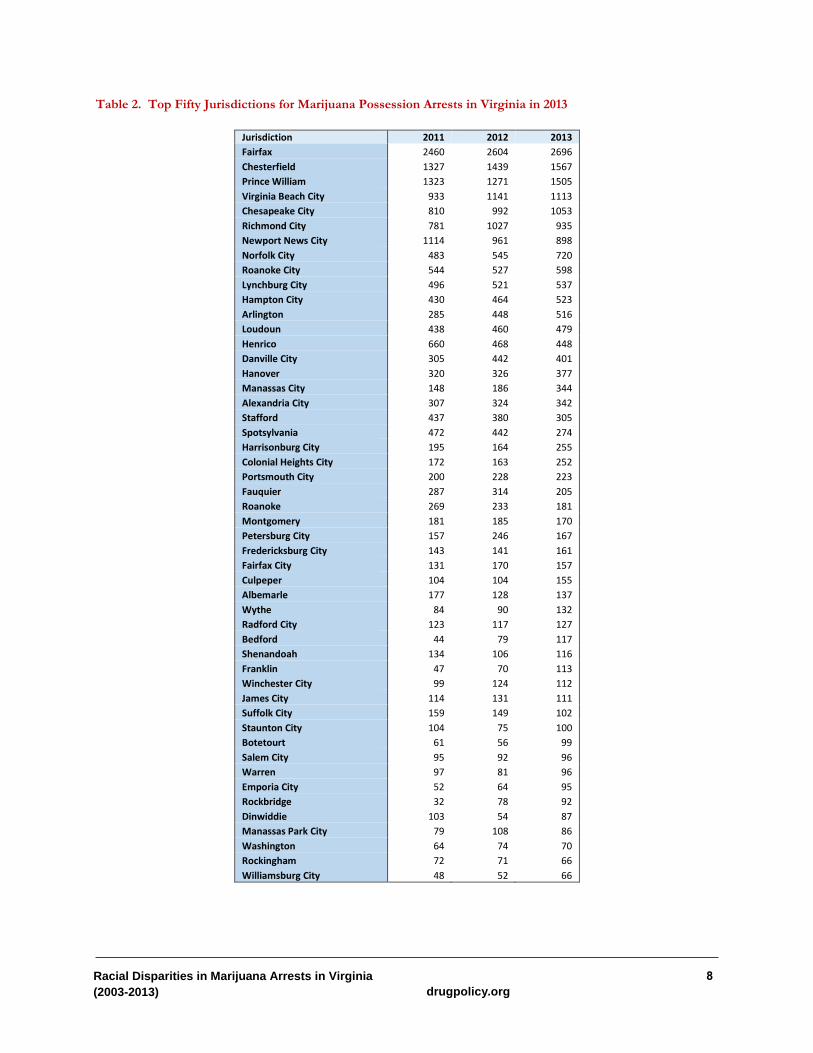
Fifty jurisdictions accounted for 90% of Virginia’s
marijuana possession arrests in 2013, and over half
(54%) took place in the counties of Fairfax, Chesterfield
and Prince William; and the cities of Virginia Beach,
Chesapeake, Richmond, Newport News, Norfolk,
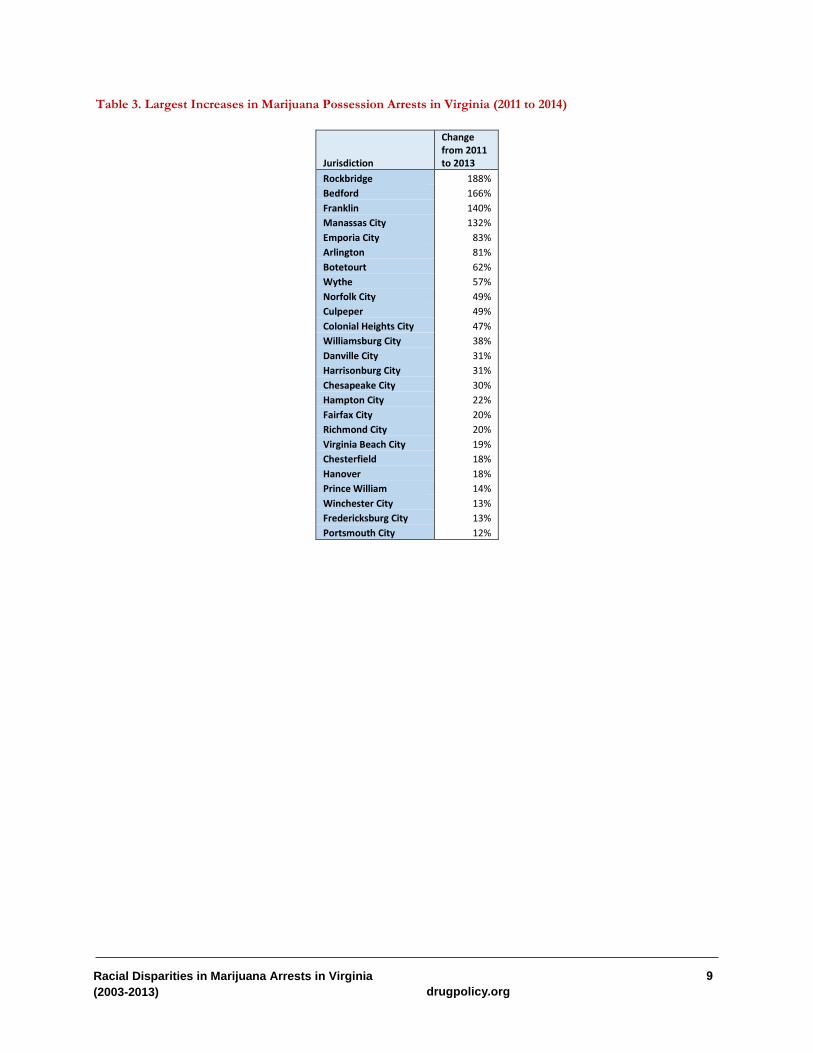
Roanoke and Lynchburg. (See Table 2.) The largest
increases in arrests over the most recent three years
(2011 to 2013) in these top fifty jurisdictions occurred in
Rockbridge (188%), Bedford (166%), Franklin (140%),
Manassas City (132%), Emporia City (83%), Arlington
(81%), Botetourt (62%, Wythe (57%), and Norfolk City
(49%). Also of note are increases in Danville (31%),
Chesapeake (30%), Richmond City (30%) and Virginia
Beach City (13%). (See Table 3.)
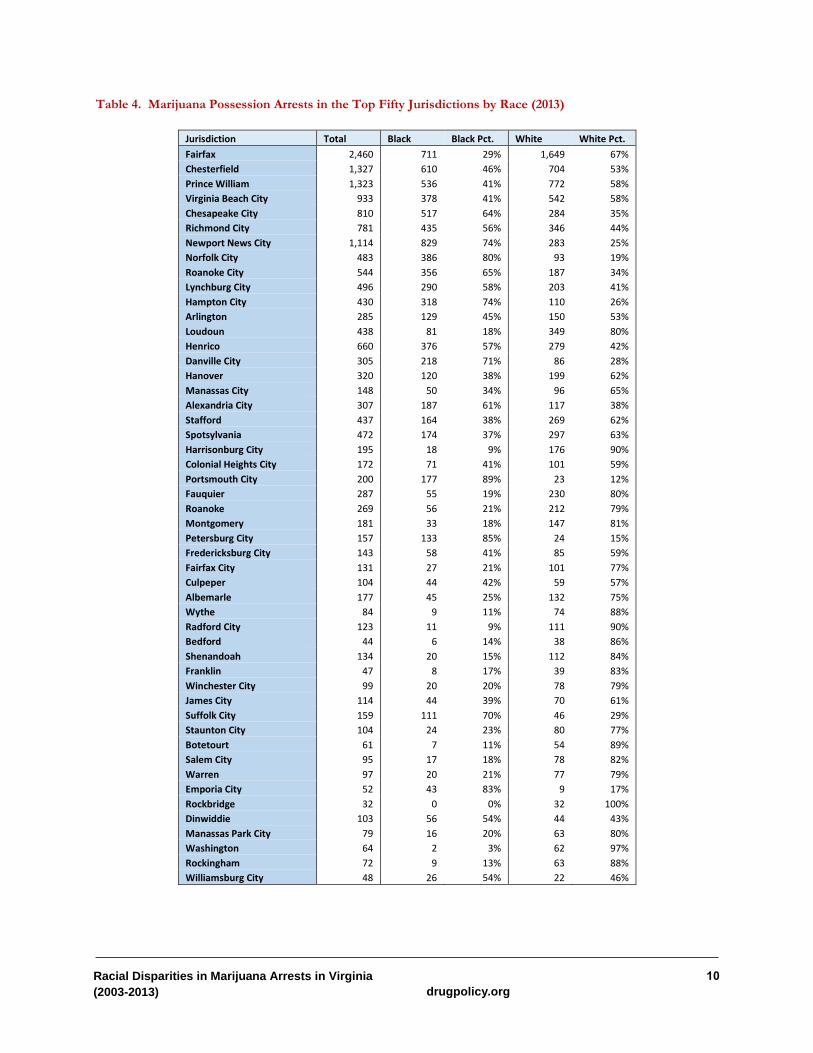
Marijuana possession arrests in the 50 jurisdictions with
the most arrests in 2013 are presented by race in Table 4.
Black residents accounted for more than 80% of all
marijuana possession arrests in the cities of Portsmouth
(89%), Petersburg (85%), Emporia (83%) and Norfolk
(80%). Black people accounted for 60% or more of all
marijuana possession arrests in the cities of Alexandria
(61%), Chesapeake (64%), Roanoke (65%), Suffolk
(70%), Danville (71%), Hampton (74%) and Newport
News (74%).
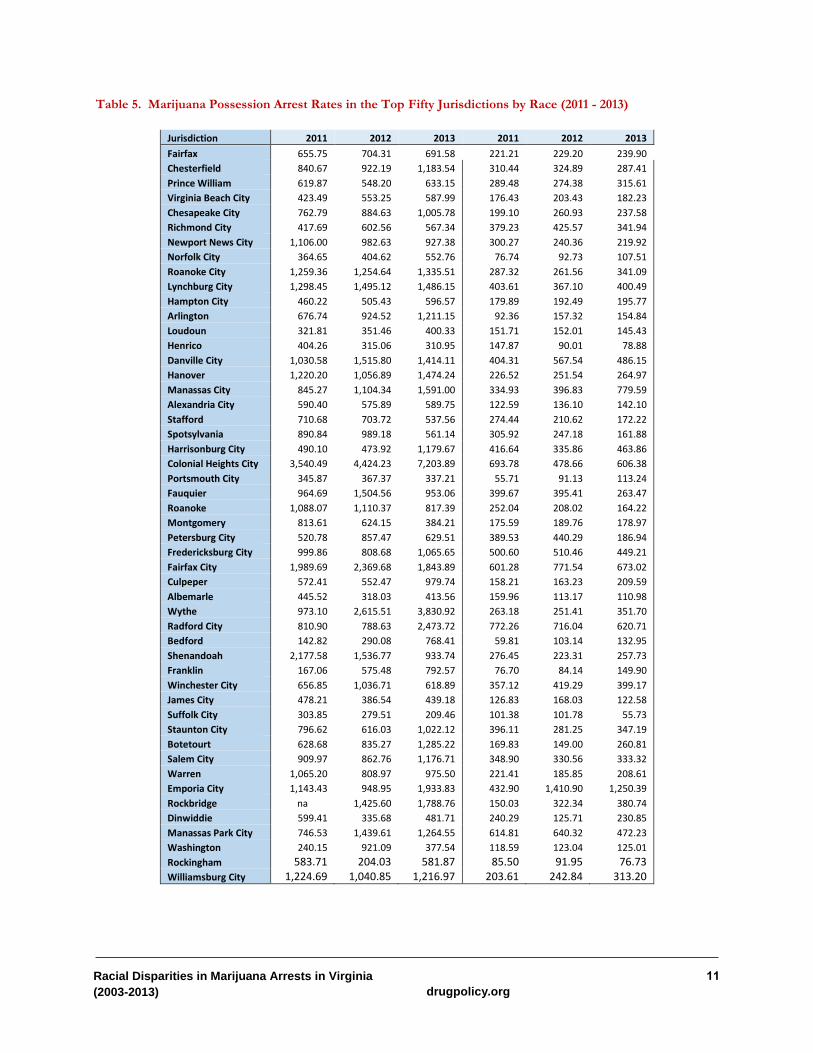
Marijuana possession arrests rates by race in these 50
jurisdictions are presented in Table 5. Overall, for all
areas and all races combined, the arrest rate for
marijuana possession in Virginia in 2013 was 267 per
100,000 population. However, the 21 jurisdictions with
the highest arrest rates for marijuana possession in 2013
had arrest rates of black people in excess of 1,000 per
100,000 black residents: Colonial Heights City (7,204),
Wythe County (3,831), Radford City (2,474), Emporia
City (1,944), Fairfax City (1,844), Rockbridge (1,879),
Manassas City (1,591), Lynchburg City (1,486), Hanover
(1,474), Danville City (1,414), Roanoke City (1,335),
Botetourt (1,285), Manassas Park City (1,264),
Williamsburg City (1,217), Arlington (1,211),
Chesterfield (1,183), Harrisonburg City (1,180), Salem
City (1,177), Fredericksburg City (1,066), Staunton City
(1,022) and Chesapeake City (1,006).
In some areas, such as Colonial Heights, large numbers
of traffic-stops of non-residents passing through the
area probably inflate the arrest rate, which is calculated
against the resident population. Aggressive enforcement
practices on interstate highways, such as I-95, probably
contribute to higher arrest rates than in jurisdictions
without significant arrests of non-residents. Seasonal
arrests of non-resident visitors in resort areas may also
contribute to high arrest rates for marijuana possession
in some areas (such as Virginia Beach). These factors
have probably affected arrest rates in Virginia and in the
rest of the United States and may explain why the
volume of arrests may be higher in some areas than
others. The disparity between arrest rates of black and
white people, though, is another matter.
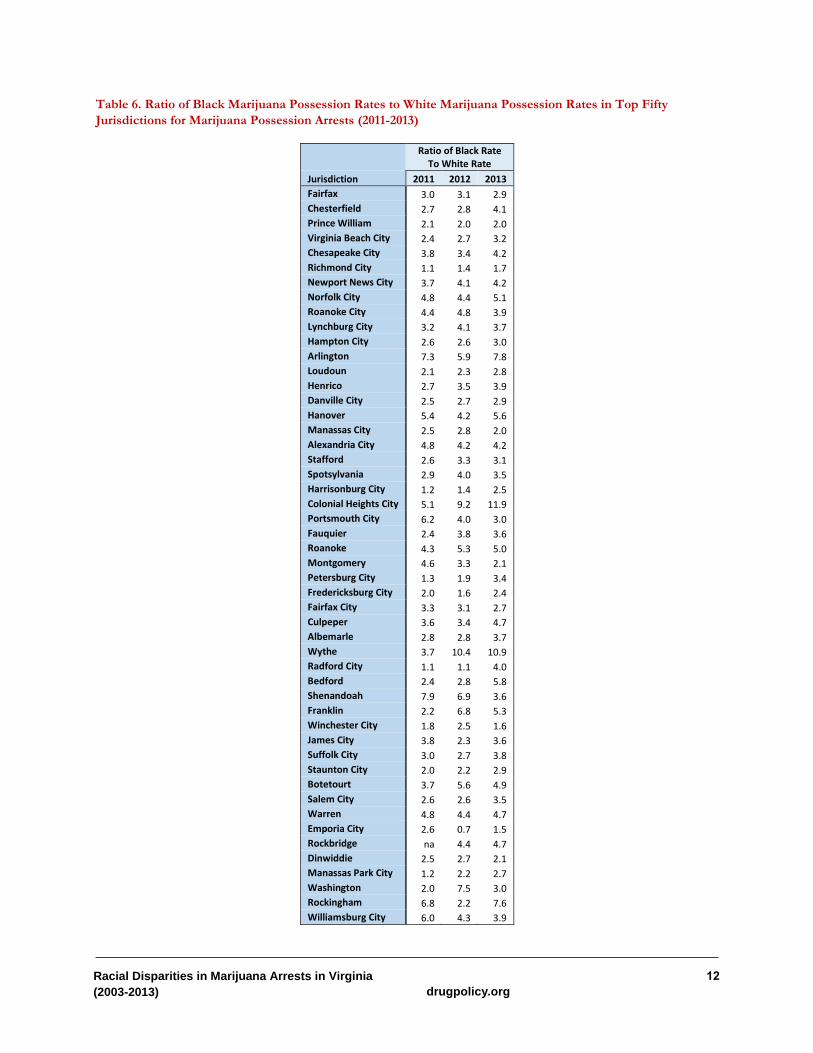
In 47 of the top 50 jurisdictions for marijuana
possession arrests, the arrest rate for black people is at
least twice that of white people. In 35 out of 50
jurisdictions, the arrest rate for black people is at least
three times that of white people; in 18 jurisdictions, the
arrest rate for black people is at least four times that of
white people; and in nine jurisdictions, the arrest rate is
at least five times greater for black people than white
people. The ratio of marijuana possession arrest rates of
black residents to white residents in Virginia for 2013
was greatest in Colonial Heights City (11.9), Wythe
County (10.9), Arlington County (7.8), Rockingham
(7.6), Bedford (5.8), Hanover (5.6), Franklin (5.3),
Norfolk City (5.1), Roanoke (5.0) and Botetourt (4.9).
(See Table 6.) Of the top 50 jurisdictions for marijuana
possession arrests, only three have ratios below 1.5: the
cities of Richmond (1.7), Winchester (1.6) and Emporia
(1.5).
Marijuana Law Violation Penalties
Under Virginia law, a person found in possession of marijuana can face up to 30 days in jail and up to a $500 fine. Subsequent marijuana possession convictions can be punished by up to twelve months in jail or a fine of up to $2,500. Virginia law does not currently provide any recourse to seal or expunge a marijuana law violation from a person’s criminal record, even in cases where a charge is later dismissed. A criminal record can become a major impediment to securing employment, financial loans, and other life essentials. Finally, a marijuana conviction can lead to a ban from public housing or denial of federal student aid for a period of a year or more.
6 Racial Disparities in Marijuana Arrests in Virginia
(2003-2013)
drugpolicy.org
Legislative History of Virginia’s Current Marijuana Laws7 The legislature enacted Virginia’s current marijuana laws in 1979. In its findings and recommendations, the panel of lawmakers considering the proposed legislation at that time recognized that marijuana was “widely used and pervasive among the citizens of Virginia, notwithstanding its possible harmful effects.” It further acknowledged that existing marijuana laws had failed, writing, “[L]egislation enacted to forbid the use of marijuana has drawn a large segment of Virginia's population within the criminal justice system without succeeding in deterring the expansion of marijuana use while substantially drawing upon the resources of the criminal justice system.” The intent of the proposed (and ultimately adopted) law was to recognize “the current state of knowledge concerning marijuana” and to direct “the greatest efforts of law enforcement agencies toward the commercial traffickers of the controlled substances presenting the greatest potential for harm both to the individual and to society and to the distributors of large quantities of marijuana.” In other words, the idea was to re-invest funds wasted on marijuana arrests to more important priorities such as large scale traffickers. In addition to the penalty structure now in place in state law, “the subcommittee decided that it would be appropriate to treat cultivation of marijuana for personal use differently than cultivation for distribution.” Specifically, personal-use cultivation would be treated the same way as personal-use possession: “persons who are cultivating marijuana for personal use would be chargeable with possession of marijuana.” The legislative history then quoted a CBS radio commentary by James J. Kilpatrick, a prominent Virginia journalist with a national reputation, who opined:
As a practical matter, it strikes me as just plain stupid to divert scarce police manpower to the senseless pastime of making marijuana busts.... it's absurd, as I see it, to squander police resources on 441,000 marijuana arrests [nationally] a year. These cases clog our courts. They leave a lasting stigma upon the young people who get arrested, and they are not useful as a deterrent.
The lawmakers’ key finding in 1979 was that “the goals of diverting police attention to the more serious drug offenses, relieving present pressure on the criminal justice system, and removing the potential for selective and possibly discriminatory application of the present potential 12 month jail sentence could be accomplished” through enactment of Virginia’s current laws on marijuana possession.
Discussion
Since 2007 marijuana possession arrests in Virginia have
been steadily increasing while nationally such arrests
have been on the decline. The basis for this statewide
trend has been increases in the arrests of black
Virginians.
Despite using marijuana at relatively similar rates as
white residents and comprising just 20% of the state
population, black Virginians were arrested in 2013 at 3.3
times the rate of white Virginians and accounted for
nearly half (47%) of all marijuana possession arrests.
The arrest rate for black residents for marijuana
possession has increased dramatically over the last 11
years, growing at a far higher rate than for white
residents. Over time, and particularly in the last three
years, changes in the total number of marijuana
possession arrests are wholly explained by annual
increases in the number of arrests of black Virginians.
Marijuana possession arrests have failed to reduce
marijuana use in Virginia, and it remains easy or fairly
easy to obtain for 76% of young adults between the ages
of 18 and 25. Black people are both a minority of the
state’s population and a minority of the state’s marijuana
users. Yet the enforcement of marijuana possession laws
in the state, while having no impact on overall use or
availability, has had a disproportionate impact on
Virginia’s black communities.
These trends contradict the general intent of the
legislature in enacting Virginia’s current marijuana
possession law. First, these statistics represent consistent
increases in the costs of marijuana arrests for both
individuals and the state. Second, the individual costs are
being disproportionately borne by the state’s minority
black population. Third, these trends have established a
discriminatory application of criminal sanctions when
the original intent was to diminish such impacts.
The conditions that led to the enactment of Virginia’s
current marijuana laws still exist today, three and a half
decades later. The policy goals of relieving pressure on
the criminal justice system and redirecting funds to more
important priorities continue to be thwarted by the
misguided enforcement policies in place throughout the
state. What was ill-advised in the late 1970s remains ill-
advised today.
Given the legislative intent behind Virginia’s current
marijuana laws, why has the number of arrests of black
Virginians for marijuana possession continued to
skyrocket? Has enforcement of the Commonwealth’s
marijuana laws, regardless of their intent, simply become
a pretext for arresting more of its black residents?
Whatever the intent or explanation behind these trends,
the costs and consequences are clear. The racial
disparities in the application of Virginia’s marijuana laws
are unacceptable and fundamentally question the
integrity and fairness of its criminal justice system.
8 Racial Disparities in Marijuana Arrests in Virginia
(2003-2013)
drugpolicy.org
Table 2. Top Fifty Jurisdictions for Marijuana Possession Arrests in Virginia in 2013
Jurisdiction 2011 2012 2013
Fairfax 2460 2604 2696
Chesterfield 1327 1439 1567
Prince William 1323 1271 1505
Virginia Beach City 933 1141 1113
Chesapeake City 810 992 1053
Richmond City 781 1027 935
Newport News City 1114 961 898
Norfolk City 483 545 720
Roanoke City 544 527 598
Lynchburg City 496 521 537
Hampton City 430 464 523
Arlington 285 448 516
Loudoun 438 460 479
Henrico 660 468 448
Danville City 305 442 401
Hanover 320 326 377
Manassas City 148 186 344
Alexandria City 307 324 342
Stafford 437 380 305
Spotsylvania 472 442 274
Harrisonburg City 195 164 255
Colonial Heights City 172 163 252
Portsmouth City 200 228 223
Fauquier 287 314 205
Roanoke 269 233 181
Montgomery 181 185 170
Petersburg City 157 246 167
Fredericksburg City 143 141 161
Fairfax City 131 170 157
Culpeper 104 104 155
Albemarle 177 128 137
Wythe 84 90 132
Radford City 123 117 127
Bedford 44 79 117
Shenandoah 134 106 116
Franklin 47 70 113
Winchester City 99 124 112
James City 114 131 111
Suffolk City 159 149 102
Staunton City 104 75 100
Botetourt 61 56 99
Salem City 95 92 96
Warren 97 81 96
Emporia City 52 64 95
Rockbridge 32 78 92
Dinwiddie 103 54 87
Manassas Park City 79 108 86
Washington 64 74 70
Rockingham 72 71 66
Williamsburg City 48 52 66
9 Racial Disparities in Marijuana Arrests in Virginia
(2003-2013)
drugpolicy.org
Table 3. Largest Increases in Marijuana Possession Arrests in Virginia (2011 to 2014)
Jurisdiction
Change from 2011 to 2013
Rockbridge 188%
Bedford 166%
Franklin 140%
Manassas City 132%
Emporia City 83%
Arlington 81%
Botetourt 62%
Wythe 57%
Norfolk City 49%
Culpeper 49%
Colonial Heights City 47%
Williamsburg City 38%
Danville City 31%
Harrisonburg City 31%
Chesapeake City 30%
Hampton City 22%
Fairfax City 20%
Richmond City 20%
Virginia Beach City 19%
Chesterfield 18%
Hanover 18%
Prince William 14%
Winchester City 13%
Fredericksburg City 13%
Portsmouth City 12%
10 Racial Disparities in Marijuana Arrests in Virginia
(2003-2013)
drugpolicy.org
Table 4. Marijuana Possession Arrests in the Top Fifty Jurisdictions by Race (2013)
Jurisdiction Total Black Black Pct. White White Pct.
Fairfax 2,460 711 29% 1,649 67%
Chesterfield 1,327 610 46% 704 53%
Prince William 1,323 536 41% 772 58%
Virginia Beach City 933 378 41% 542 58%
Chesapeake City 810 517 64% 284 35%
Richmond City 781 435 56% 346 44%
Newport News City 1,114 829 74% 283 25%
Norfolk City 483 386 80% 93 19%
Roanoke City 544 356 65% 187 34%
Lynchburg City 496 290 58% 203 41%
Hampton City 430 318 74% 110 26%
Arlington 285 129 45% 150 53%
Loudoun 438 81 18% 349 80%
Henrico 660 376 57% 279 42%
Danville City 305 218 71% 86 28%
Hanover 320 120 38% 199 62%
Manassas City 148 50 34% 96 65%
Alexandria City 307 187 61% 117 38%
Stafford 437 164 38% 269 62%
Spotsylvania 472 174 37% 297 63%
Harrisonburg City 195 18 9% 176 90%
Colonial Heights City 172 71 41% 101 59%
Portsmouth City 200 177 89% 23 12%
Fauquier 287 55 19% 230 80%
Roanoke 269 56 21% 212 79%
Montgomery 181 33 18% 147 81%
Petersburg City 157 133 85% 24 15%
Fredericksburg City 143 58 41% 85 59%
Fairfax City 131 27 21% 101 77%
Culpeper 104 44 42% 59 57%
Albemarle 177 45 25% 132 75%
Wythe 84 9 11% 74 88%
Radford City 123 11 9% 111 90%
Bedford 44 6 14% 38 86%
Shenandoah 134 20 15% 112 84%
Franklin 47 8 17% 39 83%
Winchester City 99 20 20% 78 79%
James City 114 44 39% 70 61%
Suffolk City 159 111 70% 46 29%
Staunton City 104 24 23% 80 77%
Botetourt 61 7 11% 54 89%
Salem City 95 17 18% 78 82%
Warren 97 20 21% 77 79%
Emporia City 52 43 83% 9 17%
Rockbridge 32 0 0% 32 100%
Dinwiddie 103 56 54% 44 43%
Manassas Park City 79 16 20% 63 80%
Washington 64 2 3% 62 97%
Rockingham 72 9 13% 63 88%
Williamsburg City 48 26 54% 22 46%
11 Racial Disparities in Marijuana Arrests in Virginia
(2003-2013)
drugpolicy.org
Table 5. Marijuana Possession Arrest Rates in the Top Fifty Jurisdictions by Race (2011 - 2013)
Jurisdiction 2011 2012 2013 2011 2012 2013
Fairfax 655.75 704.31 691.58 221.21 229.20 239.90
Chesterfield 840.67 922.19 1,183.54 310.44 324.89 287.41
Prince William 619.87 548.20 633.15 289.48 274.38 315.61
Virginia Beach City 423.49 553.25 587.99 176.43 203.43 182.23
Chesapeake City 762.79 884.63 1,005.78 199.10 260.93 237.58
Richmond City 417.69 602.56 567.34 379.23 425.57 341.94
Newport News City 1,106.00 982.63 927.38 300.27 240.36 219.92
Norfolk City 364.65 404.62 552.76 76.74 92.73 107.51
Roanoke City 1,259.36 1,254.64 1,335.51 287.32 261.56 341.09
Lynchburg City 1,298.45 1,495.12 1,486.15 403.61 367.10 400.49
Hampton City 460.22 505.43 596.57 179.89 192.49 195.77
Arlington 676.74 924.52 1,211.15 92.36 157.32 154.84
Loudoun 321.81 351.46 400.33 151.71 152.01 145.43
Henrico 404.26 315.06 310.95 147.87 90.01 78.88
Danville City 1,030.58 1,515.80 1,414.11 404.31 567.54 486.15
Hanover 1,220.20 1,056.89 1,474.24 226.52 251.54 264.97
Manassas City 845.27 1,104.34 1,591.00 334.93 396.83 779.59
Alexandria City 590.40 575.89 589.75 122.59 136.10 142.10
Stafford 710.68 703.72 537.56 274.44 210.62 172.22
Spotsylvania 890.84 989.18 561.14 305.92 247.18 161.88
Harrisonburg City 490.10 473.92 1,179.67 416.64 335.86 463.86
Colonial Heights City 3,540.49 4,424.23 7,203.89 693.78 478.66 606.38
Portsmouth City 345.87 367.37 337.21 55.71 91.13 113.24
Fauquier 964.69 1,504.56 953.06 399.67 395.41 263.47
Roanoke 1,088.07 1,110.37 817.39 252.04 208.02 164.22
Montgomery 813.61 624.15 384.21 175.59 189.76 178.97
Petersburg City 520.78 857.47 629.51 389.53 440.29 186.94
Fredericksburg City 999.86 808.68 1,065.65 500.60 510.46 449.21
Fairfax City 1,989.69 2,369.68 1,843.89 601.28 771.54 673.02
Culpeper 572.41 552.47 979.74 158.21 163.23 209.59
Albemarle 445.52 318.03 413.56 159.96 113.17 110.98
Wythe 973.10 2,615.51 3,830.92 263.18 251.41 351.70
Radford City 810.90 788.63 2,473.72 772.26 716.04 620.71
Bedford 142.82 290.08 768.41 59.81 103.14 132.95
Shenandoah 2,177.58 1,536.77 933.74 276.45 223.31 257.73
Franklin 167.06 575.48 792.57 76.70 84.14 149.90
Winchester City 656.85 1,036.71 618.89 357.12 419.29 399.17
James City 478.21 386.54 439.18 126.83 168.03 122.58
Suffolk City 303.85 279.51 209.46 101.38 101.78 55.73
Staunton City 796.62 616.03 1,022.12 396.11 281.25 347.19
Botetourt 628.68 835.27 1,285.22 169.83 149.00 260.81
Salem City 909.97 862.76 1,176.71 348.90 330.56 333.32
Warren 1,065.20 808.97 975.50 221.41 185.85 208.61
Emporia City 1,143.43 948.95 1,933.83 432.90 1,410.90 1,250.39
Rockbridge na 1,425.60 1,788.76 150.03 322.34 380.74
Dinwiddie 599.41 335.68 481.71 240.29 125.71 230.85
Manassas Park City 746.53 1,439.61 1,264.55 614.81 640.32 472.23
Washington 240.15 921.09 377.54 118.59 123.04 125.01
Rockingham 583.71 204.03 581.87 85.50 91.95 76.73
Williamsburg City 1,224.69 1,040.85 1,216.97 203.61 242.84 313.20
12 Racial Disparities in Marijuana Arrests in Virginia
(2003-2013)
drugpolicy.org
Table 6. Ratio of Black Marijuana Possession Rates to White Marijuana Possession Rates in Top Fifty
Jurisdictions for Marijuana Possession Arrests (2011-2013)
Ratio of Black Rate
To White Rate
Jurisdiction 2011 2012 2013
Fairfax 3.0 3.1 2.9
Chesterfield 2.7 2.8 4.1
Prince William 2.1 2.0 2.0
Virginia Beach City 2.4 2.7 3.2
Chesapeake City 3.8 3.4 4.2
Richmond City 1.1 1.4 1.7
Newport News City 3.7 4.1 4.2
Norfolk City 4.8 4.4 5.1
Roanoke City 4.4 4.8 3.9
Lynchburg City 3.2 4.1 3.7
Hampton City 2.6 2.6 3.0
Arlington 7.3 5.9 7.8
Loudoun 2.1 2.3 2.8
Henrico 2.7 3.5 3.9
Danville City 2.5 2.7 2.9
Hanover 5.4 4.2 5.6
Manassas City 2.5 2.8 2.0
Alexandria City 4.8 4.2 4.2
Stafford 2.6 3.3 3.1
Spotsylvania 2.9 4.0 3.5
Harrisonburg City 1.2 1.4 2.5
Colonial Heights City 5.1 9.2 11.9
Portsmouth City 6.2 4.0 3.0
Fauquier 2.4 3.8 3.6
Roanoke 4.3 5.3 5.0
Montgomery 4.6 3.3 2.1
Petersburg City 1.3 1.9 3.4
Fredericksburg City 2.0 1.6 2.4
Fairfax City 3.3 3.1 2.7
Culpeper 3.6 3.4 4.7
Albemarle 2.8 2.8 3.7
Wythe 3.7 10.4 10.9
Radford City 1.1 1.1 4.0
Bedford 2.4 2.8 5.8
Shenandoah 7.9 6.9 3.6
Franklin 2.2 6.8 5.3
Winchester City 1.8 2.5 1.6
James City 3.8 2.3 3.6
Suffolk City 3.0 2.7 3.8
Staunton City 2.0 2.2 2.9
Botetourt 3.7 5.6 4.9
Salem City 2.6 2.6 3.5
Warren 4.8 4.4 4.7
Emporia City 2.6 0.7 1.5
Rockbridge na 4.4 4.7
Dinwiddie 2.5 2.7 2.1
Manassas Park City 1.2 2.2 2.7
Washington 2.0 7.5 3.0
Rockingham 6.8 2.2 7.6
Williamsburg City 6.0 4.3 3.9
13 Racial Disparities in Marijuana Arrests in Virginia
(2003-2013)
drugpolicy.org
Endnotes
1 The Uniform Crime Reporting (UCR) Program is maintained by the Federal Bureau of Investigation (FBI) based on data reported by local police agencies, usually by way of state police agencies. There are two data sets, the County-level data set and an additional one that provides detailed data on the age, sex and race of arrestees. These two data sets provide similar but not exact data for Virginia. Except where noted arrest counts and arrest rates by race were calculated from the age/sex/race (ASR) dataset, which is the most recent at this time.
2 The state totals for Marijuana Possession Arrests for 2013 and 2014 are derived from the total number of marijuana arrests reported by the Virginia State Police in “Crime in Virginia” for these years. The number of possession arrests have been estimated on a percentage basis. From 2002 through 2012 marijuana possession arrests in Virginia were, on average, 89.16% of all marijuana arrests. The possession totals for 2013 and 2014 were estimated by applying that percentage to the total number of marijuana arrests reported by the Virginia State Police. While the ASR dataset provides a total count for 2013 arrests, this estimation procedure has been used for both 2013 and 2014 for consistency’s sake (as ASR data for 2014 is not yet available.) The 2013 total for possession arrests from the ASR data set
is 21,684 (1.8% less than the 22,090 estimate derived from the State Police report).
3 As of mid-October, 2015, the most recent Uniform Crime Reporting data on the race of people arrested for marijuana possession are for the year 2013.
4 Arrest rates are expressed per 100,000 population. 5 United States Department of Health and Human Services. Substance
Abuse and Mental Health Services Administration. Center for Behavioral Health Statistics and Quality. National Survey on Drug Use and Health: 8-Year R-DAS (2002 to 2009).
6 United States Department of Health and Human Services. Substance Abuse and Mental Health Services Administration. Center for Behavioral Health Statistics and Quality. National Survey on Drug Use and Health, 2010/2011.
7 Report of the Joint Subcommittee of the Courts of Justice Committees of the Senate and House of Delegates Studying the Possible Need for a Revision of Virginia's Marijuana Laws to the Courts of Justice Committees of the Senate and House of Delegates. Senate Document No. 16. December, 1978.