Embed Size (px)
Citation preview
1
Racial Inequality in Brazil from Independence to Present†
Justin R. Bucciferro‡
Eastern Washington University
April 2015
Abstract
Brazil has made major strides towards equality among races, yet large disparities
remain. This article examines the history of racial inequality since independence
(1822), a period encompassing the abolition of slavery (1888). The social
construction of race and its historiography are examined, and trends in the relative
outcomes – including life expectancy, literacy, primary school completion,
income, and occupation – of Afro-Brazilian, white, Asian, and Indigenous people
are identified. There has been major progress in terms of literacy, education,
health and employment-opportunity since the end of slavery, but there were
reversals along the way. Improved racial equality along these dimensions did not,
unfortunately, directly translate into equality of income. Only in the past decade
has the black-white income gap fallen below its 1960 level, although preliminary
figures for the late 19th
and early 20th
century suggest it is at its lowest point ever.
Many scholars have investigated race in Brazil, yet time-series on racial outcomes
have typically not extended beyond the term of a few decades.
Keywords: Race, Inequality, Brazil, Discrimination, Abolition, Slavery
† The author appreciates the comments of participants at the Latin American Inequality in the Long Run Conference
(Buenos Aires, 12/2014), particularly organizers Jeff Williamson and Luis Bértola, and thanks Renato Araujo da
Silva and staff at the Museo Afro Brasil (São Paulo), periodical attendants at the Arquivo Público do Estado de São
Paulo, and the Instituto Brasileiro de Geografia e Estatística (IBGE) for assistance in locating source materials. ‡ Department of Economics, 311 Patterson Hall, Cheney, Washington 99004, U.S.A.; [email protected]
2
I. Introduction
There is a broad effort to reduce racial inequality in Brazil and, over the past decade-or-
two, it appears to have been successful. Affirmative action was introduced under the Secretary
of State for Human Rights in 2002, for example, and a new Secretary of Policy for the Promotion
of Racial Equality was established in 2003. Disparities between races – formally defined as
black (preto), white (branco), mixed-race (pardo), Asian (amarelo), and Indigenous (indígena) –
have declined in terms of literacy (Paixão et al., 2010), level-of-schooling (Marteleto, 2012), and
employment and earnings (ILO, 2007). Is this recent experience part of a larger trend?
This work considers the history of racial inequality in Brazil from independence (1822)
to present. It addresses the social construction of race, which originates with slavery itself, and
reviews the associated literature, dating to the late nineteenth century. The relative well-being of
Afro-Brazilians (pardos or pretos) and whites is described across major historical periods – the
Imperial Era (1822-1889), First Republic (1889-1930), Vargas Era (1930-1945), Second
Republic (1946-1964), Military Rule (1964-1985), and Return to Democracy (1985 to present) –
and new time-series are presented for all races on life expectancy, literacy, primary school
completion, average years of schooling, average monthly income, and occupation by sector.
The racial makeup of Brazil, according to national census data from 1872 to 2010, is
illustrated in Figure I. Race was not recorded in the 1920 census, but between 1890 and 1940
there is a clear increase in the share of the population considered white, and decrease in the
proportion of pardos (literally ‘browns’); the black population is about constant in relative terms.
After 1940, when the percentage share of the white population peaked, the Asian/Indigenous
minority becomes visible and the representation of black and mixed-race individuals grows: the
Afro-Brazilian population is a majority as of 2010, as it was during the 19th
century.
3
0%
10%
20%
30%
40%
50%
60%
70%
80%
90%
100%
187
2
188
0
189
0
190
0
191
0
192
0
193
0
194
0
195
0
196
0
197
0
198
0
199
1
200
0
201
0
Ra
cia
l M
ak
eup
Year
Figure I. The Racial Composition of Brazil, 1872-2010
Indígena,
Amarela,
or Other
Parda
Preta
Branca
Source: Instituto Brasileiro de Geografia e Estatística (IBGE), “Tendências demográficas: uma análise dos
resultados da amostra do censo demográfico 2000,” Rio de Janeiro: IBGE, 2004, p. 25-26, and 2010
Demographic Census.
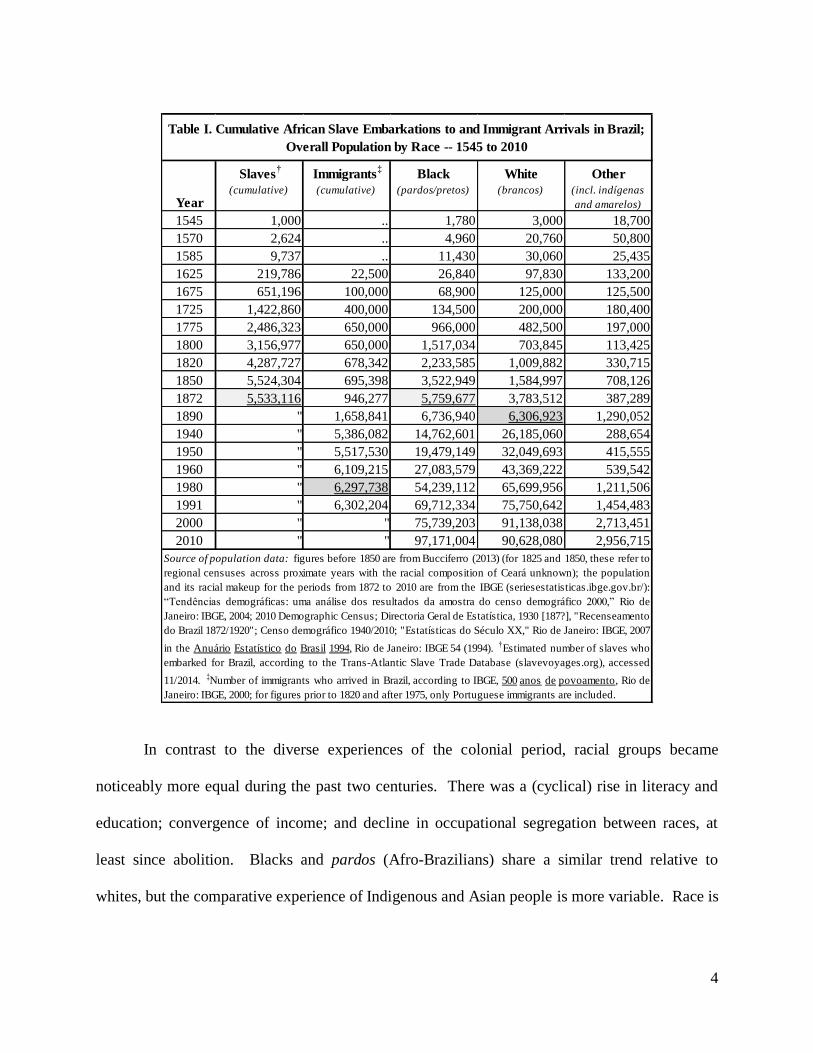
The relative size of Afro-Brazilian and white populations is a rough indicator of
inequality because similar numbers of African slaves and European immigrants came to Brazil –
what better measure of long-run adaptive success is there than a group’s ability to survive?
Consider the cumulative number of slaves imported up until each period and, separately, the
cumulative number of immigrant arrivals (Table I): the size of the ‘flow’ versus the ‘stock’ gives
a crude sense of the fate of each group.
An estimated 5.5 million African slaves were shipped to Brazil (4.9 million disembarked)
over three centuries of the international trade, relatively close to the population of 5.8 million
“blacks” in 1872. This situation could correspond to zero natural increase; however, ample
evidence of positive increase among the free black population during the 18th
century suggests an
offsetting negative growth among slaves. The white population increased six-fold between 1820
and 1890, to six million, yet fewer than two million immigrants had arrived until that time. The
flow of immigrants only reached the volume of the slave trade in 1950, at which point the white
population numbered over 32 million.
4
Slaves†
Immigrants‡
Black White Other
Year(cumulative) (cumulative) (pardos/pretos) (brancos) (incl. indígenas
and amarelos)
1545 1,000 .. 1,780 3,000 18,700
1570 2,624 .. 4,960 20,760 50,800
1585 9,737 .. 11,430 30,060 25,435
1625 219,786 22,500 26,840 97,830 133,200
1675 651,196 100,000 68,900 125,000 125,500
1725 1,422,860 400,000 134,500 200,000 180,400
1775 2,486,323 650,000 966,000 482,500 197,000
1800 3,156,977 650,000 1,517,034 703,845 113,425
1820 4,287,727 678,342 2,233,585 1,009,882 330,715
1850 5,524,304 695,398 3,522,949 1,584,997 708,126
1872 5,533,116 946,277 5,759,677 3,783,512 387,289
1890 " 1,658,841 6,736,940 6,306,923 1,290,052
1940 " 5,386,082 14,762,601 26,185,060 288,654
1950 " 5,517,530 19,479,149 32,049,693 415,555
1960 " 6,109,215 27,083,579 43,369,222 539,542
1980 " 6,297,738 54,239,112 65,699,956 1,211,506
1991 " 6,302,204 69,712,334 75,750,642 1,454,483
2000 " " 75,739,203 91,138,038 2,713,451
2010 " " 97,171,004 90,628,080 2,956,715
Source of population data: figures before 1850 are from Bucciferro (2013) (for 1825 and 1850, these refer to
regional censuses across proximate years with the racial composition of Ceará unknown); the population
and its racial makeup for the periods from 1872 to 2010 are from the IBGE (seriesestatisticas.ibge.gov.br/):
“Tendências demográficas: uma análise dos resultados da amostra do censo demográfico 2000,” Rio de
Janeiro: IBGE, 2004; 2010 Demographic Census; Directoria Geral de Estatística, 1930 [187?], "Recenseamento
do Brazil 1872/1920"; Censo demográfico 1940/2010; "Estatísticas do Século XX," Rio de Janeiro: IBGE, 2007
in the Anuário Estatístico do Brasil 1994, Rio de Janeiro: IBGE 54 (1994).†Estimated number of slaves who
embarked for Brazil, according to the Trans-Atlantic Slave Trade Database (slavevoyages.org), accessed
11/2014.‡Number of immigrants who arrived in Brazil, according to IBGE, 500 anos de povoamento, Rio de
Janeiro: IBGE, 2000; for figures prior to 1820 and after 1975, only Portuguese immigrants are included.
Table I. Cumulative African Slave Embarkations to and Immigrant Arrivals in Brazil;
Overall Population by Race -- 1545 to 2010
In contrast to the diverse experiences of the colonial period, racial groups became
noticeably more equal during the past two centuries. There was a (cyclical) rise in literacy and
education; convergence of income; and decline in occupational segregation between races, at
least since abolition. Blacks and pardos (Afro-Brazilians) share a similar trend relative to
whites, but the comparative experience of Indigenous and Asian people is more variable. Race is
5
an important aspect of inequality and, although the literature is large, there is a dearth of research
which describes long-run trends in relative well-being, especially at the national level.
II. Conceptualizations of Race
A “race” is defined as a group of people with a common ancestry, or sharing certain
physical markers such as skin tone, hair texture, facial features, etc. Such traits may not
necessarily be indicative of one’s genetic origins, though, particularly within the demographic
milieu that is the New World. Regardless, there is no biological basis for classifying humans
into racial groups, and the (untestable) postulate must therefore be accepted that no so-called
race is inherently inferior to another.
If race is an arbitrary concept, why is it so powerful in explaining relative outcomes?
Race – “a socially constructed mode of human categorization,” (Loury, 2002; p. 5) – is imbued
with meaning upon which individuals act, for which very reason it retains its currency. If a
group is stereotyped as being inexperienced, for instance, people within this group may receive
fewer job offers and, indeed, come to have less experience. In this section, I describe the origins
of ‘race’, the changing social meanings which have been attributed to groups in Brazil, and the
historiography of race in Brazil from the early twentieth century to present.
Prior to the 15th
century, when slave production was introduced on the Atlantic islands
and the ‘New World’ was revealed to Europeans, the nature of slavery was quite different: one’s
status as a slave was less-directly related to his race or ethnicity, and slaves had a greater
possibility of someday integrating into society as freemen (Klein, 2010). In the colonies of the
Americas, the scale and harshness of slavery were unprecedented: over 10 million African slaves
survived the middle passage over the course of the traffic (Trans-Atlantic Slave Trade Database),
6
many of whom spent the remainder of their lives producing sugar, coffee, cotton, and other
commodities. The system required justification, an underlying ideology which could ensure its
continuation amidst acute inequality, hence the invention of race.
The differential status of Europeans, Natives or “Indians,” and Africans in the New
World was institutionalized by both church and state. The legacy of 15th
-century Inquisition
thinking was that Indians possessed as soul whereas Africans did not; in response to the rapid
decline of Native populations during colonization, the Spanish and Portuguese crowns prohibited
their (unjust) enslavement in the 1540s. The result was an increasing reliance on African slaves:
in Brazil, the workforce on coastal plantations came to be predominantly African by the
beginning of the following century (Klein and Luna, 2010).
The Portuguese who settled colonial Brazil were predominantly men (as were two thirds
of African slaves), and had children of mixed Indigenous, African, and European ancestry.
According to Ribeiro (1995), the children of Europeans and Indians (mamelucos or mestiços),
and Africans (mulattos) were prototypical of a new unified people: Brazilians. The importance
of racial markers, however, indicates a lesser degree of assimilation than Ribeiro implies;
nonetheless, race is a qualitatively different concept in Brazil than in other countries.
Gilberto Freyre (Casa-Grande e Senzala, 1933) emphasized the tradition of
miscegenation established by the Portuguese as opposed to the antagonisms of Anglo-Saxon
colonization – the idea that Brazil is a “racial democracy” is commonly attributed to Freyre and
this work (Cardoso, 2013). Roger Bastide and Florestan Fernandes (1959) counterpoised the
notion of ‘racial democracy’ – that racial relations were fluid – in demonstrating the extent of
racial prejudice and barriers to social mobility for people of African descent in urban São Paulo.
Fernandes (1965) documents the relegation of blacks and mulattos to low-status occupations and
7
the prevailing anomie among these communities – all of which he interprets as a historical
legacy of slavery.
The current classifications of race in Brazil can be traced to at least the eighteenth
century: In 1776, Portugal issued a circular which ordered a census to include counts by age and
sex; although not required, some governors decided to collect racial information as well (Alden,
1963). The population was classified into three or four racial groups: brancos (whites), pardos
(literally ‘browns’; mulattos), pretos (‘blacks’; Negroes), and indios (Christian Indians). In
subsequent regional censuses, alternative terms like caboclo (Indian or mestiço) have been used,
always omitting un-contacted aboriginals.
Beginning with the first national census of 1872 and continuing through the most recent
decennial censuses, the same general racial categories have been employed – branco, pardo,
preto, and índigena – as well as amarelo (literally ‘yellow’ or Asian); however, race was not
included in the 1920 or 1970 censuses, and “Indian” was not included as a category in the 1940
census. Two direct questions emerge: Is such a broad color-based classification meaningful?
Does it correspond to the social construction of race as internalized by individuals?
The separate category mestiço, of mixed Indian and European descent, is not included in
the census, therefore such individuals may classify as either pardo or branco. Furthermore,
individuals of mixed African and European descent may also be classified as pardo or branco,
hence such outmoded terms as branco da terra (light-skinned mestiço) and branco da bahia
(light-skinned mulato). Individuals within each group of the black-brown-white trichotomy are
invariably of mixed descent, which belies the biological determinism associated with race.
Scholars have generally considered racial disparities in terms of a white/non-white or
white/brown/black categorization, but its validity has been questioned by Harris et al. (1993)
8
and, recently, Silva and Leão (2012): the former study involves an experiment which indicates a
substantially different racial distribution depending on whether the official term (parda) or
vernacular term (morena) is used to refer to the mixed-race population; the latter cites wide
variation in the size of the black population depending on how it is defined, as well as a differing
perception of race and discrimination amongst pardos. These results are consistent with Bailey,
Loveman, and Muniz (2013), who show that alternative combinations of racial sub-categories
could result in Brazil having either a white or black majority.
The potential drawbacks of the current configuration have not been overlooked, however.
In the 1976 household survey, individuals were asked both an open-ended question on race and
one with the four standard options (branca, parda, preta, or amarela): just six racial categories –
including branca, parda, and preta, as well as morena, morena-clara, and clara – encompassed
94% of respondents (Wood and Carvalho, 1994). Although morena was as common a response
in the open question as was parda in the structured one (34% of respondents in each instance), its
usage is perhaps too general to function as a census category (Telles, 1995).1
Racial identity may be fungible, but the schemas employed in Brazil nonetheless
correspond to real social divisions, shaped by ancestry as well as class: the progressive
‘whitening’ of the population was a result of racial mixing and the higher fertility/lower
mortality of whites, not only the implicit incentive for pretos and pardos to self-select as pardos
and brancos (Ribeiro, 1995). Although the current categories of race are oversimplified, they
reflect the heritage of Brazilian people and are preferable to a simple white/non-white dichotomy
which groups together Indigenous, African, and Asian elements.
1 A similar survey was conducted by the newspaper Folia de São Paulo in 1995 that produced consistent results;
also, interviewers recorded what they perceived as the person’s race and found that people of higher socio-economic
status were more likely to classify into “whiter” categories than those assigned by interviewers (Silva, 2001).
9
III. Race and the Labor Force
I recount social, political, and economic developments as they affected whites and Afro-
Brazilians after independence, across four time periods which mark key changes in their relative
status: the Imperial Era (1822-1889), First Republic (1889-1930), Vargas Era/Second Republic
(1930-1964), and Military Rule/Return to Democracy (1964 to present). The independence of
Brazil contrasts other Latin American countries’ because a constitutional monarchy was formed,
as opposed to a republican democracy, and slavery expanded, contrary to being abolished.
i.) Imperial Era (1822-1889)
The royal court relocated to Rio de Janeiro upon Napoleon’s 1807 invasion of Portugal;
João VI became king in 1816, returned to Portugal in 1821, and the ensuing year his son Pedro I
declared Brazil independent and himself emperor (Merrick and Graham, 1979). Pedro I
abdicated in 1831 and was succeeded by Pedro II, only five years old, who was crowned in 1840
and served until the republican coup of 1889. While there was much continuity with the colonial
era, this period spanned the unprecedented expansion of the southeast slave economy, suspension
of the international slave trade in 1850, and ultimate abolition of slavery in 1888.
Coffee – whose cultivation was introduced into São Paulo during the mid-1700s and
spread to Rio de Janeiro, Espírito Santo, and Minas Gerais (Filho, 1952) – surpassed sugar as
Brazil’s most-valuable export by the 1830s (Bethell and Carvalho, 1989). To satisfy growing
labor demand, the external and internal slave trades reached new proportions: An estimated one
million African slaves disembarked in Brazil between 1801 and 1825 and another million
between 1826 and 1850, together 42% of the entire volume of the trade (Trans-Atlantic Slave
10
Trade Database). Internally, up to 200,000 slaves were transported by sea from northern to
southern states between 1850 and 1888 (Klein, 1971); substantial numbers also migrated to the
southeast from the interior states of Mato Grosso, Goiás, and Minas Gerais.
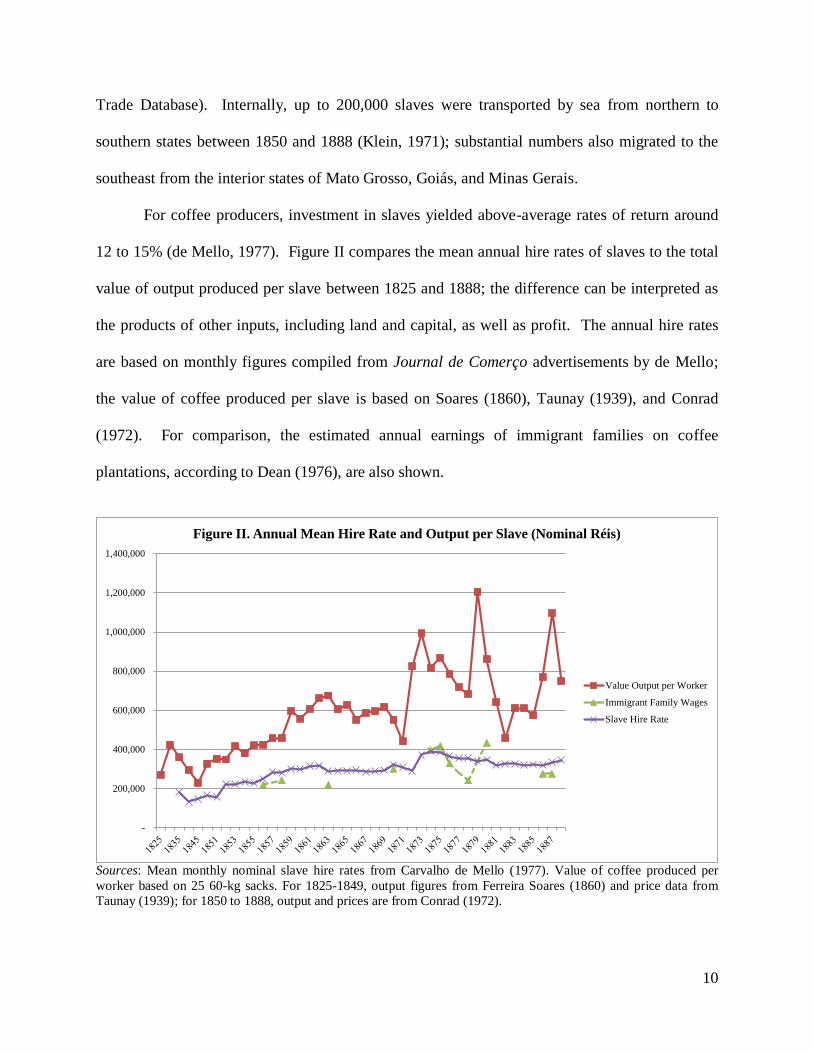
For coffee producers, investment in slaves yielded above-average rates of return around
12 to 15% (de Mello, 1977). Figure II compares the mean annual hire rates of slaves to the total
value of output produced per slave between 1825 and 1888; the difference can be interpreted as
the products of other inputs, including land and capital, as well as profit. The annual hire rates
are based on monthly figures compiled from Journal de Comerço advertisements by de Mello;
the value of coffee produced per slave is based on Soares (1860), Taunay (1939), and Conrad
(1972). For comparison, the estimated annual earnings of immigrant families on coffee
plantations, according to Dean (1976), are also shown.
-
200,000
400,000
600,000
800,000
1,000,000
1,200,000
1,400,000
Figure II. Annual Mean Hire Rate and Output per Slave (Nominal Réis)
Value Output per Worker
Immigrant Family Wages
Slave Hire Rate
Sources: Mean monthly nominal slave hire rates from Carvalho de Mello (1977). Value of coffee produced per
worker based on 25 60-kg sacks. For 1825-1849, output figures from Ferreira Soares (1860) and price data from
Taunay (1939); for 1850 to 1888, output and prices are from Conrad (1972).
11
In 1870, for example, the value of coffee output per worker was $552,025 réis, compared
to a mean annual slave hire rate of $322,800 ($26,900/mo.) and estimated wages per immigrant
family of $301,950. The immigrant family wages, with two working adults, and slave hire rates
are not very different, but the family could potentially double its income by selling subsistence
crops or animals and was provided with housing: the immigrant family money wage is therefore
a good proxy for the earnings of an adult.
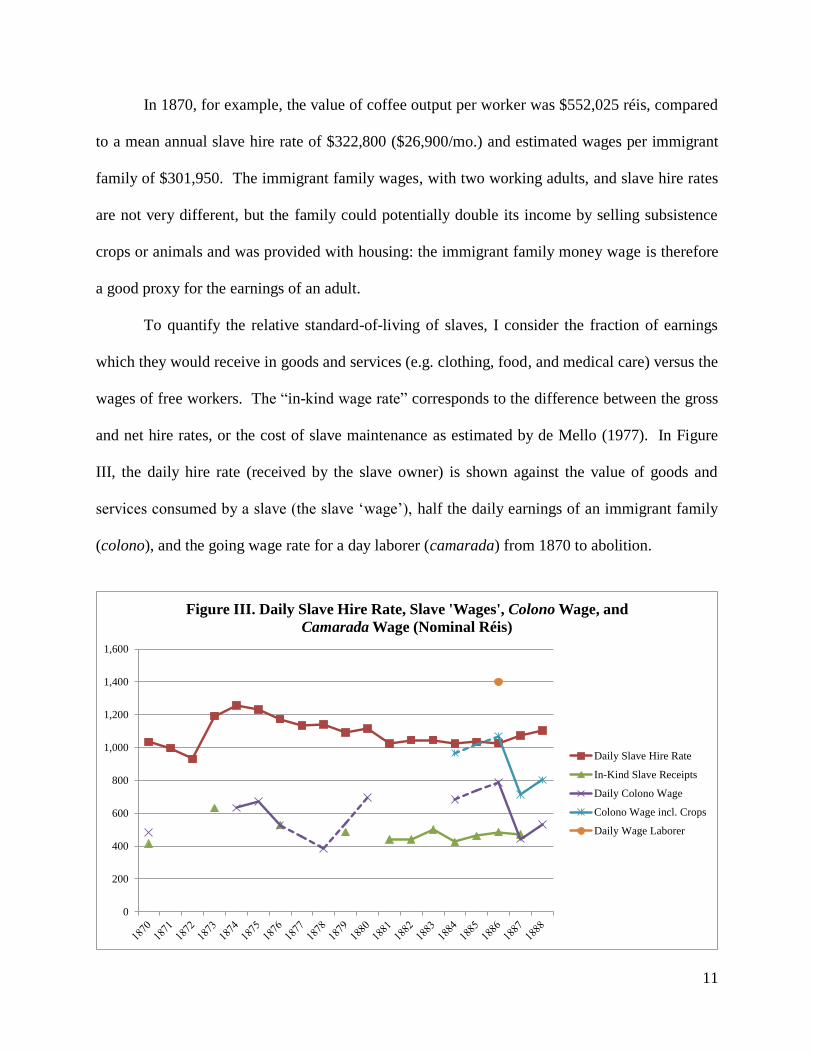
To quantify the relative standard-of-living of slaves, I consider the fraction of earnings
which they would receive in goods and services (e.g. clothing, food, and medical care) versus the
wages of free workers. The “in-kind wage rate” corresponds to the difference between the gross
and net hire rates, or the cost of slave maintenance as estimated by de Mello (1977). In Figure
III, the daily hire rate (received by the slave owner) is shown against the value of goods and
services consumed by a slave (the slave ‘wage’), half the daily earnings of an immigrant family
(colono), and the going wage rate for a day laborer (camarada) from 1870 to abolition.
0
200
400
600
800
1,000
1,200
1,400
1,600
Figure III. Daily Slave Hire Rate, Slave 'Wages', Colono Wage, and
Camarada Wage (Nominal Réis)
Daily Slave Hire Rate
In-Kind Slave Receipts
Daily Colono Wage
Colono Wage incl. Crops
Daily Wage Laborer
12
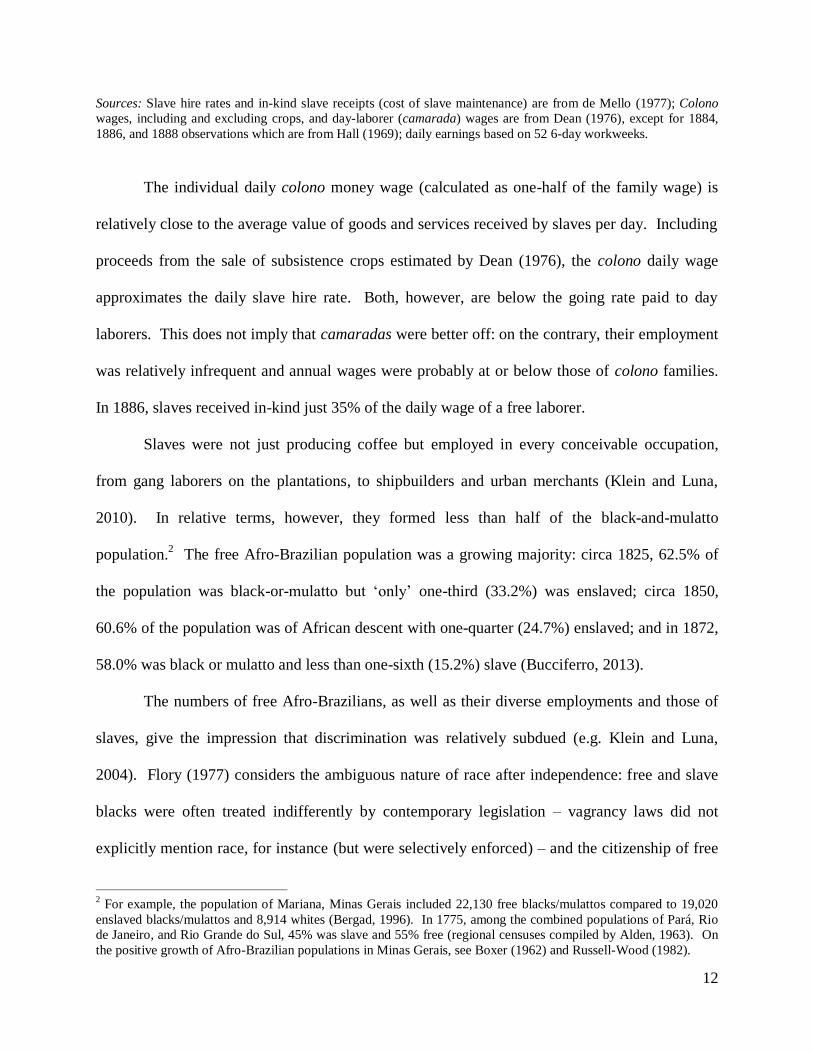
Sources: Slave hire rates and in-kind slave receipts (cost of slave maintenance) are from de Mello (1977); Colono
wages, including and excluding crops, and day-laborer (camarada) wages are from Dean (1976), except for 1884,
1886, and 1888 observations which are from Hall (1969); daily earnings based on 52 6-day workweeks.
The individual daily colono money wage (calculated as one-half of the family wage) is
relatively close to the average value of goods and services received by slaves per day. Including
proceeds from the sale of subsistence crops estimated by Dean (1976), the colono daily wage
approximates the daily slave hire rate. Both, however, are below the going rate paid to day
laborers. This does not imply that camaradas were better off: on the contrary, their employment
was relatively infrequent and annual wages were probably at or below those of colono families.
In 1886, slaves received in-kind just 35% of the daily wage of a free laborer.
Slaves were not just producing coffee but employed in every conceivable occupation,
from gang laborers on the plantations, to shipbuilders and urban merchants (Klein and Luna,
2010). In relative terms, however, they formed less than half of the black-and-mulatto
population.2 The free Afro-Brazilian population was a growing majority: circa 1825, 62.5% of
the population was black-or-mulatto but ‘only’ one-third (33.2%) was enslaved; circa 1850,
60.6% of the population was of African descent with one-quarter (24.7%) enslaved; and in 1872,
58.0% was black or mulatto and less than one-sixth (15.2%) slave (Bucciferro, 2013).
The numbers of free Afro-Brazilians, as well as their diverse employments and those of
slaves, give the impression that discrimination was relatively subdued (e.g. Klein and Luna,
2004). Flory (1977) considers the ambiguous nature of race after independence: free and slave
blacks were often treated indifferently by contemporary legislation – vagrancy laws did not
explicitly mention race, for instance (but were selectively enforced) – and the citizenship of free
2 For example, the population of Mariana, Minas Gerais included 22,130 free blacks/mulattos compared to 19,020
enslaved blacks/mulattos and 8,914 whites (Bergad, 1996). In 1775, among the combined populations of Pará, Rio
de Janeiro, and Rio Grande do Sul, 45% was slave and 55% free (regional censuses compiled by Alden, 1963). On
the positive growth of Afro-Brazilian populations in Minas Gerais, see Boxer (1962) and Russell-Wood (1982).
13
native-born blacks was recognized by the 1824 constitution. Periodicals catering to mulattos
were founded in the 1830s, but race was more-frequently referred to within the context of
politics rather than discrimination.
The topic of race was nominally taken up in the press and public discourse, but deeper
issues were at stake which could not be articulated. As Pierson (1942) has implied, social
mobility existed for people of mixed descent – the ‘mulatto escape hatch’ referred to by Degler
(1971) – yet it was limited and beyond the reach of the third of the population who were slaves.
Brazil was already an outlier in the international context: the Haitian revolution (1794) and
cessation of the north-Atlantic slave trade (1807) were decades-passed.
In spite of gestures that it would end the international trade, it was condoned until 1850
when the British intervened and escorted intercepted slaves back to Africa (Bethell, 1970). The
newly-inelastic supply of labor prompted panic. The basis for continued economic growth was
connecting labor with abundant land on the frontier, and this was at-risk; although there were
many native Brazilians, they were overwhelmingly in the subsistence sector and withdrawn from
the money economy (Furtado, 2006 [1959]). Cognizant of the potential end to slavery, planters
began to experiment with European immigrant labor.
The movement towards abolition accelerated after 1850: in 1871, the Law of the Free
Womb declared the children of slave mothers free upon maturity and gave slaves the right to
purchase their own freedom; the Sexagenarian Law followed in 1885, which freed slaves over 60
years of age; and the Golden Law ended slavery altogether in 1888 (Andrews, 1991). Even
though the princess-regent signed the law, it was not a political victory: active rebellion by slaves
had made abolition imminent and the monarchy was overthrown the following year.
14
ii.) First Republic (1889-1930)
Freedom brought its challenges to former slaves in Brazil. In the southeast,
discrimination by employers and ex-slaves’ demands for independence led to the latter’s
substitution by European immigrants. In other regions, after the immediate upheaval of
abolition, life resumed a pattern similar to the previous regime. There was noticeable variation,
however, in the adaptation of workers to the new situation. Abolition was a mixed blessing in
that it awarded slaves freedom but not necessarily a material improvement in quality-of-life.
Racism, prevalent at the end of the 19th
century, contributed to employers’ preference for
workers from Europe but cannot fully explain it. If there were large numbers of freed slaves
(libertos) and other Brazilians (trabalhadores nacionais) available, why were planters
determined to hire European immigrants? On one side, whites blamed Afro-Brazilians for the
disruptions in the labor force associated with abolition (Ianni, 1962); on the other, freed slaves
only desired to return to the plantation on certain terms, and not the money wage per-se.
The conditions under which ex-slaves would transform into wage laborers were very
limited, Furtado postulates (2006 [1959]): if freed slaves were given a ‘subsistence’ salary the
old system would remain fundamentally unchanged, but if there were abundant unoccupied lands
they would prefer to engage in subsistence agriculture. In Brazil, he explains, the northeast sugar
zone was already fully-settled and bound by the caatinga (scrublands) to the west, under which
circumstances the labor of former slaves could be secured at a relatively low wage; in the
southeast coffee zone, in contrast, lands were abundant and wages relatively high.
Free blacks wanted to distance themselves from the plantation because physical work was
culturally considered demeaning and associated with slaves (Ianni, 1962). Afro-Brazilian
families withdrew women and children from the fields, and occasionally the workforce entirely;
15
immigrant families, in contrast, supplied female and child labor in order to make ends meet, an
attractive feature for employers (Andrews, 1991).
The solution to the labor-scarcity problem was consequently to flood the market with
immigrants and thereby drive down wages. Beginning in 1881, programs were created in
collaboration with the São Paulo provincial government to subsidize the transportation of
migrants from Europe to Brazil. The Society for the Promotion of Immigration was created in
1886 and worked with the province until its dissolution in 1895 (when the government assumed
this function), having facilitated the immigration of nearly 220,000 people (Hall, 1969).
The immigration program was successful: Compared to 195,000 immigrants who arrived
in Brazil between 1870 and 1889, immigration between 1890 and 1909 totaled 1,100,000, half of
whom (515,000) were Italian (Kodama, 2007). In the 1890s, about as many immigrants entered
São Paulo as there were slaves in all of Brazil the year before abolition.3 This situation was
made possible by “push” conditions in the Old World: according to Furtado (2006[1959]), the
unification of Italy exposed the less-developed south to competition with the north, which hurt
southern manufacturers and created a “permanent situation of depression,” (p. 187).
Northern Europe, the United States, and Argentina were among the potential destinations
for Italian emigrants; because of the significantly higher wages in the U.S. and Argentina, Brazil
was only an attractive option for those who could not afford passage (Williamson, 1995; Hatton
and Williamson, 1998). Furthermore, contemporary reports publicized that the situation of
European immigrants in Brazil was not unlike that of slaves.4 Those who chose to go there were
often desperate, which is exactly what planters wanted.
3 The overall slave population of Brazil in 1887 was 723,419 (Reis, 2007; from Conrad, 1972); between 1890 and
1899, 734,985 immigrants entered São Paulo (Kodama, 2007; from Instituto de Estudos Brasileiros, 1973). 4 In 1888, for instance, the Italian Geographical Society asserted that the São Paulo immigration program served “to
substitute white slaves for black ones,” and documented a series of abuses (in Hall, 1969; p. 122).
16
Many labor arrangements existed on the fazendas (plantations), but immigrants to São
Paulo commonly became colonos; other salaried positions were camaradas and empreiteiros.
The colonos, named for the groups of homes they inhabited among the groves, received a fixed
monetary income for maintaining a certain number of coffee trees plus a variable payment
depending on the volume of the harvest (Furtado, 2006 [1959]).5 The camaradas, who
commonly resided on the plantation in dormitories (usually remodeled slave quarters), were
individual laborers paid daily or monthly (Stein, 1957; Monsma, 2006). Finally, empreiteiros
(or, more precisely, gangs of laborers working under an empreiteiro, or contractor) travelled
from plantation to plantation completing jobs at a flat rate (Stein, 1957).
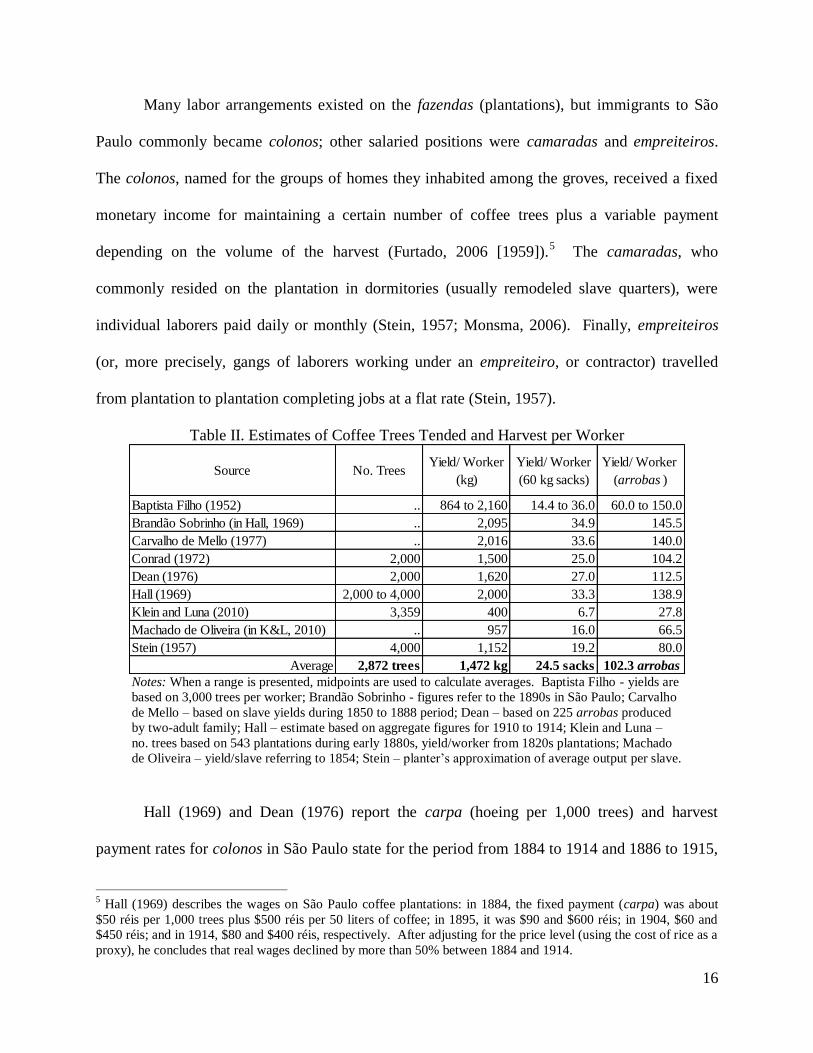
Table II. Estimates of Coffee Trees Tended and Harvest per Worker
Source No. TreesYield/ Worker
(kg)
Yield/ Worker
(60 kg sacks)
Yield/ Worker
(arrobas )
Baptista Filho (1952) .. 864 to 2,160 14.4 to 36.0 60.0 to 150.0
Brandão Sobrinho (in Hall, 1969) .. 2,095 34.9 145.5
Carvalho de Mello (1977) .. 2,016 33.6 140.0
Conrad (1972) 2,000 1,500 25.0 104.2
Dean (1976) 2,000 1,620 27.0 112.5
Hall (1969) 2,000 to 4,000 2,000 33.3 138.9
Klein and Luna (2010) 3,359 400 6.7 27.8
Machado de Oliveira (in K&L, 2010) .. 957 16.0 66.5
Stein (1957) 4,000 1,152 19.2 80.0
Average 2,872 trees 1,472 kg 24.5 sacks 102.3 arrobas Notes: When a range is presented, midpoints are used to calculate averages. Baptista Filho - yields are
based on 3,000 trees per worker; Brandão Sobrinho - figures refer to the 1890s in São Paulo; Carvalho
de Mello – based on slave yields during 1850 to 1888 period; Dean – based on 225 arrobas produced
by two-adult family; Hall – estimate based on aggregate figures for 1910 to 1914; Klein and Luna –
no. trees based on 543 plantations during early 1880s, yield/worker from 1820s plantations; Machado
de Oliveira – yield/slave referring to 1854; Stein – planter’s approximation of average output per slave.
Hall (1969) and Dean (1976) report the carpa (hoeing per 1,000 trees) and harvest
payment rates for colonos in São Paulo state for the period from 1884 to 1914 and 1886 to 1915,
5 Hall (1969) describes the wages on São Paulo coffee plantations: in 1884, the fixed payment (carpa) was about
$50 réis per 1,000 trees plus $500 réis per 50 liters of coffee; in 1895, it was $90 and $600 réis; in 1904, $60 and
$450 réis; and in 1914, $80 and $400 réis, respectively. After adjusting for the price level (using the cost of rice as a
proxy), he concludes that real wages declined by more than 50% between 1884 and 1914.
17
respectively. I use these rates and information on the average number of trees tended and harvest
per worker from other sources to estimate annual colono family wages. Coffee output was
measured in 60-kilogram sacks or arrobas (1 arroba = 14.4 kg). Based on the figures shown in
Table II, each worker tended an average of about 3,000 trees and produced 1,500 kilograms of
coffee per year, the equivalent of 25 sacks or 100 arrobas.
0
100,000
200,000
300,000
400,000
500,000
600,000
700,000
800,000
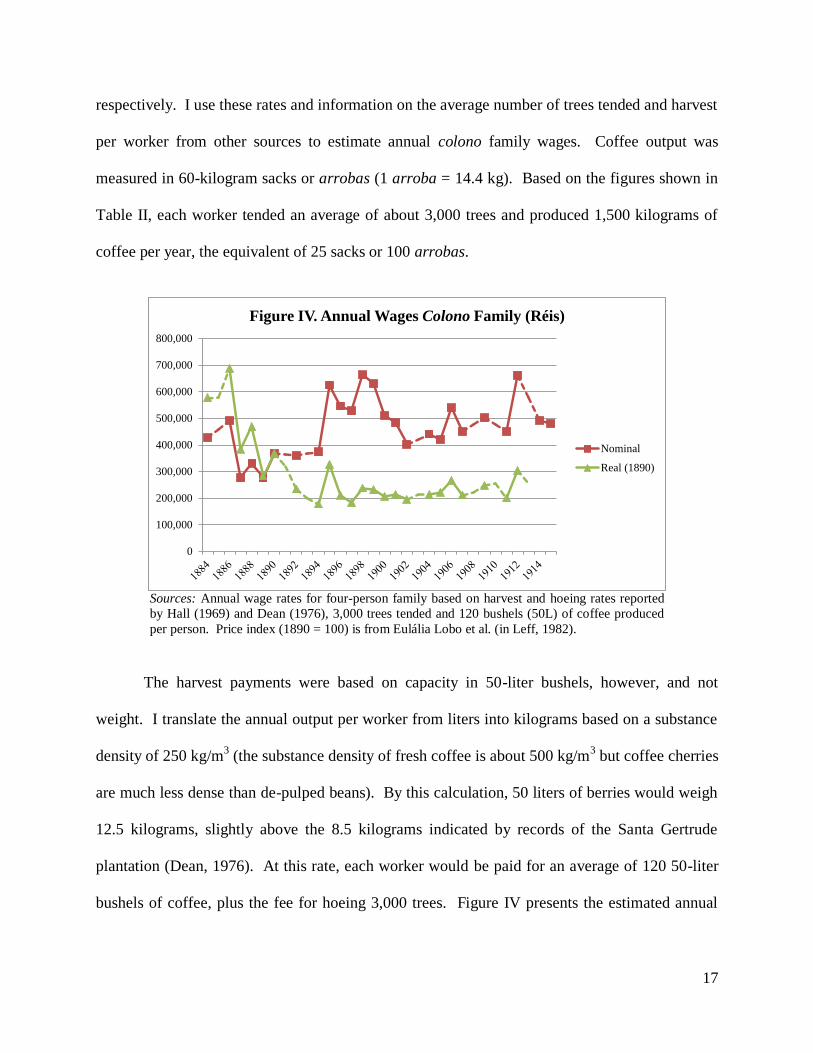
Figure IV. Annual Wages Colono Family (Réis)
Nominal
Real (1890)
Sources: Annual wage rates for four-person family based on harvest and hoeing rates reported
by Hall (1969) and Dean (1976), 3,000 trees tended and 120 bushels (50L) of coffee produced
per person. Price index (1890 = 100) is from Eulália Lobo et al. (in Leff, 1982).
The harvest payments were based on capacity in 50-liter bushels, however, and not
weight. I translate the annual output per worker from liters into kilograms based on a substance
density of 250 kg/m3 (the substance density of fresh coffee is about 500 kg/m
3 but coffee cherries
are much less dense than de-pulped beans). By this calculation, 50 liters of berries would weigh
12.5 kilograms, slightly above the 8.5 kilograms indicated by records of the Santa Gertrude
plantation (Dean, 1976). At this rate, each worker would be paid for an average of 120 50-liter
bushels of coffee, plus the fee for hoeing 3,000 trees. Figure IV presents the estimated annual
18
wages of an average colono family between 1884 and 1915 according to these parameters and
the harvest and carpa payments compiled by Hall (1969) and Dean (1976).
Wages were favorable for immigrant families in the years around abolition, declined in
real terms from 1892-1894, and then spiked in 1895 when the value of output per worker reached
an all-time-high above $2,000,000 réis. After 1900, the increasing price level and stagnant
payment rates prompted hundreds of thousands to return-migrate: between 1900 and 1910, there
were a total of only 50,000 net immigrants to São Paulo (Hall, 1969).
In the rest of Brazil, there was no subsidized immigration program and the post-abolition
experience of Afro-Brazilians varied. Hasenbalg (1978) writes, “In the Northeast, abolition
occurred without great readjustment, and the ex-slaves were incorporated into the various
fractions of the northeastern peasantry,” (p. 153). Domingues (2008a) summarizes three recent
works describing the situation of blacks outside São Paulo: In Sergipe, the elite adopted a series
of vagrancy laws whose purpose was to force the free population back onto the sugar plantations
(Subrinho, 2000). In Bahia, freed slaves wanted to limit their labor in the sugar industry as much
as possible, and dedicate more time to subsistence farming (Filho, 2006). In Juiz de Fora, Minas
Gerais, some libertos stayed with their former employers while others migrated to the city in
search of work (Guimarães, 2006).
In Vassouras (northeast São Paulo State), blacks refused to work under conditions
associated with slavery. According to Stein (1957), former slaves faced less competition with
immigrants because the latter were drawn to the more-profitable plantations to the west; black
and mulatto women resigned from field and domestic labor after abolition, but many eventually
returned at a piecemeal rate; likewise with men, who were pressured back onto the plantations
19
(by vagrancy laws, for example) and took up positions as camaradas or colonos not altogether
different from their previous occupations.
In the city of São Paulo, blacks in many occupations (e.g. artisans, small merchants) were
substituted by foreigners; new arrivals found only inconstant and menial work (Fernandes, 1965;
in Hasenbalg, 1978). The majority of the urban industrial workforce was comprised of
immigrants; while this may owe to their relative mobility, they regularly hailed from rural areas
and had no more experience than national workers (Leff, 1982). Indeed, there is no firm
evidence that immigrants were better workers than blacks in terms of education or skills
(Andrews, 1991). Labor organizers promoted racial solidarity, but blacks were reluctant to join
the movement because of their effective exclusion from industrial jobs (Andrews, 1988).
Knowledge of racial inequality during the early twentieth century is limited because there
was only one national census (in 1920) and it omitted any consideration of race. A new source
of data on occupational segregation in São Paulo, however, reveals widespread inequality of
employment: incident reports (Boletins de Ocorrências) collected over the period from 1912 to
1920 included both information on race and occupation and suggest the wholesale exclusion of
blacks from certain jobs. By combining the incident report statistics, published in Jacino (2012),
with salary data for São Paulo from the 1920 industrial census I can calculate the extent of wage
inequality caused simply by (discriminatory) occupational segregation.
In Table III, I present the number of whites and blacks in each occupational category and
the average nominal daily wage. Blacks tended to be employed in lower-paying occupations:
they were overrepresented as domestic servants and underrepresented in most construction,
clothing, health, and liberal professions. Nonetheless, there was proportional representation of
blacks among operators (unskilled factory workers), carpenters, painters, and shoemakers. If
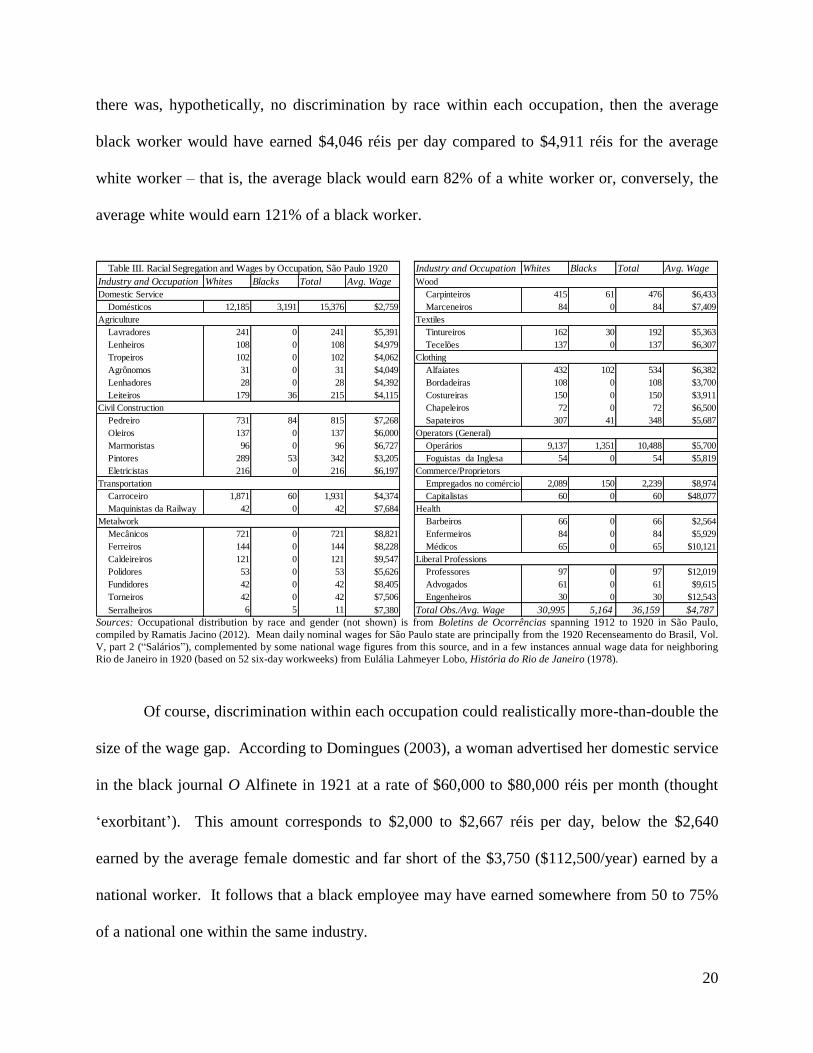
20
there was, hypothetically, no discrimination by race within each occupation, then the average
black worker would have earned $4,046 réis per day compared to $4,911 réis for the average
white worker – that is, the average black would earn 82% of a white worker or, conversely, the
average white would earn 121% of a black worker.
Industry and Occupation Whites Blacks Total Avg. Wage
Industry and Occupation Whites Blacks Total Avg. Wage Wood
Domestic Service Carpinteiros 415 61 476 $6,433
Domésticos 12,185 3,191 15,376 $2,759 Marceneiros 84 0 84 $7,409
Agriculture Textiles
Lavradores 241 0 241 $5,391 Tintureiros 162 30 192 $5,363
Lenheiros 108 0 108 $4,979 Tecelões 137 0 137 $6,307
Tropeiros 102 0 102 $4,062 Clothing
Agrônomos 31 0 31 $4,049 Alfaiates 432 102 534 $6,382
Lenhadores 28 0 28 $4,392 Bordadeiras 108 0 108 $3,700
Leiteiros 179 36 215 $4,115 Costureiras 150 0 150 $3,911
Civil Construction Chapeleiros 72 0 72 $6,500
Pedreiro 731 84 815 $7,268 Sapateiros 307 41 348 $5,687
Oleiros 137 0 137 $6,000 Operators (General)
Marmoristas 96 0 96 $6,727 Operários 9,137 1,351 10,488 $5,700
Pintores 289 53 342 $3,205 Foguistas da Inglesa 54 0 54 $5,819
Eletricistas 216 0 216 $6,197 Commerce/Proprietors
Transportation Empregados no comércio 2,089 150 2,239 $8,974
Carroceiro 1,871 60 1,931 $4,374 Capitalistas 60 0 60 $48,077
Maquinistas da Railway 42 0 42 $7,684 Health
Metalwork Barbeiros 66 0 66 $2,564
Mecânicos 721 0 721 $8,821 Enfermeiros 84 0 84 $5,929
Ferreiros 144 0 144 $8,228 Médicos 65 0 65 $10,121
Caldeireiros 121 0 121 $9,547 Liberal Professions
Polidores 53 0 53 $5,626 Professores 97 0 97 $12,019
Fundidores 42 0 42 $8,405 Advogados 61 0 61 $9,615
Torneiros 42 0 42 $7,506 Engenheiros 30 0 30 $12,543
Serralheiros 6 5 11 $7,380 Total Obs./Avg. Wage 30,995 5,164 36,159 $4,787
Table III. Racial Segregation and Wages by Occupation, São Paulo 1920
Sources: Occupational distribution by race and gender (not shown) is from Boletins de Ocorrências spanning 1912 to 1920 in São Paulo,
compiled by Ramatis Jacino (2012). Mean daily nominal wages for São Paulo state are principally from the 1920 Recenseamento do Brasil, Vol.
V, part 2 (“Salários”), complemented by some national wage figures from this source, and in a few instances annual wage data for neighboring
Rio de Janeiro in 1920 (based on 52 six-day workweeks) from Eulália Lahmeyer Lobo, História do Rio de Janeiro (1978).
Of course, discrimination within each occupation could realistically more-than-double the
size of the wage gap. According to Domingues (2003), a woman advertised her domestic service
in the black journal O Alfinete in 1921 at a rate of $60,000 to $80,000 réis per month (thought
‘exorbitant’). This amount corresponds to $2,000 to $2,667 réis per day, below the $2,640
earned by the average female domestic and far short of the $3,750 ($112,500/year) earned by a
national worker. It follows that a black employee may have earned somewhere from 50 to 75%
of a national one within the same industry.
21
In some aspects, abolition brought more equality among races – now citizens, former
slaves could choose where to live and work; in others, it brought less – libertos were often
relegated to inferior employments than previously held. In much of the country, repression and a
lack of options for blacks impeded broader changes in social organization, with the exception of
the southeast where massive immigration operated to undercut wages and push blacks into the
subsistence sector or insecure urban employment. Nationalist sentiment after the Revolution of
1930, however, concurred with the opening of new opportunities for Afro-Brazilians.
iii.) Vargas Era/Second Republic (1930-1964)
During the First Republic, institutions of black civil participation were fomenting.
Numerous societies (beginning with Clube 28 de Setembro in 1897) and periodicals (starting
with A Pátria in 1899) were established to discuss issues pertinent to Afro-Brazilians
(Domingues, 2007). This culminated in the early 1930s, when black organizations mobilized
support and garnered political influence. The black movement would produce tangible benefits
for workers, but fail to breach higher-level political constraints.
Getúlio Vargas overthrew the republican government in 1930 with the support of
landowners in his home state of Rio Grande do Sul, as well as Minas Gerais and the northeast
(Andrews, 1991). Afro-Brazilians, who had suffered under the Republic, initially supported
Vargas; in turn, he helped integrate them into politics and the economy. The Ministry of Labor
was established and the Law of Nationalization of Labor passed in 1931, which required that at
least two-thirds of the industrial workforce be native-Brazilian (Andrews, 1991).
The Brazilian Black Front (FNB) was established in 1931 and by 1936 it had thousands
of members and 60 delegates in other states (Domingues, 2008b). The organization supported
22
Vargas (and was an instrument of the repression which ensued), explains Domingues, because
like him it championed Brazilian nationalism. The FNB promoted the well-being of blacks, even
established an elementary school and health clinic, but became increasingly affiliated with
fascism and fractions developed among its members. Disillusionment with the Estado Novo
(New State) lessened the imperative for political organization, but the following period was
nonetheless one of notable economic progress for blacks (Andrews, 1991).
After the end of Vargas’ lock on power, new groups would lead the Afro-Brazilian
movement: notably the União dos Homens de Cor, founded in Porto Alegre in 1943, and the
Teatro Experimental do Negro, founded in Rio de Janeiro in 1944 (Domingues, 2007). The
UHC sought to “raise the economic and intellectual level of people-of-color” (p. 108), and the
TEN promoted Afro-Brazilian culture and anti-discriminatory legislation. Abdias do
Nascimento, a founder of TEN, was an early advocate for the revalorization of Brazil’s African
heritage: the majority of Brazilians are of African descent, he affirms, but statistics indicate
otherwise because of “[t]he compulsion to identify with European values, aesthetics and criteria
of personal beauty,” (1995, p. 102). The ‘whitening’ of Brazil served to undermine black
consciousness, a theme which would become central to later movements.
In spite of some advancement, the situation of blacks and mulattos was markedly
different from that of whites and had not changed substantially from the previous decade. For
instance, the literacy rate of whites was 46.9% in 1940 and 52.7% in 1950, versus 22.6% in 1940
and 25.7% in 1950 for non-whites (Hasenbalg, 1978) – a slightly higher rate of increase for
blacks, but unimpressive given their low starting point. In São Paulo, however, while there was
a large difference in the relative employment of blacks-and-mulattos compared to whites (24.3
23
against 20.5%), the rate of growth of industrial employment among Afro-Brazilians was notably
higher (Hasenbalg and Salazar, 1994).
iv.) Military Rule/Return to Democracy (1964 to present)
The military coup of 1964 marked the beginning of the dissolution of progressive Afro-
Brazilian societies (Domingues, 2007). As stated by Lovell (1999): “Military leaders quickly
denounced any criticism of racial democracy as an ‘act of subversion’ and brutally silenced all
opposition movements through imprisonment, censorship, and decree,” (p. 400). The race/color
question was removed from the 1970 census; partial information is available from other sources
for 1976, but statistics on racial inequality are generally unavailable until 1980.
In the 1976 National Household Survey (PNAD), whites earned on-average 2.8 times
more than blacks (3,433 Cr$ to 1,210 Cr$), and 2.0 times more than people of mixed-race (3,433
Cr$ to 1,722 Cr$); Silva (1985) estimates that 32.9% of the difference between white and mixed-
race individuals is attributable to discrimination, and 26.3% of that between blacks and whites.
During the 1980s, Brazil did not have an official policy of segregation, but in many areas one in-
fact existed: Among those companies using staffing agencies in São Paulo, according to reports,
the majority would not consider black applicants for white-collar jobs; many retail and office
employers would likewise screen out Afro-Brazilians (Andrews, 1991).
There continued to be journalistic and cultural contributions from Afro-Brazilians during
the military government, but not of an overt political nature; only in 1978 did black civil society
reemerge in the public sphere, with the foundation of the Movimento Negro Unificado (MNU) or
Unified Black Movement (Domingues, 2007). From the 1980s forward, efforts to eliminate
racial discrimination grew and with them, public awareness of and scholarship on race. The new
24
generation of Afro-Brazilian organizers, inspired by pan-Africanism and the U.S. black power
movement, emerged with a more-militant orientation after two decades of suppression by the
dictatorship (Andrews, 1992).
Many improvements in the social status of Afro-Brazilians followed: the MNU adopted
the term “negro” for both blacks and mulattos, and it lost the negative connotation it had during
the First Republic; the holiday commemorating abolition was moved from the 13th
of May to
November 20th
, and the 13th
was named the National Day for the Denunciation of Slavery;
school curricula were revised, recognizing multiculturalism and the historical role of blacks; and
African cultural heritage was generally asserted (Domingues, 2007).
In the political spectrum, the Partido do Movimento Democrático Brasileiro (PDMB)
held majority control of the government after 1982 and created a state agency, the Conselho de
Participação e Desenvolvimento da Comunidade Negra, directed towards protecting the rights of
the black community (Andrews, 1992). Over the 1990s and 2000s, improvements in income, life
expectancy, and education were greater for blacks than for whites, writes Cristina Charão of the
Institute of Applied Economic Research (2014).
The last decade has witnessed some promising, yet controversial, developments in the
effort against discrimination: In 2003, the Secretary of Policy for the Promotion of Racial
Equality was established by law (http://www.seppir.gov.br). Its broad charge is to aid in the
creation and implementation of public policies regarding racial equality, including the National
Program of Affirmative Action enacted on the 13th
of May, 2002 under direction of the Ministry
of Justice, Secretary of State for Human Rights (http://www.planalto.gov.br).
25
IV. Trends in Racial Inequality from Abolition to Present
Important strides have been made in Brazil towards racial equality, but are the
improvements of the last twenty years part of a long-run trend or do they form a unique historical
episode? The previous section describes the experience of whites (brancos) and Afro-Brazilians
(pretos and pardos) over the 190 years from independence to present (1822-2012); this section
overviews the available quantitative evidence on absolute and relative changes, by race, in life
expectancy, literacy, education, income, and occupational segregation.
Data are rather limited: There is no census information on race for the twentieth century
prior to 1940; although the populations of each racial group are detailed in the 1872 and 1890
censuses, statistics on variables of interest are not disaggregated by race. In this analysis, I
employ the official census tables for 1940 and 1950 and micro-data (about a 5% sample) from
the 1960, 1980, 1991, 2000, and 2010 censuses (the 1970 census omitted race). For the
occupational distribution, I rely on these and alternative sources for periods prior to 1940.
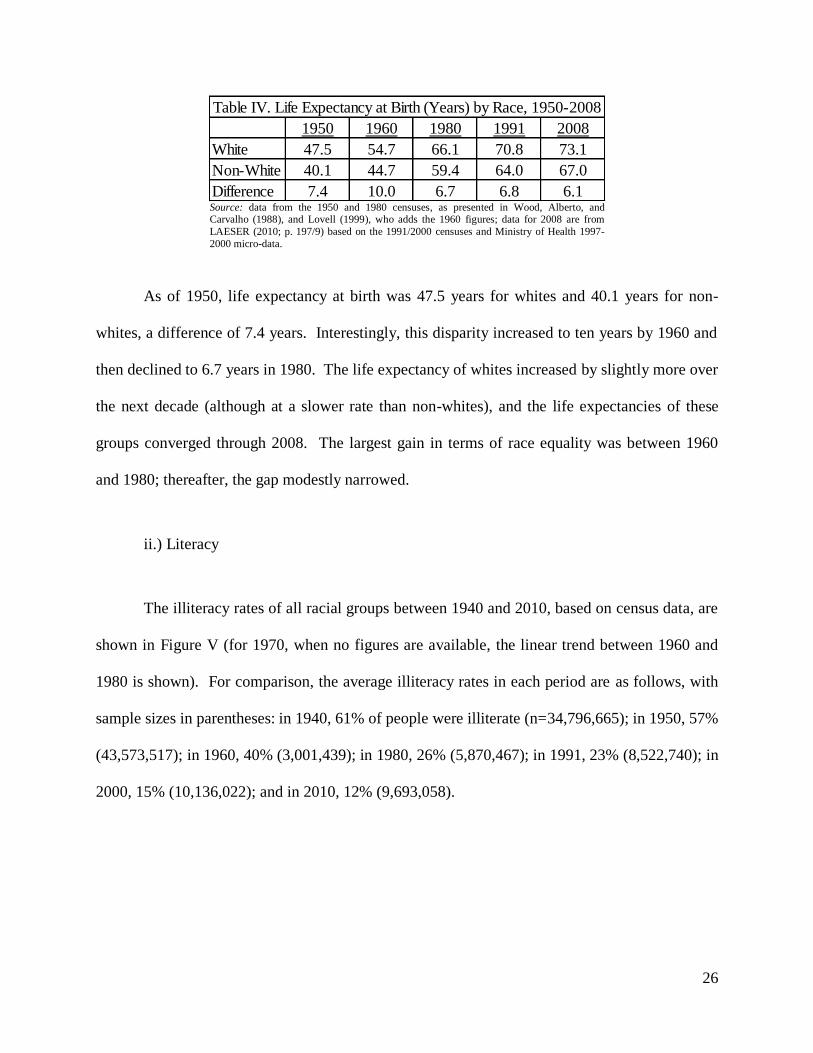
i.) Life Expectancy
Available statistics on life expectancy at birth for whites (brancos) and non-whites
(pardos and pretos), and the difference between them, are presented in Table IV. The white/non-
white dichotomy is shown here because it was standard in the sources where these figures were
published; hereafter, each race is presented separately (even though pardos and pretos are found
to be similar in many respects).
26
1950 1960 1980 1991 2008
White 47.5 54.7 66.1 70.8 73.1
Non-White 40.1 44.7 59.4 64.0 67.0
Difference 7.4 10.0 6.7 6.8 6.1
Table IV. Life Expectancy at Birth (Years) by Race, 1950-2008
Source: data from the 1950 and 1980 censuses, as presented in Wood, Alberto, and Carvalho (1988), and Lovell (1999), who adds the 1960 figures; data for 2008 are from
LAESER (2010; p. 197/9) based on the 1991/2000 censuses and Ministry of Health 1997-
2000 micro-data.
As of 1950, life expectancy at birth was 47.5 years for whites and 40.1 years for non-
whites, a difference of 7.4 years. Interestingly, this disparity increased to ten years by 1960 and
then declined to 6.7 years in 1980. The life expectancy of whites increased by slightly more over
the next decade (although at a slower rate than non-whites), and the life expectancies of these
groups converged through 2008. The largest gain in terms of race equality was between 1960
and 1980; thereafter, the gap modestly narrowed.
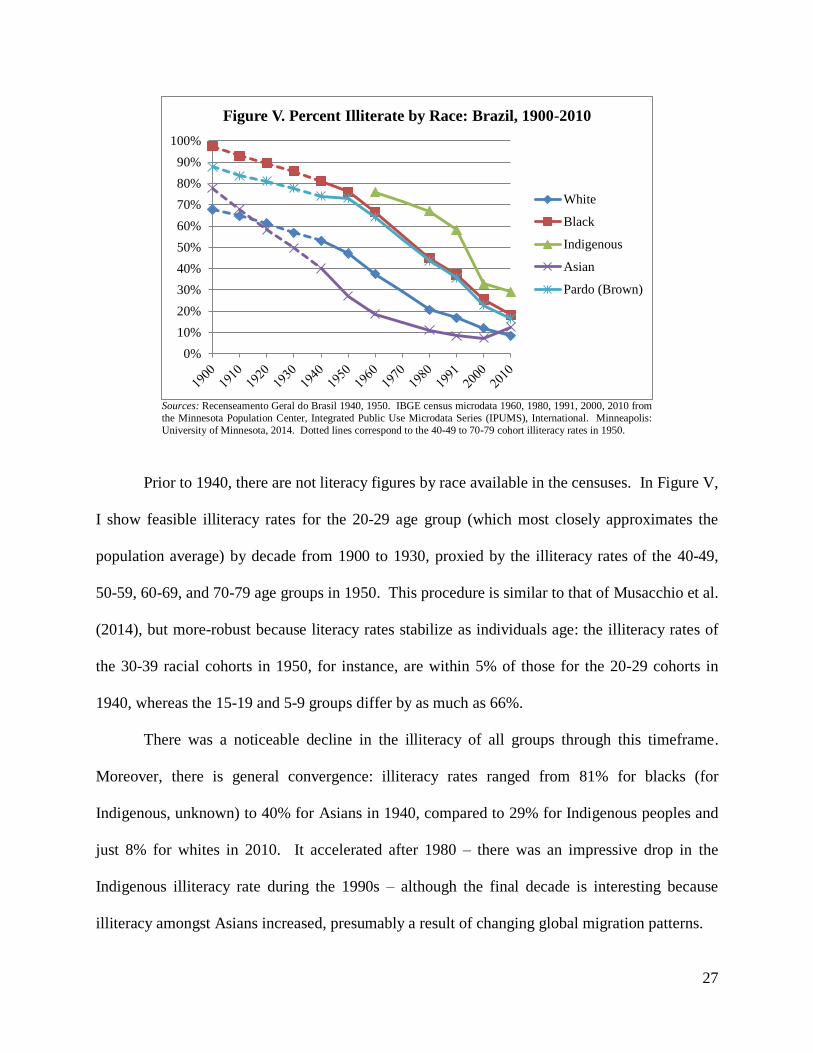
ii.) Literacy
The illiteracy rates of all racial groups between 1940 and 2010, based on census data, are
shown in Figure V (for 1970, when no figures are available, the linear trend between 1960 and
1980 is shown). For comparison, the average illiteracy rates in each period are as follows, with
sample sizes in parentheses: in 1940, 61% of people were illiterate (n=34,796,665); in 1950, 57%
(43,573,517); in 1960, 40% (3,001,439); in 1980, 26% (5,870,467); in 1991, 23% (8,522,740); in
2000, 15% (10,136,022); and in 2010, 12% (9,693,058).
27
0%
10%
20%
30%
40%
50%
60%
70%
80%
90%
100%
Figure V. Percent Illiterate by Race: Brazil, 1900-2010
White
Black
Indigenous
Asian
Pardo (Brown)
Sources: Recenseamento Geral do Brasil 1940, 1950. IBGE census microdata 1960, 1980, 1991, 2000, 2010 from
the Minnesota Population Center, Integrated Public Use Microdata Series (IPUMS), International. Minneapolis:
University of Minnesota, 2014. Dotted lines correspond to the 40-49 to 70-79 cohort illiteracy rates in 1950.
Prior to 1940, there are not literacy figures by race available in the censuses. In Figure V,
I show feasible illiteracy rates for the 20-29 age group (which most closely approximates the
population average) by decade from 1900 to 1930, proxied by the illiteracy rates of the 40-49,
50-59, 60-69, and 70-79 age groups in 1950. This procedure is similar to that of Musacchio et al.
(2014), but more-robust because literacy rates stabilize as individuals age: the illiteracy rates of
the 30-39 racial cohorts in 1950, for instance, are within 5% of those for the 20-29 cohorts in
1940, whereas the 15-19 and 5-9 groups differ by as much as 66%.
There was a noticeable decline in the illiteracy of all groups through this timeframe.
Moreover, there is general convergence: illiteracy rates ranged from 81% for blacks (for
Indigenous, unknown) to 40% for Asians in 1940, compared to 29% for Indigenous peoples and
just 8% for whites in 2010. It accelerated after 1980 – there was an impressive drop in the
Indigenous illiteracy rate during the 1990s – although the final decade is interesting because
illiteracy amongst Asians increased, presumably a result of changing global migration patterns.
28
iii.) Education
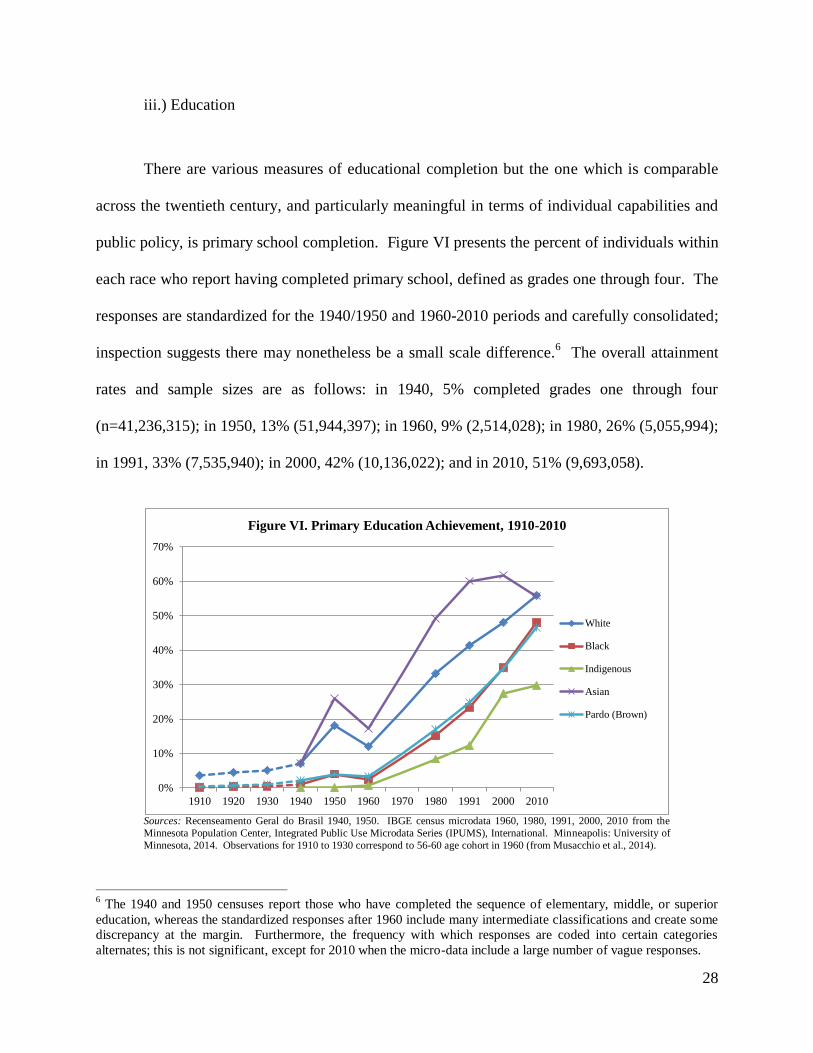
There are various measures of educational completion but the one which is comparable
across the twentieth century, and particularly meaningful in terms of individual capabilities and
public policy, is primary school completion. Figure VI presents the percent of individuals within
each race who report having completed primary school, defined as grades one through four. The
responses are standardized for the 1940/1950 and 1960-2010 periods and carefully consolidated;
inspection suggests there may nonetheless be a small scale difference.6 The overall attainment
rates and sample sizes are as follows: in 1940, 5% completed grades one through four
(n=41,236,315); in 1950, 13% (51,944,397); in 1960, 9% (2,514,028); in 1980, 26% (5,055,994);
in 1991, 33% (7,535,940); in 2000, 42% (10,136,022); and in 2010, 51% (9,693,058).
0%
10%
20%
30%
40%
50%
60%
70%
1910 1920 1930 1940 1950 1960 1970 1980 1991 2000 2010
Figure VI. Primary Education Achievement, 1910-2010
White
Black
Indigenous
Asian
Pardo (Brown)
Sources: Recenseamento Geral do Brasil 1940, 1950. IBGE census microdata 1960, 1980, 1991, 2000, 2010 from the
Minnesota Population Center, Integrated Public Use Microdata Series (IPUMS), International. Minneapolis: University of
Minnesota, 2014. Observations for 1910 to 1930 correspond to 56-60 age cohort in 1960 (from Musacchio et al., 2014).
6 The 1940 and 1950 censuses report those who have completed the sequence of elementary, middle, or superior
education, whereas the standardized responses after 1960 include many intermediate classifications and create some
discrepancy at the margin. Furthermore, the frequency with which responses are coded into certain categories
alternates; this is not significant, except for 2010 when the micro-data include a large number of vague responses.
29
For reference years prior to 1940, the completion rates published in Musacchio et al.
(2014) are shown, corresponding to those of the 56-60 year-old cohort in the 1960 census. The
completion rates are consistent with overall census figures for later decades (adults may become
literate over time, but it is less likely that they return to complete primary school). Figure VI
illustrates a clear upward trend in completion of basic schooling over the century. The decline
during the 1950s appears strange, yet in a way is consonant with previous results: the absolute
change in life expectancy, literacy, and education were all proportionally greater for whites than
non-whites. The opposite came to be true in subsequent decades, and a smooth convergence
occurred after 1980, with the Indigenous experience of the 2000s being the sole outlier.
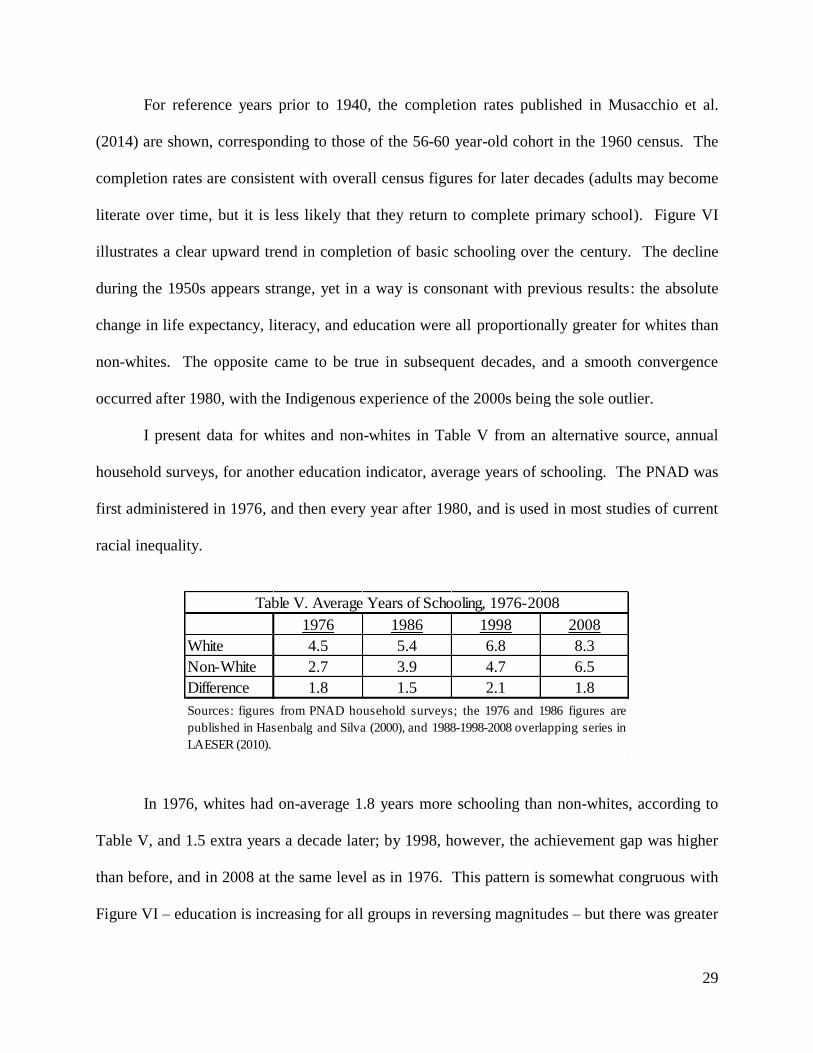
I present data for whites and non-whites in Table V from an alternative source, annual
household surveys, for another education indicator, average years of schooling. The PNAD was
first administered in 1976, and then every year after 1980, and is used in most studies of current
racial inequality.
1976 1986 1998 2008
White 4.5 5.4 6.8 8.3
Non-White 2.7 3.9 4.7 6.5
Difference 1.8 1.5 2.1 1.8
Table V. Average Years of Schooling, 1976-2008
Sources: figures from PNAD household surveys; the 1976 and 1986 figures are
published in Hasenbalg and Silva (2000), and 1988-1998-2008 overlapping series in
LAESER (2010).
In 1976, whites had on-average 1.8 years more schooling than non-whites, according to
Table V, and 1.5 extra years a decade later; by 1998, however, the achievement gap was higher
than before, and in 2008 at the same level as in 1976. This pattern is somewhat congruous with
Figure VI – education is increasing for all groups in reversing magnitudes – but there was greater
30
educational equality in primary school attainment opposed to average years of schooling, likely
explained by proportionally higher secondary and tertiary completion among whites.
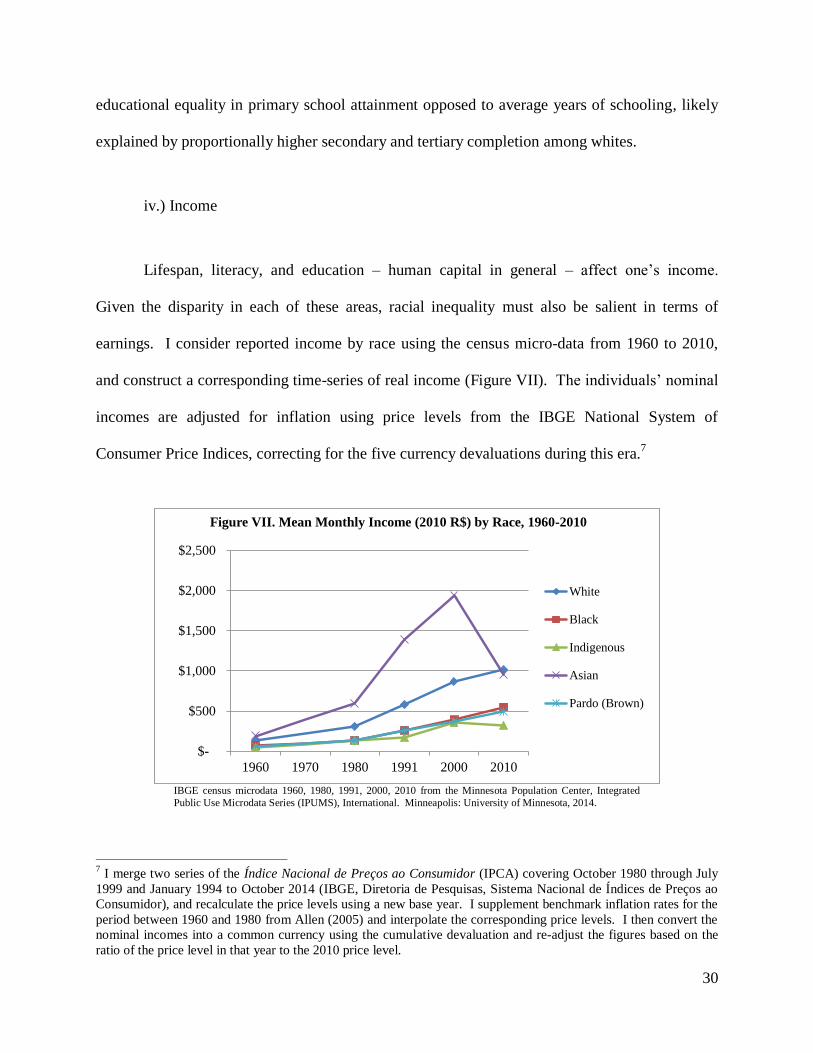
iv.) Income
Lifespan, literacy, and education – human capital in general – affect one’s income.
Given the disparity in each of these areas, racial inequality must also be salient in terms of
earnings. I consider reported income by race using the census micro-data from 1960 to 2010,
and construct a corresponding time-series of real income (Figure VII). The individuals’ nominal
incomes are adjusted for inflation using price levels from the IBGE National System of
Consumer Price Indices, correcting for the five currency devaluations during this era.7
$-
$500
$1,000
$1,500
$2,000
$2,500
1960 1970 1980 1991 2000 2010
Figure VII. Mean Monthly Income (2010 R$) by Race, 1960-2010
White
Black
Indigenous
Asian
Pardo (Brown)
IBGE census microdata 1960, 1980, 1991, 2000, 2010 from the Minnesota Population Center, Integrated
Public Use Microdata Series (IPUMS), International. Minneapolis: University of Minnesota, 2014.
7 I merge two series of the Índice Nacional de Preços ao Consumidor (IPCA) covering October 1980 through July
1999 and January 1994 to October 2014 (IBGE, Diretoria de Pesquisas, Sistema Nacional de Índices de Preços ao
Consumidor), and recalculate the price levels using a new base year. I supplement benchmark inflation rates for the
period between 1960 and 1980 from Allen (2005) and interpolate the corresponding price levels. I then convert the
nominal incomes into a common currency using the cumulative devaluation and re-adjust the figures based on the
ratio of the price level in that year to the 2010 price level.
31
The average real income and number of individuals reporting (in parentheses) in each
year are as follows: in 1960, $111 (2,073,823); in 1980, $236 (4,335,331); in 1991, $430
(6,429,425); in 2000, $645 (8,097,077); and in 2010, $749 ( 8,183,198). Figure VII reveals that
real incomes are strictly increasing over this fifty-year span, with two exceptions: between 2000
and 2010, there was an incredible 51% decline in the average income of Asians and a moderate
8% reduction in that of Indígenas. The situation of Asians deserves further investigation: they
are relatively few in numbers but between these years their share of the population doubled.
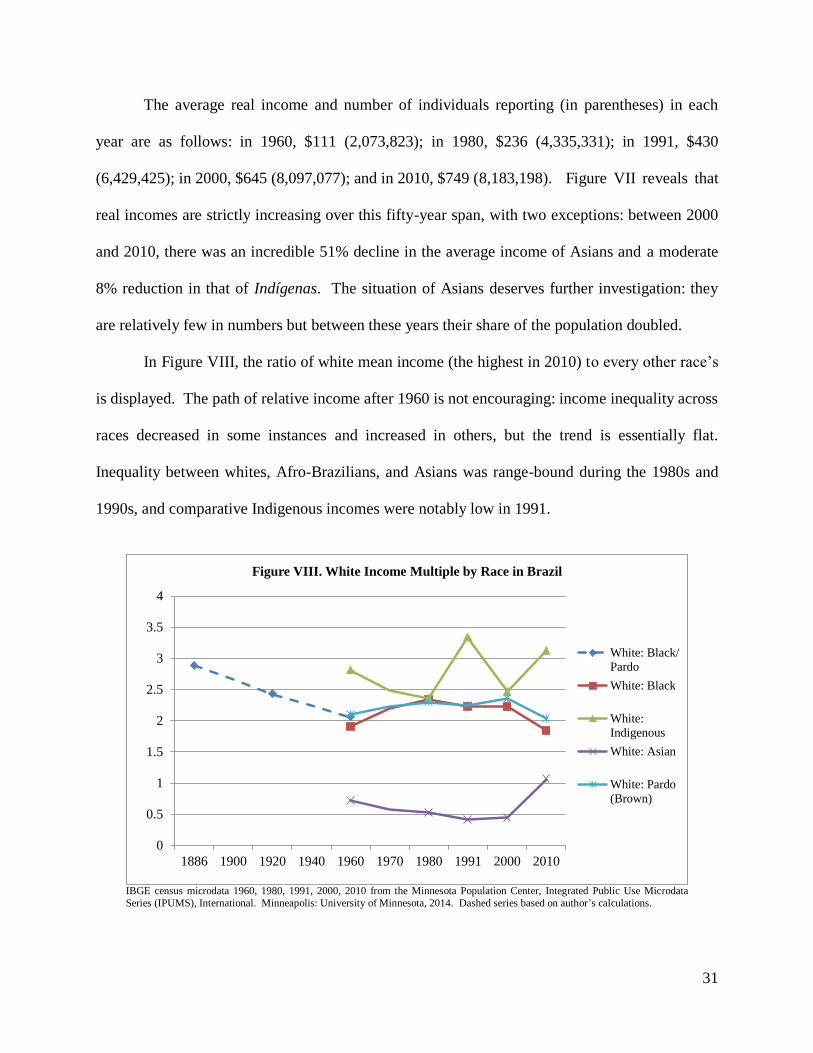
In Figure VIII, the ratio of white mean income (the highest in 2010) to every other race’s
is displayed. The path of relative income after 1960 is not encouraging: income inequality across
races decreased in some instances and increased in others, but the trend is essentially flat.
Inequality between whites, Afro-Brazilians, and Asians was range-bound during the 1980s and
1990s, and comparative Indigenous incomes were notably low in 1991.
0
0.5
1
1.5
2
2.5
3
3.5
4
1886 1900 1920 1940 1960 1970 1980 1991 2000 2010
Figure VIII. White Income Multiple by Race in Brazil
White: Black/
Pardo
White: Black
White:
Indigenous
White: Asian
White: Pardo
(Brown)
IBGE census microdata 1960, 1980, 1991, 2000, 2010 from the Minnesota Population Center, Integrated Public Use Microdata
Series (IPUMS), International. Minneapolis: University of Minnesota, 2014. Dashed series based on author’s calculations.
32
The white-Indigenous and white-Asian income ratios rose between 2000 and 2010, but
the main development is the fall in income inequality between whites and Afro-Brazilians, the
two predominant groups in Brazil. As LAESER (2010) confirms, the multiples of average per-
capita white to non-white household earnings for 1988, 1998, and 2008 were 2.31, 2.40, and
1.98, respectively.
The conjectured trend of white-to-Afro-Brazilian income from the slave era to 1960 is
also shown. In the preceding analysis, I calculated the slave ‘wage’ – in terms of goods and
services consumed – as a fraction of a free worker’s income: the average white worker could
earn 2.89 times more than a black or mulatto. I also examined the occupational distribution by
race in São Paulo in 1920 which, complemented by advertisements in the black press from
Domingues (2003), suggests that whites may have earned 2.43 times more than blacks or pardos.
The income gap, while large, appears to have just reached its smallest point ever, having eclipsed
the 1960 level based on developments during the past ten years.
V. Conclusion
Racial inequality has been getting a lot of attention lately, and for good reason: disparities
between white, black, mixed-race, Indigenous, and Asian individuals are large and persistent.
Whether the recent progress in health, education, income, and social inclusion will continue is
uncertain, but to see the future it is helpful to look to the past. Scholars have produced much
research on race in Brazil, but using disparate methods from which it is difficult to derive broad
conclusions. Neither statistics nor micro-histories are sufficient to understand the contours of
racial inequality in the long run, but when looked at together there are some interesting patterns.
33
The ‘Imperial Era’ (1822-1889) was characterized by the rapid expansion of the southern
coffee zone, peak in the Trans-Atlantic slave trade, abolitionist movement, and end of slavery
and, with it, empire. The period was also one of relatively informal racial relationships given the
Afro-Brazilian majority, over half of whom were free (conditions for slaves varied in urban and
rural settings). Life under the First Republic (1889-1930) was perhaps a disappointment for ex-
slaves: in the south, the new bargaining power of libertos was undercut by hundreds of thousands
of European immigrants; in other regions, freed slaves settled back into agricultural life or
sought poorly-remunerated employment in cities.
The Vargas Era (1930-1945) brought a meaningful improvement in the status of blacks,
opening up industrial positions from which they had previously been excluded. This was short-
lived, with repression of black organizations during the Estado Novo, followed by the economic
expansion of the Second Republic (1946-1964), and paralysis under Military Rule (1964-1985).
The past few decades have been a period of gains for Afro-Brazilians, and race has become
imbued with pride, but progress in the areas of higher education and economic mobility has been
mixed. The magnitude of racial disparities will undoubtedly continue to cycle, and more
knowledge of the nineteenth century is needed, but the general trajectory is positive.
34
Works Cited
Alden, Dauril. “The Population of Brazil in the Late Eighteenth Century: A Preliminary Study.”
Hispanic American Historical Review, 43.2 (1963): 173-205.
Andrews, George Reid. “Black and White Workers: São Paulo, Brazil, 1888-1928.” The
Hispanic American Historical Review, 68.3 (1988): 491-524.
Andrews, George Reid. Blacks & Whites in São Paulo, Brazil 1888-1988. Madison: U
Wisconsin Press, 1991.
Andrews, George Reid. “Black Political Protest in São Paulo, 1888-1988.” Journal of Latin
American Studies, 24.1 (1992): 141-171.
Arcand, Jean-Louis, and Béatrice D’Hombres. “Racial Discrimination in the Brazilian Labour
Market: Wage, Employment, and Segregation Effects.” Journal of International
Development, 16 (2004): 1053-1066.
Bailey, Stanley R.; Loveman, Mara; and Jeronimo O. Muniz. “Measures of ‘Race’ and the
Analysis of Racial Inequality in Brazil.” Social Science Research, 42.1 (2013): 106-119.
Bastide, Roger, and Florestan Fernandes. Brancos e negros em São Paulo. São Paulo:
Companhia Editora Nacional, 1959.
Bergad, Laird W. “After the Mining Boom: Demographic and Economic Aspects of Slavery in
Mariana, MG, 1750-1808.” Latin American Research Review, 31.1 (1996): 67-98.
Bethell, Leslie. The Abolition of the Brazilian Slave Trade: Britain, Brazil and the Slave Trade
Question, 1807-1869. Cambridge: Cambridge UP, 1970.
Bethell, Leslie and José Murilo de Carvalho. “1822-1850.” Brazil: Empire and Republic, 1822-
1930. Ed. Leslie Bethell. Cambridge: Cambridge UP, 1989. 45-112.
Boxer, C. R. The Golden Age of Brazil. Berkely: California UP, 1962.
Bucciferro, Justin R. “A Forced Hand: Natives, Africans, and the Population of Brazil, 1545-
1850.” Revista de Historia Económica/Journal of Iberian and Latin American Economic
History, 31.2 (2013): 285-317.
Cardoso, Fernando Henrique. Pensadores que inventaram o Brasil. São Paulo: Companhia das
Letras, 2013.
Charão, Cristina. “O longo combate às desigualdades raciais.” <http://www.ipea.gov.br/>
Conrad, Robert E. The Destruction of Brazilian Slavery, 1850-1888. Berkeley: U California P,
1972.
35
Dean, Warren. Rio Claro: A Brazilian Plantation System, 1820-1920. Stanford UP, 1976.
Degler, Carl N. Neither Black nor White: Slavery and Race Relations in Brazil and the United
States. New York: MacMillan, 1971.
Domingues, Petrônio. “Movimento Negro Brasileiro: alguns apontamentos históricos.” Tempo,
23 (2007): 100-122.
Domingues, Petrônio. “Decifrando os segredos internos: a transição do trabalho escravo para o
livre no Brasil.” Iberoamericana, 8.31 (2008a), 197-205.
Domingues, Petrônio. A nova abolição. São Paulo: Selo Negro, 2008b.
Fernandes, Florestan. A integração do negro na sociedade de classes. 2 vols. São Paulo:
Dominus, 1965.
Filho, Olavo Baptista. A Fazenda do Café em São Paulo. Rio de Janeiro: Ministério da
Agricultura, 1952.
Flory, Thomas. “Race and Social Control in Independent Brazil.” Journal of Latin American
Studies, 9.2 (1977): 199-224.
Freyre, Gilberto. The Master and the Slaves: A Study in the Development of Brazilian
Civilization. New York: Alfred A. Knopf, 1963 [1933].
Furtado, Celso. Formação econômica do Brasil. São Paulo: Companhia das Letras, 2006[1959].
Hall, Michael McDonald. “The Origins of Mass Immigration in Brazil, 1871-1914.” Doctoral
Thesis, Columbia University, 1969.
Harris, Marvin; Consorte, Josildeth Gomes; Lang, Joseph; and Bryan Byrne. “Who Are the
Whites?: Imposed Census Categories and the Racial Demography of Brazil.” Social
Forces, 72.2 (1993): 451-462.
Hasenbalg, Carlos Alfredo. “Race Relations in Post-Abolition Brazil: The Smooth Preservation
of Racial Inequalities.” Doctoral Thesis, UC-Berkeley, 1978.
Hasenbalg, Carlos and Graciela Salazar. “Perspectivas sobre raza y clase en Brasil.” Estudios
Sociológicos, 12.34 (1994): 75-99.
Hatton, Timothy J. and Jeffrey G. Williamson. “Latecomers to Mass Emigration: The Latin
Experience.” Migration and the International Labor Market, 1850-1939. Eds. Timothy J.
Hatton and Jeffrey G. Williamson. New York: Routledge, 1994. p. 55-71.
Ianni, Octavio. As metamorfoses do escravo: apogee e crise da escravatura no Brasil
Meridional. São Paulo: Difusão Européia do Livro, 1962.
36
Instituto Brasileiro de Geografia e Estatística. Brasil: 500 anos de povoamento. Rio de Janeiro:
IBGE, 2000.
Instituto Brasileiro de Geografia e Estatística. “Síntese de Indicadores Sociais: Uma Análise das
Condições de Vida da População Brasileira.” Estudos & Pesquisas 23 (2008): 209-230.
International Labor Organization. “Igualdade no Trabalho: enfrentando os desafios.” Geneva:
United Nations, 2007.
Jacino, Ramatis. “O negro no Mercado de trabalho em São Paulo pós-abolição - 1912/1920.”
Doctoral Thesis, Universidade de São Paulo, 2012.
Klein, Herbert S. “The Internal Slave Trade in Nineteenth Century Brazil: A Study of Slave
Importations into Rio de Janeiro in 1852.” Hispanic American Historical Review, 51.4
(1971): 567-585.
Klein, Herbert S. The Atlantic Slave Trade. Cambridge: Cambridge UP, 2010.
Klein, Herbert S. and Francisco V. Luna. Slavery in Brazil. New York: Cambridge UP, 2010.
Kodama, Kaori. “O sol nascente do Brasil: um balanço da imigração japonesa.” Brasil: 500
anos de povoamento. Rio de Janeiro: IBGE, 2007. 199-213.
Laboratório de Análises Econômicas, Históricas, Sociais e Estatísticas das Relações Raciais.
Relatório Annual das Desigualdades Raciais no Brasil; 2009-2010. Rio de Janeiro:
UFRJ, 2010.
Leff, Nathaniel H. Underdevelopment and Development in Brazil. Vol. 1. London: George
Allen & Unwin, 1982.
Loury, Glenn C. The Anatomy of Racial Inequality. Cambridge: Harvard UP, 2002.
Lovell, Peggy A. “Development and the Persistence of Racial Inequality in Brazil: 1950-1991.”
The Journal of the Developing Areas, 33.3 (1999): 395-418.
Luna, Francisco V. and Herbert S. Klein. “Slave Economy and Society in Minas Gerais and São
Paulo, Brazil in 1830.” Journal of Latin American Studies, 36 (2004): 1-28.
Marteleto, Leticia J. “Educational Inequality by Race in Brazil, 1982-2007: Structural Changes
and Shifts in Racial Classification.” Demography, 49 (2012): 337-358.
Mello, Pedro Carvalho de. “The Economics of Labor in Brazilian Coffee Plantations, 1850-
1888.” Doctoral Thesis, University of Chicago, 1977.
Merrick, Thomas W., and Douglas H. Graham. Population and Economic Development in
Brazil: 1800 to the Present. Baltimore: Johns Hopkins UP, 1979.
37
Monsma, Karl. “Symbolic Conflicts, Deadly Consequences: Fights between Italians and Blacks
in Western São Paulo, 1888-1914.” Journal of Social History, (2006): 1123-1152.
Musacchio, Aldo; Fritscher, André Martínez; and Martina Viarengo. “Colonial Institutions,
Trade Shocks, and the Diffusion of Elementary Education in Brazil, 1889-1930.”
Journal of Economic History, 74.3 (2014): 730-766.
Nascimento, Abdias do. “The African Experience in Brazil.” African Presence in the Americas.
Ed. Carlos Moore. Trenton: Africa World P, 1995.
Pierson, Donald. Negroes in Brazil: A Study of Race Contact at Bahia. U Chicago P, 1942.
Ribeiro, Darcy. O povo brasileiro. São Paulo: Companhia das Letras, 1995.
Russell-Wood, A. J. R. The Black Man in Slavery and Freedom in Colonial Brazil. London:
MacMillan, 1982.
Silva, Graziella Moraes, and Luciana T. de Souza Leão. “O paradox da mistura: identidades,
desigualdades e percepção de discriminação entre brasileiros pardos.” RBCS, 27.80
(2012): 117-255.
Silva, Nelson do Valle. “Updating the Cost of Not Being White in Brazil.” Pierre-Michel
Fontaine, Ed. Race, Class, and Power in Brazil. Los Angeles: UCLA, 1985.
Silva, Nelson do Valle. “Race, Poverty, and Social Exclusion in Brazil.” Social Exclusion and
Poverty Reduction in Latin America and the Caribbean. Gacitúa, Sojo, and Davis, Eds.
Washington D.C.: World Bank, 2001.
Soares, Sebastião Ferreira. Notas Estatísticas sobre a Produção Agrícola e Carestia dos Géneros
Alimentícios no Império do Brazil. Rio de Janeiro: 1860.
Stein, Stanley. Vassouras: A Brazilian Coffee County, 1850-1900. Cambridge: Harvard, 1957.
Taunay, Affonso de E. Historia do Café no Brasil. 2 Vol. Rio de Janeiro: Departamento
Nacional do Café, 1939.
Telles, Edward E. “Racial Ambiguity Among the Brazilian Population.” UCLA Working Paper,
1995.
Trans-Atlantic Slave Trade Database. <www.slavevoyages.org> (accessed 11/2014).
Williamson, Jeffrey G. “The Evolution of Global Labor Markets since 1830: Background
Evidence and Hypotheses.” Explorations in Economic History, 32 (1995): 141-196.
Wood, Charles H.; Alberto, José; and Magno de Carvalho. The Demography of Inequality in
Brazil. Cambridge: Cambridge UP, 1988.