Embed Size (px)
Citation preview
Marijuana
In the States
2012 Analysis and Detailed Data on
Marijuana Use and Arrests
July 30, 2014
Jon Gettman, Ph.D.
Criminal Justice
College of Arts and Sciences
Shenandoah University
Winchester, Virginia 22601
Table of Contents
About the Author 2 Related Publications 2 Acknowledgements and Publication Data 2 Executive Summary 3 Introduction 4 Part 1. National Trend 7 Part 2. Marijuana Use in the States 11 Part 3. Marijuana Arrests in the States 14 Conclusion 24 Appendix 25
List of Tables
Table 1. Top 15 States Annual Marijuana Use (2010 - 2011) 11 Table 2. Top 15 States Marijuana Arrest Rate per 100,000 Population (2012) 15 Table 3. Top 15 States Marijuana Arrests as a Percentage of Annual Users (2012) 17 Table 4. Top 15 States Annual Percentage Increases in Marijuana Arrests (2008 - 2012) 19 Table 5. Top 17 States Annual Percentage Increases in Marijuana Arrest Rates (2008 – 2012) 19 Table 6. Top 15 States Annual Percentage Decreases in Marijuana Arrest Rates (2008 - 2012) 21 Table 7. Comparison of Arrest Rate and Annual Use Trends (2008 – 2012) 23
List of Figures
Figure 1. Annual Marijuana Use Population Estimates, by Age (1990 - 2012) 8 Figure 2. Annual US Marijuana Use and Arrest Rate (1990 – 2012) 9 Figure 3. Marijuana Arrest Rate per 100,000 Population (2012) 16 Figure 4. Annual Change in Marijuana Arrest Rate per 100,000 Population (2008 - 2012) 20
Appendix
Table A1. Marijuana Arrests and Arrest Rates per 100,000 Population, (1981 – 2012) 26 Table A2. Annual Marijuana Use in the United States, Population Estimates (1990 – 2012) 27 Table A3. Annual Marijuana Use (2010 - 2011) 28 Table A4. Monthly Marijuana Use (2010 – 2011) 29 Table A5. Annual Marijuana Use Prevalence (Age 12 and older), (2002 – 2011) 30 Table A6. Annual Marijuana Use Populations (Age 12 and older) (2002 -2011) 31 Table A7. Perception of Great Risk Using Marijuana 1-2 Times per Week (2010 – 2011) 32 Table A8. Marijuana is Fairly or Very Easy to Obtain (2010 – 2011) 33 Table A9. Marijuana Arrests as a Percentage of All Drug Arrests, by State (2008 – 2012) 34 Table A10. Marijuana Arrests by State (2008 – 2012) 35 Table A11. Marijuana Arrests as a Percentage of Annual Marijuana Users (2008 – 2011) 36 Table A12. Marijuana Possession Arrests by State (2008 – 2012) 37 Table A13. Marijuana Sales Arrests by State (2008 – 2012) 38 Table A14. Marijuana Arrest Rate, by State, per 100,000 Population (2008 – 2012) 39 Table A15. Marijuana Possession Arrest Rate, by State, per 100,000 Population (2008 – 2012) 40 Table A16. Marijuana Sales Arrest Rate, by State, per 100,000 Population (2008 – 2012) 41 Table A17. Juvenile Marijuana Arrests, by State (2008 – 2012) 42 Table A18. Juvenile Marijuana Arrests Rates, by State (2008 – 2012) 43 Table A19. Comparison of Selected Characteristics from Prior Tables 44
Marijuana in the States 2012
Page 1
About the Author
Jon Gettman is an assistant professor in criminal justice at Shenandoah University. E-mail: [email protected]
Related publications by or co-authored by Jon Gettman
Gettman, Jon. (2005) Crimes of Indiscretion: Marijuana arrests in the United States. National Organization for the Reform of Marijuana Laws. http://www.regulatingcannabis.com/#!publications/c21ed
Gettman, Jon. (2006) Marijuana Production in the United States (2006). Bulletin of Cannabis Reform. http://www.regulatingcannabis.com/#!publications/c21ed
Gettman, Jon. (2007) Lost Taxes and other Costs of Marijuana Laws. Bulletin of Cannabis Reform. http://www.regulatingcannabis.com/#!publications/c21ed
Gettman, Jon. (2009) Marijuana Arrests in the United States (2007) Bulletin of Cannabis Reform. http://www.regulatingcannabis.com/#!publications/c21ed
Gettman, Jon and Kennedy, Michael. (2014) Cannabis Regulation and the Public Interest. RegulatingCannabis.com. http://www.regulatingcannabis.com/
Levine, Harry G., Gettman, Jon B., Siegel, Loren. (2012) 240,000 Marijuana Arrests Cost, Conseguences and Racial Disparities of Possession Arrests in Washington, 1986-2010. Marijuana Arrest Research Project. http://www.regulatingcannabis.com/#!publications/c21ed
Levine, Harry G., Gettman, Jon B., Siegel, Loren. (2010) Arresting Latinos for Marijuana in California Possession Arrests in 33 cities 2006-08. Drug Policy Alliance. http://www.regulatingcannabis.com/#!publications/c21ed
Levine, Harry G., Gettman, Jon B., Siegel, Loren. (2012) 210,000 Marijuana Possession Arrests in Colorado 1986-2010. Marijuana Arrest Research Project. http://www.regulatingcannabis.com/#!publications/c21ed
Levine, Harry G., Gettman, Jon B., Siegel, Loren. (2010) Arresting Blacks for Marijuana in California: Posession Arrests in 25 Cities, 2006-08. http://www.regulatingcannabis.com/#!publications/c21ed
Levine, Harry G., Gettman, Jon B., Siegel, Loren. (2010) Targeting Blacks for Marijuana Possession Arrests of African Americans in California, 2004-08. http://www.regulatingcannabis.com/#!publications/c21ed
Data supplied by Jon Gettman
American Civil Liberties Union. (2013) The War on Marijuana in Black and White. https://www.aclu.org/criminal-law-reform/war-marijuana-black-and-white-report
Acknowledgements and Publication Data
The Trans-High Corporation provided funding for this research presented in this report.
This report is published online at: http://www.regulatingcannabis.com/
© 2014 by Jon B. Gettman
Marijuana in the States 2012
Page 2
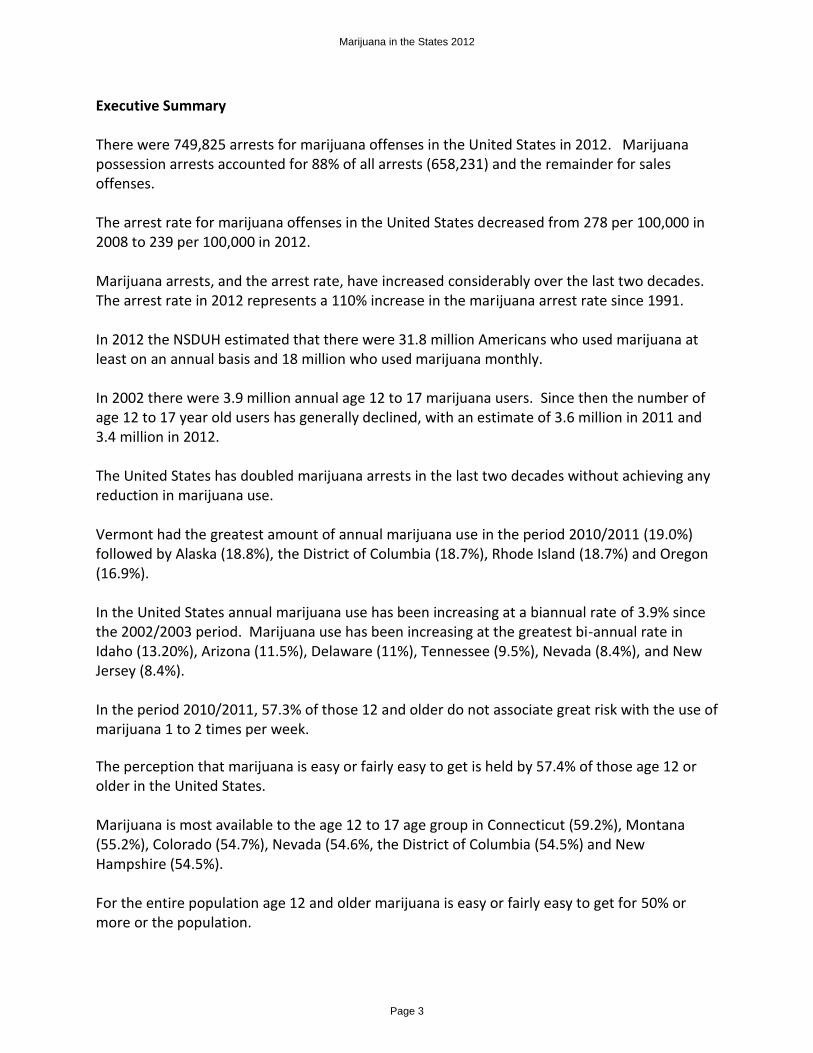
Executive Summary There were 749,825 arrests for marijuana offenses in the United States in 2012. Marijuana possession arrests accounted for 88% of all arrests (658,231) and the remainder for sales offenses. The arrest rate for marijuana offenses in the United States decreased from 278 per 100,000 in 2008 to 239 per 100,000 in 2012. Marijuana arrests, and the arrest rate, have increased considerably over the last two decades. The arrest rate in 2012 represents a 110% increase in the marijuana arrest rate since 1991. In 2012 the NSDUH estimated that there were 31.8 million Americans who used marijuana at least on an annual basis and 18 million who used marijuana monthly. In 2002 there were 3.9 million annual age 12 to 17 marijuana users. Since then the number of age 12 to 17 year old users has generally declined, with an estimate of 3.6 million in 2011 and 3.4 million in 2012. The United States has doubled marijuana arrests in the last two decades without achieving any reduction in marijuana use. Vermont had the greatest amount of annual marijuana use in the period 2010/2011 (19.0%) followed by Alaska (18.8%), the District of Columbia (18.7%), Rhode Island (18.7%) and Oregon (16.9%). In the United States annual marijuana use has been increasing at a biannual rate of 3.9% since the 2002/2003 period. Marijuana use has been increasing at the greatest bi-annual rate in Idaho (13.20%), Arizona (11.5%), Delaware (11%), Tennessee (9.5%), Nevada (8.4%), and New Jersey (8.4%). In the period 2010/2011, 57.3% of those 12 and older do not associate great risk with the use of marijuana 1 to 2 times per week.
The perception that marijuana is easy or fairly easy to get is held by 57.4% of those age 12 or older in the United States. Marijuana is most available to the age 12 to 17 age group in Connecticut (59.2%), Montana (55.2%), Colorado (54.7%), Nevada (54.6%, the District of Columbia (54.5%) and New Hampshire (54.5%). For the entire population age 12 and older marijuana is easy or fairly easy to get for 50% or more or the population.
Marijuana in the States 2012
Page 3
After more than 19 million arrests since 1981 marijuana is widely used, not perceived as a great risk by a majority of the population, and widely available. Arrests for marijuana account for 48.3% of all drug arrests in the United States. Marijuana arrests accounted for two-thirds of more of all drug arrests in five states: Nebraska (74.1%), New Hampshire (72%), Montana (70.3%), Wyoming (68.7%) and Wisconsin (67.1%)
The five state-level jurisdictions with the highest arrest rates for marijuana offenses are the District of Columbia (729), New York (577), Louisiana (451), Illinois (447) and Nebraska (421). The lowest marijuana arrest rates are in California and Massachusetts. Aside from these states the lowest arrest rates are in Alaska (127), Hawaii (109), Washington (105), Connecticut (104) and Alabama (75). Nationally, only 2.8% of marijuana users were arrested in 2010/2011. The arrest percentage of all users varied from 1% or less in Hawaii, Montana, Vermont, and Massachusetts to 5% or more in Wyoming, Nebraska, Maryland, New York, and Louisiana. The average annual change in the national arrest rate for marijuana in the United States from 2008 to 2012 was -3.8%. From 2008 to 2012 seventeen states had average annual increases in the marijuana arrest rate of 1% or more. Of these 17 jurisdictions, 12 had an annual increase greater than 2% and 8 greater than 3% per year. They account for 28.8% of the population of the United States and 44.6% of the arrests for marijuana offenses. From 2008 to 2012, fourteen states had average annual reductions in the marijuana arrest rate of 4% or more. These states account for 34.4% of the population of the United States and 19.5% of all marijuana arrests.
Marijuana in the States 2012
Page 4
Introduction This report reviews national trends in marijuana use and marijuana arrests, followed by a look at these same issues at the state level. It is the latest by the author in a number of reports on marijuana arrests in the United States, including similar reports in 2005 and 2009. The 2009 report addressed data through 2007. This report covers data from 2008 to 2012. The most significant developments, with respect to the data presented and reviewed by these reports, is that marijuana use and marijuana arrests both continue to increase. State level data on marijuana use and marijuana arrests is important to the public review and discussion of the marijuana related issues, including but not limited to local, state, and national laws about marijuana’s use and sales. Such data is rarely available to the public in an easily accessible and/or comprehensive presentation. This report provides highlights and discussion of relevant data on these topics, as well as detailed tables provided in its appendix. The primary source for data on marijuana use in the United States is the National Survey on Drug Use and Health (NSDUH), conducted by the Substance Abuse and Mental Health Services Administration (SAMHSA) of the Department of Health and Human Services. Some, but not all, data from this annual survey is available on the agency’s website. The NSDUH is primarily a national survey. SAMSHA has developed a statistical model for providing estimates of state level data. Because of the sample size of the national survey the state level data is based on a two year period, in order to provide statistically accurate estimates. The most recent NSDUH data is for the two year period 2010/2011. In addition to state level data on annual and monthly marijuana use prevalence (percentage) and population estimates, the state level NSDUH data on risk perception and the perceived availability of marijuana is also presented in this report. The primary source for data on marijuana arrests in the United States is the Uniform Crime Reporting Program (UCR), conducted by the Federal Bureau of Investigation (FBI). The UCR program makes two important data sets available. The county level data set contains estimates of arrests for a number of crimes, including marijuana sales and possession, along with the population coverage of the reporting agencies in each county. The age/sex/race data set contains demographic data on arrests at the local agency level. The county level data set has been used to provide data for this report; the county level data has been aggregated to provide state level totals of arrests and the total populations of the reporting jurisdictions have been used to calculate arrest rates per 100,000 residents in the population. However, not all states report data to the UCR program. Data for Alabama, the District of Columbia (Washington, D.C.), and Illinois has been obtained directly from their respective criminal justice statistic agencies. Florida does not report data to the UCR program nor does it collect or report data on marijuana arrests from county and/or local agencies. As indicated above marijuana use data is reported in terms of prevalence (percentage) and population; data on risk perception and availability perception is presented in terms of prevalence only. Marijuana arrest data is presented in terms of the number of arrests and the
Marijuana in the States 2012
Page 5
arrest rate per 100,000 residents. In addition to these common indicators other statistical indicators have been prepared. The average annual change for the five year period addressed by this report (2008 to 2012) is provided for both arrest and usage data. (For the District of Columbia and Illinois the period 2008 to 2011 is used, and for Wyoming arrest data is only available for 2010 to 2012). Data for the two year periods 2008/2009 and 2010/2011 have been used to calculate the percentage of annual marijuana users arrested in each state. Also, the marijuana arrests as a percentage of all drug arrests is also provided for each state-level jurisdiction, as well as data on juvenile arrests and arrest rates for marijuana offenses. A comparison chart summarizing several of these indicators, including the respective ranking of each state, is included in the Appendix.
Marijuana in the States 2012
Page 6
Part 1. National Trends There were 749,825 arrests for marijuana offenses in the United States in 2012. Marijuana possession arrests accounted for 88% of all arrests (658,231) and the remainder for sales offenses. Overall this is a modest reduction in the number of arrests. In 2007 arrests peaked at 872,720 and despite a slight increase in 2009 marijuana arrests have decreased each year since. The 2012 figures were a 10% decrease from the 837,294 arrests in 2012. It would seem that marijuana arrests in the United States are decreasing, but this is not an accurate assessment when it comes to the law enforcement activity in all the states. A review of state level data and trends in Part 2 (below), however, both accounts for this reduction and provides a more accurate basis for assessing state-level law enforcement trends. Nonetheless, at the national level the arrest rate for marijuana offenses in the United States decreased from 278 per 100,000 in 2008 to 239 per 100,000 in 2012. In 1991 there were 287,850 marijuana arrests in the United States, the lowest amount since 1981. The arrest rate in 1991 was 114. The arrest rate in 2012 represents a 110% increase in the marijuana arrest rate since 1991. The average arrest rate from 1990 to 1994 was 149. Marijuana arrests, and the arrest rate, have increased considerably over the last two decades. Interestingly, and quite important to note, marijuana use has also increased markedly in the last 20 years. In 2012 the NSDUH estimated that there were 31.8 million Americans who used marijuana at least on an annual basis and 18 million who used marijuana monthly. The annual figures include 3.5 million users between the ages of 12 and 17, 10.7 million between the ages of 18 and 25, and 16.1 million age 26 and older. The changes in these three age groups over time are visible in Figure 1.
Marijuana in the States 2012
Page 7
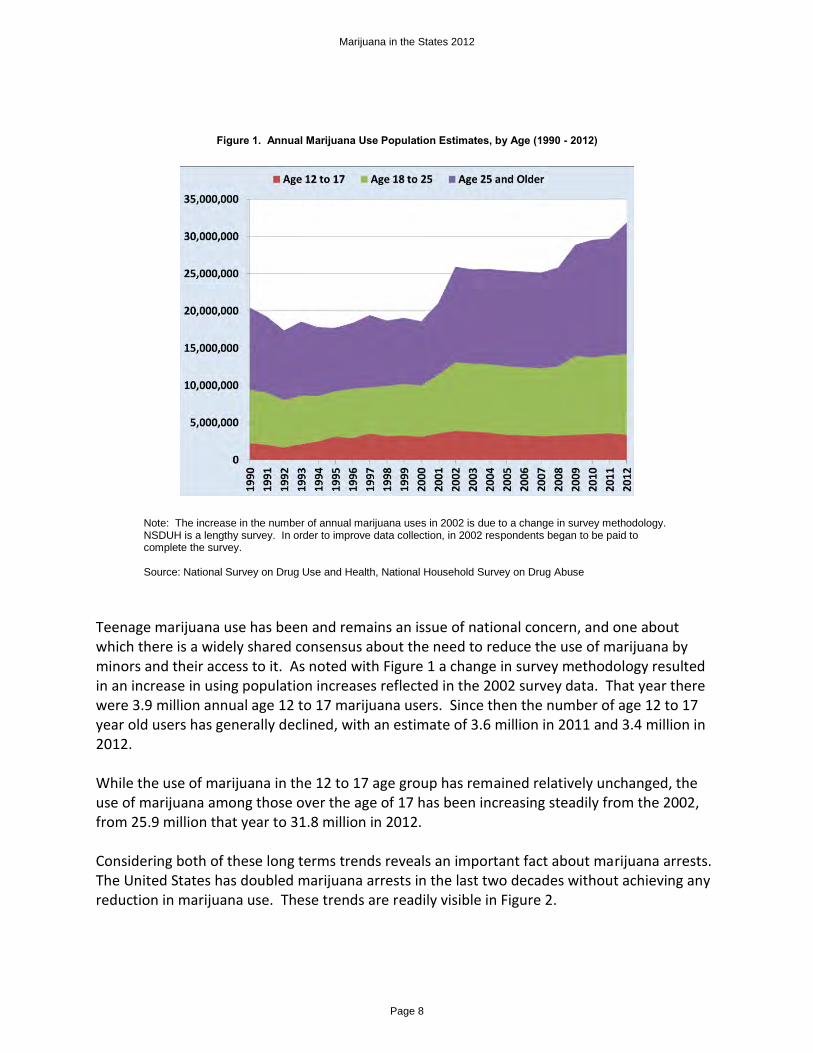
Figure 1. Annual Marijuana Use Population Estimates, by Age (1990 - 2012)
Note: The increase in the number of annual marijuana uses in 2002 is due to a change in survey methodology. NSDUH is a lengthy survey. In order to improve data collection, in 2002 respondents began to be paid to complete the survey. Source: National Survey on Drug Use and Health, National Household Survey on Drug Abuse
Teenage marijuana use has been and remains an issue of national concern, and one about which there is a widely shared consensus about the need to reduce the use of marijuana by minors and their access to it. As noted with Figure 1 a change in survey methodology resulted in an increase in using population increases reflected in the 2002 survey data. That year there were 3.9 million annual age 12 to 17 marijuana users. Since then the number of age 12 to 17 year old users has generally declined, with an estimate of 3.6 million in 2011 and 3.4 million in 2012. While the use of marijuana in the 12 to 17 age group has remained relatively unchanged, the use of marijuana among those over the age of 17 has been increasing steadily from the 2002, from 25.9 million that year to 31.8 million in 2012. Considering both of these long terms trends reveals an important fact about marijuana arrests. The United States has doubled marijuana arrests in the last two decades without achieving any reduction in marijuana use. These trends are readily visible in Figure 2.
Marijuana in the States 2012
Page 8
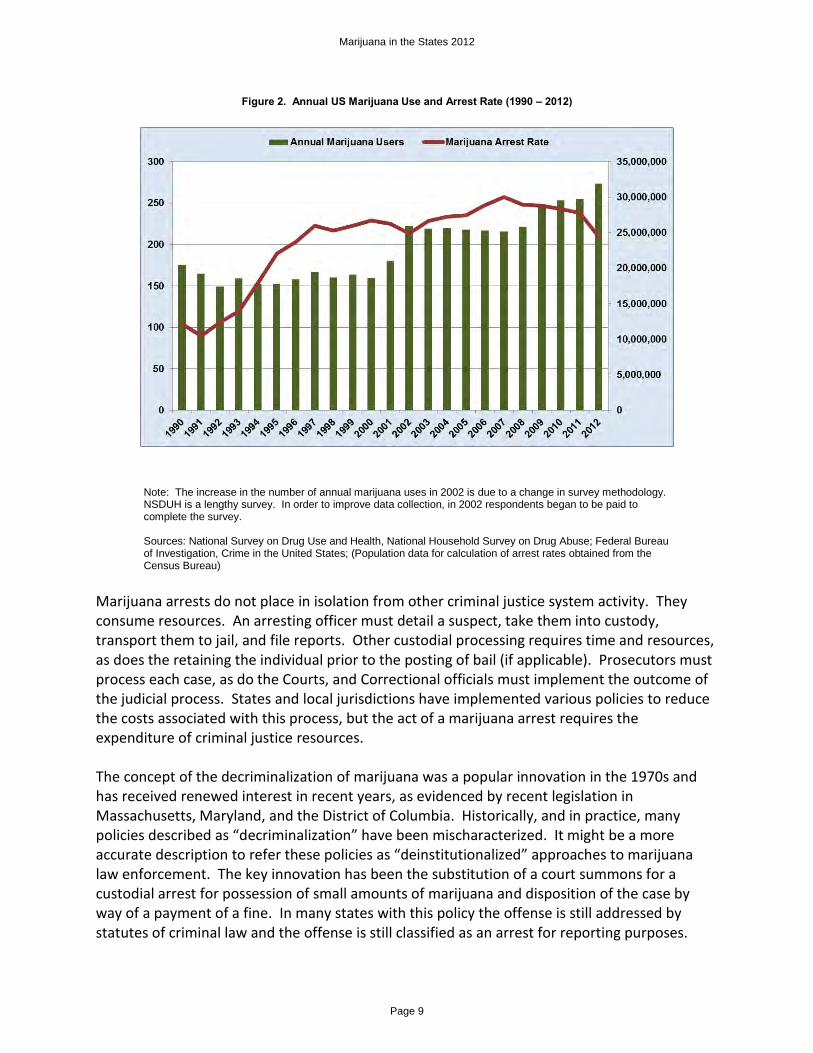
Figure 2. Annual US Marijuana Use and Arrest Rate (1990 – 2012)
Note: The increase in the number of annual marijuana uses in 2002 is due to a change in survey methodology. NSDUH is a lengthy survey. In order to improve data collection, in 2002 respondents began to be paid to complete the survey. Sources: National Survey on Drug Use and Health, National Household Survey on Drug Abuse; Federal Bureau of Investigation, Crime in the United States; (Population data for calculation of arrest rates obtained from the Census Bureau)
Marijuana arrests do not place in isolation from other criminal justice system activity. They consume resources. An arresting officer must detail a suspect, take them into custody, transport them to jail, and file reports. Other custodial processing requires time and resources, as does the retaining the individual prior to the posting of bail (if applicable). Prosecutors must process each case, as do the Courts, and Correctional officials must implement the outcome of the judicial process. States and local jurisdictions have implemented various policies to reduce the costs associated with this process, but the act of a marijuana arrest requires the expenditure of criminal justice resources. The concept of the decriminalization of marijuana was a popular innovation in the 1970s and has received renewed interest in recent years, as evidenced by recent legislation in Massachusetts, Maryland, and the District of Columbia. Historically, and in practice, many policies described as “decriminalization” have been mischaracterized. It might be a more accurate description to refer these policies as “deinstitutionalized” approaches to marijuana law enforcement. The key innovation has been the substitution of a court summons for a custodial arrest for possession of small amounts of marijuana and disposition of the case by way of a payment of a fine. In many states with this policy the offense is still addressed by statutes of criminal law and the offense is still classified as an arrest for reporting purposes.
Marijuana in the States 2012
Page 9
California recently changed their marijuana laws from this sort of deinstitutionalization approach to a literal decriminalization policy by making marijuana possession a civil rather than a criminal offense. Massachusetts, Maryland, and the District of Columbia have also recently adopted the true decriminalization approach of making marijuana possession a civil offense, sanctioned by a citation and a fine (just like a parking ticket.) Both these approaches to reforming marijuana law enforcement are a response to the fiscal and social costs of criminalizing marijuana use. Recent attention to racial disparities in arrest rates for marijuana possession has been a significant factor in the passage of marijuana decriminalization in both Maryland and the District of Columbia. Many other states, over the last several decades, have addressed the cost of enforcing marijuana laws through sentencing reform or by way of prosecutorial or judicial discretion. The result is that many marijuana possession cases are resolved through plea bargains that result in probation and/or payment of a fine. Many plea bargains also result in mandatory drug treatment for the offender, whether medically justified or not. According to the Treatment Episodes Data Set, also maintained by SAMHSA, nationally 51.6% of all treatment program admissions where marijuana use is the primary issue are referrals from the criminal justice system. The significance of these various trends is two-fold. Marijuana law enforcement is expensive for both the government and the individual. Government has historically preferred to mitigate these costs through legal or policy innovations that retain the perceived and symbolic deterrent value of marijuana’s illegality. Marijuana users have preferred to mitigate the costs of potential arrest through greater use of personal discretion to avoid situations where they are at risk of arrest. In addition, the public in general and marijuana users in particular have become increasingly active and effective in changing, and in some states such as Colorado and Washington, eliminating penalties for marijuana possession and replacing them with a legal, regulatory approach to public policy interests. However, absent such changes in local and federal law, there is little evidence that any state can sustain, financially or politically, the costs of further significant increases in marijuana arrest rates. Marijuana use and enforcement trends in the states vary widely. The variance in these indicators is testament to the utter incoherence of marijuana prohibition as an instrument of national policy. In public administration coherence refers to the ability of each part of an institution to contribute to accomplishing the goals and objectives of the organization or association. The success of prohibition at the national level requires the enthusiastic embrace of this policy at the state and local level; this is the nature of criminal law enforcement in the United States. The ongoing dissolution of prohibition is evident in the increasing disparities in marijuana law enforcement in the United States and the accompanying patterns of marijuana availability and use.
Marijuana in the States 2012
Page 10
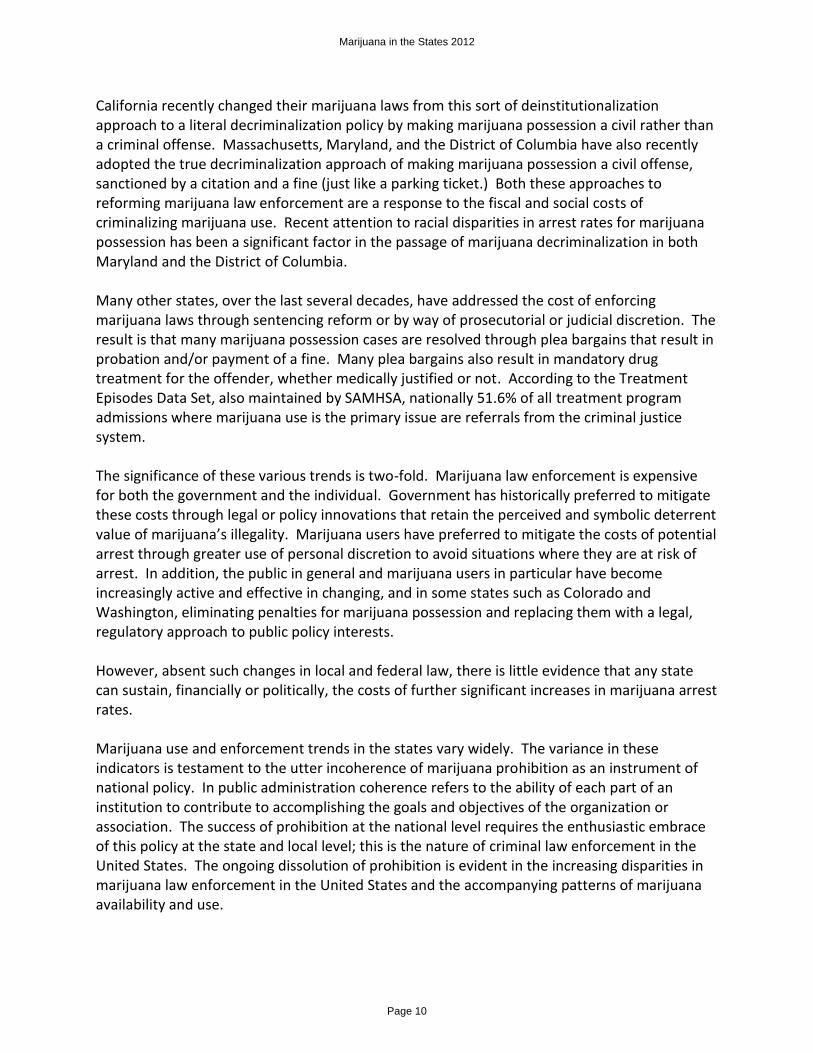
Part 2. Marijuana Use in the States Marijuana use has consistently been greater in the United States in New England, Colorado, and in the Western coastal states. While the prevalence of annual marijuana in the United States is the period of 2010/2011 was 11.6% of the population age 12 and older in the top 15 states annual use was at a prevalence of 13.5% or greater. See Table 1 below. Vermont had the greatest amount of annual marijuana use (19.0%) followed by Alaska (18.8%), the District of Columbia (18.7%), Rhode Island (18.7%) and Oregon (16.9%). All of the other New England states are in the top 15: Massachusetts (15.3%) Maine (14.0%, New Hampshire (13.7%) and Connecticut (13.4%). Colorado (16.8%) and Montana (16.3%) are ranked 6th and 7th respectively. In the other far Western states annual marijuana use in Oregon is at 16.9%, followed by 15.5% in Washington and 14.2% in California. The top 15 also include Nevada (13.7%) and Michigan (13.6%). All of these states have adopted significant reform in marijuana laws with respect to medical and/or “recreational” marijuana use.
Table 1. Top 15 States Annual Marijuana Use (2010 - 2011)
Age 12-17 Years Old
Age 18-25 Years Old
Age 26 and
Older
Age 12 and
Older United States 14.1% 30.5% 8.0% 11.6% Vermont 23.2% 47.3% 13.5% 19.0% Alaska 17.6% 39.3% 15.0% 18.8% District of Columbia 18.9% 38.1% 14.3% 18.7% Rhode Island 17.1% 45.1% 13.8% 18.7% Oregon 18.2% 40.5% 12.9% 16.9% Colorado 19.8% 42.9% 11.9% 16.8% Montana 21.5% 37.6% 12.0% 16.3% Washington 17.9% 40.7% 11.1% 15.5% Massachusetts 19.8% 43.9% 9.8% 15.3% California 16.8% 32.6% 10.3% 14.2% Maine 13.7% 38.2% 10.6% 14.0% Nevada 17.4% 31.3% 10.5% 13.7% New Hampshire 20.2% 42.4% 8.3% 13.7% Michigan 14.3% 33.7% 10.0% 13.6% Connecticut 17.6% 36.6% 9.1% 13.4%
Source: National Survey on Drug Use and Health: 2-Year R-DAS (2010 to 2011). Analysis ran on 2014-07-16 (01:35 PM EDT) using SDA 3.5: Tables.
The appendix contains tables with prevalence and population estimates for both annual and monthly marijuana use for each state for the period of 2010/2011 (See Tables A3 and A4.) A review of the overall prevalence of annual use for the two year periods from 2002/2003 to 2010/2011 is provided in Table A5. A review of the population estimates for these same periods is contained in Table A6, which also contains the biannual rate of change over this ten year span. (The rates of change in marijuana use over this span for all states except Florida are also provided in Table 7, which is presented in discussed in Part 3 below.)
Marijuana in the States 2012
Page 11
In the United States annual marijuana use has been increasing at a biannual rate of 3.9% since the 2002/2003 period. Marijuana use has been increasing at the greatest bi-annual rate in Idaho (13.20%), Arizona (11.5%), Delaware (11%), Tennessee (9.5%), Nevada (8.4%), New Jersey (8.4%), the District of Columbia (7.9%), California (7.3%), North Carolina (7.2%), Alaska (6.9%), South Carolina (6.9%), Texas (6.7%), Mississippi (6.3%), Washington (6.2%) and Connecticut (5.8%). One of the key indicators in understanding marijuana use over the last several decades has been survey results regarding the perception of risk associated with the regular use of marijuana. There has consistently been a strong negative correlation between the prevalence of high levels of great risk perception and the prevalence of marijuana use. Many policy makers have thus believed that the key to reducing marijuana use in the United States is to convince the public that such use is harmful. The extent to which this policy aim reconciles with scientific evidence, public knowledge, and individual experience is beyond the scope of this report; however the persistence of marijuana use and trends in marijuana usage suggest that this approach has had about as much success as the use of arrests to deter marijuana use. In the 2010/2011 NSDUH data the perception of great risk associated with using marijuana 1 or 2 times per week was held by 45.0% of those age 12 to 17, 26.3% of those age 18 to 25, and 45.2% of those 26 and older. For all three groups combined the perception of great risk was held by 42.7% of the populations. In other words, 57.3% of those 12 and older do not associate great risk with the use of marijuana 1 to 2 times per week. The data for all three groups, and all three combined, for this indicator is presented in Table A7. All states follow the same pattern in which risk perception is highest among the 12 to 17 age group and lowest among those age 18 to 25. Total risk perception ranges from a low of 27.6% in Alaska to a high of 56.4% in Utah. The five states with the highest risk perception are Utah (56.4%), Mississippi (53.5%), Alabama (49.4%), Louisiana (49.2%) and West Virginia (48.8%). The five areas with the lowest levels of risk perception are Maine (32%), the District of Columbia (31.1%), Oregon (30.3%), Colorado (29.6%), and Alaska (27.6%). Thus, in only 2 states do a majority of those age 12 and older believe that the use of marijuana 1 to 2 times a week presents a great risk. On the other hand, in 15 states 60% of more believe that such use does not present a great risk. The perception that marijuana is easy or fairly easy to get is held by 57.4% of those age 12 or older in the United States (see Table A8). The indicator of marijuana’s availability is lowest among those age 12 and older (48.3%) and highest among those age 18 to 25 (75.4%). Availability has a high positive correlation with marijuana use. Marijuana is most available to the 12 to 17 age group in Connecticut (59.2%), Montana (55.2%), Colorado (54.7%), Nevada (54.6%, the District of Columbia (54.5%) and New Hampshire (54.5%). It is least available in North Dakota (41.1%), Iowa (40.8%), Kansas (40.3%), Utah (39.4%) and Arkansas (38.7%). Marijuana is easy or fairly easy to 50% or more of those age 12 to 17 in 22 states, and to 40% and more in every area except Utah and Arkansas.
Marijuana in the States 2012
Page 12
For the 18 to 25 age group the availability indicator ranges from a low of 61.4% in Utah to a high of 85.7% in New Hampshire. It is at about 80% or higher in 12 state level areas and between 70% and 80% in 34 states. For the entire population age 12 and older marijuana is easy or fairly easy to get for 50% or more or the population. The range is from 50.4% in Florida to 69.5% in Vermont. After more than 19 million arrests since 1981 marijuana is widely used, not perceived as a great risk by a majority of the population, and widely available.
Marijuana in the States 2012
Page 13
Part 3. Marijuana Arrests in the States Arrests for marijuana account for 48.3% of all drug arrests in the United States. This figure was at 49.8% in 2008, increased yearly to a level of 54.7% in 2011 before dropping to the current level in 2012. The total number of drug arrests rose to over 1.5 million in 1996, rose to about 1.9 million in 2006 before declining in the last several years to its current level of 1,552,432. Marijuana’s share of all drug arrests sharply declined in the early 1980s, from 67.4% in 1982 to 29.3% in 1898, displaced in part by the emergence of crack cocaine as a major focus of anti-drug law enforcement. It then began to rise steadily to a level of 46.5% in 2000, declined over the following years to 42.6% in 2005, and then began to rise steadily to a peak of 54.7% in 2011. Data on marijuana arrests as a percentage of all arrests in the states for 2008 through 2012 is presented in Table A9. Marijuana arrests accounted for two-thirds of more of all drug arrests in five states: Nebraska (74.1%), New Hampshire (72%), Montana (70.3%), Wyoming (68.7%) and Wisconsin (67.1%) The smallest shares are for California (10.6%) and Massachusetts (19.7%); these are due to the change of marijuana possession offenses from criminal to civil infractions. In 2008, prior to this change, marijuana offenses were 47.6% of drug arrests in Massachusetts and 29.1% of drug arrests in California. Otherwise the states where marijuana arrests are the lowest percentage of all drug arrests are Utah (43.1%), Kentucky (41%), New Mexico (40.8%), Connecticut (36%) and Alabama (32.8%). The indicator is under 50% in 11 states for 2012, and over 60% in 14 states. Marijuana accounts for half of all drug arrests in the United States except for the two states that have, by 2012, made personal use possession offenses a civil infraction. While marijuana arrests provide a statistical indicator on anti-drug law enforcement activity it is also statistically valid to conclude that they divert resources away from law enforcement efforts targeted at other problems involving heroin, cocaine, methamphetamine, and prescription drugs. The number of marijuana arrests in each state from 2008 to 2012 is presented in Table A10 along with the annual rate of change for this period. Table A11 provides data on the number of arrests in each state as a percentage of the number of annual marijuana users. This data is previewed in Table 2 below, which lists the states with the top 15 highest arrest rates for marijuana offenses in the United States.
Marijuana in the States 2012
Page 14
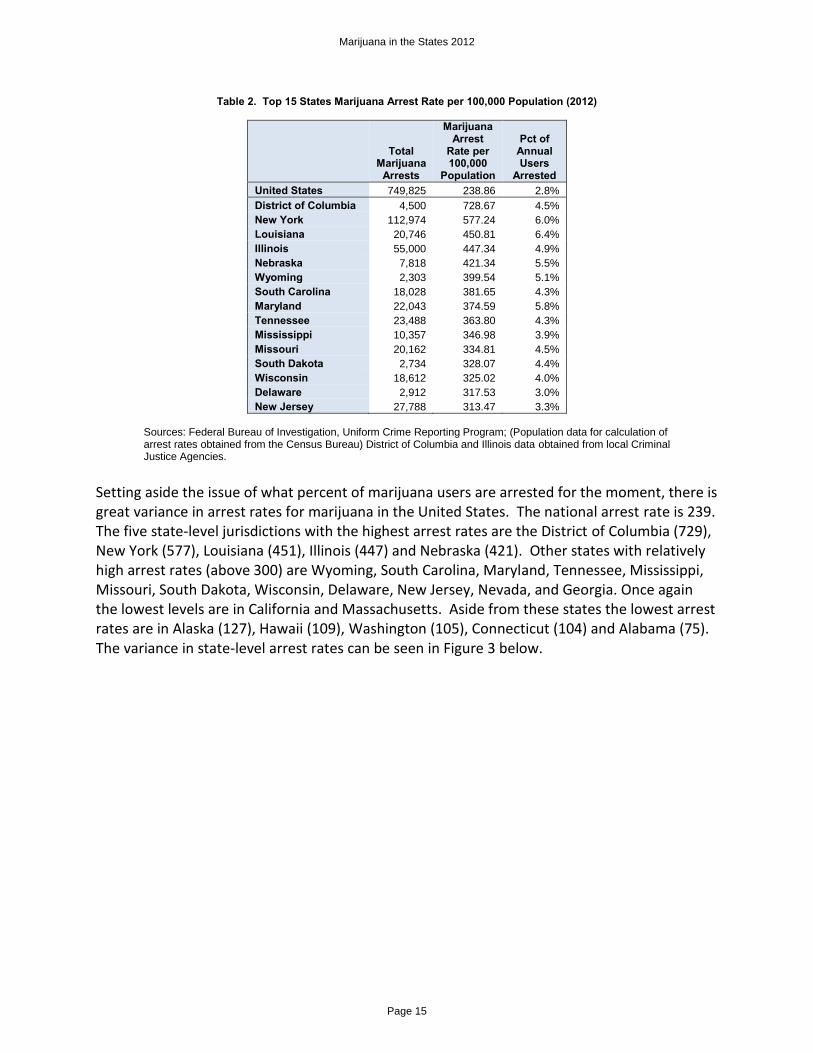
Table 2. Top 15 States Marijuana Arrest Rate per 100,000 Population (2012)
Total Marijuana
Arrests
Marijuana Arrest
Rate per 100,000
Population
Pct of Annual Users
Arrested United States 749,825 238.86 2.8% District of Columbia 4,500 728.67 4.5% New York 112,974 577.24 6.0% Louisiana 20,746 450.81 6.4% Illinois 55,000 447.34 4.9% Nebraska 7,818 421.34 5.5% Wyoming 2,303 399.54 5.1% South Carolina 18,028 381.65 4.3% Maryland 22,043 374.59 5.8% Tennessee 23,488 363.80 4.3% Mississippi 10,357 346.98 3.9% Missouri 20,162 334.81 4.5% South Dakota 2,734 328.07 4.4% Wisconsin 18,612 325.02 4.0% Delaware 2,912 317.53 3.0% New Jersey 27,788 313.47 3.3%
Sources: Federal Bureau of Investigation, Uniform Crime Reporting Program; (Population data for calculation of arrest rates obtained from the Census Bureau) District of Columbia and Illinois data obtained from local Criminal Justice Agencies.
Setting aside the issue of what percent of marijuana users are arrested for the moment, there is great variance in arrest rates for marijuana in the United States. The national arrest rate is 239. The five state-level jurisdictions with the highest arrest rates are the District of Columbia (729), New York (577), Louisiana (451), Illinois (447) and Nebraska (421). Other states with relatively high arrest rates (above 300) are Wyoming, South Carolina, Maryland, Tennessee, Mississippi, Missouri, South Dakota, Wisconsin, Delaware, New Jersey, Nevada, and Georgia. Once again the lowest levels are in California and Massachusetts. Aside from these states the lowest arrest rates are in Alaska (127), Hawaii (109), Washington (105), Connecticut (104) and Alabama (75). The variance in state-level arrest rates can be seen in Figure 3 below.
Marijuana in the States 2012
Page 15
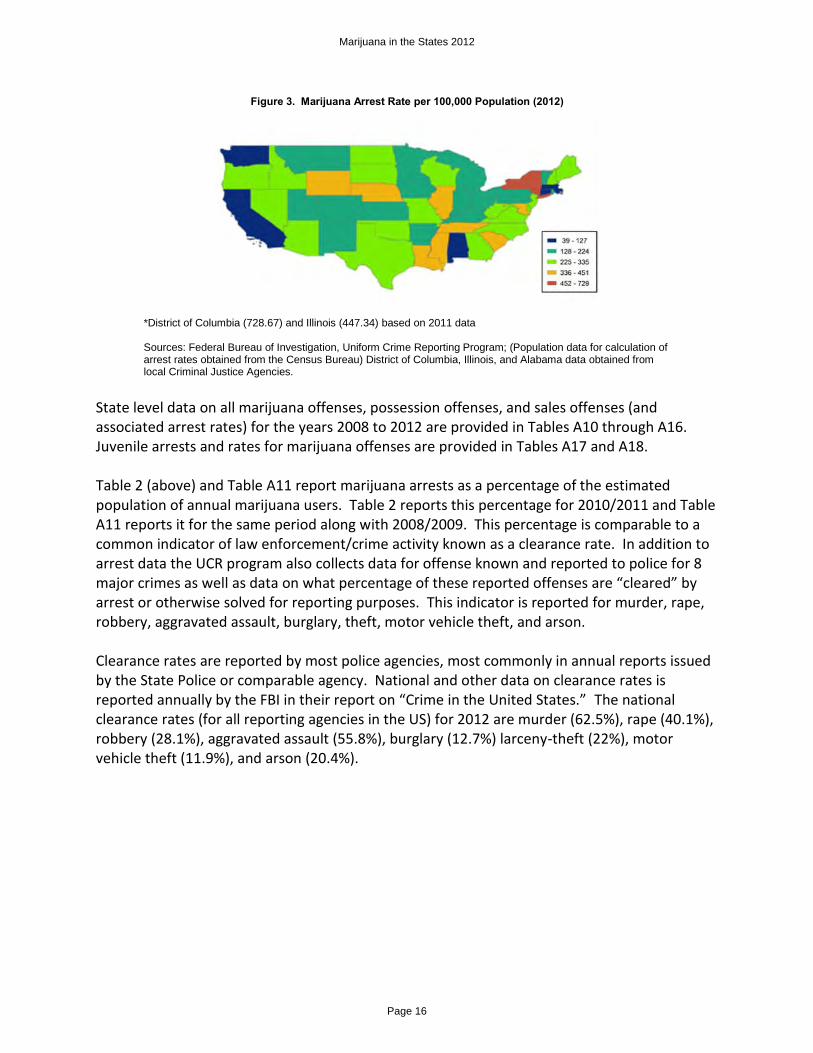
Figure 3. Marijuana Arrest Rate per 100,000 Population (2012)
*District of Columbia (728.67) and Illinois (447.34) based on 2011 data Sources: Federal Bureau of Investigation, Uniform Crime Reporting Program; (Population data for calculation of arrest rates obtained from the Census Bureau) District of Columbia, Illinois, and Alabama data obtained from local Criminal Justice Agencies.
State level data on all marijuana offenses, possession offenses, and sales offenses (and associated arrest rates) for the years 2008 to 2012 are provided in Tables A10 through A16. Juvenile arrests and rates for marijuana offenses are provided in Tables A17 and A18. Table 2 (above) and Table A11 report marijuana arrests as a percentage of the estimated population of annual marijuana users. Table 2 reports this percentage for 2010/2011 and Table A11 reports it for the same period along with 2008/2009. This percentage is comparable to a common indicator of law enforcement/crime activity known as a clearance rate. In addition to arrest data the UCR program also collects data for offense known and reported to police for 8 major crimes as well as data on what percentage of these reported offenses are “cleared” by arrest or otherwise solved for reporting purposes. This indicator is reported for murder, rape, robbery, aggravated assault, burglary, theft, motor vehicle theft, and arson. Clearance rates are reported by most police agencies, most commonly in annual reports issued by the State Police or comparable agency. National and other data on clearance rates is reported annually by the FBI in their report on “Crime in the United States.” The national clearance rates (for all reporting agencies in the US) for 2012 are murder (62.5%), rape (40.1%), robbery (28.1%), aggravated assault (55.8%), burglary (12.7%) larceny-theft (22%), motor vehicle theft (11.9%), and arson (20.4%).
Marijuana in the States 2012
Page 16
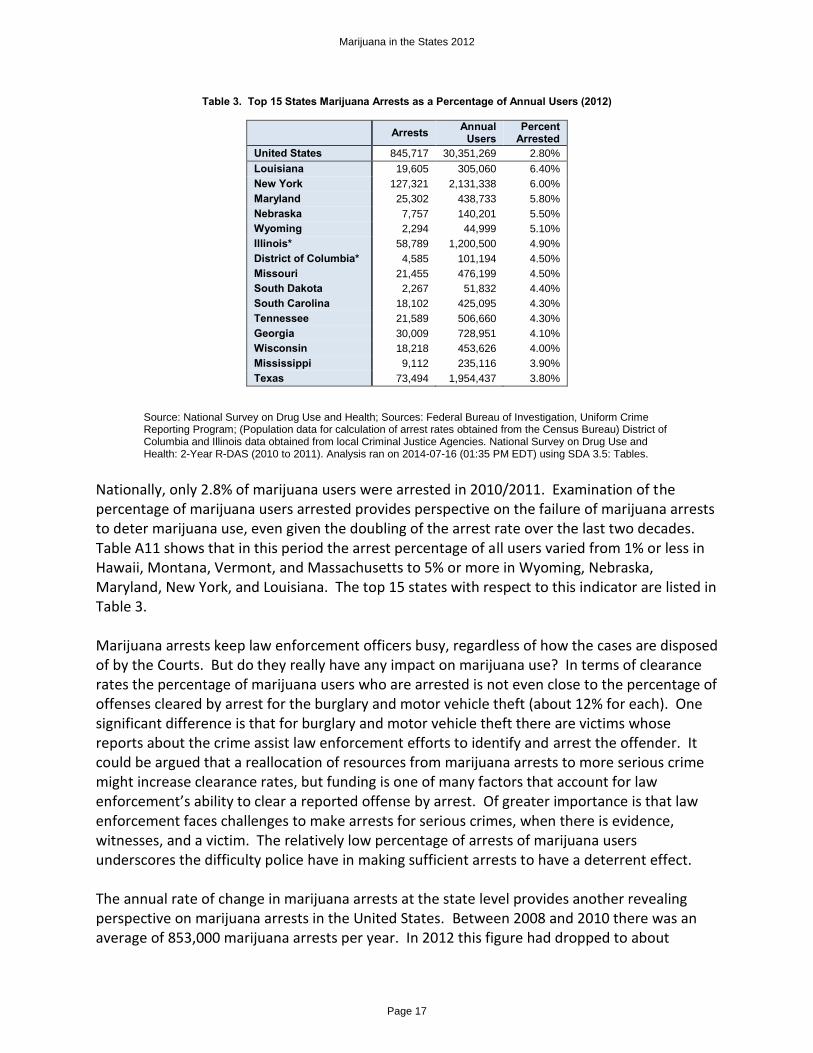
Table 3. Top 15 States Marijuana Arrests as a Percentage of Annual Users (2012)
Arrests Annual Users
Percent Arrested
United States 845,717 30,351,269 2.80% Louisiana 19,605 305,060 6.40% New York 127,321 2,131,338 6.00% Maryland 25,302 438,733 5.80% Nebraska 7,757 140,201 5.50% Wyoming 2,294 44,999 5.10% Illinois* 58,789 1,200,500 4.90% District of Columbia* 4,585 101,194 4.50% Missouri 21,455 476,199 4.50% South Dakota 2,267 51,832 4.40% South Carolina 18,102 425,095 4.30% Tennessee 21,589 506,660 4.30% Georgia 30,009 728,951 4.10% Wisconsin 18,218 453,626 4.00% Mississippi 9,112 235,116 3.90% Texas 73,494 1,954,437 3.80%
Source: National Survey on Drug Use and Health; Sources: Federal Bureau of Investigation, Uniform Crime Reporting Program; (Population data for calculation of arrest rates obtained from the Census Bureau) District of Columbia and Illinois data obtained from local Criminal Justice Agencies. National Survey on Drug Use and Health: 2-Year R-DAS (2010 to 2011). Analysis ran on 2014-07-16 (01:35 PM EDT) using SDA 3.5: Tables.
Nationally, only 2.8% of marijuana users were arrested in 2010/2011. Examination of the percentage of marijuana users arrested provides perspective on the failure of marijuana arrests to deter marijuana use, even given the doubling of the arrest rate over the last two decades. Table A11 shows that in this period the arrest percentage of all users varied from 1% or less in Hawaii, Montana, Vermont, and Massachusetts to 5% or more in Wyoming, Nebraska, Maryland, New York, and Louisiana. The top 15 states with respect to this indicator are listed in Table 3. Marijuana arrests keep law enforcement officers busy, regardless of how the cases are disposed of by the Courts. But do they really have any impact on marijuana use? In terms of clearance rates the percentage of marijuana users who are arrested is not even close to the percentage of offenses cleared by arrest for the burglary and motor vehicle theft (about 12% for each). One significant difference is that for burglary and motor vehicle theft there are victims whose reports about the crime assist law enforcement efforts to identify and arrest the offender. It could be argued that a reallocation of resources from marijuana arrests to more serious crime might increase clearance rates, but funding is one of many factors that account for law enforcement’s ability to clear a reported offense by arrest. Of greater importance is that law enforcement faces challenges to make arrests for serious crimes, when there is evidence, witnesses, and a victim. The relatively low percentage of arrests of marijuana users underscores the difficulty police have in making sufficient arrests to have a deterrent effect. The annual rate of change in marijuana arrests at the state level provides another revealing perspective on marijuana arrests in the United States. Between 2008 and 2010 there was an average of 853,000 marijuana arrests per year. In 2012 this figure had dropped to about
Marijuana in the States 2012
Page 17
750,000. Yet nearly two-thirds of this decrease was due to the elimination of criminal penalties for personal marijuana possession in two states, California and Massachusetts. How did other trends in individual states affect the national figures? The average annual change in the national arrest rate for marijuana in the United States from 2008 to 2012 was -3.8%. Data on the annual average change in marijuana arrests and marijuana arrest rates is presented in Tables A10 and A14. The top 15 states for annual percentage increases in marijuana arrests are provided in Table 4 below. Changes in population might have an effect on the total number of arrests; arrest rates per 100,000 population will provide a more dependable measure of trends over time. The top 17 states for annual percentage increases in the arrest rate for marijuana offenses is provided in Table 5 below.
Marijuana in the States 2012
Page 18
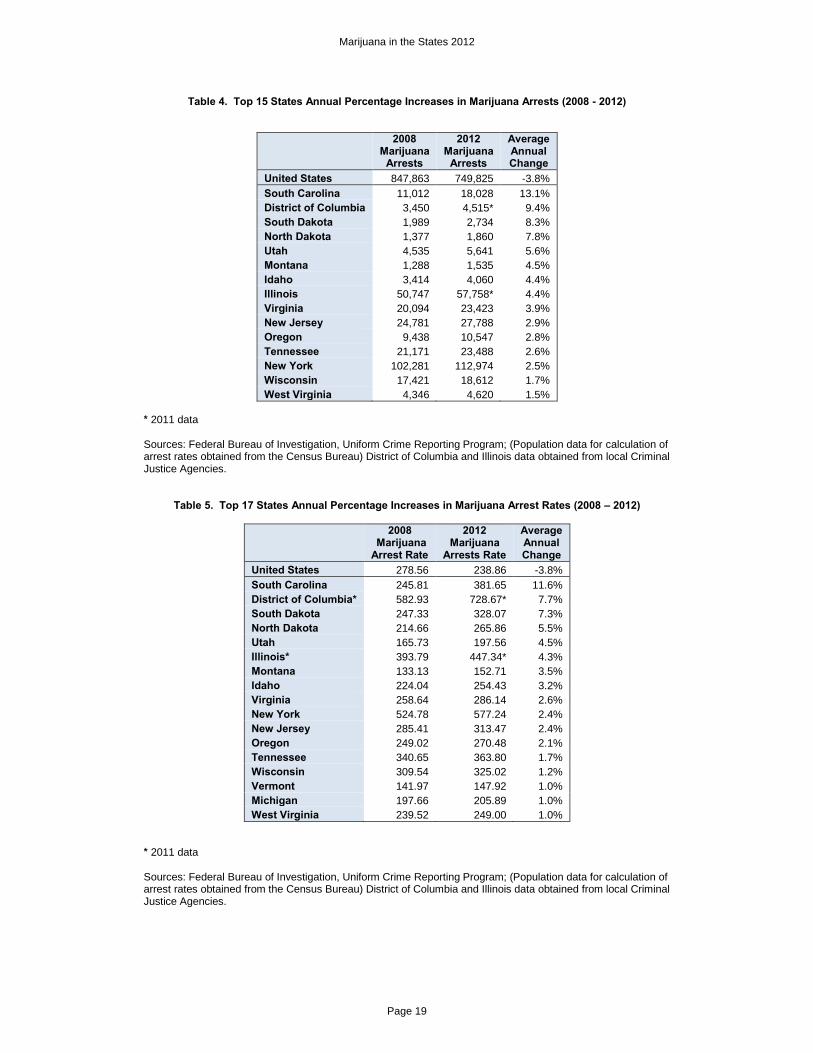
Table 4. Top 15 States Annual Percentage Increases in Marijuana Arrests (2008 - 2012)
2008 Marijuana
Arrests
2012 Marijuana
Arrests
Average Annual Change
United States 847,863 749,825 -3.8% South Carolina 11,012 18,028 13.1% District of Columbia 3,450 4,515* 9.4% South Dakota 1,989 2,734 8.3% North Dakota 1,377 1,860 7.8% Utah 4,535 5,641 5.6% Montana 1,288 1,535 4.5% Idaho 3,414 4,060 4.4% Illinois 50,747 57,758* 4.4% Virginia 20,094 23,423 3.9% New Jersey 24,781 27,788 2.9% Oregon 9,438 10,547 2.8% Tennessee 21,171 23,488 2.6% New York 102,281 112,974 2.5% Wisconsin 17,421 18,612 1.7% West Virginia 4,346 4,620 1.5%
* 2011 data Sources: Federal Bureau of Investigation, Uniform Crime Reporting Program; (Population data for calculation of arrest rates obtained from the Census Bureau) District of Columbia and Illinois data obtained from local Criminal Justice Agencies.
Table 5. Top 17 States Annual Percentage Increases in Marijuana Arrest Rates (2008 – 2012)
2008 Marijuana Arrest Rate
2012 Marijuana
Arrests Rate
Average Annual Change
United States 278.56 238.86 -3.8% South Carolina 245.81 381.65 11.6% District of Columbia* 582.93 728.67* 7.7% South Dakota 247.33 328.07 7.3% North Dakota 214.66 265.86 5.5% Utah 165.73 197.56 4.5% Illinois* 393.79 447.34* 4.3% Montana 133.13 152.71 3.5% Idaho 224.04 254.43 3.2% Virginia 258.64 286.14 2.6% New York 524.78 577.24 2.4% New Jersey 285.41 313.47 2.4% Oregon 249.02 270.48 2.1% Tennessee 340.65 363.80 1.7% Wisconsin 309.54 325.02 1.2% Vermont 141.97 147.92 1.0% Michigan 197.66 205.89 1.0% West Virginia 239.52 249.00 1.0%
* 2011 data Sources: Federal Bureau of Investigation, Uniform Crime Reporting Program; (Population data for calculation of arrest rates obtained from the Census Bureau) District of Columbia and Illinois data obtained from local Criminal Justice Agencies.
Marijuana in the States 2012
Page 19
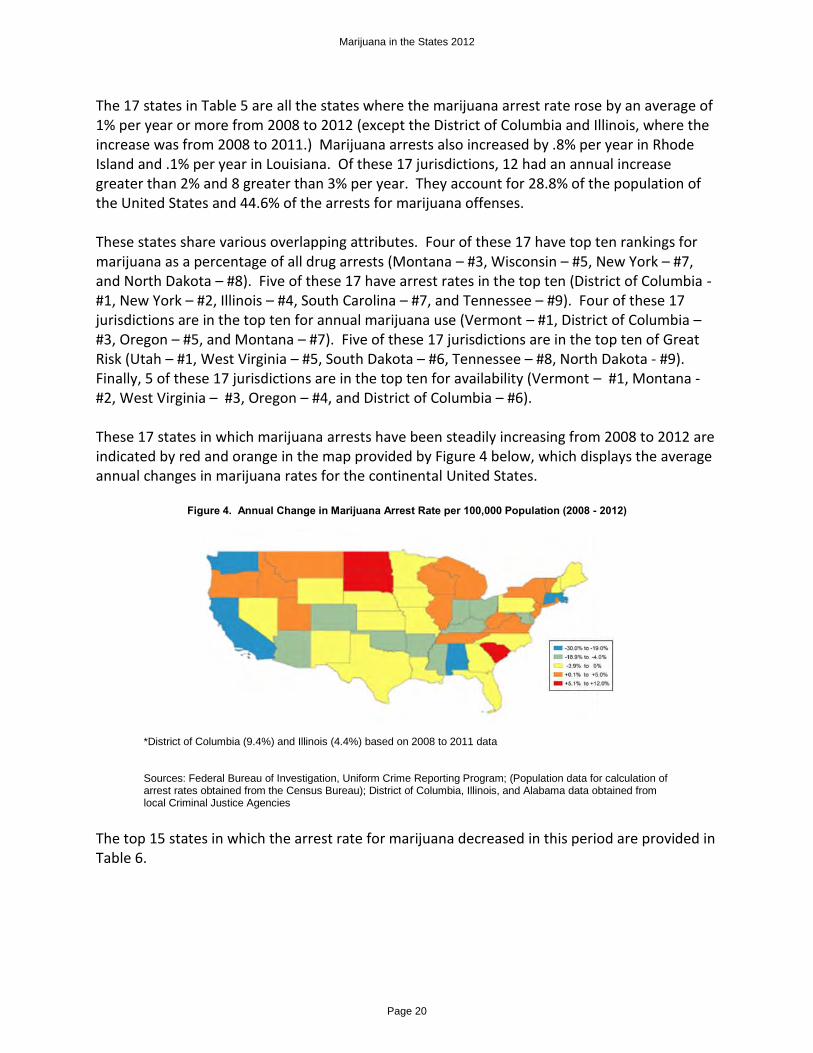
The 17 states in Table 5 are all the states where the marijuana arrest rate rose by an average of 1% per year or more from 2008 to 2012 (except the District of Columbia and Illinois, where the increase was from 2008 to 2011.) Marijuana arrests also increased by .8% per year in Rhode Island and .1% per year in Louisiana. Of these 17 jurisdictions, 12 had an annual increase greater than 2% and 8 greater than 3% per year. They account for 28.8% of the population of the United States and 44.6% of the arrests for marijuana offenses. These states share various overlapping attributes. Four of these 17 have top ten rankings for marijuana as a percentage of all drug arrests (Montana – #3, Wisconsin – #5, New York – #7, and North Dakota – #8). Five of these 17 have arrest rates in the top ten (District of Columbia -#1, New York – #2, Illinois – #4, South Carolina – #7, and Tennessee – #9). Four of these 17 jurisdictions are in the top ten for annual marijuana use (Vermont – #1, District of Columbia – #3, Oregon – #5, and Montana – #7). Five of these 17 jurisdictions are in the top ten of Great Risk (Utah – #1, West Virginia – #5, South Dakota – #6, Tennessee – #8, North Dakota - #9). Finally, 5 of these 17 jurisdictions are in the top ten for availability (Vermont – #1, Montana - #2, West Virginia – #3, Oregon – #4, and District of Columbia – #6). These 17 states in which marijuana arrests have been steadily increasing from 2008 to 2012 are indicated by red and orange in the map provided by Figure 4 below, which displays the average annual changes in marijuana rates for the continental United States.
Figure 4. Annual Change in Marijuana Arrest Rate per 100,000 Population (2008 - 2012)
*District of Columbia (9.4%) and Illinois (4.4%) based on 2008 to 2011 data Sources: Federal Bureau of Investigation, Uniform Crime Reporting Program; (Population data for calculation of arrest rates obtained from the Census Bureau); District of Columbia, Illinois, and Alabama data obtained from local Criminal Justice Agencies
The top 15 states in which the arrest rate for marijuana decreased in this period are provided in Table 6.
Marijuana in the States 2012
Page 20
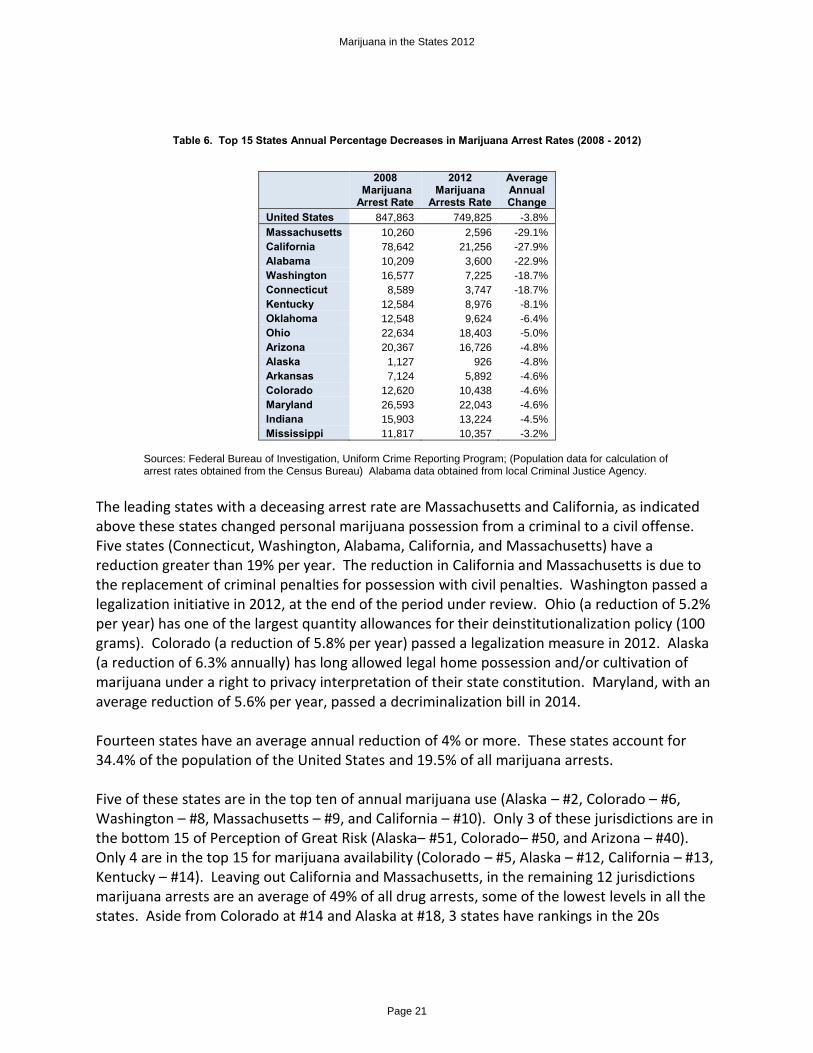
Table 6. Top 15 States Annual Percentage Decreases in Marijuana Arrest Rates (2008 - 2012)
2008 Marijuana Arrest Rate
2012 Marijuana
Arrests Rate
Average Annual Change
United States 847,863 749,825 -3.8% Massachusetts 10,260 2,596 -29.1% California 78,642 21,256 -27.9% Alabama 10,209 3,600 -22.9% Washington 16,577 7,225 -18.7% Connecticut 8,589 3,747 -18.7% Kentucky 12,584 8,976 -8.1% Oklahoma 12,548 9,624 -6.4% Ohio 22,634 18,403 -5.0% Arizona 20,367 16,726 -4.8% Alaska 1,127 926 -4.8% Arkansas 7,124 5,892 -4.6% Colorado 12,620 10,438 -4.6% Maryland 26,593 22,043 -4.6% Indiana 15,903 13,224 -4.5% Mississippi 11,817 10,357 -3.2%
Sources: Federal Bureau of Investigation, Uniform Crime Reporting Program; (Population data for calculation of arrest rates obtained from the Census Bureau) Alabama data obtained from local Criminal Justice Agency.
The leading states with a deceasing arrest rate are Massachusetts and California, as indicated above these states changed personal marijuana possession from a criminal to a civil offense. Five states (Connecticut, Washington, Alabama, California, and Massachusetts) have a reduction greater than 19% per year. The reduction in California and Massachusetts is due to the replacement of criminal penalties for possession with civil penalties. Washington passed a legalization initiative in 2012, at the end of the period under review. Ohio (a reduction of 5.2% per year) has one of the largest quantity allowances for their deinstitutionalization policy (100 grams). Colorado (a reduction of 5.8% per year) passed a legalization measure in 2012. Alaska (a reduction of 6.3% annually) has long allowed legal home possession and/or cultivation of marijuana under a right to privacy interpretation of their state constitution. Maryland, with an average reduction of 5.6% per year, passed a decriminalization bill in 2014. Fourteen states have an average annual reduction of 4% or more. These states account for 34.4% of the population of the United States and 19.5% of all marijuana arrests. Five of these states are in the top ten of annual marijuana use (Alaska – #2, Colorado – #6, Washington – #8, Massachusetts – #9, and California – #10). Only 3 of these jurisdictions are in the bottom 15 of Perception of Great Risk (Alaska– #51, Colorado– #50, and Arizona – #40). Only 4 are in the top 15 for marijuana availability (Colorado – #5, Alaska – #12, California – #13, Kentucky – #14). Leaving out California and Massachusetts, in the remaining 12 jurisdictions marijuana arrests are an average of 49% of all drug arrests, some of the lowest levels in all the states. Aside from Colorado at #14 and Alaska at #18, 3 states have rankings in the 20s
Marijuana in the States 2012
Page 21
(Arizona, Maryland, and Oklahoma), and the remaining states in this category rank from 38 to 49 in the country.) Many of these states with decreasing marijuana arrest rates have something in common. Many have adopted of marijuana law reform innovations such as deinstitutionalization, decriminalization, or legalization. In addition, marijuana arrests have a lower priority with respect to other drug arrests, to the extent this is indicated by the overall percentage of all drug arrests accounted for by marijuana offenses. This review of annual changes in arrest rates demonstrates that marijuana arrests are subject to a number of local factors, including but not limited to the general issues of other drug arrests, annual marijuana use, risk perception, and availability. Statistically there are no correlations between arrest rates and or arrest rate trends and any of the other indicators reviewed in this report. This just reinforces the likelihood that no single group of factors explains trends for all states. Marijuana arrest rates are affected by local considerations, and as such are not reliable instruments of national policy. Table 7 summarizes trends in both arrest rates and annual use. It may be that marijuana arrests are increasing in many states due because of the increase in marijuana use. But there are just as many, actually more, states in which marijuana arrest rates are decreasing in face of increased use. In only 3 states are increasing arrest rates accompanied by decreasing usage trends, and in only 7 states are both decreasing arrest and usage rates found.
Marijuana in the States 2012
Page 22
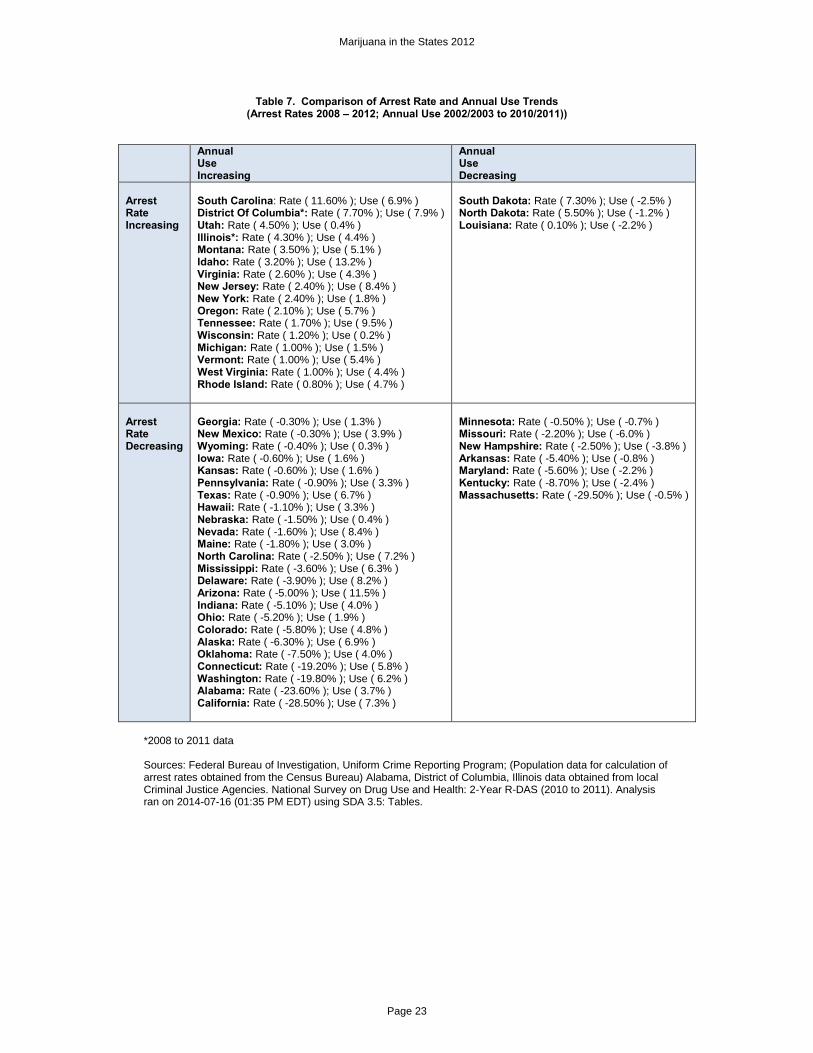
Table 7. Comparison of Arrest Rate and Annual Use Trends (Arrest Rates 2008 – 2012; Annual Use 2002/2003 to 2010/2011))
Annual Use Increasing
Annual Use Decreasing
Arrest Rate Increasing
South Carolina: Rate ( 11.60% ); Use ( 6.9% ) District Of Columbia*: Rate ( 7.70% ); Use ( 7.9% ) Utah: Rate ( 4.50% ); Use ( 0.4% ) Illinois*: Rate ( 4.30% ); Use ( 4.4% ) Montana: Rate ( 3.50% ); Use ( 5.1% ) Idaho: Rate ( 3.20% ); Use ( 13.2% ) Virginia: Rate ( 2.60% ); Use ( 4.3% ) New Jersey: Rate ( 2.40% ); Use ( 8.4% ) New York: Rate ( 2.40% ); Use ( 1.8% ) Oregon: Rate ( 2.10% ); Use ( 5.7% ) Tennessee: Rate ( 1.70% ); Use ( 9.5% ) Wisconsin: Rate ( 1.20% ); Use ( 0.2% ) Michigan: Rate ( 1.00% ); Use ( 1.5% ) Vermont: Rate ( 1.00% ); Use ( 5.4% ) West Virginia: Rate ( 1.00% ); Use ( 4.4% ) Rhode Island: Rate ( 0.80% ); Use ( 4.7% )
South Dakota: Rate ( 7.30% ); Use ( -2.5% ) North Dakota: Rate ( 5.50% ); Use ( -1.2% ) Louisiana: Rate ( 0.10% ); Use ( -2.2% )
Arrest Rate Decreasing
Georgia: Rate ( -0.30% ); Use ( 1.3% ) New Mexico: Rate ( -0.30% ); Use ( 3.9% ) Wyoming: Rate ( -0.40% ); Use ( 0.3% ) Iowa: Rate ( -0.60% ); Use ( 1.6% ) Kansas: Rate ( -0.60% ); Use ( 1.6% ) Pennsylvania: Rate ( -0.90% ); Use ( 3.3% ) Texas: Rate ( -0.90% ); Use ( 6.7% ) Hawaii: Rate ( -1.10% ); Use ( 3.3% ) Nebraska: Rate ( -1.50% ); Use ( 0.4% ) Nevada: Rate ( -1.60% ); Use ( 8.4% ) Maine: Rate ( -1.80% ); Use ( 3.0% ) North Carolina: Rate ( -2.50% ); Use ( 7.2% ) Mississippi: Rate ( -3.60% ); Use ( 6.3% ) Delaware: Rate ( -3.90% ); Use ( 8.2% ) Arizona: Rate ( -5.00% ); Use ( 11.5% ) Indiana: Rate ( -5.10% ); Use ( 4.0% ) Ohio: Rate ( -5.20% ); Use ( 1.9% ) Colorado: Rate ( -5.80% ); Use ( 4.8% ) Alaska: Rate ( -6.30% ); Use ( 6.9% ) Oklahoma: Rate ( -7.50% ); Use ( 4.0% ) Connecticut: Rate ( -19.20% ); Use ( 5.8% ) Washington: Rate ( -19.80% ); Use ( 6.2% ) Alabama: Rate ( -23.60% ); Use ( 3.7% ) California: Rate ( -28.50% ); Use ( 7.3% )
Minnesota: Rate ( -0.50% ); Use ( -0.7% ) Missouri: Rate ( -2.20% ); Use ( -6.0% ) New Hampshire: Rate ( -2.50% ); Use ( -3.8% ) Arkansas: Rate ( -5.40% ); Use ( -0.8% ) Maryland: Rate ( -5.60% ); Use ( -2.2% ) Kentucky: Rate ( -8.70% ); Use ( -2.4% ) Massachusetts: Rate ( -29.50% ); Use ( -0.5% )
*2008 to 2011 data Sources: Federal Bureau of Investigation, Uniform Crime Reporting Program; (Population data for calculation of arrest rates obtained from the Census Bureau) Alabama, District of Columbia, Illinois data obtained from local Criminal Justice Agencies. National Survey on Drug Use and Health: 2-Year R-DAS (2010 to 2011). Analysis ran on 2014-07-16 (01:35 PM EDT) using SDA 3.5: Tables.
Marijuana in the States 2012
Page 23
Conclusion Numbers provide certainty. Over the last two decades marijuana arrests and marijuana arrest rates have doubled, and at great expense to both the public and the individuals arrested. Discussions over the amount of the actual cost to both parties are of interest and importance, but their outcome does not change the basic facts presented in this report. Marijuana arrests have increased significantly, and in many states they continue to increase. The other important fact is that despite these arrests marijuana use has been increasing over the last decade. It may be that marijuana arrests are increasing because marijuana use is increasing. There may be, indeed, another explanation. Public support for ending marijuana prohibition has reached unprecedented levels. A majority of the public supports marijuana’s legalization. The medical use of marijuana has been legalized in many states. The decriminalization of personal marijuana possession is also a gaining popularity with both the public and its political representatives. Measures to legalize marijuana have been enacted in two states, and are under consideration in several others. Law enforcement is often opposed to public policies which have the objective of reducing or ending arrests for marijuana offenses (most of which involve personal possession of relatively modest quantities.) Law enforcement officers and representatives often refer to the experience they have with marijuana users, and they justify their opposition to marijuana law reform with observations and opinions based on this experience. However, as other statistics prove, they have experience with only a minute percentage of marijuana users – hardly a representative sample. In most cases the opinions of law enforcement officers are due deference and respect. However, when it comes to the issue of marijuana arrests, especially in light of the data on arrests and use, the issue of law enforcement’s support for continuing and increasing marijuana arrests warrants scrutiny. With all due respect, don’t police have anything better to do with their time and resources? This question may seem a bit flippant at first glance given national concern over drug abuse and related problems. However there are other public policy measures devoted to addressing these problems, and many of them have demonstrated effectiveness. Education and prevention programs have proven effective at reducing alcohol and tobacco use. Are police officers concerned that ending marijuana arrests will divert law enforcement funding to other social programs? The financial benefits law enforcement receives due to laws providing for the arrest of marijuana users need to be studied and debated. In light of their failure to curb the increase in marijuana use the costs and benefits of marijuana arrests, and who bears them, require greater study.
Marijuana in the States 2012
Page 24
Appendix
Marijuana in the States 2012
Page 25
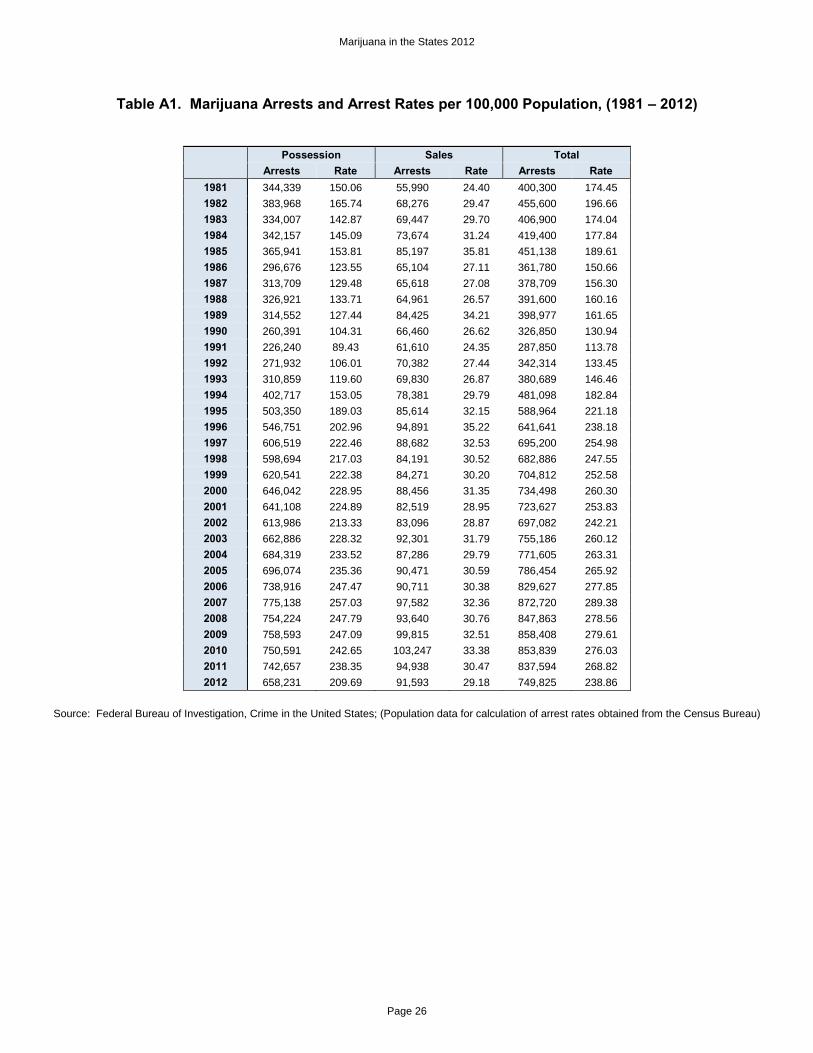
Table A1. Marijuana Arrests and Arrest Rates per 100,000 Population, (1981 – 2012)
Possession Sales Total Arrests Rate Arrests Rate Arrests Rate
1981 344,339 150.06 55,990 24.40 400,300 174.45 1982 383,968 165.74 68,276 29.47 455,600 196.66 1983 334,007 142.87 69,447 29.70 406,900 174.04 1984 342,157 145.09 73,674 31.24 419,400 177.84 1985 365,941 153.81 85,197 35.81 451,138 189.61 1986 296,676 123.55 65,104 27.11 361,780 150.66 1987 313,709 129.48 65,618 27.08 378,709 156.30 1988 326,921 133.71 64,961 26.57 391,600 160.16 1989 314,552 127.44 84,425 34.21 398,977 161.65 1990 260,391 104.31 66,460 26.62 326,850 130.94 1991 226,240 89.43 61,610 24.35 287,850 113.78 1992 271,932 106.01 70,382 27.44 342,314 133.45 1993 310,859 119.60 69,830 26.87 380,689 146.46 1994 402,717 153.05 78,381 29.79 481,098 182.84 1995 503,350 189.03 85,614 32.15 588,964 221.18 1996 546,751 202.96 94,891 35.22 641,641 238.18 1997 606,519 222.46 88,682 32.53 695,200 254.98 1998 598,694 217.03 84,191 30.52 682,886 247.55 1999 620,541 222.38 84,271 30.20 704,812 252.58 2000 646,042 228.95 88,456 31.35 734,498 260.30 2001 641,108 224.89 82,519 28.95 723,627 253.83 2002 613,986 213.33 83,096 28.87 697,082 242.21 2003 662,886 228.32 92,301 31.79 755,186 260.12 2004 684,319 233.52 87,286 29.79 771,605 263.31 2005 696,074 235.36 90,471 30.59 786,454 265.92 2006 738,916 247.47 90,711 30.38 829,627 277.85 2007 775,138 257.03 97,582 32.36 872,720 289.38 2008 754,224 247.79 93,640 30.76 847,863 278.56 2009 758,593 247.09 99,815 32.51 858,408 279.61 2010 750,591 242.65 103,247 33.38 853,839 276.03 2011 742,657 238.35 94,938 30.47 837,594 268.82 2012 658,231 209.69 91,593 29.18 749,825 238.86
Source: Federal Bureau of Investigation, Crime in the United States; (Population data for calculation of arrest rates obtained from the Census Bureau)
Marijuana in the States 2012
Page 26
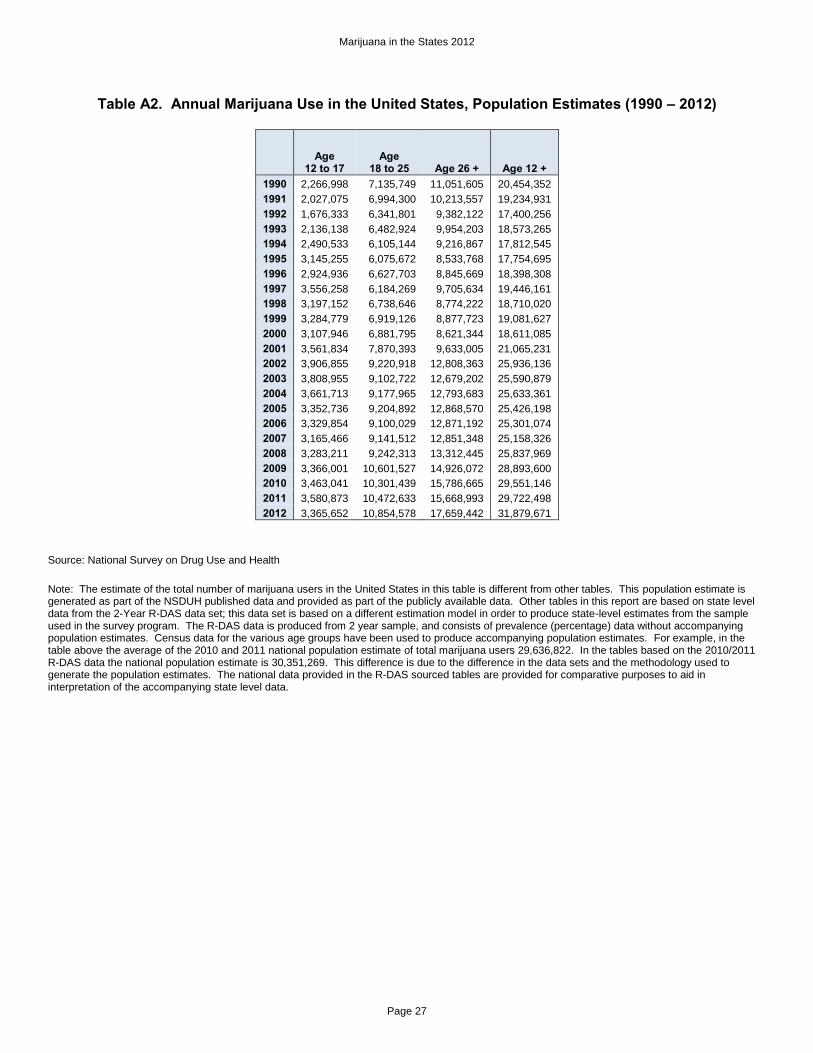
Table A2. Annual Marijuana Use in the United States, Population Estimates (1990 – 2012)
Age
12 to 17 Age
18 to 25 Age 26 + Age 12 + 1990 2,266,998 7,135,749 11,051,605 20,454,352 1991 2,027,075 6,994,300 10,213,557 19,234,931 1992 1,676,333 6,341,801 9,382,122 17,400,256 1993 2,136,138 6,482,924 9,954,203 18,573,265 1994 2,490,533 6,105,144 9,216,867 17,812,545 1995 3,145,255 6,075,672 8,533,768 17,754,695 1996 2,924,936 6,627,703 8,845,669 18,398,308 1997 3,556,258 6,184,269 9,705,634 19,446,161 1998 3,197,152 6,738,646 8,774,222 18,710,020 1999 3,284,779 6,919,126 8,877,723 19,081,627 2000 3,107,946 6,881,795 8,621,344 18,611,085 2001 3,561,834 7,870,393 9,633,005 21,065,231 2002 3,906,855 9,220,918 12,808,363 25,936,136 2003 3,808,955 9,102,722 12,679,202 25,590,879 2004 3,661,713 9,177,965 12,793,683 25,633,361 2005 3,352,736 9,204,892 12,868,570 25,426,198 2006 3,329,854 9,100,029 12,871,192 25,301,074 2007 3,165,466 9,141,512 12,851,348 25,158,326 2008 3,283,211 9,242,313 13,312,445 25,837,969 2009 3,366,001 10,601,527 14,926,072 28,893,600 2010 3,463,041 10,301,439 15,786,665 29,551,146 2011 3,580,873 10,472,633 15,668,993 29,722,498 2012 3,365,652 10,854,578 17,659,442 31,879,671
Source: National Survey on Drug Use and Health Note: The estimate of the total number of marijuana users in the United States in this table is different from other tables. This population estimate is generated as part of the NSDUH published data and provided as part of the publicly available data. Other tables in this report are based on state level data from the 2-Year R-DAS data set; this data set is based on a different estimation model in order to produce state-level estimates from the sample used in the survey program. The R-DAS data is produced from 2 year sample, and consists of prevalence (percentage) data without accompanying population estimates. Census data for the various age groups have been used to produce accompanying population estimates. For example, in the table above the average of the 2010 and 2011 national population estimate of total marijuana users 29,636,822. In the tables based on the 2010/2011 R-DAS data the national population estimate is 30,351,269. This difference is due to the difference in the data sets and the methodology used to generate the population estimates. The national data provided in the R-DAS sourced tables are provided for comparative purposes to aid in interpretation of the accompanying state level data.
Marijuana in the States 2012
Page 27
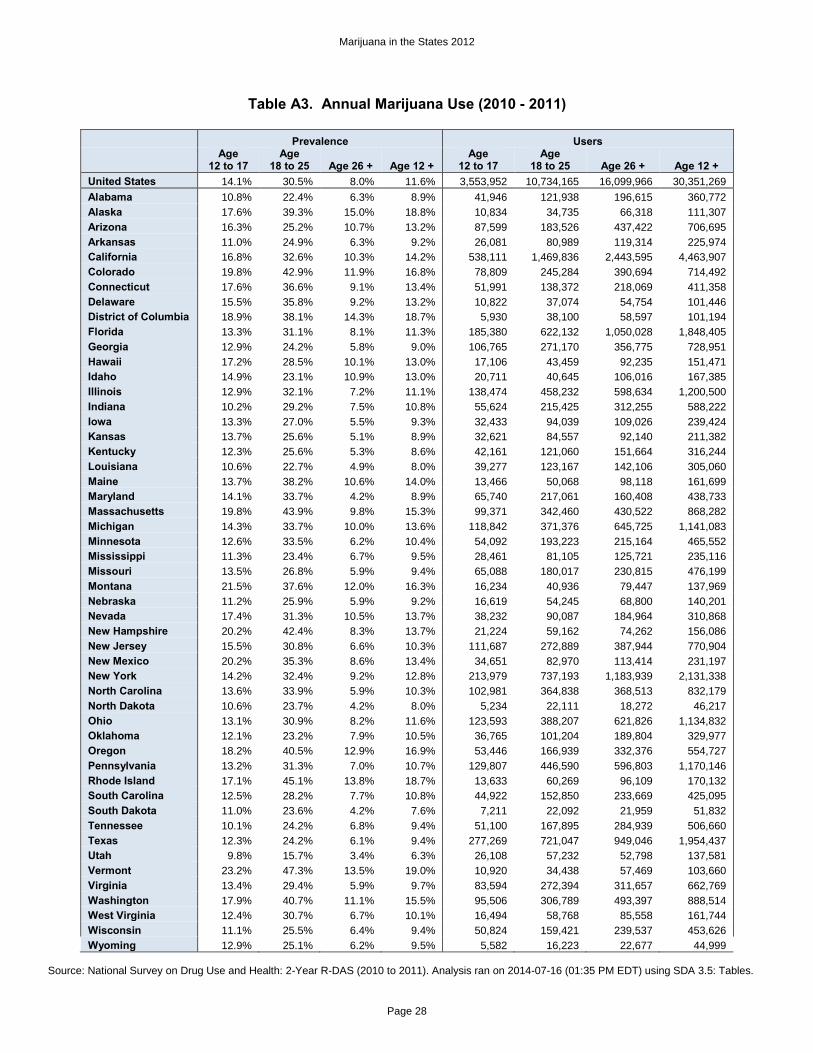
Table A3. Annual Marijuana Use (2010 - 2011)
Prevalence Users
Age
12 to 17 Age
18 to 25 Age 26 + Age 12 + Age
12 to 17 Age
18 to 25 Age 26 + Age 12 + United States 14.1% 30.5% 8.0% 11.6% 3,553,952 10,734,165 16,099,966 30,351,269 Alabama 10.8% 22.4% 6.3% 8.9% 41,946 121,938 196,615 360,772 Alaska 17.6% 39.3% 15.0% 18.8% 10,834 34,735 66,318 111,307 Arizona 16.3% 25.2% 10.7% 13.2% 87,599 183,526 437,422 706,695 Arkansas 11.0% 24.9% 6.3% 9.2% 26,081 80,989 119,314 225,974 California 16.8% 32.6% 10.3% 14.2% 538,111 1,469,836 2,443,595 4,463,907 Colorado 19.8% 42.9% 11.9% 16.8% 78,809 245,284 390,694 714,492 Connecticut 17.6% 36.6% 9.1% 13.4% 51,991 138,372 218,069 411,358 Delaware 15.5% 35.8% 9.2% 13.2% 10,822 37,074 54,754 101,446 District of Columbia 18.9% 38.1% 14.3% 18.7% 5,930 38,100 58,597 101,194 Florida 13.3% 31.1% 8.1% 11.3% 185,380 622,132 1,050,028 1,848,405 Georgia 12.9% 24.2% 5.8% 9.0% 106,765 271,170 356,775 728,951 Hawaii 17.2% 28.5% 10.1% 13.0% 17,106 43,459 92,235 151,471 Idaho 14.9% 23.1% 10.9% 13.0% 20,711 40,645 106,016 167,385 Illinois 12.9% 32.1% 7.2% 11.1% 138,474 458,232 598,634 1,200,500 Indiana 10.2% 29.2% 7.5% 10.8% 55,624 215,425 312,255 588,222 Iowa 13.3% 27.0% 5.5% 9.3% 32,433 94,039 109,026 239,424 Kansas 13.7% 25.6% 5.1% 8.9% 32,621 84,557 92,140 211,382 Kentucky 12.3% 25.6% 5.3% 8.6% 42,161 121,060 151,664 316,244 Louisiana 10.6% 22.7% 4.9% 8.0% 39,277 123,167 142,106 305,060 Maine 13.7% 38.2% 10.6% 14.0% 13,466 50,068 98,118 161,699 Maryland 14.1% 33.7% 4.2% 8.9% 65,740 217,061 160,408 438,733 Massachusetts 19.8% 43.9% 9.8% 15.3% 99,371 342,460 430,522 868,282 Michigan 14.3% 33.7% 10.0% 13.6% 118,842 371,376 645,725 1,141,083 Minnesota 12.6% 33.5% 6.2% 10.4% 54,092 193,223 215,164 465,552 Mississippi 11.3% 23.4% 6.7% 9.5% 28,461 81,105 125,721 235,116 Missouri 13.5% 26.8% 5.9% 9.4% 65,088 180,017 230,815 476,199 Montana 21.5% 37.6% 12.0% 16.3% 16,234 40,936 79,447 137,969 Nebraska 11.2% 25.9% 5.9% 9.2% 16,619 54,245 68,800 140,201 Nevada 17.4% 31.3% 10.5% 13.7% 38,232 90,087 184,964 310,868 New Hampshire 20.2% 42.4% 8.3% 13.7% 21,224 59,162 74,262 156,086 New Jersey 15.5% 30.8% 6.6% 10.3% 111,687 272,889 387,944 770,904 New Mexico 20.2% 35.3% 8.6% 13.4% 34,651 82,970 113,414 231,197 New York 14.2% 32.4% 9.2% 12.8% 213,979 737,193 1,183,939 2,131,338 North Carolina 13.6% 33.9% 5.9% 10.3% 102,981 364,838 368,513 832,179 North Dakota 10.6% 23.7% 4.2% 8.0% 5,234 22,111 18,272 46,217 Ohio 13.1% 30.9% 8.2% 11.6% 123,593 388,207 621,826 1,134,832 Oklahoma 12.1% 23.2% 7.9% 10.5% 36,765 101,204 189,804 329,977 Oregon 18.2% 40.5% 12.9% 16.9% 53,446 166,939 332,376 554,727 Pennsylvania 13.2% 31.3% 7.0% 10.7% 129,807 446,590 596,803 1,170,146 Rhode Island 17.1% 45.1% 13.8% 18.7% 13,633 60,269 96,109 170,132 South Carolina 12.5% 28.2% 7.7% 10.8% 44,922 152,850 233,669 425,095 South Dakota 11.0% 23.6% 4.2% 7.6% 7,211 22,092 21,959 51,832 Tennessee 10.1% 24.2% 6.8% 9.4% 51,100 167,895 284,939 506,660 Texas 12.3% 24.2% 6.1% 9.4% 277,269 721,047 949,046 1,954,437 Utah 9.8% 15.7% 3.4% 6.3% 26,108 57,232 52,798 137,581 Vermont 23.2% 47.3% 13.5% 19.0% 10,920 34,438 57,469 103,660 Virginia 13.4% 29.4% 5.9% 9.7% 83,594 272,394 311,657 662,769 Washington 17.9% 40.7% 11.1% 15.5% 95,506 306,789 493,397 888,514 West Virginia 12.4% 30.7% 6.7% 10.1% 16,494 58,768 85,558 161,744 Wisconsin 11.1% 25.5% 6.4% 9.4% 50,824 159,421 239,537 453,626 Wyoming 12.9% 25.1% 6.2% 9.5% 5,582 16,223 22,677 44,999
Source: National Survey on Drug Use and Health: 2-Year R-DAS (2010 to 2011). Analysis ran on 2014-07-16 (01:35 PM EDT) using SDA 3.5: Tables.
Marijuana in the States 2012
Page 28
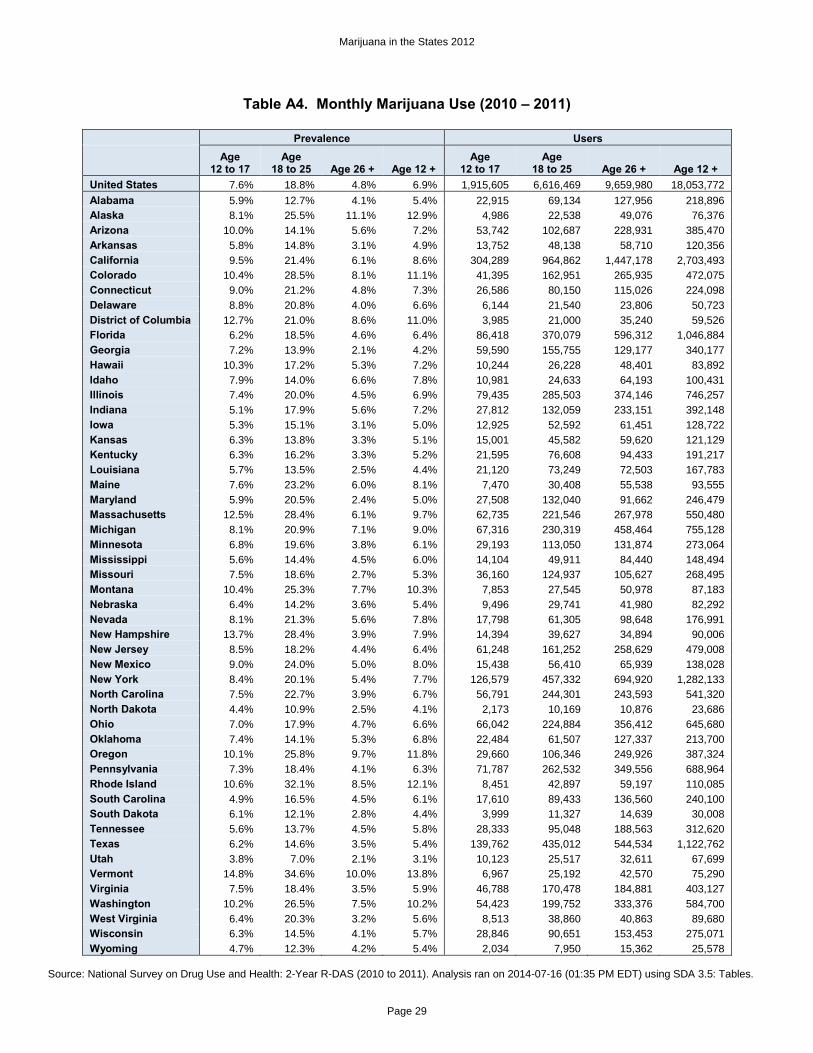
Table A4. Monthly Marijuana Use (2010 – 2011)
Prevalence Users
Age
12 to 17 Age
18 to 25 Age 26 + Age 12 + Age
12 to 17 Age
18 to 25 Age 26 + Age 12 + United States 7.6% 18.8% 4.8% 6.9% 1,915,605 6,616,469 9,659,980 18,053,772 Alabama 5.9% 12.7% 4.1% 5.4% 22,915 69,134 127,956 218,896 Alaska 8.1% 25.5% 11.1% 12.9% 4,986 22,538 49,076 76,376 Arizona 10.0% 14.1% 5.6% 7.2% 53,742 102,687 228,931 385,470 Arkansas 5.8% 14.8% 3.1% 4.9% 13,752 48,138 58,710 120,356 California 9.5% 21.4% 6.1% 8.6% 304,289 964,862 1,447,178 2,703,493 Colorado 10.4% 28.5% 8.1% 11.1% 41,395 162,951 265,935 472,075 Connecticut 9.0% 21.2% 4.8% 7.3% 26,586 80,150 115,026 224,098 Delaware 8.8% 20.8% 4.0% 6.6% 6,144 21,540 23,806 50,723 District of Columbia 12.7% 21.0% 8.6% 11.0% 3,985 21,000 35,240 59,526 Florida 6.2% 18.5% 4.6% 6.4% 86,418 370,079 596,312 1,046,884 Georgia 7.2% 13.9% 2.1% 4.2% 59,590 155,755 129,177 340,177 Hawaii 10.3% 17.2% 5.3% 7.2% 10,244 26,228 48,401 83,892 Idaho 7.9% 14.0% 6.6% 7.8% 10,981 24,633 64,193 100,431 Illinois 7.4% 20.0% 4.5% 6.9% 79,435 285,503 374,146 746,257 Indiana 5.1% 17.9% 5.6% 7.2% 27,812 132,059 233,151 392,148 Iowa 5.3% 15.1% 3.1% 5.0% 12,925 52,592 61,451 128,722 Kansas 6.3% 13.8% 3.3% 5.1% 15,001 45,582 59,620 121,129 Kentucky 6.3% 16.2% 3.3% 5.2% 21,595 76,608 94,433 191,217 Louisiana 5.7% 13.5% 2.5% 4.4% 21,120 73,249 72,503 167,783 Maine 7.6% 23.2% 6.0% 8.1% 7,470 30,408 55,538 93,555 Maryland 5.9% 20.5% 2.4% 5.0% 27,508 132,040 91,662 246,479 Massachusetts 12.5% 28.4% 6.1% 9.7% 62,735 221,546 267,978 550,480 Michigan 8.1% 20.9% 7.1% 9.0% 67,316 230,319 458,464 755,128 Minnesota 6.8% 19.6% 3.8% 6.1% 29,193 113,050 131,874 273,064 Mississippi 5.6% 14.4% 4.5% 6.0% 14,104 49,911 84,440 148,494 Missouri 7.5% 18.6% 2.7% 5.3% 36,160 124,937 105,627 268,495 Montana 10.4% 25.3% 7.7% 10.3% 7,853 27,545 50,978 87,183 Nebraska 6.4% 14.2% 3.6% 5.4% 9,496 29,741 41,980 82,292 Nevada 8.1% 21.3% 5.6% 7.8% 17,798 61,305 98,648 176,991 New Hampshire 13.7% 28.4% 3.9% 7.9% 14,394 39,627 34,894 90,006 New Jersey 8.5% 18.2% 4.4% 6.4% 61,248 161,252 258,629 479,008 New Mexico 9.0% 24.0% 5.0% 8.0% 15,438 56,410 65,939 138,028 New York 8.4% 20.1% 5.4% 7.7% 126,579 457,332 694,920 1,282,133 North Carolina 7.5% 22.7% 3.9% 6.7% 56,791 244,301 243,593 541,320 North Dakota 4.4% 10.9% 2.5% 4.1% 2,173 10,169 10,876 23,686 Ohio 7.0% 17.9% 4.7% 6.6% 66,042 224,884 356,412 645,680 Oklahoma 7.4% 14.1% 5.3% 6.8% 22,484 61,507 127,337 213,700 Oregon 10.1% 25.8% 9.7% 11.8% 29,660 106,346 249,926 387,324 Pennsylvania 7.3% 18.4% 4.1% 6.3% 71,787 262,532 349,556 688,964 Rhode Island 10.6% 32.1% 8.5% 12.1% 8,451 42,897 59,197 110,085 South Carolina 4.9% 16.5% 4.5% 6.1% 17,610 89,433 136,560 240,100 South Dakota 6.1% 12.1% 2.8% 4.4% 3,999 11,327 14,639 30,008 Tennessee 5.6% 13.7% 4.5% 5.8% 28,333 95,048 188,563 312,620 Texas 6.2% 14.6% 3.5% 5.4% 139,762 435,012 544,534 1,122,762 Utah 3.8% 7.0% 2.1% 3.1% 10,123 25,517 32,611 67,699 Vermont 14.8% 34.6% 10.0% 13.8% 6,967 25,192 42,570 75,290 Virginia 7.5% 18.4% 3.5% 5.9% 46,788 170,478 184,881 403,127 Washington 10.2% 26.5% 7.5% 10.2% 54,423 199,752 333,376 584,700 West Virginia 6.4% 20.3% 3.2% 5.6% 8,513 38,860 40,863 89,680 Wisconsin 6.3% 14.5% 4.1% 5.7% 28,846 90,651 153,453 275,071 Wyoming 4.7% 12.3% 4.2% 5.4% 2,034 7,950 15,362 25,578
Source: National Survey on Drug Use and Health: 2-Year R-DAS (2010 to 2011). Analysis ran on 2014-07-16 (01:35 PM EDT) using SDA 3.5: Tables.
Marijuana in the States 2012
Page 29
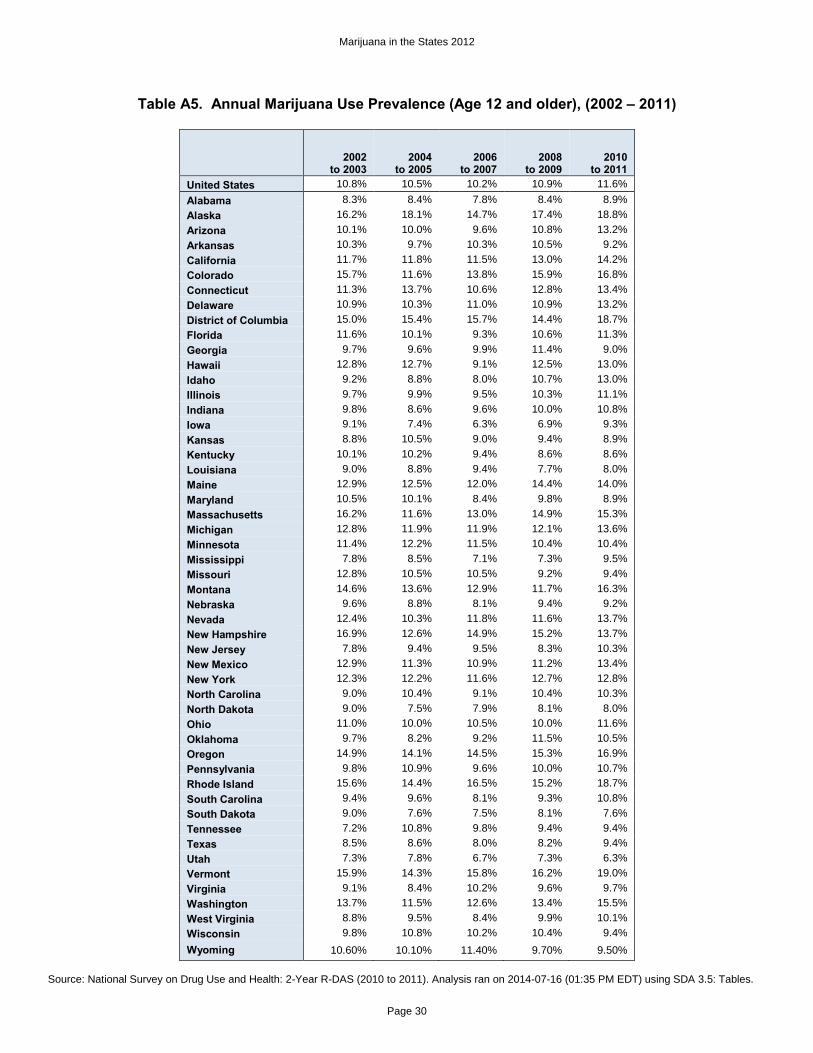
Table A5. Annual Marijuana Use Prevalence (Age 12 and older), (2002 – 2011)
2002
to 2003 2004
to 2005 2006
to 2007 2008
to 2009 2010
to 2011 United States 10.8% 10.5% 10.2% 10.9% 11.6% Alabama 8.3% 8.4% 7.8% 8.4% 8.9% Alaska 16.2% 18.1% 14.7% 17.4% 18.8% Arizona 10.1% 10.0% 9.6% 10.8% 13.2% Arkansas 10.3% 9.7% 10.3% 10.5% 9.2% California 11.7% 11.8% 11.5% 13.0% 14.2% Colorado 15.7% 11.6% 13.8% 15.9% 16.8% Connecticut 11.3% 13.7% 10.6% 12.8% 13.4% Delaware 10.9% 10.3% 11.0% 10.9% 13.2% District of Columbia 15.0% 15.4% 15.7% 14.4% 18.7% Florida 11.6% 10.1% 9.3% 10.6% 11.3% Georgia 9.7% 9.6% 9.9% 11.4% 9.0% Hawaii 12.8% 12.7% 9.1% 12.5% 13.0% Idaho 9.2% 8.8% 8.0% 10.7% 13.0% Illinois 9.7% 9.9% 9.5% 10.3% 11.1% Indiana 9.8% 8.6% 9.6% 10.0% 10.8% Iowa 9.1% 7.4% 6.3% 6.9% 9.3% Kansas 8.8% 10.5% 9.0% 9.4% 8.9% Kentucky 10.1% 10.2% 9.4% 8.6% 8.6% Louisiana 9.0% 8.8% 9.4% 7.7% 8.0% Maine 12.9% 12.5% 12.0% 14.4% 14.0% Maryland 10.5% 10.1% 8.4% 9.8% 8.9% Massachusetts 16.2% 11.6% 13.0% 14.9% 15.3% Michigan 12.8% 11.9% 11.9% 12.1% 13.6% Minnesota 11.4% 12.2% 11.5% 10.4% 10.4% Mississippi 7.8% 8.5% 7.1% 7.3% 9.5% Missouri 12.8% 10.5% 10.5% 9.2% 9.4% Montana 14.6% 13.6% 12.9% 11.7% 16.3% Nebraska 9.6% 8.8% 8.1% 9.4% 9.2% Nevada 12.4% 10.3% 11.8% 11.6% 13.7% New Hampshire 16.9% 12.6% 14.9% 15.2% 13.7% New Jersey 7.8% 9.4% 9.5% 8.3% 10.3% New Mexico 12.9% 11.3% 10.9% 11.2% 13.4% New York 12.3% 12.2% 11.6% 12.7% 12.8% North Carolina 9.0% 10.4% 9.1% 10.4% 10.3% North Dakota 9.0% 7.5% 7.9% 8.1% 8.0% Ohio 11.0% 10.0% 10.5% 10.0% 11.6% Oklahoma 9.7% 8.2% 9.2% 11.5% 10.5% Oregon 14.9% 14.1% 14.5% 15.3% 16.9% Pennsylvania 9.8% 10.9% 9.6% 10.0% 10.7% Rhode Island 15.6% 14.4% 16.5% 15.2% 18.7% South Carolina 9.4% 9.6% 8.1% 9.3% 10.8% South Dakota 9.0% 7.6% 7.5% 8.1% 7.6% Tennessee 7.2% 10.8% 9.8% 9.4% 9.4% Texas 8.5% 8.6% 8.0% 8.2% 9.4% Utah 7.3% 7.8% 6.7% 7.3% 6.3% Vermont 15.9% 14.3% 15.8% 16.2% 19.0% Virginia 9.1% 8.4% 10.2% 9.6% 9.7% Washington 13.7% 11.5% 12.6% 13.4% 15.5% West Virginia 8.8% 9.5% 8.4% 9.9% 10.1% Wisconsin 9.8% 10.8% 10.2% 10.4% 9.4% Wyoming 10.60% 10.10% 11.40% 9.70% 9.50%
Source: National Survey on Drug Use and Health: 2-Year R-DAS (2010 to 2011). Analysis ran on 2014-07-16 (01:35 PM EDT) using SDA 3.5: Tables.
Marijuana in the States 2012
Page 30
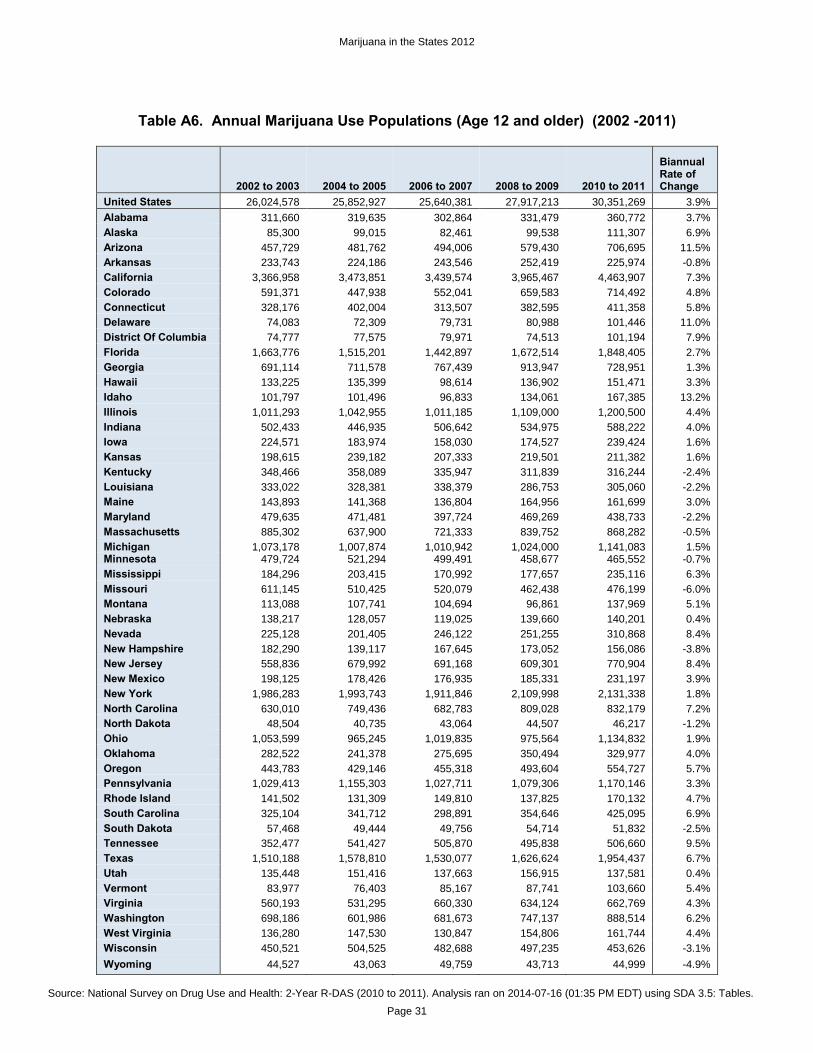
Table A6. Annual Marijuana Use Populations (Age 12 and older) (2002 -2011)
2002 to 2003 2004 to 2005 2006 to 2007 2008 to 2009 2010 to 2011
Biannual Rate of Change
United States 26,024,578 25,852,927 25,640,381 27,917,213 30,351,269 3.9% Alabama 311,660 319,635 302,864 331,479 360,772 3.7% Alaska 85,300 99,015 82,461 99,538 111,307 6.9% Arizona 457,729 481,762 494,006 579,430 706,695 11.5% Arkansas 233,743 224,186 243,546 252,419 225,974 -0.8% California 3,366,958 3,473,851 3,439,574 3,965,467 4,463,907 7.3% Colorado 591,371 447,938 552,041 659,583 714,492 4.8% Connecticut 328,176 402,004 313,507 382,595 411,358 5.8% Delaware 74,083 72,309 79,731 80,988 101,446 11.0% District Of Columbia 74,777 77,575 79,971 74,513 101,194 7.9% Florida 1,663,776 1,515,201 1,442,897 1,672,514 1,848,405 2.7% Georgia 691,114 711,578 767,439 913,947 728,951 1.3% Hawaii 133,225 135,399 98,614 136,902 151,471 3.3% Idaho 101,797 101,496 96,833 134,061 167,385 13.2% Illinois 1,011,293 1,042,955 1,011,185 1,109,000 1,200,500 4.4% Indiana 502,433 446,935 506,642 534,975 588,222 4.0% Iowa 224,571 183,974 158,030 174,527 239,424 1.6% Kansas 198,615 239,182 207,333 219,501 211,382 1.6% Kentucky 348,466 358,089 335,947 311,839 316,244 -2.4% Louisiana 333,022 328,381 338,379 286,753 305,060 -2.2% Maine 143,893 141,368 136,804 164,956 161,699 3.0% Maryland 479,635 471,481 397,724 469,269 438,733 -2.2% Massachusetts 885,302 637,900 721,333 839,752 868,282 -0.5% Michigan 1,073,178 1,007,874 1,010,942 1,024,000 1,141,083 1.5% Minnesota 479,724 521,294 499,491 458,677 465,552 -0.7% Mississippi 184,296 203,415 170,992 177,657 235,116 6.3% Missouri 611,145 510,425 520,079 462,438 476,199 -6.0% Montana 113,088 107,741 104,694 96,861 137,969 5.1% Nebraska 138,217 128,057 119,025 139,660 140,201 0.4% Nevada 225,128 201,405 246,122 251,255 310,868 8.4% New Hampshire 182,290 139,117 167,645 173,052 156,086 -3.8% New Jersey 558,836 679,992 691,168 609,301 770,904 8.4% New Mexico 198,125 178,426 176,935 185,331 231,197 3.9% New York 1,986,283 1,993,743 1,911,846 2,109,998 2,131,338 1.8% North Carolina 630,010 749,436 682,783 809,028 832,179 7.2% North Dakota 48,504 40,735 43,064 44,507 46,217 -1.2% Ohio 1,053,599 965,245 1,019,835 975,564 1,134,832 1.9% Oklahoma 282,522 241,378 275,695 350,494 329,977 4.0% Oregon 443,783 429,146 455,318 493,604 554,727 5.7% Pennsylvania 1,029,413 1,155,303 1,027,711 1,079,306 1,170,146 3.3% Rhode Island 141,502 131,309 149,810 137,825 170,132 4.7% South Carolina 325,104 341,712 298,891 354,646 425,095 6.9% South Dakota 57,468 49,444 49,756 54,714 51,832 -2.5% Tennessee 352,477 541,427 505,870 495,838 506,660 9.5% Texas 1,510,188 1,578,810 1,530,077 1,626,624 1,954,437 6.7% Utah 135,448 151,416 137,663 156,915 137,581 0.4% Vermont 83,977 76,403 85,167 87,741 103,660 5.4% Virginia 560,193 531,295 660,330 634,124 662,769 4.3% Washington 698,186 601,986 681,673 747,137 888,514 6.2% West Virginia 136,280 147,530 130,847 154,806 161,744 4.4% Wisconsin 450,521 504,525 482,688 497,235 453,626 -3.1% Wyoming 44,527 43,063 49,759 43,713 44,999 -4.9%
Source: National Survey on Drug Use and Health: 2-Year R-DAS (2010 to 2011). Analysis ran on 2014-07-16 (01:35 PM EDT) using SDA 3.5: Tables.
Marijuana in the States 2012
Page 31
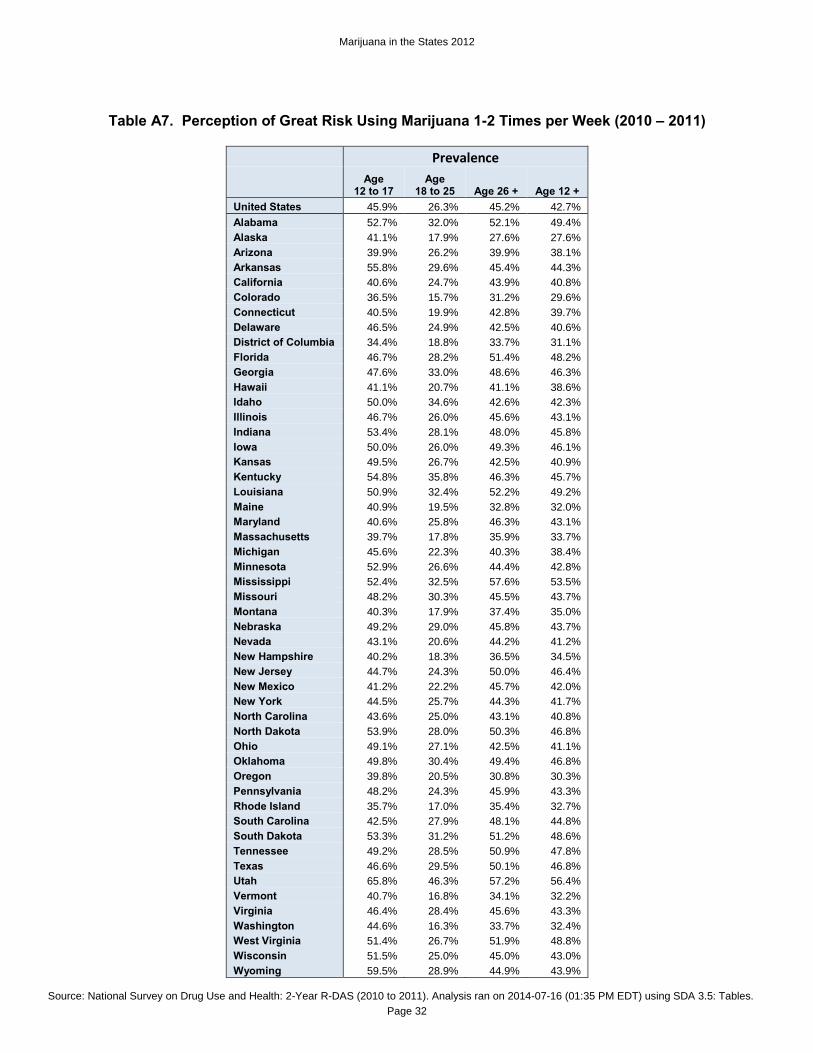
Table A7. Perception of Great Risk Using Marijuana 1-2 Times per Week (2010 – 2011)
Prevalence
Age
12 to 17 Age
18 to 25 Age 26 + Age 12 + United States 45.9% 26.3% 45.2% 42.7% Alabama 52.7% 32.0% 52.1% 49.4% Alaska 41.1% 17.9% 27.6% 27.6% Arizona 39.9% 26.2% 39.9% 38.1% Arkansas 55.8% 29.6% 45.4% 44.3% California 40.6% 24.7% 43.9% 40.8% Colorado 36.5% 15.7% 31.2% 29.6% Connecticut 40.5% 19.9% 42.8% 39.7% Delaware 46.5% 24.9% 42.5% 40.6% District of Columbia 34.4% 18.8% 33.7% 31.1% Florida 46.7% 28.2% 51.4% 48.2% Georgia 47.6% 33.0% 48.6% 46.3% Hawaii 41.1% 20.7% 41.1% 38.6% Idaho 50.0% 34.6% 42.6% 42.3% Illinois 46.7% 26.0% 45.6% 43.1% Indiana 53.4% 28.1% 48.0% 45.8% Iowa 50.0% 26.0% 49.3% 46.1% Kansas 49.5% 26.7% 42.5% 40.9% Kentucky 54.8% 35.8% 46.3% 45.7% Louisiana 50.9% 32.4% 52.2% 49.2% Maine 40.9% 19.5% 32.8% 32.0% Maryland 40.6% 25.8% 46.3% 43.1% Massachusetts 39.7% 17.8% 35.9% 33.7% Michigan 45.6% 22.3% 40.3% 38.4% Minnesota 52.9% 26.6% 44.4% 42.8% Mississippi 52.4% 32.5% 57.6% 53.5% Missouri 48.2% 30.3% 45.5% 43.7% Montana 40.3% 17.9% 37.4% 35.0% Nebraska 49.2% 29.0% 45.8% 43.7% Nevada 43.1% 20.6% 44.2% 41.2% New Hampshire 40.2% 18.3% 36.5% 34.5% New Jersey 44.7% 24.3% 50.0% 46.4% New Mexico 41.2% 22.2% 45.7% 42.0% New York 44.5% 25.7% 44.3% 41.7% North Carolina 43.6% 25.0% 43.1% 40.8% North Dakota 53.9% 28.0% 50.3% 46.8% Ohio 49.1% 27.1% 42.5% 41.1% Oklahoma 49.8% 30.4% 49.4% 46.8% Oregon 39.8% 20.5% 30.8% 30.3% Pennsylvania 48.2% 24.3% 45.9% 43.3% Rhode Island 35.7% 17.0% 35.4% 32.7% South Carolina 42.5% 27.9% 48.1% 44.8% South Dakota 53.3% 31.2% 51.2% 48.6% Tennessee 49.2% 28.5% 50.9% 47.8% Texas 46.6% 29.5% 50.1% 46.8% Utah 65.8% 46.3% 57.2% 56.4% Vermont 40.7% 16.8% 34.1% 32.2% Virginia 46.4% 28.4% 45.6% 43.3% Washington 44.6% 16.3% 33.7% 32.4% West Virginia 51.4% 26.7% 51.9% 48.8% Wisconsin 51.5% 25.0% 45.0% 43.0% Wyoming 59.5% 28.9% 44.9% 43.9%
Source: National Survey on Drug Use and Health: 2-Year R-DAS (2010 to 2011). Analysis ran on 2014-07-16 (01:35 PM EDT) using SDA 3.5: Tables.
Marijuana in the States 2012
Page 32
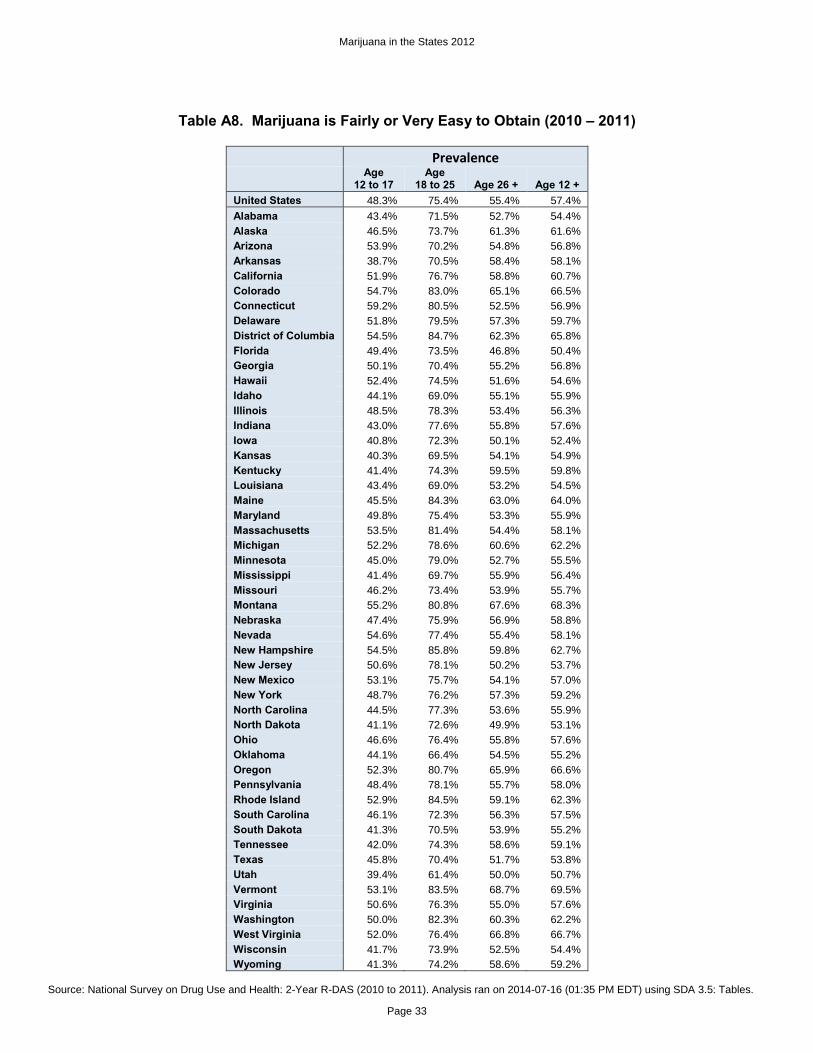
Table A8. Marijuana is Fairly or Very Easy to Obtain (2010 – 2011)
Prevalence
Age
12 to 17 Age
18 to 25 Age 26 + Age 12 + United States 48.3% 75.4% 55.4% 57.4% Alabama 43.4% 71.5% 52.7% 54.4% Alaska 46.5% 73.7% 61.3% 61.6% Arizona 53.9% 70.2% 54.8% 56.8% Arkansas 38.7% 70.5% 58.4% 58.1% California 51.9% 76.7% 58.8% 60.7% Colorado 54.7% 83.0% 65.1% 66.5% Connecticut 59.2% 80.5% 52.5% 56.9% Delaware 51.8% 79.5% 57.3% 59.7% District of Columbia 54.5% 84.7% 62.3% 65.8% Florida 49.4% 73.5% 46.8% 50.4% Georgia 50.1% 70.4% 55.2% 56.8% Hawaii 52.4% 74.5% 51.6% 54.6% Idaho 44.1% 69.0% 55.1% 55.9% Illinois 48.5% 78.3% 53.4% 56.3% Indiana 43.0% 77.6% 55.8% 57.6% Iowa 40.8% 72.3% 50.1% 52.4% Kansas 40.3% 69.5% 54.1% 54.9% Kentucky 41.4% 74.3% 59.5% 59.8% Louisiana 43.4% 69.0% 53.2% 54.5% Maine 45.5% 84.3% 63.0% 64.0% Maryland 49.8% 75.4% 53.3% 55.9% Massachusetts 53.5% 81.4% 54.4% 58.1% Michigan 52.2% 78.6% 60.6% 62.2% Minnesota 45.0% 79.0% 52.7% 55.5% Mississippi 41.4% 69.7% 55.9% 56.4% Missouri 46.2% 73.4% 53.9% 55.7% Montana 55.2% 80.8% 67.6% 68.3% Nebraska 47.4% 75.9% 56.9% 58.8% Nevada 54.6% 77.4% 55.4% 58.1% New Hampshire 54.5% 85.8% 59.8% 62.7% New Jersey 50.6% 78.1% 50.2% 53.7% New Mexico 53.1% 75.7% 54.1% 57.0% New York 48.7% 76.2% 57.3% 59.2% North Carolina 44.5% 77.3% 53.6% 55.9% North Dakota 41.1% 72.6% 49.9% 53.1% Ohio 46.6% 76.4% 55.8% 57.6% Oklahoma 44.1% 66.4% 54.5% 55.2% Oregon 52.3% 80.7% 65.9% 66.6% Pennsylvania 48.4% 78.1% 55.7% 58.0% Rhode Island 52.9% 84.5% 59.1% 62.3% South Carolina 46.1% 72.3% 56.3% 57.5% South Dakota 41.3% 70.5% 53.9% 55.2% Tennessee 42.0% 74.3% 58.6% 59.1% Texas 45.8% 70.4% 51.7% 53.8% Utah 39.4% 61.4% 50.0% 50.7% Vermont 53.1% 83.5% 68.7% 69.5% Virginia 50.6% 76.3% 55.0% 57.6% Washington 50.0% 82.3% 60.3% 62.2% West Virginia 52.0% 76.4% 66.8% 66.7% Wisconsin 41.7% 73.9% 52.5% 54.4% Wyoming 41.3% 74.2% 58.6% 59.2%
Source: National Survey on Drug Use and Health: 2-Year R-DAS (2010 to 2011). Analysis ran on 2014-07-16 (01:35 PM EDT) using SDA 3.5: Tables.
Marijuana in the States 2012
Page 33
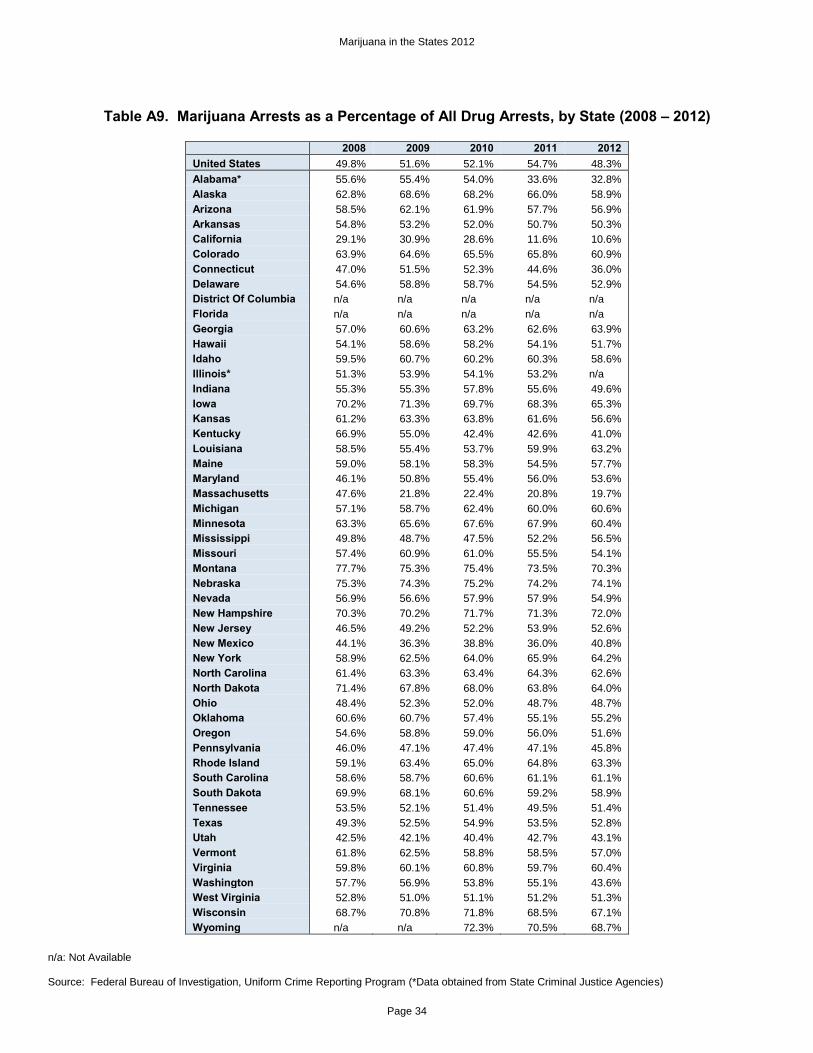
Table A9. Marijuana Arrests as a Percentage of All Drug Arrests, by State (2008 – 2012)
2008 2009 2010 2011 2012 United States 49.8% 51.6% 52.1% 54.7% 48.3% Alabama* 55.6% 55.4% 54.0% 33.6% 32.8% Alaska 62.8% 68.6% 68.2% 66.0% 58.9% Arizona 58.5% 62.1% 61.9% 57.7% 56.9% Arkansas 54.8% 53.2% 52.0% 50.7% 50.3% California 29.1% 30.9% 28.6% 11.6% 10.6% Colorado 63.9% 64.6% 65.5% 65.8% 60.9% Connecticut 47.0% 51.5% 52.3% 44.6% 36.0% Delaware 54.6% 58.8% 58.7% 54.5% 52.9% District Of Columbia n/a n/a n/a n/a n/a Florida n/a n/a n/a n/a n/a Georgia 57.0% 60.6% 63.2% 62.6% 63.9% Hawaii 54.1% 58.6% 58.2% 54.1% 51.7% Idaho 59.5% 60.7% 60.2% 60.3% 58.6% Illinois* 51.3% 53.9% 54.1% 53.2% n/a Indiana 55.3% 55.3% 57.8% 55.6% 49.6% Iowa 70.2% 71.3% 69.7% 68.3% 65.3% Kansas 61.2% 63.3% 63.8% 61.6% 56.6% Kentucky 66.9% 55.0% 42.4% 42.6% 41.0% Louisiana 58.5% 55.4% 53.7% 59.9% 63.2% Maine 59.0% 58.1% 58.3% 54.5% 57.7% Maryland 46.1% 50.8% 55.4% 56.0% 53.6% Massachusetts 47.6% 21.8% 22.4% 20.8% 19.7% Michigan 57.1% 58.7% 62.4% 60.0% 60.6% Minnesota 63.3% 65.6% 67.6% 67.9% 60.4% Mississippi 49.8% 48.7% 47.5% 52.2% 56.5% Missouri 57.4% 60.9% 61.0% 55.5% 54.1% Montana 77.7% 75.3% 75.4% 73.5% 70.3% Nebraska 75.3% 74.3% 75.2% 74.2% 74.1% Nevada 56.9% 56.6% 57.9% 57.9% 54.9% New Hampshire 70.3% 70.2% 71.7% 71.3% 72.0% New Jersey 46.5% 49.2% 52.2% 53.9% 52.6% New Mexico 44.1% 36.3% 38.8% 36.0% 40.8% New York 58.9% 62.5% 64.0% 65.9% 64.2% North Carolina 61.4% 63.3% 63.4% 64.3% 62.6% North Dakota 71.4% 67.8% 68.0% 63.8% 64.0% Ohio 48.4% 52.3% 52.0% 48.7% 48.7% Oklahoma 60.6% 60.7% 57.4% 55.1% 55.2% Oregon 54.6% 58.8% 59.0% 56.0% 51.6% Pennsylvania 46.0% 47.1% 47.4% 47.1% 45.8% Rhode Island 59.1% 63.4% 65.0% 64.8% 63.3% South Carolina 58.6% 58.7% 60.6% 61.1% 61.1% South Dakota 69.9% 68.1% 60.6% 59.2% 58.9% Tennessee 53.5% 52.1% 51.4% 49.5% 51.4% Texas 49.3% 52.5% 54.9% 53.5% 52.8% Utah 42.5% 42.1% 40.4% 42.7% 43.1% Vermont 61.8% 62.5% 58.8% 58.5% 57.0% Virginia 59.8% 60.1% 60.8% 59.7% 60.4% Washington 57.7% 56.9% 53.8% 55.1% 43.6% West Virginia 52.8% 51.0% 51.1% 51.2% 51.3% Wisconsin 68.7% 70.8% 71.8% 68.5% 67.1% Wyoming n/a n/a 72.3% 70.5% 68.7%
n/a: Not Available Source: Federal Bureau of Investigation, Uniform Crime Reporting Program (*Data obtained from State Criminal Justice Agencies)
Marijuana in the States 2012
Page 34
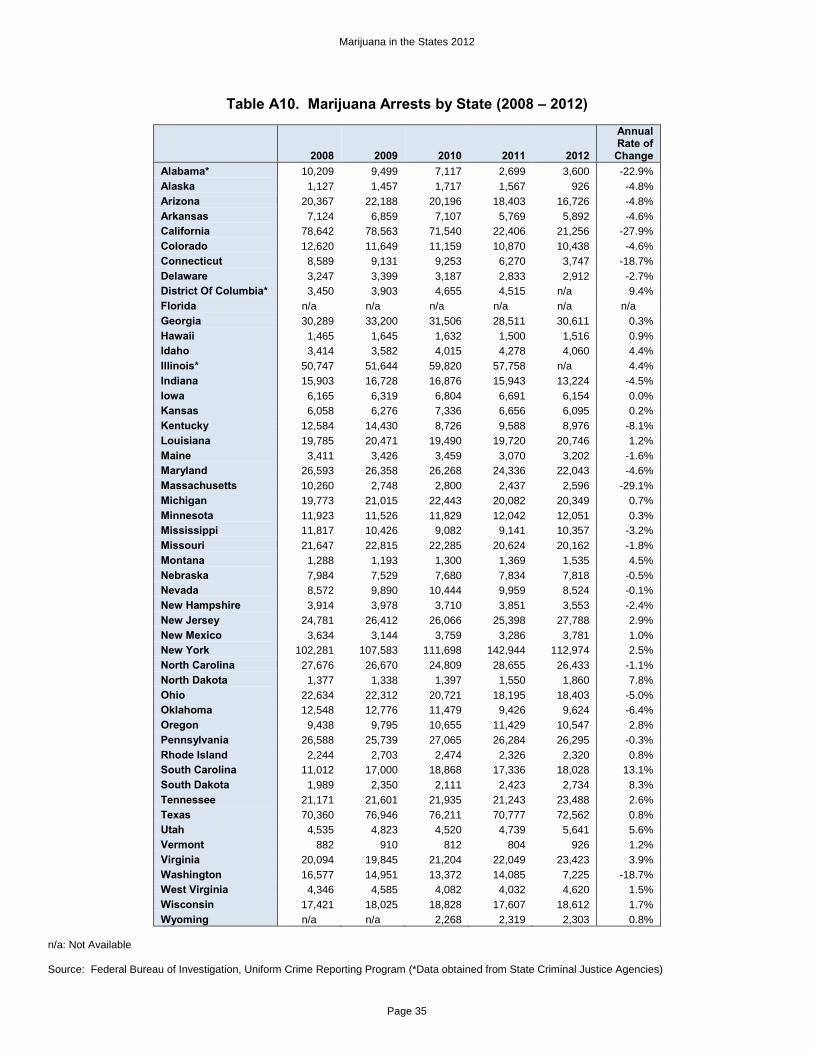
Table A10. Marijuana Arrests by State (2008 – 2012)
2008 2009 2010 2011 2012
Annual Rate of Change
Alabama* 10,209 9,499 7,117 2,699 3,600 -22.9% Alaska 1,127 1,457 1,717 1,567 926 -4.8% Arizona 20,367 22,188 20,196 18,403 16,726 -4.8% Arkansas 7,124 6,859 7,107 5,769 5,892 -4.6% California 78,642 78,563 71,540 22,406 21,256 -27.9% Colorado 12,620 11,649 11,159 10,870 10,438 -4.6% Connecticut 8,589 9,131 9,253 6,270 3,747 -18.7% Delaware 3,247 3,399 3,187 2,833 2,912 -2.7% District Of Columbia* 3,450 3,903 4,655 4,515 n/a 9.4% Florida n/a n/a n/a n/a n/a n/a Georgia 30,289 33,200 31,506 28,511 30,611 0.3% Hawaii 1,465 1,645 1,632 1,500 1,516 0.9% Idaho 3,414 3,582 4,015 4,278 4,060 4.4% Illinois* 50,747 51,644 59,820 57,758 n/a 4.4% Indiana 15,903 16,728 16,876 15,943 13,224 -4.5% Iowa 6,165 6,319 6,804 6,691 6,154 0.0% Kansas 6,058 6,276 7,336 6,656 6,095 0.2% Kentucky 12,584 14,430 8,726 9,588 8,976 -8.1% Louisiana 19,785 20,471 19,490 19,720 20,746 1.2% Maine 3,411 3,426 3,459 3,070 3,202 -1.6% Maryland 26,593 26,358 26,268 24,336 22,043 -4.6% Massachusetts 10,260 2,748 2,800 2,437 2,596 -29.1% Michigan 19,773 21,015 22,443 20,082 20,349 0.7% Minnesota 11,923 11,526 11,829 12,042 12,051 0.3% Mississippi 11,817 10,426 9,082 9,141 10,357 -3.2% Missouri 21,647 22,815 22,285 20,624 20,162 -1.8% Montana 1,288 1,193 1,300 1,369 1,535 4.5% Nebraska 7,984 7,529 7,680 7,834 7,818 -0.5% Nevada 8,572 9,890 10,444 9,959 8,524 -0.1% New Hampshire 3,914 3,978 3,710 3,851 3,553 -2.4% New Jersey 24,781 26,412 26,066 25,398 27,788 2.9% New Mexico 3,634 3,144 3,759 3,286 3,781 1.0% New York 102,281 107,583 111,698 142,944 112,974 2.5% North Carolina 27,676 26,670 24,809 28,655 26,433 -1.1% North Dakota 1,377 1,338 1,397 1,550 1,860 7.8% Ohio 22,634 22,312 20,721 18,195 18,403 -5.0% Oklahoma 12,548 12,776 11,479 9,426 9,624 -6.4% Oregon 9,438 9,795 10,655 11,429 10,547 2.8% Pennsylvania 26,588 25,739 27,065 26,284 26,295 -0.3% Rhode Island 2,244 2,703 2,474 2,326 2,320 0.8% South Carolina 11,012 17,000 18,868 17,336 18,028 13.1% South Dakota 1,989 2,350 2,111 2,423 2,734 8.3% Tennessee 21,171 21,601 21,935 21,243 23,488 2.6% Texas 70,360 76,946 76,211 70,777 72,562 0.8% Utah 4,535 4,823 4,520 4,739 5,641 5.6% Vermont 882 910 812 804 926 1.2% Virginia 20,094 19,845 21,204 22,049 23,423 3.9% Washington 16,577 14,951 13,372 14,085 7,225 -18.7% West Virginia 4,346 4,585 4,082 4,032 4,620 1.5% Wisconsin 17,421 18,025 18,828 17,607 18,612 1.7% Wyoming n/a n/a 2,268 2,319 2,303 0.8%
n/a: Not Available Source: Federal Bureau of Investigation, Uniform Crime Reporting Program (*Data obtained from State Criminal Justice Agencies)
Marijuana in the States 2012
Page 35
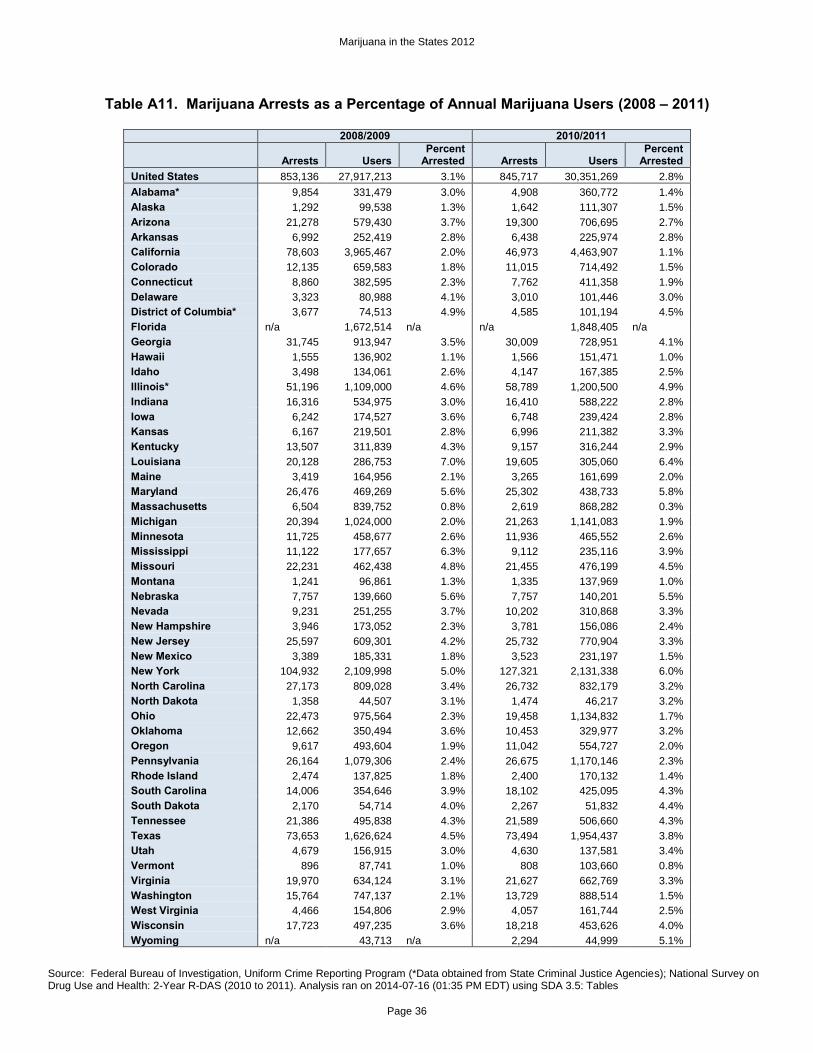
Table A11. Marijuana Arrests as a Percentage of Annual Marijuana Users (2008 – 2011)
2008/2009 2010/2011
Arrests Users
Percent Arrested Arrests Users
Percent Arrested
United States 853,136 27,917,213 3.1% 845,717 30,351,269 2.8% Alabama* 9,854 331,479 3.0% 4,908 360,772 1.4% Alaska 1,292 99,538 1.3% 1,642 111,307 1.5% Arizona 21,278 579,430 3.7% 19,300 706,695 2.7% Arkansas 6,992 252,419 2.8% 6,438 225,974 2.8% California 78,603 3,965,467 2.0% 46,973 4,463,907 1.1% Colorado 12,135 659,583 1.8% 11,015 714,492 1.5% Connecticut 8,860 382,595 2.3% 7,762 411,358 1.9% Delaware 3,323 80,988 4.1% 3,010 101,446 3.0% District of Columbia* 3,677 74,513 4.9% 4,585 101,194 4.5% Florida n/a 1,672,514 n/a n/a 1,848,405 n/a Georgia 31,745 913,947 3.5% 30,009 728,951 4.1% Hawaii 1,555 136,902 1.1% 1,566 151,471 1.0% Idaho 3,498 134,061 2.6% 4,147 167,385 2.5% Illinois* 51,196 1,109,000 4.6% 58,789 1,200,500 4.9% Indiana 16,316 534,975 3.0% 16,410 588,222 2.8% Iowa 6,242 174,527 3.6% 6,748 239,424 2.8% Kansas 6,167 219,501 2.8% 6,996 211,382 3.3% Kentucky 13,507 311,839 4.3% 9,157 316,244 2.9% Louisiana 20,128 286,753 7.0% 19,605 305,060 6.4% Maine 3,419 164,956 2.1% 3,265 161,699 2.0% Maryland 26,476 469,269 5.6% 25,302 438,733 5.8% Massachusetts 6,504 839,752 0.8% 2,619 868,282 0.3% Michigan 20,394 1,024,000 2.0% 21,263 1,141,083 1.9% Minnesota 11,725 458,677 2.6% 11,936 465,552 2.6% Mississippi 11,122 177,657 6.3% 9,112 235,116 3.9% Missouri 22,231 462,438 4.8% 21,455 476,199 4.5% Montana 1,241 96,861 1.3% 1,335 137,969 1.0% Nebraska 7,757 139,660 5.6% 7,757 140,201 5.5% Nevada 9,231 251,255 3.7% 10,202 310,868 3.3% New Hampshire 3,946 173,052 2.3% 3,781 156,086 2.4% New Jersey 25,597 609,301 4.2% 25,732 770,904 3.3% New Mexico 3,389 185,331 1.8% 3,523 231,197 1.5% New York 104,932 2,109,998 5.0% 127,321 2,131,338 6.0% North Carolina 27,173 809,028 3.4% 26,732 832,179 3.2% North Dakota 1,358 44,507 3.1% 1,474 46,217 3.2% Ohio 22,473 975,564 2.3% 19,458 1,134,832 1.7% Oklahoma 12,662 350,494 3.6% 10,453 329,977 3.2% Oregon 9,617 493,604 1.9% 11,042 554,727 2.0% Pennsylvania 26,164 1,079,306 2.4% 26,675 1,170,146 2.3% Rhode Island 2,474 137,825 1.8% 2,400 170,132 1.4% South Carolina 14,006 354,646 3.9% 18,102 425,095 4.3% South Dakota 2,170 54,714 4.0% 2,267 51,832 4.4% Tennessee 21,386 495,838 4.3% 21,589 506,660 4.3% Texas 73,653 1,626,624 4.5% 73,494 1,954,437 3.8% Utah 4,679 156,915 3.0% 4,630 137,581 3.4% Vermont 896 87,741 1.0% 808 103,660 0.8% Virginia 19,970 634,124 3.1% 21,627 662,769 3.3% Washington 15,764 747,137 2.1% 13,729 888,514 1.5% West Virginia 4,466 154,806 2.9% 4,057 161,744 2.5% Wisconsin 17,723 497,235 3.6% 18,218 453,626 4.0% Wyoming n/a 43,713 n/a 2,294 44,999 5.1%
Source: Federal Bureau of Investigation, Uniform Crime Reporting Program (*Data obtained from State Criminal Justice Agencies); National Survey on Drug Use and Health: 2-Year R-DAS (2010 to 2011). Analysis ran on 2014-07-16 (01:35 PM EDT) using SDA 3.5: Tables
Marijuana in the States 2012
Page 36
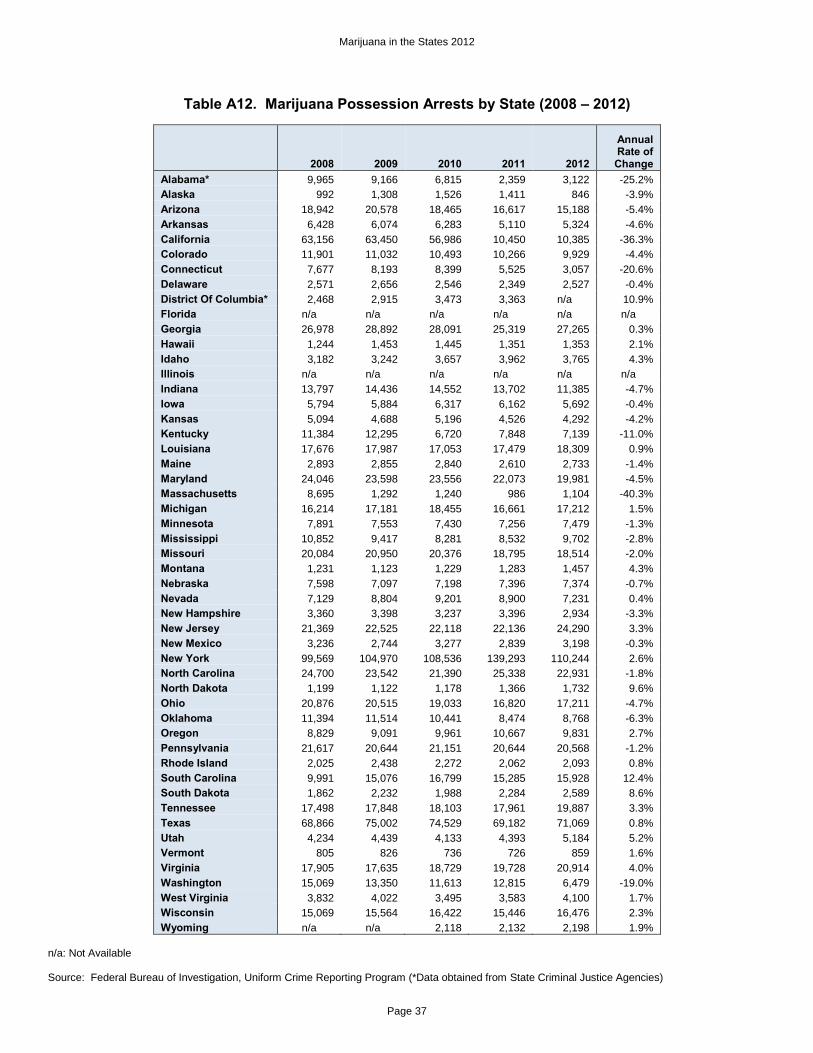
Table A12. Marijuana Possession Arrests by State (2008 – 2012)
2008 2009 2010 2011 2012
Annual Rate of Change
Alabama* 9,965 9,166 6,815 2,359 3,122 -25.2% Alaska 992 1,308 1,526 1,411 846 -3.9% Arizona 18,942 20,578 18,465 16,617 15,188 -5.4% Arkansas 6,428 6,074 6,283 5,110 5,324 -4.6% California 63,156 63,450 56,986 10,450 10,385 -36.3% Colorado 11,901 11,032 10,493 10,266 9,929 -4.4% Connecticut 7,677 8,193 8,399 5,525 3,057 -20.6% Delaware 2,571 2,656 2,546 2,349 2,527 -0.4% District Of Columbia* 2,468 2,915 3,473 3,363 n/a 10.9% Florida n/a n/a n/a n/a n/a n/a Georgia 26,978 28,892 28,091 25,319 27,265 0.3% Hawaii 1,244 1,453 1,445 1,351 1,353 2.1% Idaho 3,182 3,242 3,657 3,962 3,765 4.3% Illinois n/a n/a n/a n/a n/a n/a Indiana 13,797 14,436 14,552 13,702 11,385 -4.7% Iowa 5,794 5,884 6,317 6,162 5,692 -0.4% Kansas 5,094 4,688 5,196 4,526 4,292 -4.2% Kentucky 11,384 12,295 6,720 7,848 7,139 -11.0% Louisiana 17,676 17,987 17,053 17,479 18,309 0.9% Maine 2,893 2,855 2,840 2,610 2,733 -1.4% Maryland 24,046 23,598 23,556 22,073 19,981 -4.5% Massachusetts 8,695 1,292 1,240 986 1,104 -40.3% Michigan 16,214 17,181 18,455 16,661 17,212 1.5% Minnesota 7,891 7,553 7,430 7,256 7,479 -1.3% Mississippi 10,852 9,417 8,281 8,532 9,702 -2.8% Missouri 20,084 20,950 20,376 18,795 18,514 -2.0% Montana 1,231 1,123 1,229 1,283 1,457 4.3% Nebraska 7,598 7,097 7,198 7,396 7,374 -0.7% Nevada 7,129 8,804 9,201 8,900 7,231 0.4% New Hampshire 3,360 3,398 3,237 3,396 2,934 -3.3% New Jersey 21,369 22,525 22,118 22,136 24,290 3.3% New Mexico 3,236 2,744 3,277 2,839 3,198 -0.3% New York 99,569 104,970 108,536 139,293 110,244 2.6% North Carolina 24,700 23,542 21,390 25,338 22,931 -1.8% North Dakota 1,199 1,122 1,178 1,366 1,732 9.6% Ohio 20,876 20,515 19,033 16,820 17,211 -4.7% Oklahoma 11,394 11,514 10,441 8,474 8,768 -6.3% Oregon 8,829 9,091 9,961 10,667 9,831 2.7% Pennsylvania 21,617 20,644 21,151 20,644 20,568 -1.2% Rhode Island 2,025 2,438 2,272 2,062 2,093 0.8% South Carolina 9,991 15,076 16,799 15,285 15,928 12.4% South Dakota 1,862 2,232 1,988 2,284 2,589 8.6% Tennessee 17,498 17,848 18,103 17,961 19,887 3.3% Texas 68,866 75,002 74,529 69,182 71,069 0.8% Utah 4,234 4,439 4,133 4,393 5,184 5.2% Vermont 805 826 736 726 859 1.6% Virginia 17,905 17,635 18,729 19,728 20,914 4.0% Washington 15,069 13,350 11,613 12,815 6,479 -19.0% West Virginia 3,832 4,022 3,495 3,583 4,100 1.7% Wisconsin 15,069 15,564 16,422 15,446 16,476 2.3% Wyoming n/a n/a 2,118 2,132 2,198 1.9%
n/a: Not Available Source: Federal Bureau of Investigation, Uniform Crime Reporting Program (*Data obtained from State Criminal Justice Agencies)
Marijuana in the States 2012
Page 37
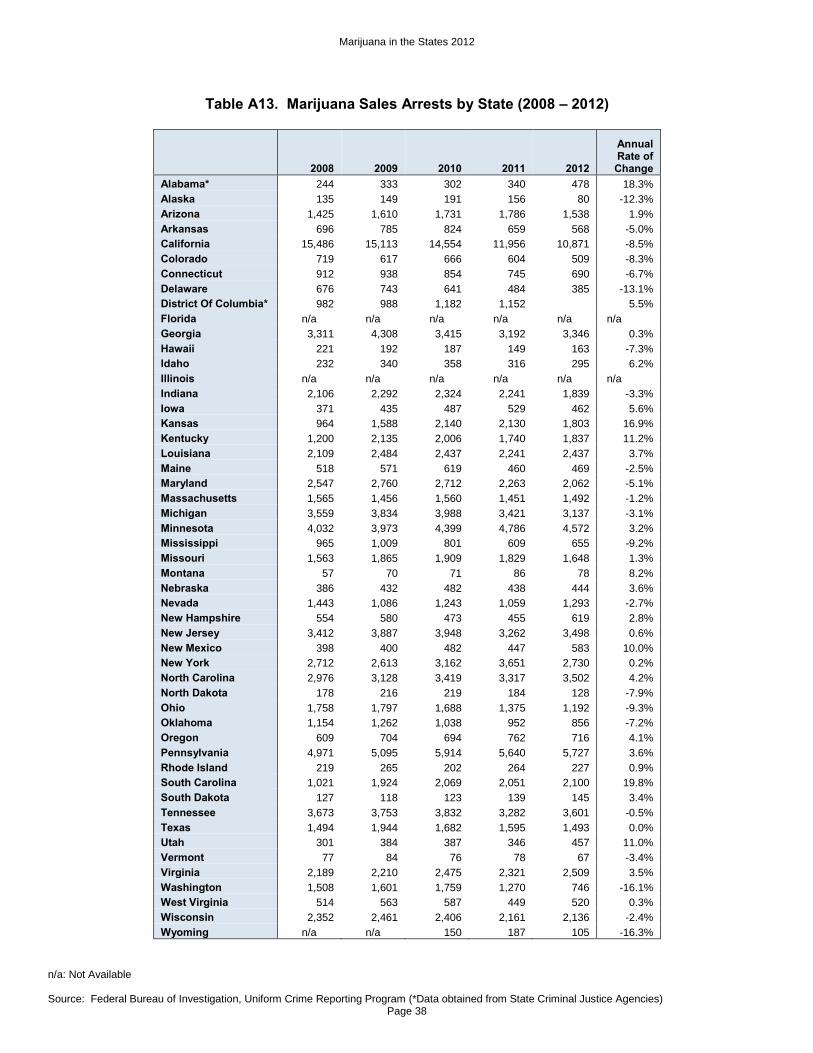
Table A13. Marijuana Sales Arrests by State (2008 – 2012)
2008 2009 2010 2011 2012
Annual Rate of Change
Alabama* 244 333 302 340 478 18.3% Alaska 135 149 191 156 80 -12.3% Arizona 1,425 1,610 1,731 1,786 1,538 1.9% Arkansas 696 785 824 659 568 -5.0% California 15,486 15,113 14,554 11,956 10,871 -8.5% Colorado 719 617 666 604 509 -8.3% Connecticut 912 938 854 745 690 -6.7% Delaware 676 743 641 484 385 -13.1% District Of Columbia* 982 988 1,182 1,152
5.5%
Florida n/a n/a n/a n/a n/a n/a Georgia 3,311 4,308 3,415 3,192 3,346 0.3% Hawaii 221 192 187 149 163 -7.3% Idaho 232 340 358 316 295 6.2% Illinois n/a n/a n/a n/a n/a n/a Indiana 2,106 2,292 2,324 2,241 1,839 -3.3% Iowa 371 435 487 529 462 5.6% Kansas 964 1,588 2,140 2,130 1,803 16.9% Kentucky 1,200 2,135 2,006 1,740 1,837 11.2% Louisiana 2,109 2,484 2,437 2,241 2,437 3.7% Maine 518 571 619 460 469 -2.5% Maryland 2,547 2,760 2,712 2,263 2,062 -5.1% Massachusetts 1,565 1,456 1,560 1,451 1,492 -1.2% Michigan 3,559 3,834 3,988 3,421 3,137 -3.1% Minnesota 4,032 3,973 4,399 4,786 4,572 3.2% Mississippi 965 1,009 801 609 655 -9.2% Missouri 1,563 1,865 1,909 1,829 1,648 1.3% Montana 57 70 71 86 78 8.2% Nebraska 386 432 482 438 444 3.6% Nevada 1,443 1,086 1,243 1,059 1,293 -2.7% New Hampshire 554 580 473 455 619 2.8% New Jersey 3,412 3,887 3,948 3,262 3,498 0.6% New Mexico 398 400 482 447 583 10.0% New York 2,712 2,613 3,162 3,651 2,730 0.2% North Carolina 2,976 3,128 3,419 3,317 3,502 4.2% North Dakota 178 216 219 184 128 -7.9% Ohio 1,758 1,797 1,688 1,375 1,192 -9.3% Oklahoma 1,154 1,262 1,038 952 856 -7.2% Oregon 609 704 694 762 716 4.1% Pennsylvania 4,971 5,095 5,914 5,640 5,727 3.6% Rhode Island 219 265 202 264 227 0.9% South Carolina 1,021 1,924 2,069 2,051 2,100 19.8% South Dakota 127 118 123 139 145 3.4% Tennessee 3,673 3,753 3,832 3,282 3,601 -0.5% Texas 1,494 1,944 1,682 1,595 1,493 0.0% Utah 301 384 387 346 457 11.0% Vermont 77 84 76 78 67 -3.4% Virginia 2,189 2,210 2,475 2,321 2,509 3.5% Washington 1,508 1,601 1,759 1,270 746 -16.1% West Virginia 514 563 587 449 520 0.3% Wisconsin 2,352 2,461 2,406 2,161 2,136 -2.4% Wyoming n/a n/a 150 187 105 -16.3%
n/a: Not Available Source: Federal Bureau of Investigation, Uniform Crime Reporting Program (*Data obtained from State Criminal Justice Agencies)
Marijuana in the States 2012
Page 38
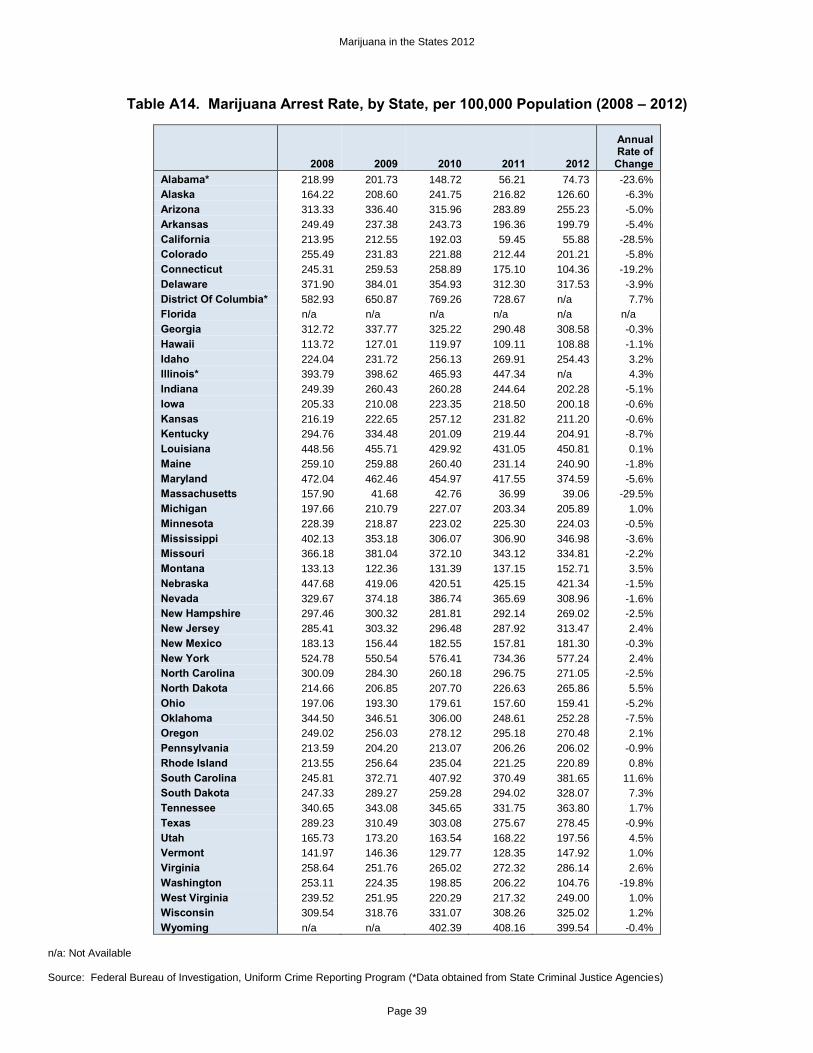
Table A14. Marijuana Arrest Rate, by State, per 100,000 Population (2008 – 2012)
2008 2009 2010 2011 2012
Annual Rate of Change
Alabama* 218.99 201.73 148.72 56.21 74.73 -23.6% Alaska 164.22 208.60 241.75 216.82 126.60 -6.3% Arizona 313.33 336.40 315.96 283.89 255.23 -5.0% Arkansas 249.49 237.38 243.73 196.36 199.79 -5.4% California 213.95 212.55 192.03 59.45 55.88 -28.5% Colorado 255.49 231.83 221.88 212.44 201.21 -5.8% Connecticut 245.31 259.53 258.89 175.10 104.36 -19.2% Delaware 371.90 384.01 354.93 312.30 317.53 -3.9% District Of Columbia* 582.93 650.87 769.26 728.67 n/a 7.7% Florida n/a n/a n/a n/a n/a n/a Georgia 312.72 337.77 325.22 290.48 308.58 -0.3% Hawaii 113.72 127.01 119.97 109.11 108.88 -1.1% Idaho 224.04 231.72 256.13 269.91 254.43 3.2% Illinois* 393.79 398.62 465.93 447.34 n/a 4.3% Indiana 249.39 260.43 260.28 244.64 202.28 -5.1% Iowa 205.33 210.08 223.35 218.50 200.18 -0.6% Kansas 216.19 222.65 257.12 231.82 211.20 -0.6% Kentucky 294.76 334.48 201.09 219.44 204.91 -8.7% Louisiana 448.56 455.71 429.92 431.05 450.81 0.1% Maine 259.10 259.88 260.40 231.14 240.90 -1.8% Maryland 472.04 462.46 454.97 417.55 374.59 -5.6% Massachusetts 157.90 41.68 42.76 36.99 39.06 -29.5% Michigan 197.66 210.79 227.07 203.34 205.89 1.0% Minnesota 228.39 218.87 223.02 225.30 224.03 -0.5% Mississippi 402.13 353.18 306.07 306.90 346.98 -3.6% Missouri 366.18 381.04 372.10 343.12 334.81 -2.2% Montana 133.13 122.36 131.39 137.15 152.71 3.5% Nebraska 447.68 419.06 420.51 425.15 421.34 -1.5% Nevada 329.67 374.18 386.74 365.69 308.96 -1.6% New Hampshire 297.46 300.32 281.81 292.14 269.02 -2.5% New Jersey 285.41 303.32 296.48 287.92 313.47 2.4% New Mexico 183.13 156.44 182.55 157.81 181.30 -0.3% New York 524.78 550.54 576.41 734.36 577.24 2.4% North Carolina 300.09 284.30 260.18 296.75 271.05 -2.5% North Dakota 214.66 206.85 207.70 226.63 265.86 5.5% Ohio 197.06 193.30 179.61 157.60 159.41 -5.2% Oklahoma 344.50 346.51 306.00 248.61 252.28 -7.5% Oregon 249.02 256.03 278.12 295.18 270.48 2.1% Pennsylvania 213.59 204.20 213.07 206.26 206.02 -0.9% Rhode Island 213.55 256.64 235.04 221.25 220.89 0.8% South Carolina 245.81 372.71 407.92 370.49 381.65 11.6% South Dakota 247.33 289.27 259.28 294.02 328.07 7.3% Tennessee 340.65 343.08 345.65 331.75 363.80 1.7% Texas 289.23 310.49 303.08 275.67 278.45 -0.9% Utah 165.73 173.20 163.54 168.22 197.56 4.5% Vermont 141.97 146.36 129.77 128.35 147.92 1.0% Virginia 258.64 251.76 265.02 272.32 286.14 2.6% Washington 253.11 224.35 198.85 206.22 104.76 -19.8% West Virginia 239.52 251.95 220.29 217.32 249.00 1.0% Wisconsin 309.54 318.76 331.07 308.26 325.02 1.2% Wyoming n/a n/a 402.39 408.16 399.54 -0.4%
n/a: Not Available Source: Federal Bureau of Investigation, Uniform Crime Reporting Program (*Data obtained from State Criminal Justice Agencies)
Marijuana in the States 2012
Page 39
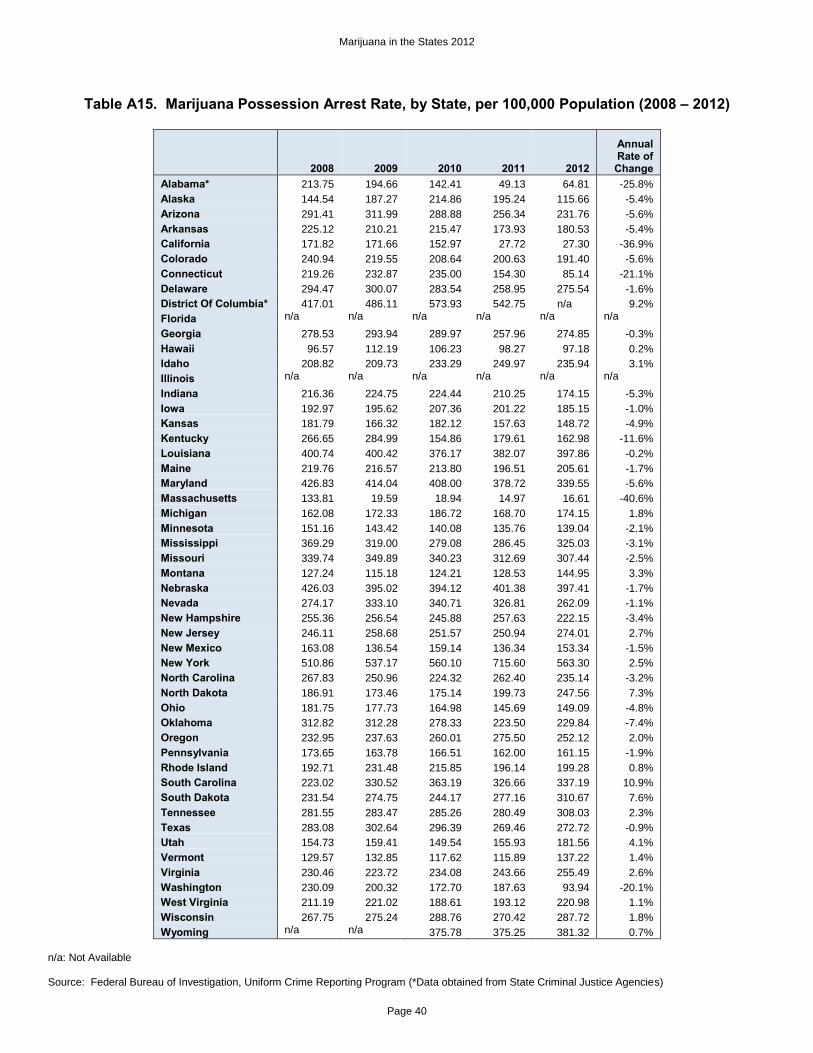
Table A15. Marijuana Possession Arrest Rate, by State, per 100,000 Population (2008 – 2012)
2008 2009 2010 2011 2012
Annual Rate of Change
Alabama* 213.75 194.66 142.41 49.13 64.81 -25.8% Alaska 144.54 187.27 214.86 195.24 115.66 -5.4% Arizona 291.41 311.99 288.88 256.34 231.76 -5.6% Arkansas 225.12 210.21 215.47 173.93 180.53 -5.4% California 171.82 171.66 152.97 27.72 27.30 -36.9% Colorado 240.94 219.55 208.64 200.63 191.40 -5.6% Connecticut 219.26 232.87 235.00 154.30 85.14 -21.1% Delaware 294.47 300.07 283.54 258.95 275.54 -1.6% District Of Columbia* 417.01 486.11 573.93 542.75 n/a 9.2% Florida n/a n/a n/a n/a n/a n/a Georgia 278.53 293.94 289.97 257.96 274.85 -0.3% Hawaii 96.57 112.19 106.23 98.27 97.18 0.2% Idaho 208.82 209.73 233.29 249.97 235.94 3.1% Illinois n/a n/a n/a n/a n/a n/a Indiana 216.36 224.75 224.44 210.25 174.15 -5.3% Iowa 192.97 195.62 207.36 201.22 185.15 -1.0% Kansas 181.79 166.32 182.12 157.63 148.72 -4.9% Kentucky 266.65 284.99 154.86 179.61 162.98 -11.6% Louisiana 400.74 400.42 376.17 382.07 397.86 -0.2% Maine 219.76 216.57 213.80 196.51 205.61 -1.7% Maryland 426.83 414.04 408.00 378.72 339.55 -5.6% Massachusetts 133.81 19.59 18.94 14.97 16.61 -40.6% Michigan 162.08 172.33 186.72 168.70 174.15 1.8% Minnesota 151.16 143.42 140.08 135.76 139.04 -2.1% Mississippi 369.29 319.00 279.08 286.45 325.03 -3.1% Missouri 339.74 349.89 340.23 312.69 307.44 -2.5% Montana 127.24 115.18 124.21 128.53 144.95 3.3% Nebraska 426.03 395.02 394.12 401.38 397.41 -1.7% Nevada 274.17 333.10 340.71 326.81 262.09 -1.1% New Hampshire 255.36 256.54 245.88 257.63 222.15 -3.4% New Jersey 246.11 258.68 251.57 250.94 274.01 2.7% New Mexico 163.08 136.54 159.14 136.34 153.34 -1.5% New York 510.86 537.17 560.10 715.60 563.30 2.5% North Carolina 267.83 250.96 224.32 262.40 235.14 -3.2% North Dakota 186.91 173.46 175.14 199.73 247.56 7.3% Ohio 181.75 177.73 164.98 145.69 149.09 -4.8% Oklahoma 312.82 312.28 278.33 223.50 229.84 -7.4% Oregon 232.95 237.63 260.01 275.50 252.12 2.0% Pennsylvania 173.65 163.78 166.51 162.00 161.15 -1.9% Rhode Island 192.71 231.48 215.85 196.14 199.28 0.8% South Carolina 223.02 330.52 363.19 326.66 337.19 10.9% South Dakota 231.54 274.75 244.17 277.16 310.67 7.6% Tennessee 281.55 283.47 285.26 280.49 308.03 2.3% Texas 283.08 302.64 296.39 269.46 272.72 -0.9% Utah 154.73 159.41 149.54 155.93 181.56 4.1% Vermont 129.57 132.85 117.62 115.89 137.22 1.4% Virginia 230.46 223.72 234.08 243.66 255.49 2.6% Washington 230.09 200.32 172.70 187.63 93.94 -20.1% West Virginia 211.19 221.02 188.61 193.12 220.98 1.1% Wisconsin 267.75 275.24 288.76 270.42 287.72 1.8% Wyoming n/a n/a 375.78 375.25 381.32 0.7%
n/a: Not Available Source: Federal Bureau of Investigation, Uniform Crime Reporting Program (*Data obtained from State Criminal Justice Agencies)
Marijuana in the States 2012
Page 40
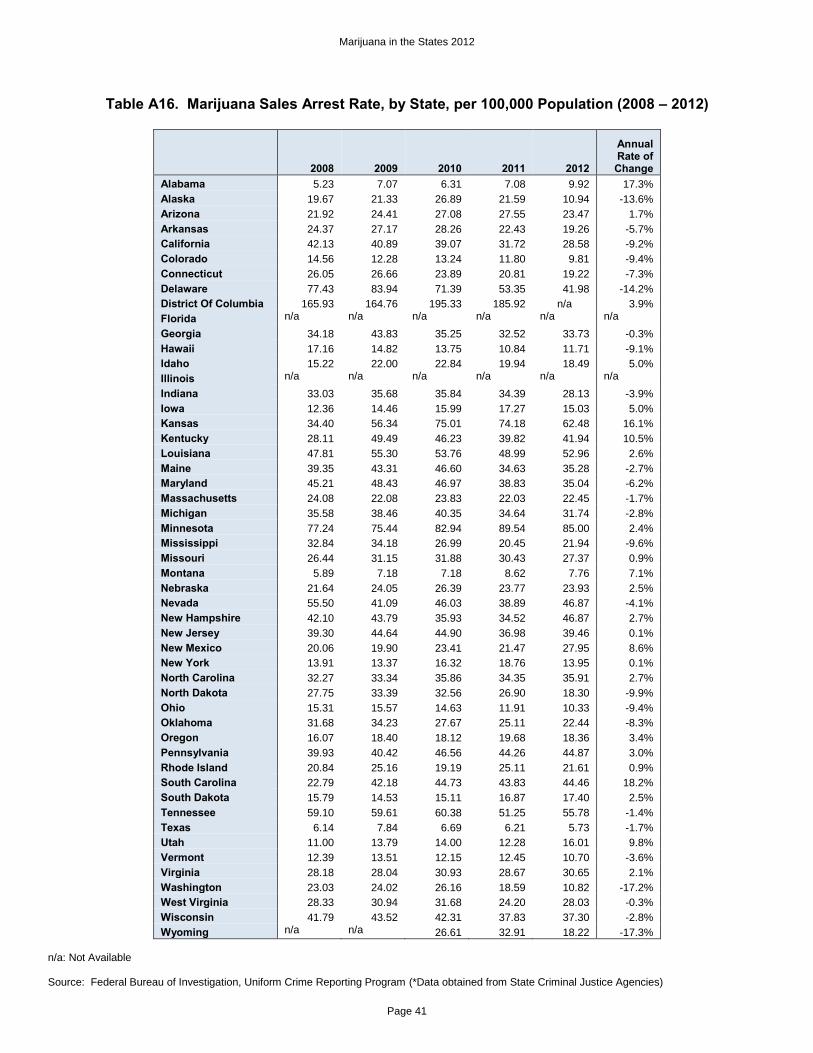
Table A16. Marijuana Sales Arrest Rate, by State, per 100,000 Population (2008 – 2012)
2008 2009 2010 2011 2012
Annual Rate of Change
Alabama 5.23 7.07 6.31 7.08 9.92 17.3% Alaska 19.67 21.33 26.89 21.59 10.94 -13.6% Arizona 21.92 24.41 27.08 27.55 23.47 1.7% Arkansas 24.37 27.17 28.26 22.43 19.26 -5.7% California 42.13 40.89 39.07 31.72 28.58 -9.2% Colorado 14.56 12.28 13.24 11.80 9.81 -9.4% Connecticut 26.05 26.66 23.89 20.81 19.22 -7.3% Delaware 77.43 83.94 71.39 53.35 41.98 -14.2% District Of Columbia 165.93 164.76 195.33 185.92 n/a 3.9% Florida n/a n/a n/a n/a n/a n/a Georgia 34.18 43.83 35.25 32.52 33.73 -0.3% Hawaii 17.16 14.82 13.75 10.84 11.71 -9.1% Idaho 15.22 22.00 22.84 19.94 18.49 5.0% Illinois n/a n/a n/a n/a n/a n/a Indiana 33.03 35.68 35.84 34.39 28.13 -3.9% Iowa 12.36 14.46 15.99 17.27 15.03 5.0% Kansas 34.40 56.34 75.01 74.18 62.48 16.1% Kentucky 28.11 49.49 46.23 39.82 41.94 10.5% Louisiana 47.81 55.30 53.76 48.99 52.96 2.6% Maine 39.35 43.31 46.60 34.63 35.28 -2.7% Maryland 45.21 48.43 46.97 38.83 35.04 -6.2% Massachusetts 24.08 22.08 23.83 22.03 22.45 -1.7% Michigan 35.58 38.46 40.35 34.64 31.74 -2.8% Minnesota 77.24 75.44 82.94 89.54 85.00 2.4% Mississippi 32.84 34.18 26.99 20.45 21.94 -9.6% Missouri 26.44 31.15 31.88 30.43 27.37 0.9% Montana 5.89 7.18 7.18 8.62 7.76 7.1% Nebraska 21.64 24.05 26.39 23.77 23.93 2.5% Nevada 55.50 41.09 46.03 38.89 46.87 -4.1% New Hampshire 42.10 43.79 35.93 34.52 46.87 2.7% New Jersey 39.30 44.64 44.90 36.98 39.46 0.1% New Mexico 20.06 19.90 23.41 21.47 27.95 8.6% New York 13.91 13.37 16.32 18.76 13.95 0.1% North Carolina 32.27 33.34 35.86 34.35 35.91 2.7% North Dakota 27.75 33.39 32.56 26.90 18.30 -9.9% Ohio 15.31 15.57 14.63 11.91 10.33 -9.4% Oklahoma 31.68 34.23 27.67 25.11 22.44 -8.3% Oregon 16.07 18.40 18.12 19.68 18.36 3.4% Pennsylvania 39.93 40.42 46.56 44.26 44.87 3.0% Rhode Island 20.84 25.16 19.19 25.11 21.61 0.9% South Carolina 22.79 42.18 44.73 43.83 44.46 18.2% South Dakota 15.79 14.53 15.11 16.87 17.40 2.5% Tennessee 59.10 59.61 60.38 51.25 55.78 -1.4% Texas 6.14 7.84 6.69 6.21 5.73 -1.7% Utah 11.00 13.79 14.00 12.28 16.01 9.8% Vermont 12.39 13.51 12.15 12.45 10.70 -3.6% Virginia 28.18 28.04 30.93 28.67 30.65 2.1% Washington 23.03 24.02 26.16 18.59 10.82 -17.2% West Virginia 28.33 30.94 31.68 24.20 28.03 -0.3% Wisconsin 41.79 43.52 42.31 37.83 37.30 -2.8% Wyoming n/a n/a 26.61 32.91 18.22 -17.3%
n/a: Not Available Source: Federal Bureau of Investigation, Uniform Crime Reporting Program (*Data obtained from State Criminal Justice Agencies)
Marijuana in the States 2012
Page 41
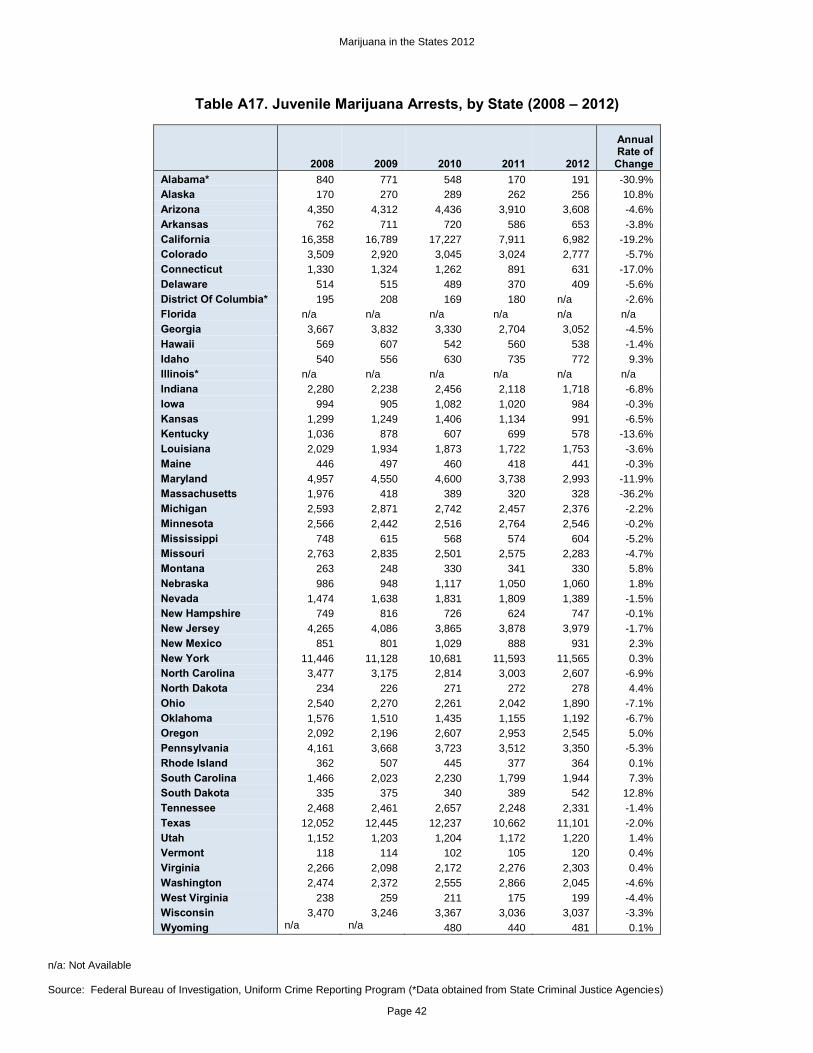
Table A17. Juvenile Marijuana Arrests, by State (2008 – 2012)
2008 2009 2010 2011 2012
Annual Rate of Change
Alabama* 840 771 548 170 191 -30.9% Alaska 170 270 289 262 256 10.8% Arizona 4,350 4,312 4,436 3,910 3,608 -4.6% Arkansas 762 711 720 586 653 -3.8% California 16,358 16,789 17,227 7,911 6,982 -19.2% Colorado 3,509 2,920 3,045 3,024 2,777 -5.7% Connecticut 1,330 1,324 1,262 891 631 -17.0% Delaware 514 515 489 370 409 -5.6% District Of Columbia* 195 208 169 180 n/a -2.6% Florida n/a n/a n/a n/a n/a n/a Georgia 3,667 3,832 3,330 2,704 3,052 -4.5% Hawaii 569 607 542 560 538 -1.4% Idaho 540 556 630 735 772 9.3% Illinois* n/a n/a n/a n/a n/a n/a Indiana 2,280 2,238 2,456 2,118 1,718 -6.8% Iowa 994 905 1,082 1,020 984 -0.3% Kansas 1,299 1,249 1,406 1,134 991 -6.5% Kentucky 1,036 878 607 699 578 -13.6% Louisiana 2,029 1,934 1,873 1,722 1,753 -3.6% Maine 446 497 460 418 441 -0.3% Maryland 4,957 4,550 4,600 3,738 2,993 -11.9% Massachusetts 1,976 418 389 320 328 -36.2% Michigan 2,593 2,871 2,742 2,457 2,376 -2.2% Minnesota 2,566 2,442 2,516 2,764 2,546 -0.2% Mississippi 748 615 568 574 604 -5.2% Missouri 2,763 2,835 2,501 2,575 2,283 -4.7% Montana 263 248 330 341 330 5.8% Nebraska 986 948 1,117 1,050 1,060 1.8% Nevada 1,474 1,638 1,831 1,809 1,389 -1.5% New Hampshire 749 816 726 624 747 -0.1% New Jersey 4,265 4,086 3,865 3,878 3,979 -1.7% New Mexico 851 801 1,029 888 931 2.3% New York 11,446 11,128 10,681 11,593 11,565 0.3% North Carolina 3,477 3,175 2,814 3,003 2,607 -6.9% North Dakota 234 226 271 272 278 4.4% Ohio 2,540 2,270 2,261 2,042 1,890 -7.1% Oklahoma 1,576 1,510 1,435 1,155 1,192 -6.7% Oregon 2,092 2,196 2,607 2,953 2,545 5.0% Pennsylvania 4,161 3,668 3,723 3,512 3,350 -5.3% Rhode Island 362 507 445 377 364 0.1% South Carolina 1,466 2,023 2,230 1,799 1,944 7.3% South Dakota 335 375 340 389 542 12.8% Tennessee 2,468 2,461 2,657 2,248 2,331 -1.4% Texas 12,052 12,445 12,237 10,662 11,101 -2.0% Utah 1,152 1,203 1,204 1,172 1,220 1.4% Vermont 118 114 102 105 120 0.4% Virginia 2,266 2,098 2,172 2,276 2,303 0.4% Washington 2,474 2,372 2,555 2,866 2,045 -4.6% West Virginia 238 259 211 175 199 -4.4% Wisconsin 3,470 3,246 3,367 3,036 3,037 -3.3% Wyoming n/a n/a 480 440 481 0.1%
n/a: Not Available Source: Federal Bureau of Investigation, Uniform Crime Reporting Program (*Data obtained from State Criminal Justice Agencies)
Marijuana in the States 2012
Page 42
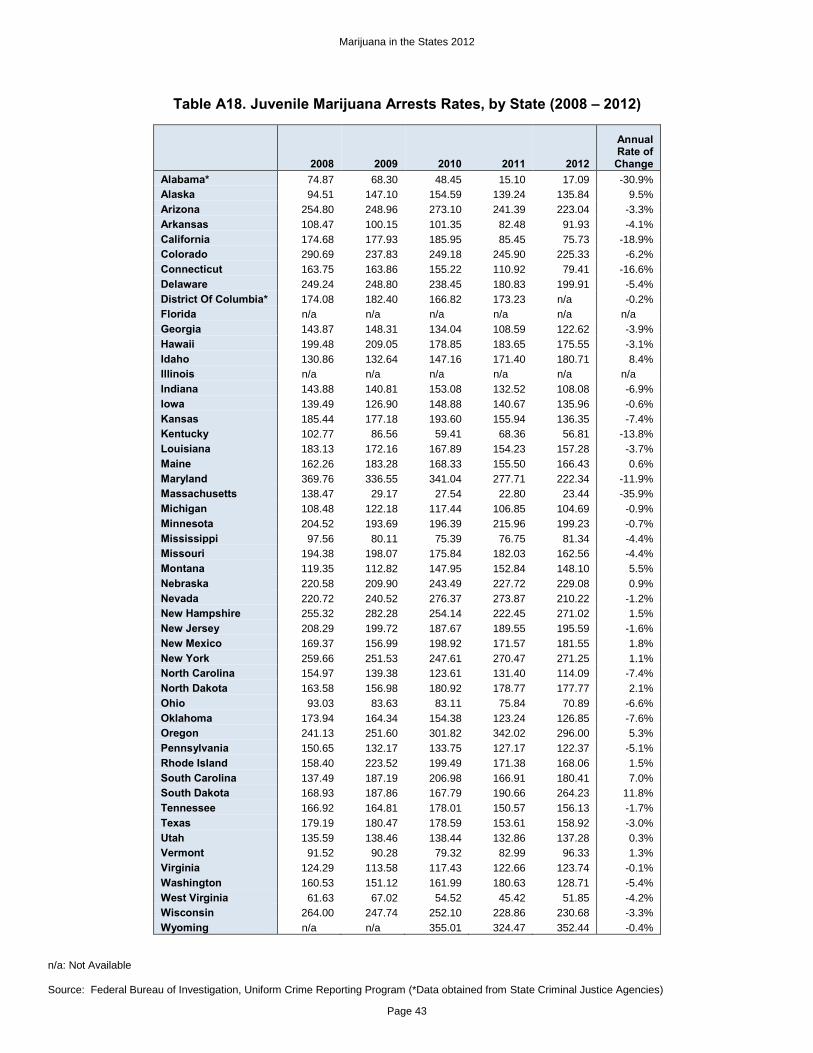
Table A18. Juvenile Marijuana Arrests Rates, by State (2008 – 2012)
2008 2009 2010 2011 2012
Annual Rate of Change
Alabama* 74.87 68.30 48.45 15.10 17.09 -30.9% Alaska 94.51 147.10 154.59 139.24 135.84 9.5% Arizona 254.80 248.96 273.10 241.39 223.04 -3.3% Arkansas 108.47 100.15 101.35 82.48 91.93 -4.1% California 174.68 177.93 185.95 85.45 75.73 -18.9% Colorado 290.69 237.83 249.18 245.90 225.33 -6.2% Connecticut 163.75 163.86 155.22 110.92 79.41 -16.6% Delaware 249.24 248.80 238.45 180.83 199.91 -5.4% District Of Columbia* 174.08 182.40 166.82 173.23 n/a -0.2% Florida n/a n/a n/a n/a n/a n/a Georgia 143.87 148.31 134.04 108.59 122.62 -3.9% Hawaii 199.48 209.05 178.85 183.65 175.55 -3.1% Idaho 130.86 132.64 147.16 171.40 180.71 8.4% Illinois n/a n/a n/a n/a n/a n/a Indiana 143.88 140.81 153.08 132.52 108.08 -6.9% Iowa 139.49 126.90 148.88 140.67 135.96 -0.6% Kansas 185.44 177.18 193.60 155.94 136.35 -7.4% Kentucky 102.77 86.56 59.41 68.36 56.81 -13.8% Louisiana 183.13 172.16 167.89 154.23 157.28 -3.7% Maine 162.26 183.28 168.33 155.50 166.43 0.6% Maryland 369.76 336.55 341.04 277.71 222.34 -11.9% Massachusetts 138.47 29.17 27.54 22.80 23.44 -35.9% Michigan 108.48 122.18 117.44 106.85 104.69 -0.9% Minnesota 204.52 193.69 196.39 215.96 199.23 -0.7% Mississippi 97.56 80.11 75.39 76.75 81.34 -4.4% Missouri 194.38 198.07 175.84 182.03 162.56 -4.4% Montana 119.35 112.82 147.95 152.84 148.10 5.5% Nebraska 220.58 209.90 243.49 227.72 229.08 0.9% Nevada 220.72 240.52 276.37 273.87 210.22 -1.2% New Hampshire 255.32 282.28 254.14 222.45 271.02 1.5% New Jersey 208.29 199.72 187.67 189.55 195.59 -1.6% New Mexico 169.37 156.99 198.92 171.57 181.55 1.8% New York 259.66 251.53 247.61 270.47 271.25 1.1% North Carolina 154.97 139.38 123.61 131.40 114.09 -7.4% North Dakota 163.58 156.98 180.92 178.77 177.77 2.1% Ohio 93.03 83.63 83.11 75.84 70.89 -6.6% Oklahoma 173.94 164.34 154.38 123.24 126.85 -7.6% Oregon 241.13 251.60 301.82 342.02 296.00 5.3% Pennsylvania 150.65 132.17 133.75 127.17 122.37 -5.1% Rhode Island 158.40 223.52 199.49 171.38 168.06 1.5% South Carolina 137.49 187.19 206.98 166.91 180.41 7.0% South Dakota 168.93 187.86 167.79 190.66 264.23 11.8% Tennessee 166.92 164.81 178.01 150.57 156.13 -1.7% Texas 179.19 180.47 178.59 153.61 158.92 -3.0% Utah 135.59 138.46 138.44 132.86 137.28 0.3% Vermont 91.52 90.28 79.32 82.99 96.33 1.3% Virginia 124.29 113.58 117.43 122.66 123.74 -0.1% Washington 160.53 151.12 161.99 180.63 128.71 -5.4% West Virginia 61.63 67.02 54.52 45.42 51.85 -4.2% Wisconsin 264.00 247.74 252.10 228.86 230.68 -3.3% Wyoming n/a n/a 355.01 324.47 352.44 -0.4%
n/a: Not Available Source: Federal Bureau of Investigation, Uniform Crime Reporting Program (*Data obtained from State Criminal Justice Agencies)
Marijuana in the States 2012
Page 43
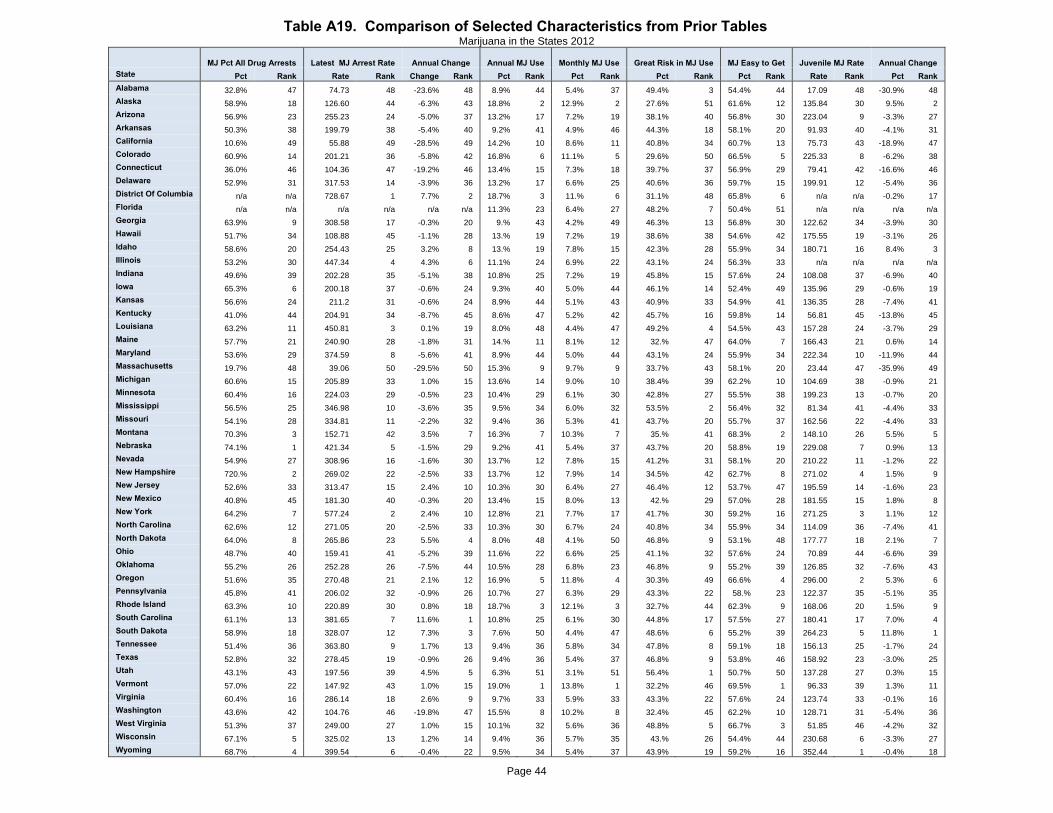
MJ Pct All Drug Arrests Latest MJ Arrest Rate Annual Change Annual MJ Use Monthly MJ Use
Great Risk in MJ Use MJ Easy to Get Juvenile MJ Rate Annual Change State Pct Rank Rate Rank Change Rank Pct Rank Pct Rank Pct Rank Pct Rank Rate Rank Pct Rank Alabama 32.8% 47 74.73 48 -23.6% 48 8.9% 44 5.4% 37 49.4% 3 54.4% 44 17.09 48 -30.9% 48 Alaska 58.9% 18 126.60 44 -6.3% 43 18.8% 2 12.9% 2 27.6% 51 61.6% 12 135.84 30 9.5% 2 Arizona 56.9% 23 255.23 24 -5.0% 37 13.2% 17 7.2% 19 38.1% 40 56.8% 30 223.04 9 -3.3% 27 Arkansas 50.3% 38 199.79 38 -5.4% 40 9.2% 41 4.9% 46 44.3% 18 58.1% 20 91.93 40 -4.1% 31 California 10.6% 49 55.88 49 -28.5% 49 14.2% 10 8.6% 11 40.8% 34 60.7% 13 75.73 43 -18.9% 47 Colorado 60.9% 14 201.21 36 -5.8% 42 16.8% 6 11.1% 5 29.6% 50 66.5% 5 225.33 8 -6.2% 38 Connecticut 36.0% 46 104.36 47 -19.2% 46 13.4% 15 7.3% 18 39.7% 37 56.9% 29 79.41 42 -16.6% 46 Delaware 52.9% 31 317.53 14 -3.9% 36 13.2% 17 6.6% 25 40.6% 36 59.7% 15 199.91 12 -5.4% 36 District Of Columbia n/a n/a 728.67 1 7.7% 2 18.7% 3 11.% 6 31.1% 48 65.8% 6 n/a n/a -0.2% 17 Florida n/a n/a n/a n/a n/a n/a 11.3% 23 6.4% 27 48.2% 7 50.4% 51 n/a n/a n/a n/a Georgia 63.9% 9 308.58 17 -0.3% 20 9.% 43 4.2% 49 46.3% 13 56.8% 30 122.62 34 -3.9% 30 Hawaii 51.7% 34 108.88 45 -1.1% 28 13.% 19 7.2% 19 38.6% 38 54.6% 42 175.55 19 -3.1% 26 Idaho 58.6% 20 254.43 25 3.2% 8 13.% 19 7.8% 15 42.3% 28 55.9% 34 180.71 16 8.4% 3 Illinois 53.2% 30 447.34 4 4.3% 6 11.1% 24 6.9% 22 43.1% 24 56.3% 33 n/a n/a n/a n/a Indiana 49.6% 39 202.28 35 -5.1% 38 10.8% 25 7.2% 19 45.8% 15 57.6% 24 108.08 37 -6.9% 40 Iowa 65.3% 6 200.18 37 -0.6% 24 9.3% 40 5.0% 44 46.1% 14 52.4% 49 135.96 29 -0.6% 19 Kansas 56.6% 24 211.2 31 -0.6% 24 8.9% 44 5.1% 43 40.9% 33 54.9% 41 136.35 28 -7.4% 41 Kentucky 41.0% 44 204.91 34 -8.7% 45 8.6% 47 5.2% 42 45.7% 16 59.8% 14 56.81 45 -13.8% 45 Louisiana 63.2% 11 450.81 3 0.1% 19 8.0% 48 4.4% 47 49.2% 4 54.5% 43 157.28 24 -3.7% 29 Maine 57.7% 21 240.90 28 -1.8% 31 14.% 11 8.1% 12 32.% 47 64.0% 7 166.43 21 0.6% 14 Maryland 53.6% 29 374.59 8 -5.6% 41 8.9% 44 5.0% 44 43.1% 24 55.9% 34 222.34 10 -11.9% 44 Massachusetts 19.7% 48 39.06 50 -29.5% 50 15.3% 9 9.7% 9 33.7% 43 58.1% 20 23.44 47 -35.9% 49 Michigan 60.6% 15 205.89 33 1.0% 15 13.6% 14 9.0% 10 38.4% 39 62.2% 10 104.69 38 -0.9% 21 Minnesota 60.4% 16 224.03 29 -0.5% 23 10.4% 29 6.1% 30 42.8% 27 55.5% 38 199.23 13 -0.7% 20 Mississippi 56.5% 25 346.98 10 -3.6% 35 9.5% 34 6.0% 32 53.5% 2 56.4% 32 81.34 41 -4.4% 33 Missouri 54.1% 28 334.81 11 -2.2% 32 9.4% 36 5.3% 41 43.7% 20 55.7% 37 162.56 22 -4.4% 33 Montana 70.3% 3 152.71 42 3.5% 7 16.3% 7 10.3% 7 35.% 41 68.3% 2 148.10 26 5.5% 5 Nebraska 74.1% 1 421.34 5 -1.5% 29 9.2% 41 5.4% 37 43.7% 20 58.8% 19 229.08 7 0.9% 13 Nevada 54.9% 27 308.96 16 -1.6% 30 13.7% 12 7.8% 15 41.2% 31 58.1% 20 210.22 11 -1.2% 22 New Hampshire 720.% 2 269.02 22 -2.5% 33 13.7% 12 7.9% 14 34.5% 42 62.7% 8 271.02 4 1.5% 9 New Jersey 52.6% 33 313.47 15 2.4% 10 10.3% 30 6.4% 27 46.4% 12 53.7% 47 195.59 14 -1.6% 23 New Mexico 40.8% 45 181.30 40 -0.3% 20 13.4% 15 8.0% 13 42.% 29 57.0% 28 181.55 15 1.8% 8 New York 64.2% 7 577.24 2 2.4% 10 12.8% 21 7.7% 17 41.7% 30 59.2% 16 271.25 3 1.1% 12 North Carolina 62.6% 12 271.05 20 -2.5% 33 10.3% 30 6.7% 24 40.8% 34 55.9% 34 114.09 36 -7.4% 41 North Dakota 64.0% 8 265.86 23 5.5% 4 8.0% 48 4.1% 50 46.8% 9 53.1% 48 177.77 18 2.1% 7 Ohio 48.7% 40 159.41 41 -5.2% 39 11.6% 22 6.6% 25 41.1% 32 57.6% 24 70.89 44 -6.6% 39 Oklahoma 55.2% 26 252.28 26 -7.5% 44 10.5% 28 6.8% 23 46.8% 9 55.2% 39 126.85 32 -7.6% 43 Oregon 51.6% 35 270.48 21 2.1% 12 16.9% 5 11.8% 4 30.3% 49 66.6% 4 296.00 2 5.3% 6 Pennsylvania 45.8% 41 206.02 32 -0.9% 26 10.7% 27 6.3% 29 43.3% 22 58.% 23 122.37 35 -5.1% 35 Rhode Island 63.3% 10 220.89 30 0.8% 18 18.7% 3 12.1% 3 32.7% 44 62.3% 9 168.06 20 1.5% 9 South Carolina 61.1% 13 381.65 7 11.6% 1 10.8% 25 6.1% 30 44.8% 17 57.5% 27 180.41 17 7.0% 4 South Dakota 58.9% 18 328.07 12 7.3% 3 7.6% 50 4.4% 47 48.6% 6 55.2% 39 264.23 5 11.8% 1 Tennessee 51.4% 36 363.80 9 1.7% 13 9.4% 36 5.8% 34 47.8% 8 59.1% 18 156.13 25 -1.7% 24 Texas 52.8% 32 278.45 19 -0.9% 26 9.4% 36 5.4% 37 46.8% 9 53.8% 46 158.92 23 -3.0% 25 Utah 43.1% 43 197.56 39 4.5% 5 6.3% 51 3.1% 51 56.4% 1 50.7% 50 137.28 27 0.3% 15 Vermont 57.0% 22 147.92 43 1.0% 15 19.0% 1 13.8% 1 32.2% 46 69.5% 1 96.33 39 1.3% 11 Virginia 60.4% 16 286.14 18 2.6% 9 9.7% 33 5.9% 33 43.3% 22 57.6% 24 123.74 33 -0.1% 16 Washington 43.6% 42 104.76 46 -19.8% 47 15.5% 8 10.2% 8 32.4% 45 62.2% 10 128.71 31 -5.4% 36 West Virginia 51.3% 37 249.00 27 1.0% 15 10.1% 32 5.6% 36 48.8% 5 66.7% 3 51.85 46 -4.2% 32 Wisconsin 67.1% 5 325.02 13 1.2% 14 9.4% 36 5.7% 35 43.% 26 54.4% 44 230.68 6 -3.3% 27 Wyoming 68.7% 4 399.54 6 -0.4% 22 9.5% 34 5.4% 37 43.9% 19 59.2% 16 352.44 1 -0.4% 18
Table A19. Comparison of Selected Characteristics from Prior Tables Marijuana in the States 2012
Page 44