Embed Size (px)
Citation preview
R tutorial
http://people.musc.edu/~elg26/teaching/methods2.2010/R-intro.pdf
Installing R
http://cran.r-project.org/ Choose appropriate interface
• windows• Mac• Linux
Follow install instructions
R interface
batching file: File -> open script
run commands: Ctrl-R
Save session: sink([filename])….sink()
Quit session: q()
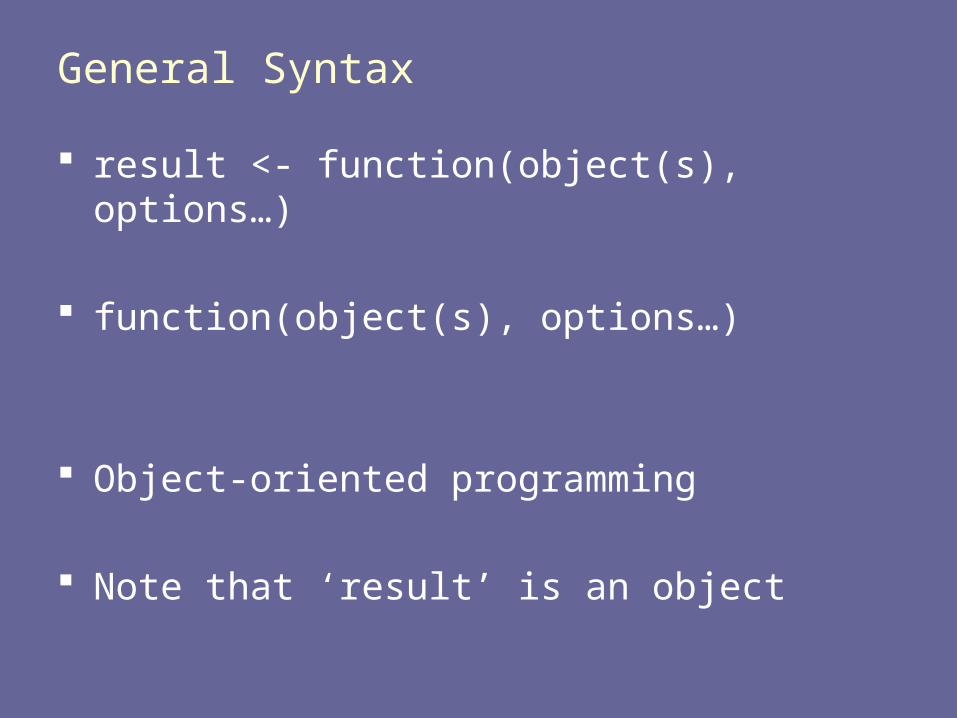
General Syntax
result <- function(object(s), options…)
function(object(s), options…)
Object-oriented programming
Note that ‘result’ is an object
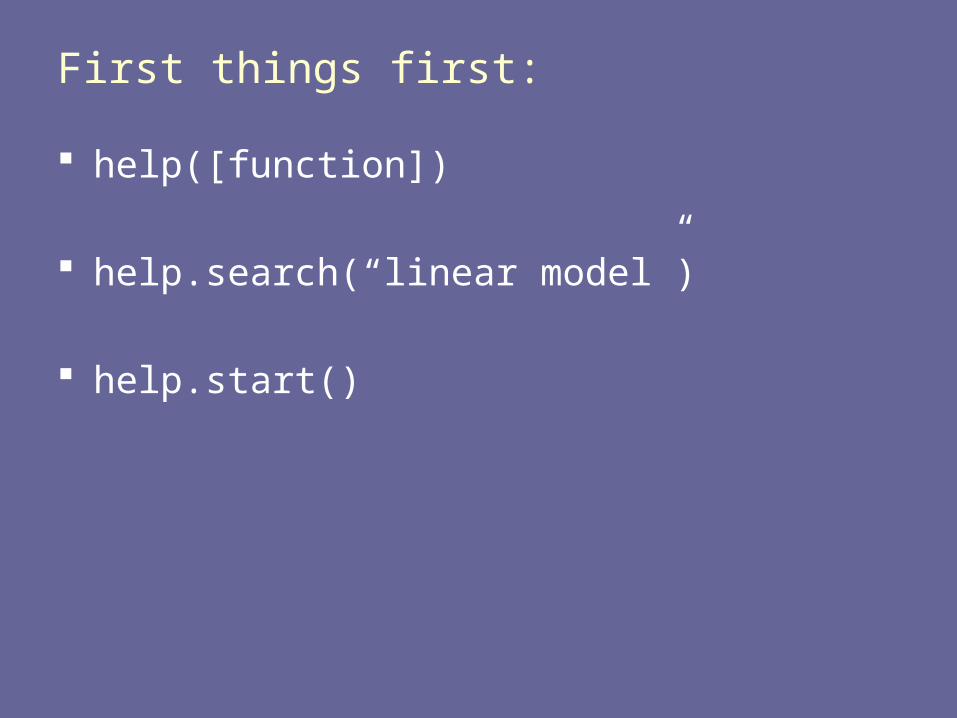
First things first:
help([function])
help.search(“linear model”)
help.start()
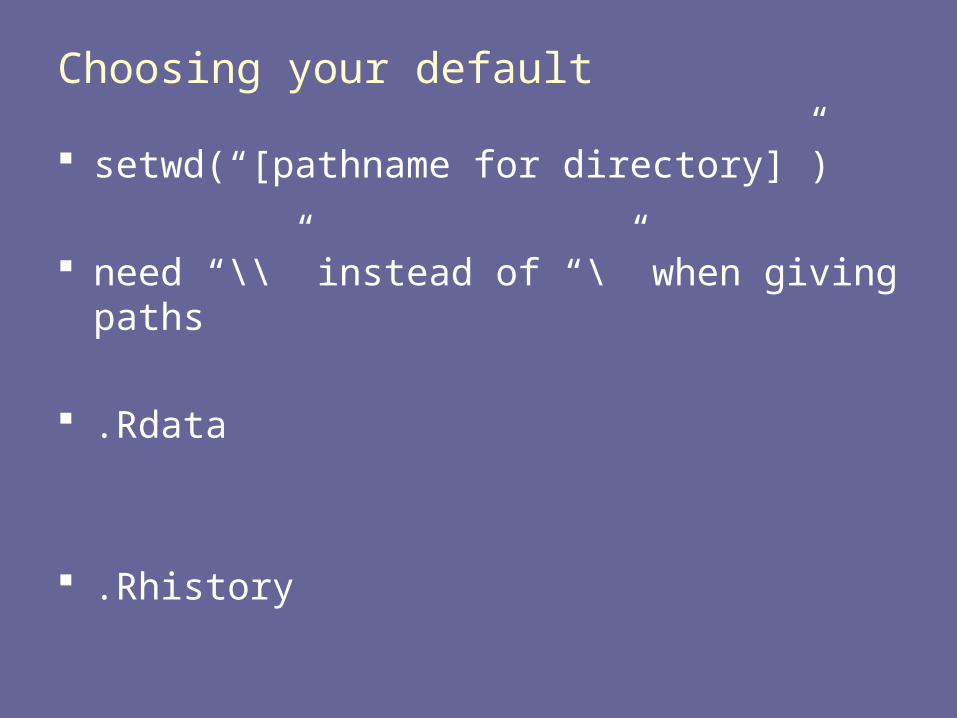
Choosing your default
setwd(“[pathname for directory]”)
need “\\” instead of “\” when giving paths
.Rdata
.Rhistory
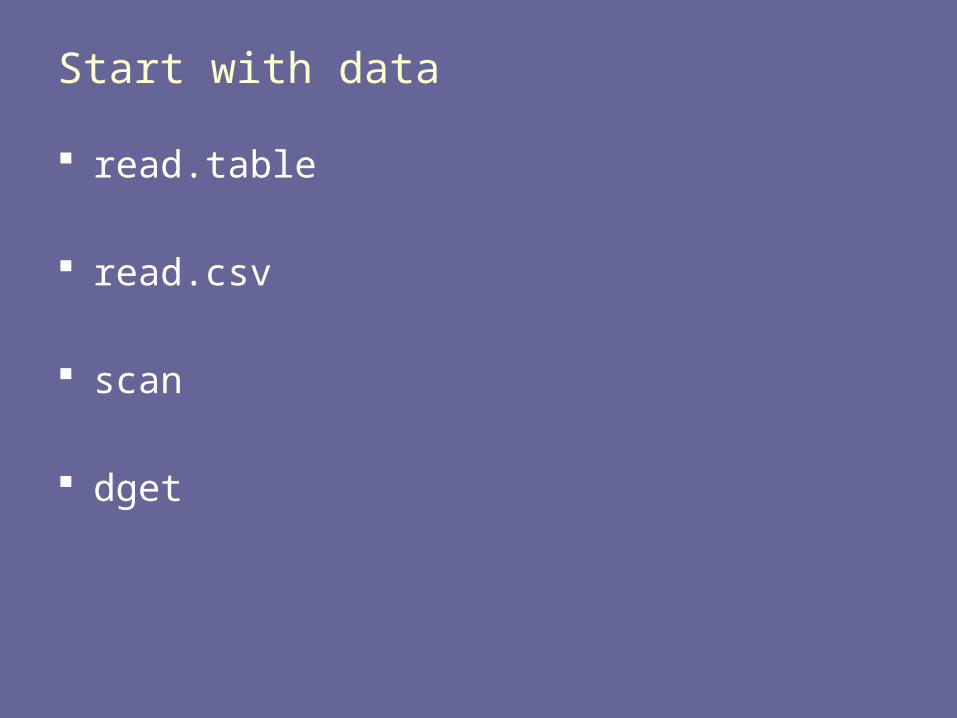
Start with data
read.table
read.csv
scan
dget
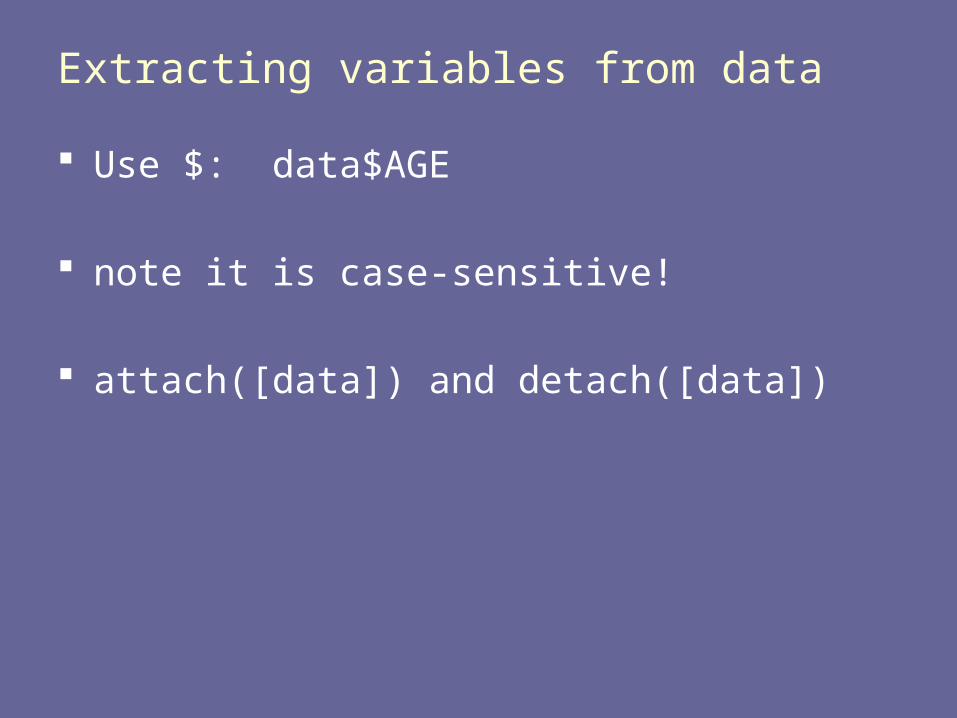
Extracting variables from data
Use $: data$AGE
note it is case-sensitive!
attach([data]) and detach([data])
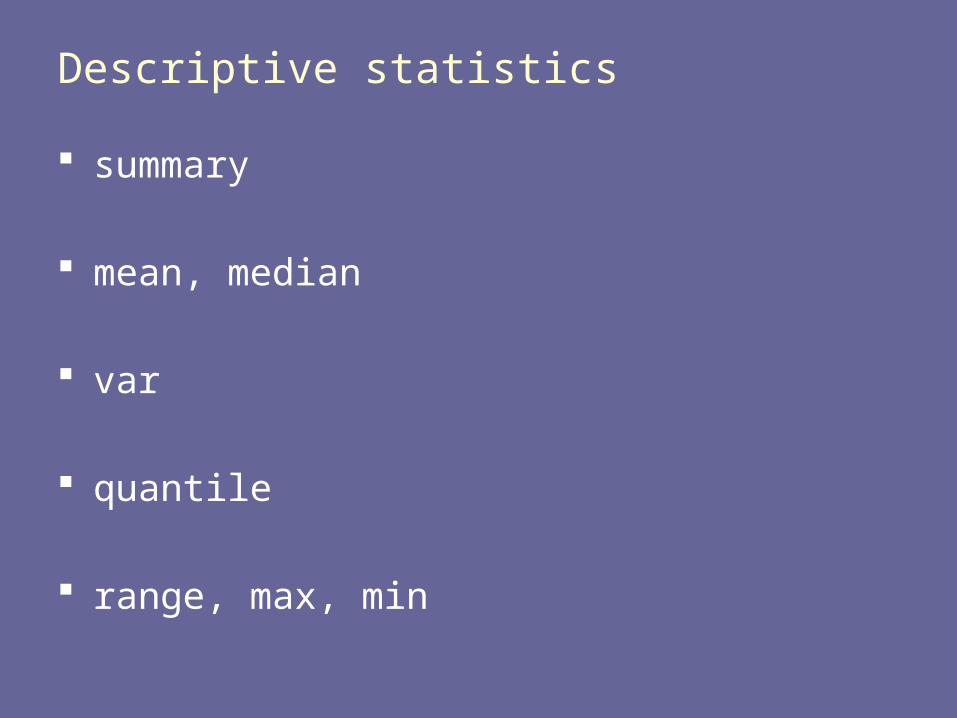
Descriptive statistics
summary
mean, median
var
quantile
range, max, min
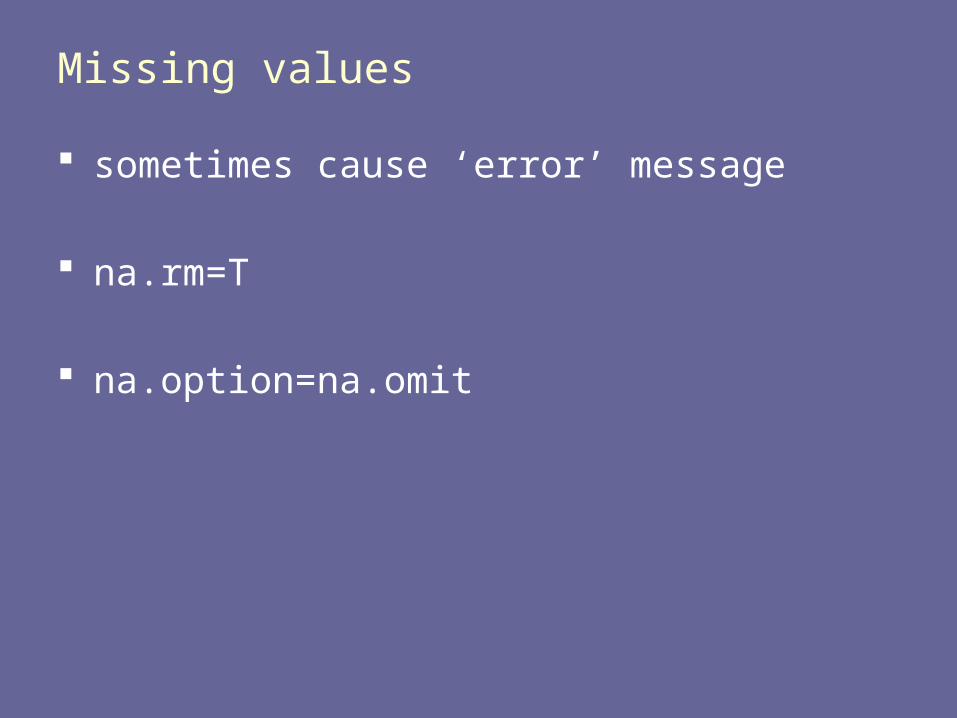
Missing values
sometimes cause ‘error’ message
na.rm=T
na.option=na.omit
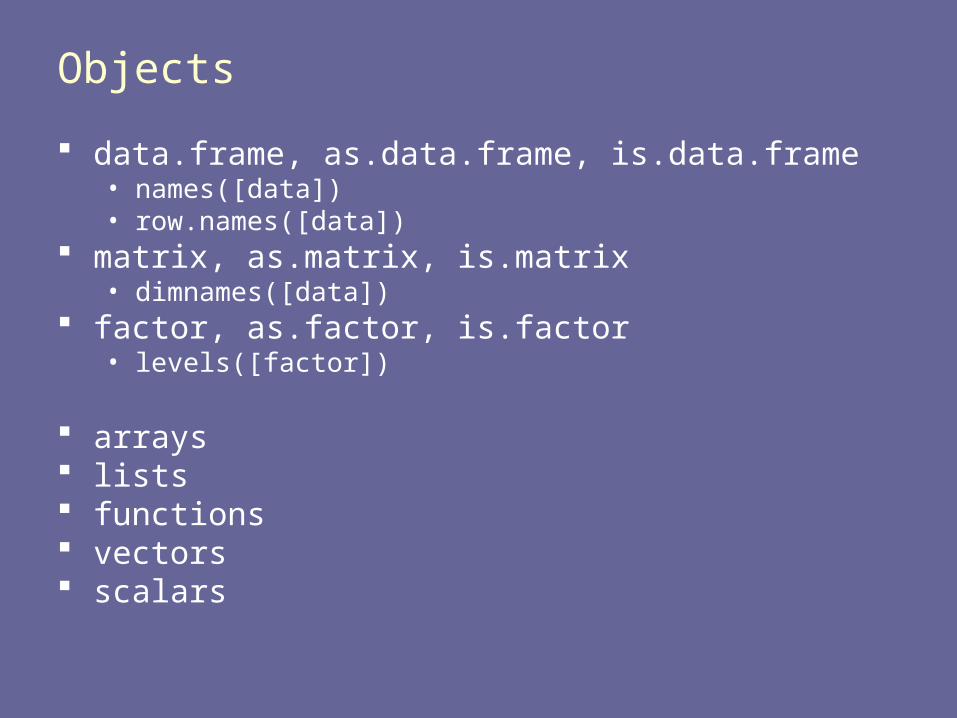
Objects
data.frame, as.data.frame, is.data.frame• names([data])• row.names([data])
matrix, as.matrix, is.matrix• dimnames([data])
factor, as.factor, is.factor• levels([factor])
arrays lists functions vectors scalars
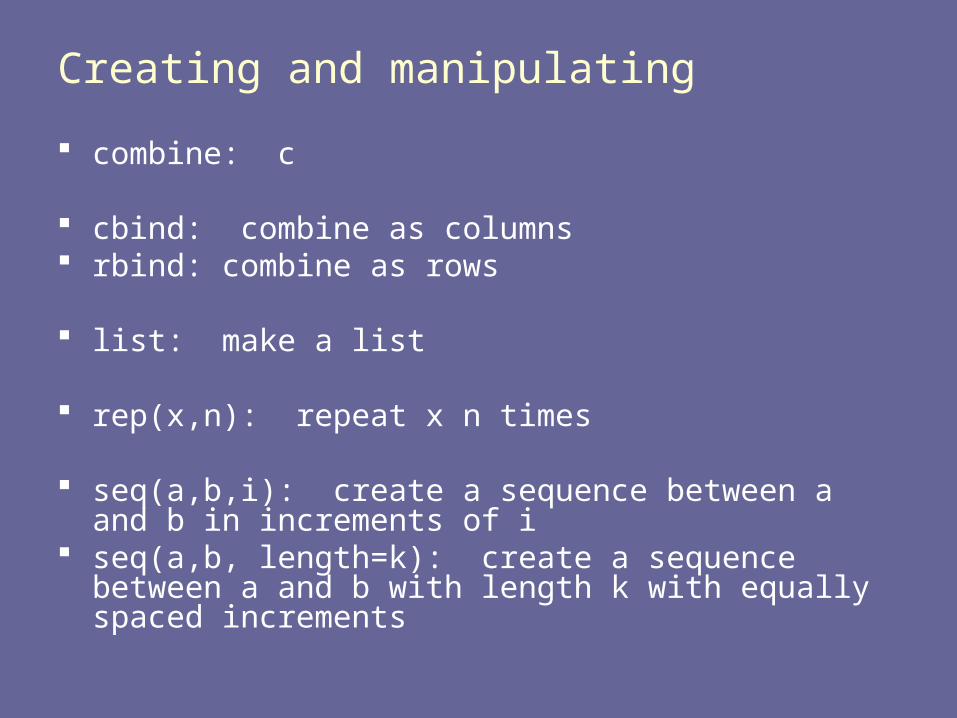
Creating and manipulating
combine: c
cbind: combine as columns rbind: combine as rows
list: make a list
rep(x,n): repeat x n times
seq(a,b,i): create a sequence between a and b in increments of i
seq(a,b, length=k): create a sequence between a and b with length k with equally spaced increments
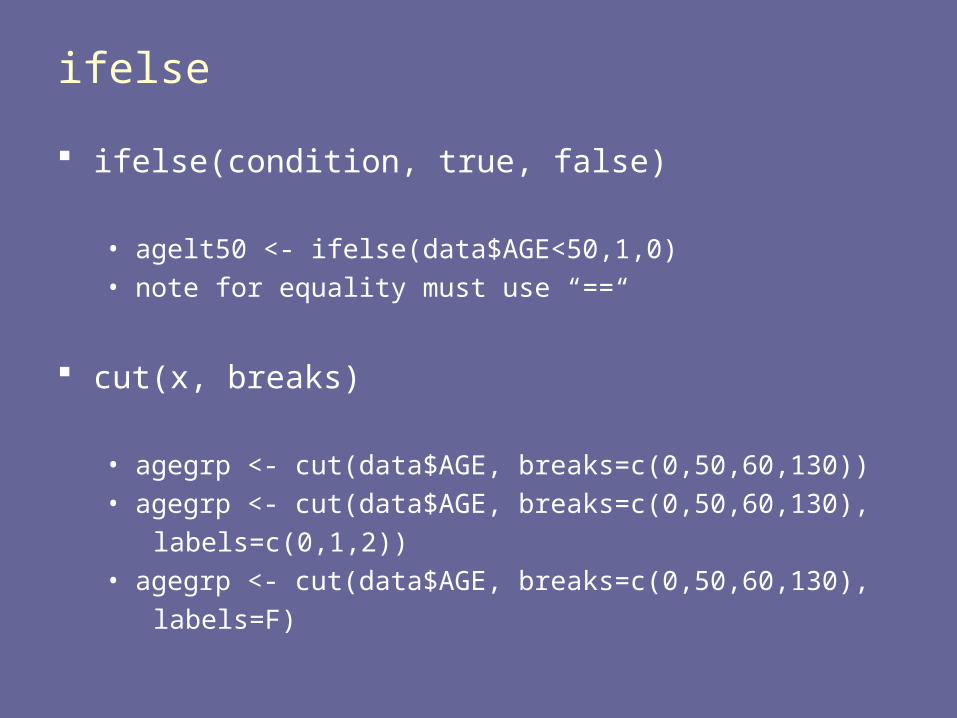
ifelse
ifelse(condition, true, false)
• agelt50 <- ifelse(data$AGE<50,1,0)• note for equality must use “==“
cut(x, breaks)
• agegrp <- cut(data$AGE, breaks=c(0,50,60,130))• agegrp <- cut(data$AGE, breaks=c(0,50,60,130),
labels=c(0,1,2))• agegrp <- cut(data$AGE, breaks=c(0,50,60,130),
labels=F)
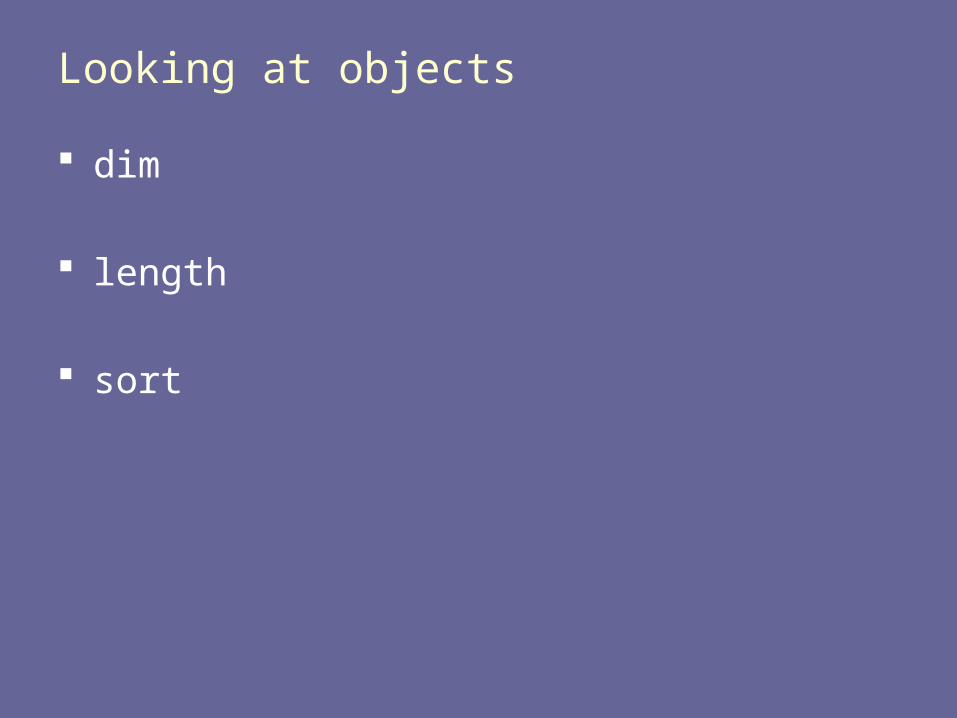
Looking at objects
dim
length
sort
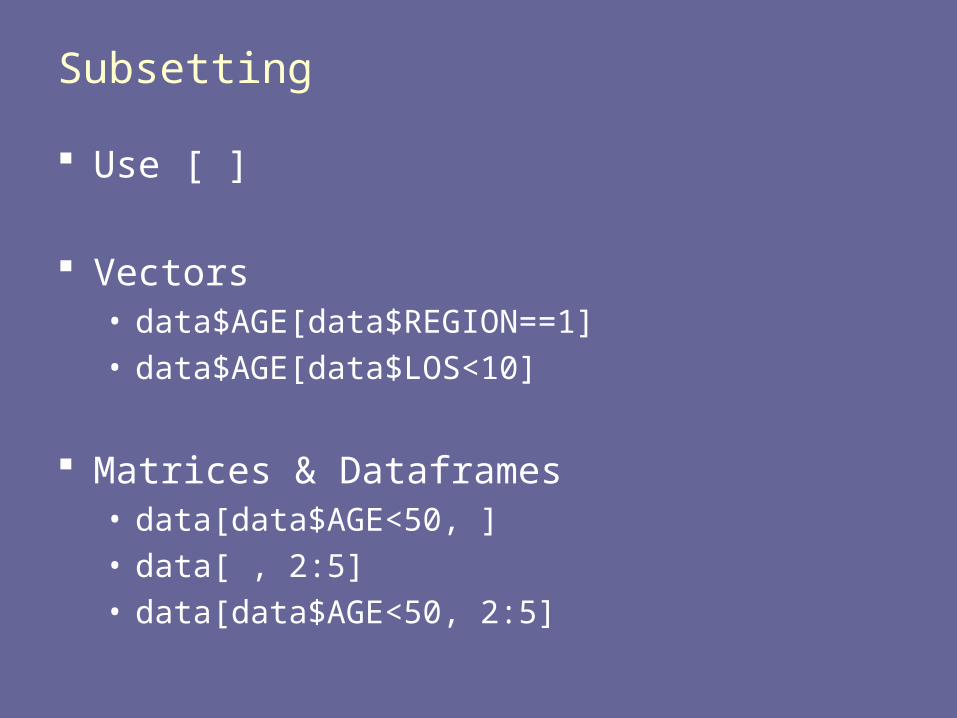
Subsetting
Use [ ]
Vectors• data$AGE[data$REGION==1]• data$AGE[data$LOS<10]
Matrices & Dataframes• data[data$AGE<50, ]• data[ , 2:5]• data[data$AGE<50, 2:5]
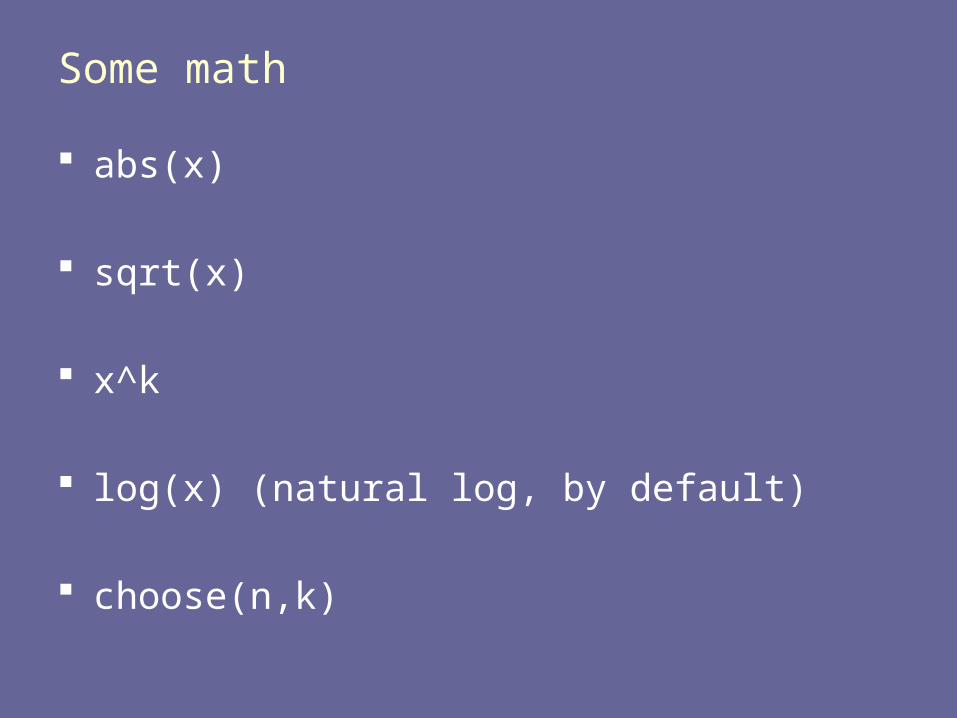
Some math
abs(x)
sqrt(x)
x^k
log(x) (natural log, by default)
choose(n,k)
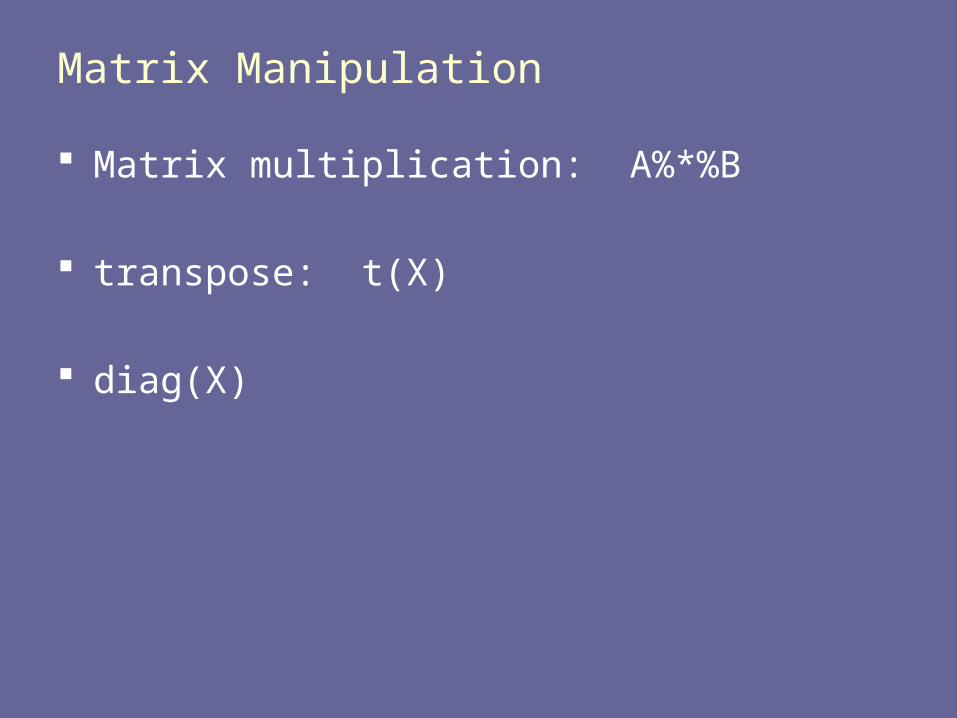
Matrix Manipulation
Matrix multiplication: A%*%B
transpose: t(X)
diag(X)
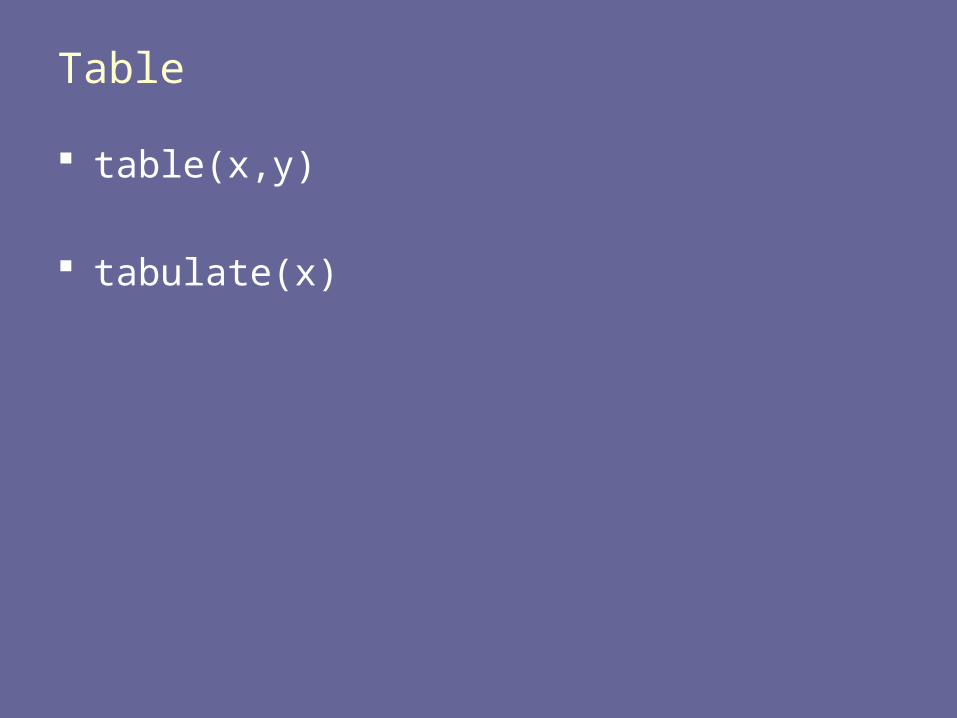
Table
table(x,y)
tabulate(x)
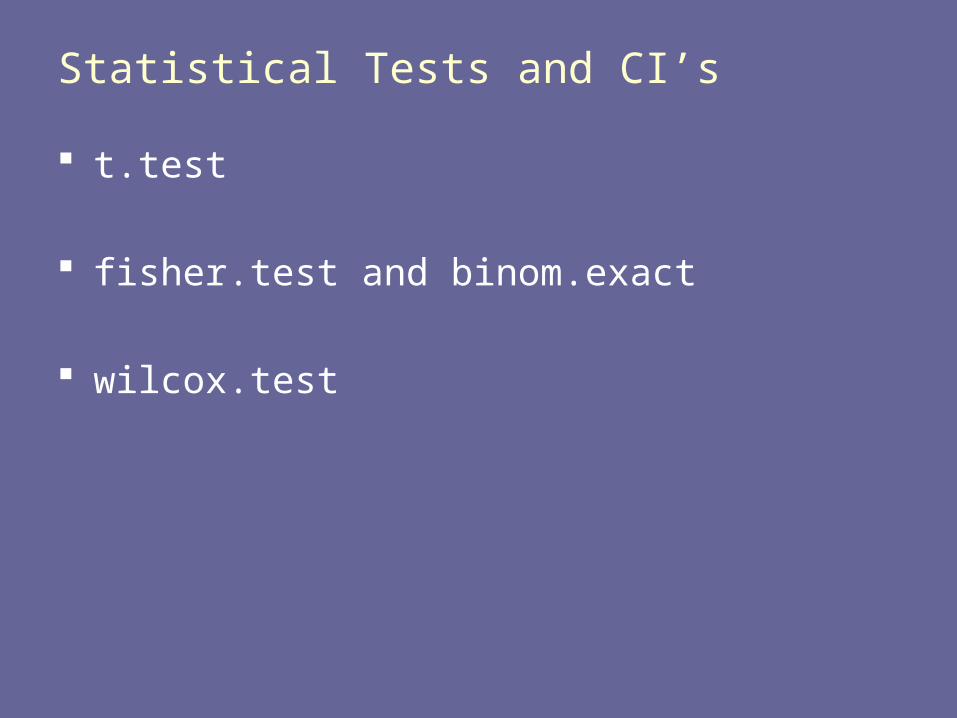
Statistical Tests and CI’s
t.test
fisher.test and binom.exact
wilcox.test
Plots
hist
boxplot
plot• pch, type, lwd• xlab, ylab• xlim, ylim• xaxt, yaxt
axis
Plot Layout
par(mfrow=c(2,1))
par(mfrow=c(1,1))
par(mfcol=c(2,2))
help(par)
Probability Distributions
Normal:• rnorm(N,m,s): generate random normal data• dnorm(x,m,s): density at x for normal with mean m,
std dev s• qnorm(p,m,s): quantile associated with cumulative
probability of p for normal with mean m, std dev s• pnorm(q,m,s): cumulative probability at quantile q for
normal with mean m, std dev s
Binomial• rbinom• etc.
Libraries
Additional packages that can be loaded
Example: epitools
library
library(help=[libname])
Keeping things tidy
ls() and objects()
rm()
rm(list=ls())
Future Topics
linear regression
sourcing R code
creating functions
organizing R files


![[Blaise Pascal] Provincial Letters - Moral Teachin(BookFi.org)](https://img.pdfslide.us/doc/110x75/55cf9ad5550346d033a3a2b7/blaise-pascal-provincial-letters-moral-teachinbookfiorg.jpg)