Embed Size (px)
Citation preview
The 2016 Continuity Insights and KPMG LLP Global Business Continuity Management (BCM) Program Benchmarking Study
The 2016Continuity Insights and KPMG LLP Global Business Continuity Management (BCM) Program Benchmarking Study
i
Statistics used in this report are based on anonymous survey responses from 349 executives in public and private compa-nies, government agencies and authorities, educational institutions and not-for-profit entities.
The online survey, conducted by Continuity Insights during November 2015 through February 2016, explores changes to the global risk landscape, regulatory requirements and supply chain interdependencies, and compares the programs of organi-zations with a steering committee in place against those without a steering committee in place, highlighting some dramatic differences.
This Report is based on and generated from the KPMG LLP sponsored Survey entitled: The 2016 Continuity Insights and KPMG LLP Global Business Continuity Management (BCM) Program Benchmarking Study.
Research MethodologyRespondents for the 2016 Continuity Insights and KPMG LLP Global Business Continuity Management (BCM) Program Benchmarking Study were obtained from the Continuity Insights subscriber base by way of its newsletter, website, email deployments and social media channels, as well as from other professional organizations that supported the study. The 25-minute online survey included 47 questions and was fielded from November 2015 through February 2016. Information was collected from 349 respondents, of which 305 respondents completed the entire survey.
The information contained herein is of a general nature and is not intended to address the circumstances of any particular individual or entity. Although Continuity Insights endeavor to provide accurate and timely information, there can be no guar-antee that such information is accurate as of the date it is received or that it will continue to be accurate in the future. No one should act on such information without appropriate professional advice after a thorough examination of the particular situa-tion. For more information on the study methodology, please contact Robert Nakao at [email protected].
About Continuity InsightsContinuity Insights is business continuity from management’s perspective. It speaks directly to the strategic view, embrac-ing the issues and concerns of senior-level managers. With its results-oriented approach, Continuity Insights is a discussion of the “why’s” of business continuity and offers a comprehensive review of the vast continuity landscape. Its audience represents a wide range of businesses and industries, government and other public sector entities, and serves an array of professional disciplines. It’s highly specialized portfolio includes Continuity Insights online/electronic media including its highly-trafficked website, e-Newsletters, webinars, and research project; and its annual Continuity Insights Management Conference and regional events.
About KPMGKPMG LLP, the audit, tax and advisory firm (HYPERLINK “http://www.kpmg.com/us” www.kpmg.com/us), is the U.S. member firm of KPMG International Cooperative (“KPMG International”). KPMG International’s member firms have 145,000 profes-sionals, including more than 8,000 partners, in 152 countries. The KPMG name, logo and “cutting through complexity” are registered trademarks of KPMG International.
KPMG Information Protection and Business Resilience services help clients effectively manage and control corporate infor-mation assets across a broad spectrum of evolving threats and scenarios. Companies today increasingly realize that secu-rity is not a one-time project, but instead a strategy that must be adaptive to changing threats, remain consistent with the organization’s business initiatives, and deliver benefits such as manageability, assurance, and efficiency. We help companies identify their most important information assets, and work with them to develop an effective approach combining technolo-gy and business processes. We work with clients to maximize the value that can be obtained from their data while protecting key business processes, information assets, and the company’s brand and reputation.
To learn more about KPMG’s Information Protection and Business Resilience, please contact:
About This Report
Greg Bell National Practice Leader,Information Protection and Business ResilienceKPMG LLPT: 404 222 7197E: [email protected]
Anthony Buffomante Principal, Advisory Information Protection and Business ResilienceKPMG LLPT: 312 665 1748E: [email protected]
Robbie Atabaigi Manager, Advisory Information Protection and Business ResilienceKPMG LLPT: 404 222 3257E: [email protected]
ii
AcknowledgmentsContinuity Insights and KPMG LLP would like to acknowledge the following organizations for their contributions in helping raise the awareness — and hence the value — of the 2016 Continuity Insights and KPMG LLP Global Business Continuity Man-agement (BCM) Program Benchmarking Study.
In addition, we would like to acknowledge the subject-matter professionals that took the time to review the survey results and provide their point of view for use in this report, the companion article, and the panel discussion at the 2016 Continuity Insights Management Conference.
Requests for Benchmarking Reports and Key Contact
A number of custom reports are available and can be accessed on the Continuity Insights website. Those custom reports are:
• Annual revenue.
• Entity type (public companies, private companies, government agencies or authorities, and not-for-profits).
• Governance (Entities with an Advisory Steering Committee, Entities with no Advisory Steering Committee).
• Industries (Computers/IT hardware, software and services; Financial services; Government; Healthcare; Manufacturing; Professional services and Utilities).
• Number of employees.
If you would like to request a custom report that has not already been developed and available on the website, please provide the following information to Robert Nakao at [email protected].
• Your name, organization, and e-mail address
• The type of custom report(s) you would like to receive
You will be provided the custom report(s) generally within five (5) business days of the receipt of your request.
• Association Of Contingency Planners (ACP)
• Association Of Sacramento Area Planners (ASAP)
• BC Management
• BCI-USA
• Business Continuity Institute (BCI)(UK)
• Business & Industry Council For Emergency Planning & Preparedness (BICEPP)
• Business Resumption Planners Association (BRPA)
• Canadian Security Partners’ Forum
• Contingency Planners Of Ohio (CPO)
• Contingency Planning Exchange (CPE)
• Continuity Central
• Disaster Recovery Journal (DRJ)
• Disaster Resource Guide
• Forbes Calamity Prevention (Singapore/Asia)
• Global Conference On Disaster Management
• Mid Atlantic Disaster Recovery Association (MADRA)
• New England Disaster Recovery Information Exchange (NEDRIX)
• Risk & Insurance Management Society (RIMS)
• Rothstein Business Survival
• Southeastern Business Recovery Exchange (SEBRE)
• Southeastern Contingency Planners Association (SCPA)

Segment Report: Revenue - $10 Milliion to $50 Million
Yes 35.29%
No 64.71%
Total 100.00%
Aerospace/Defense 0.00%
Automotive 0.00%
Biotechnology 0.00%
Chemical/Petroleum 0.00%
Communications/Media 0.00%
Computer/Information Technology
Telecommunications 0.00%
Computer/Information Technology Software 0.00%
Computer/Information Technology Services 11.76%
Education 5.88%
Entertainment/Media 0.00%
Financial Services – Banking 5.88%
Financial Services – Brokerage 0.00%
Financial Services – Credit Card 0.00%
Financial Services – Investment 0.00%
Utilities 0.00%
Government 5.88%
Healthcare Medical – Hospital 0.00%
Healthcare Medical – Service Provider 5.88%
Insurance 0.00%
Manufacturing - Consumer Goods 0.00%
Manufacturing - Industrial Goods (Non-technology)5.88%
Manufacturing - Medl Devices/Other 11.76%
Not for Profit Organization 11.76%
Pharmaceuticals 0.00%
Power (Oil and Gas) 5.88%
Power (Generation/Transmission) 0.00%
Professional Services (Business Continuity/Operational
Risk Consulting) 0.00%
Professional Services (Other) 11.76%
Retail 0.00%
Transportation – Aviation 0.00%
Transportation – Mass Transit 0.00%
Transportation – Shipping 0.00%
Transportation - Trucking 0.00%
Utilities 5.88%
Wholesale Distributors 0.00%
Other (Please indicate industry) 11.76%
Total 100.00%
Less than 25 0.00%
25 to < 100 29.41%
100 to < 500 29.41%
500 to < 1,000 11.76%
1,000 to < 5,000 17.65%
5,000 to < 10,000 5.88%
1. Does your enterprise use survey results to generate or enhance executive support for your Business Continuity Management (BCM)
Program?
2. Which best describes your primary type of industry? (Select only one response)
3. How many people are employed by your organization (at all locations)? (Select only one response)
Page 1

Segment Report: Revenue - $10 Milliion to $50 Million
10,000 to < 20,000 0.00%
20,000 or more 5.88%
Total 100.00%
Public company 11.76%
Privately-held company 52.94%
Government agency or Authority 5.88%
Education 5.88%
Not-for-profit organization 23.53%
Total 100.00%
Local - Single site operation in one location 17.65%
Regional - Multi-site operations in one region of one
country 23.53%
National - Multi-site operations throughout one
country 35.29%
Global - Multi-site operations worldwide 23.53%
Total 100.00%
Yes - Same Building 46.15%
Yes - Same Campus 23.08%
No 30.77%
Total 100.00%
Brazil 0.00%
Canada 6.67%
United States 40.00%
Americas - Other (Specify) 20.00%
Australia 13.33%
Singapore 6.67%
South Korea (Republic of Korea) 0.00%
Taiwan 0.00%
Turkey 0.00%
Asia Pacific - Other (Specify) 6.67%
France 0.00%
Germany 0.00%
The Netherlands 6.67%
Spain 0.00%
Switzerland 0.00%
United Arab Emirates 0.00%
United Kingdom 0.00%
Europe, Middle East, and Africa - Other (Specify)0.00%
Total 100.00%
Less than $10 million 0.00%
$10 million to < $50 million 100.00%
$50 million to < $100 million 0.00%
$100 million to < $500 million 0.00%
4. Which best describes your organization, entity, or enterprise? (Select only one response)
5. How would you describe the geographical range of your operations? (Select only one response)
6. Are your headquarters operations AND your primary data center located in the same building or the same campus?
7. If your organization has operations in multiple countries, in what country is your organization’s headquarters located?
8. What is your company’s approximate annual revenue in ($US) for the last fiscal year (FY15)? (Government agencies, please select Not
Applicable)?
Page 2
Segment Report: Revenue - $10 Milliion to $50 Million
$500 million to < $1 billion 0.00%
$1 billion to < $5 billion 0.00%
$5 billion to < $10 billion 0.00%
$10 billion or more 0.00%
Not Applicable 0.00%
Unknown 0.00%
Total 100.00%
Business Continuity Management or Business
Resilience Management in Business Unit/Site/Support
Group 23.53%
Business Continuity Management or Business
Resilience Management in Corporate Program Office11.76%
Compliance/Internal Audit 0.00%
Consultant/Analyst 11.76%
Crisis Management/Emergency Management 11.76%
Enterprise Risk Management 5.88%
Employee Health and Safety 0.00%
Facilities Management/Real Estate 0.00%
Finance/Accounting 0.00%
Insurance/Liability Management 0.00%
IT Disaster Recovery (IT DR) Planning 5.88%
Legal 0.00%
Security Management 5.88%
Other (Please Define) 5.88%
Corporate Executive 17.65%
Total 100.00%
Less than 1 year 6.25%
1 year to < 3 years 25.00%
3 years to < 5 years 6.25%
5 years to < 10 years 25.00%
10 years to < 20 years 6.25%
20 years or more 6.25%
Unknown 25.00%
Total 100.00%
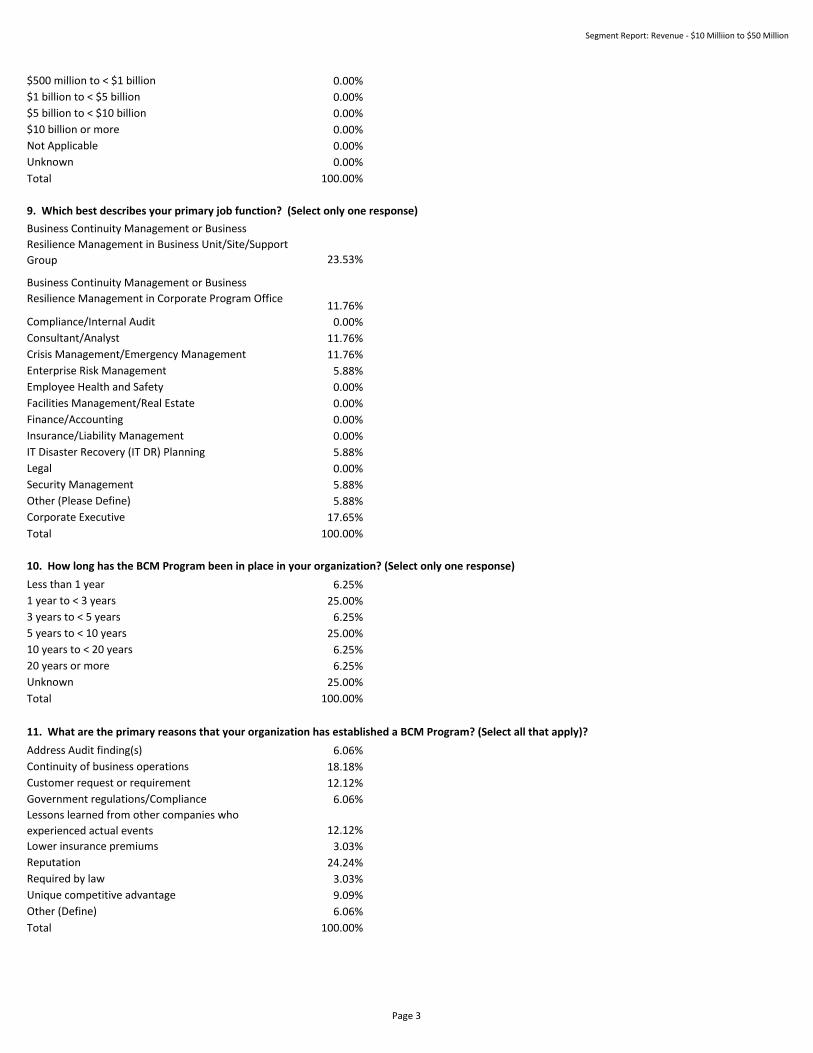
Address Audit finding(s) 6.06%
Continuity of business operations 18.18%
Customer request or requirement 12.12%
Government regulations/Compliance 6.06%
Lessons learned from other companies who
experienced actual events 12.12%
Lower insurance premiums 3.03%
Reputation 24.24%
Required by law 3.03%
Unique competitive advantage 9.09%
Other (Define) 6.06%
Total 100.00%
9. Which best describes your primary job function? (Select only one response)
10. How long has the BCM Program been in place in your organization? (Select only one response)
11. What are the primary reasons that your organization has established a BCM Program? (Select all that apply)?
Page 3

Segment Report: Revenue - $10 Milliion to $50 Million
Audit findings 10.00%
Benchmarking/comparison to industry norms 10.00%
Maturity modeling 2.50%
Metrics program (including executive reporting)10.00%
Business Continuity performance reviews 12.50%
Business Continuity Plan exercises 20.00%
Service level monitoring 2.50%
Review program capabilities vs. standards 5.00%
Technology recovery test results 10.00%
Cost / Benefit Analysis 10.00%
Other - Please define: 0.00%
N/A - We do not measure BCM Program performance7.50%
Total 100.00%
Na
Not Applicable
Not Applicable
iso 22301
ISO 14971
N/A
N/A
nope
None
Not applic
ISO 22301 and related standards; BCI GPG
ISO 13485
ISO 22301
nfpa 1600
Not Applicable
Awareness Program 3.85%
Business Continuity Plans 15.38%
Communications 26.92%
Crisis/Emergency Management Plans 19.23%
IT Disaster Recovery Plans 15.38%
Plans are in development 7.69%
None 7.69%
Not sure 3.85%
Total 100.00%
Full Time 18.75%
Part Time 56.25%
No 25.00%
Total 100.00%
12. How does your organization measure the performance of your BCM Program? (Select all that apply)
Because we primarily support government clients, we base our operations on US HSPD-20/FCD-1. By extension, I believe we
are in compliance wit hISO 22301
13. In addition to any regulatory requirements that your organization may be required to meet, please list the business continuity
standard(s) that your organization is using to support your BCM Program? Please list standards (Example: ISO 22301, NFPA 1600, FFIEC,
Not Applicable, etc.)
14. Is your organization utilizing social media in any of the following plans? (Check all that apply)
15. Does your organization have a designated full time or part time lead BCM Program Coordinator authorized to administer and keep
the BCM Program current? (Select only one response)
Page 4
Segment Report: Revenue - $10 Milliion to $50 Million
Yes 37.50%
No 62.50%
Total 100.00%
CEO/President 6.25%
Chief Financial Officer 0.00%
Chief Information Officer 12.50%
Chief Operating Officer 0.00%
Chief Risk Officer 6.25%
Chief Security Officer, VP/Director 6.25%
Director, Business Continuity Management or Business
Resilience 6.25%
Director, Information Technology 0.00%
Director or Manager, Risk Management 0.00%
Manager, Business Continuity Management or Business
Resilience 18.75%
Manager, Information Technology 6.25%
Vice President, Business Continuity Management or
Business Resilience 6.25%
Vice President, Information Technology 6.25%
Vice President, Risk Management 0.00%
Specific Department Director / Manager. Please
identify the business function (name of department):12.50%
Other (please enter job title) 12.50%
Total 100.00%
CEO 18.75%
Chief Administrative Officer 0.00%
Chief Compliance Officer 0.00%
Chief Financial Officer 0.00%
Chief Information Officer 12.50%
Chief Information Security Officer 6.25%
Chief Operating Officer 12.50%
Chief Risk Officer 18.75%
Chief Security Officer, VP/Director 0.00%
Chief Technology Officer 0.00%
General Counsel 0.00%
President 12.50%
Other C-Level Executive (Please identify the
corporate/executive management title) 18.75%
Total 100.00%
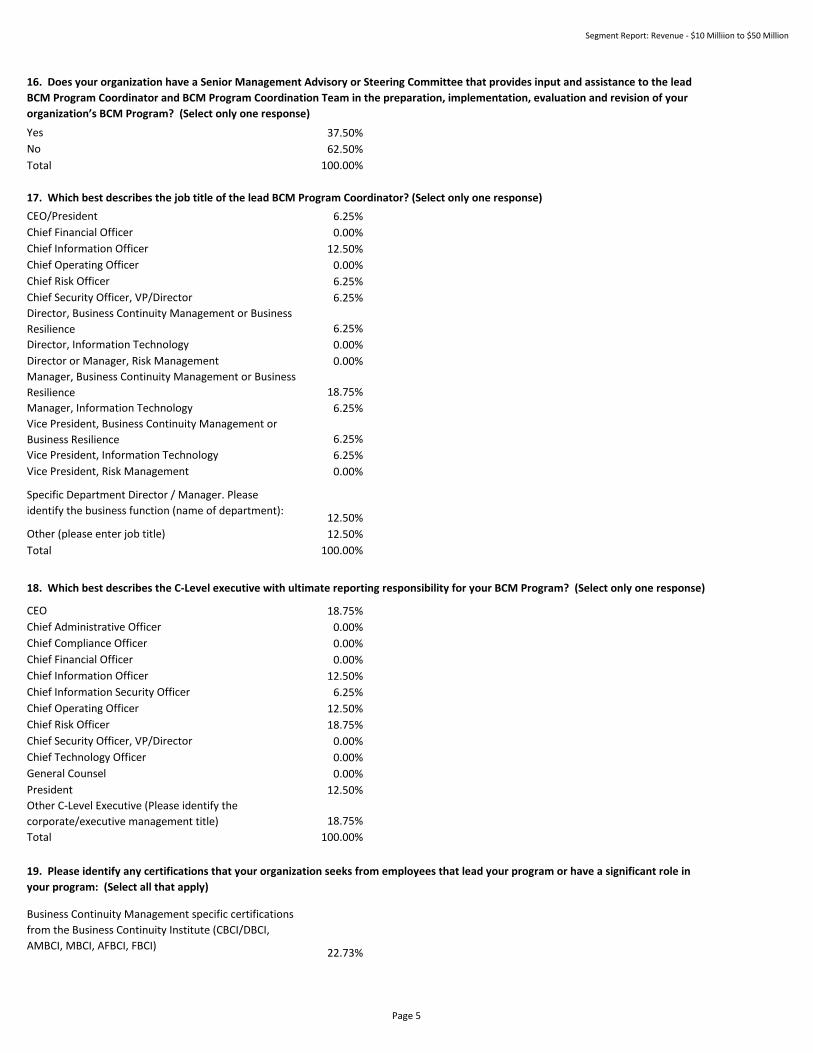
Business Continuity Management specific certifications
from the Business Continuity Institute (CBCI/DBCI,
AMBCI, MBCI, AFBCI, FBCI)22.73%
16. Does your organization have a Senior Management Advisory or Steering Committee that provides input and assistance to the lead
BCM Program Coordinator and BCM Program Coordination Team in the preparation, implementation, evaluation and revision of your
organization’s BCM Program? (Select only one response)
17. Which best describes the job title of the lead BCM Program Coordinator? (Select only one response)
19. Please identify any certifications that your organization seeks from employees that lead your program or have a significant role in
your program: (Select all that apply)
18. Which best describes the C-Level executive with ultimate reporting responsibility for your BCM Program? (Select only one response)
Page 5

Segment Report: Revenue - $10 Milliion to $50 Million
Business Continuity Management certified
professionals from the Disaster Recovery Institute
International (ABCP, CFCP, CBCP or MBCP)18.18%
Business Continuity Management certified specialties
from the Disaster Recovery Institute International
(Certified Auditor, Public Sector, Health)4.55%
IT specific certifications (i.e., ITIL, CISSP, CISA, etc.)4.55%
Non-Business Continuity specific certifications (i.e.,
PMP, CIPP, etc.) 31.82%
Other: (Define) 18.18%
Total 100.00%
Less than 1 year 0.00%
1 year to < 3 years 12.50%
3 years to < 5 years 18.75%
5 years to < 10 years 37.50%
10 years to < 20 years 6.25%
20 years or more 6.25%
Do not know 18.75%
Total 100.00%
0 FTEs 26.67%
1 to 2 FTEs 46.67%
3 to 5 FTEs 13.33%
6 to 9 FTEs 0.00%
10 to 20 FTEs 0.00%
More than 20 FTEs 0.00%
I don’t know 13.33%
Total 100.00%
0 FTEs 33.33%
1 to 2 FTEs 46.67%
3 to 5 FTEs 13.33%
6 to 9 FTEs 0.00%
10 to 20 FTEs 0.00%
More than 20 FTEs 0.00%
I don’t know 6.67%
Total 100.00%
0 FTEs 20.00%
1 to 2 FTEs 53.33%
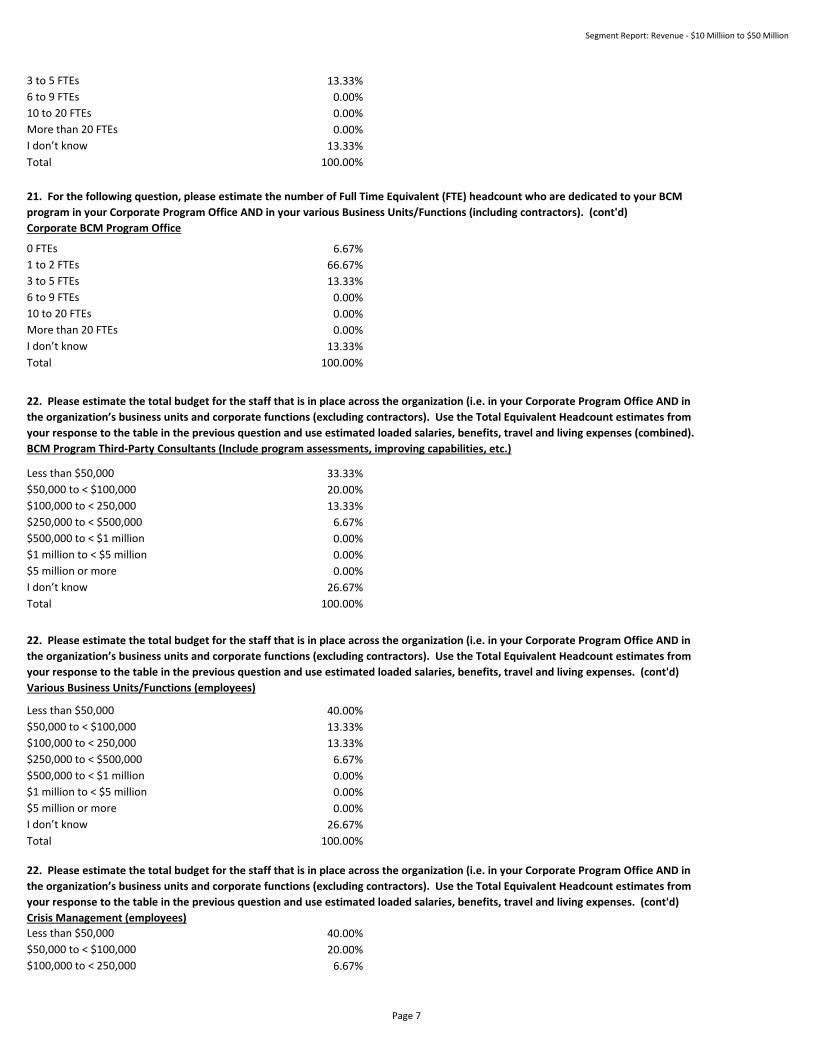
21. For the following question, please estimate the number of Full Time Equivalent (FTE) headcount who are dedicated to your BCM
program in your Corporate Program Office AND in your various Business Units/Functions (including contractors). (cont'd)
Various Business Units/Functions
20. Please identify the number of years of BCM program leadership experience of your BCM Program leader has (Leading a Program):
(Select only one response)
21. For the following question, please estimate the number of Full Time Equivalent (FTE) headcount who are dedicated to your BCM
program in your Corporate Program Office AND in your various Business Units/Functions (including contractors).
Information Technology/Disaster Recovery
21. For the following question, please estimate the number of Full Time Equivalent (FTE) headcount who are dedicated to your BCM
program in your Corporate Program Office AND in your various Business Units/Functions (including contractors). (cont'd)
Crisis Management
Page 6
Segment Report: Revenue - $10 Milliion to $50 Million
3 to 5 FTEs 13.33%
6 to 9 FTEs 0.00%
10 to 20 FTEs 0.00%
More than 20 FTEs 0.00%
I don’t know 13.33%
Total 100.00%
0 FTEs 6.67%
1 to 2 FTEs 66.67%
3 to 5 FTEs 13.33%
6 to 9 FTEs 0.00%
10 to 20 FTEs 0.00%
More than 20 FTEs 0.00%
I don’t know 13.33%
Total 100.00%
Less than $50,000 33.33%
$50,000 to < $100,000 20.00%
$100,000 to < 250,000 13.33%
$250,000 to < $500,000 6.67%
$500,000 to < $1 million 0.00%
$1 million to < $5 million 0.00%
$5 million or more 0.00%
I don’t know 26.67%
Total 100.00%
Less than $50,000 40.00%
$50,000 to < $100,000 13.33%
$100,000 to < 250,000 13.33%
$250,000 to < $500,000 6.67%
$500,000 to < $1 million 0.00%
$1 million to < $5 million 0.00%
$5 million or more 0.00%
I don’t know 26.67%
Total 100.00%
Less than $50,000 40.00%
$50,000 to < $100,000 20.00%
$100,000 to < 250,000 6.67%
21. For the following question, please estimate the number of Full Time Equivalent (FTE) headcount who are dedicated to your BCM
program in your Corporate Program Office AND in your various Business Units/Functions (including contractors). (cont'd)
Corporate BCM Program Office
22. Please estimate the total budget for the staff that is in place across the organization (i.e. in your Corporate Program Office AND in
the organization’s business units and corporate functions (excluding contractors). Use the Total Equivalent Headcount estimates from
your response to the table in the previous question and use estimated loaded salaries, benefits, travel and living expenses (combined).
BCM Program Third-Party Consultants (Include program assessments, improving capabilities, etc.)
22. Please estimate the total budget for the staff that is in place across the organization (i.e. in your Corporate Program Office AND in
the organization’s business units and corporate functions (excluding contractors). Use the Total Equivalent Headcount estimates from
your response to the table in the previous question and use estimated loaded salaries, benefits, travel and living expenses. (cont'd)
Various Business Units/Functions (employees)
22. Please estimate the total budget for the staff that is in place across the organization (i.e. in your Corporate Program Office AND in
the organization’s business units and corporate functions (excluding contractors). Use the Total Equivalent Headcount estimates from
your response to the table in the previous question and use estimated loaded salaries, benefits, travel and living expenses. (cont'd)
Crisis Management (employees)
Page 7
Segment Report: Revenue - $10 Milliion to $50 Million
$250,000 to < $500,000 13.33%
$500,000 to < $1 million 0.00%
$1 million to < $5 million 0.00%
$5 million or more 0.00%
I don’t know 20.00%
Total 100.00%
Less than $50,000 13.33%
$50,000 to < $100,000 40.00%
$100,000 to < 250,000 6.67%
$250,000 to < $500,000 13.33%
$500,000 to < $1 million 0.00%
$1 million to < $5 million 0.00%
$5 million or more 0.00%
I don’t know 26.67%
Total 100.00%
Less than $50,000 33.33%
$50,000 to < $100,000 33.33%
$100,000 to < 250,000 0.00%
$250,000 to < $500,000 6.67%
$500,000 to < $1 million 0.00%
$1 million to < $5 million 0.00%
$5 million or more 0.00%
I don’t know 26.67%
Total 100.00%
Less than $50,000 46.67%
$50,000 to < $100,000 13.33%
$100,000 to < $250,000 13.33%
$250,000 to < $500,000 6.67%
$500,000 to < $1 million 0.00%
$1 million to < $5 million 0.00%
$5 million or more 0.00%
I don’t know 20.00%
Total 100.00%
Less than $50,000 40.00%
$50,000 to < $100,000 20.00%
$100,000 to < $250,000 13.33%
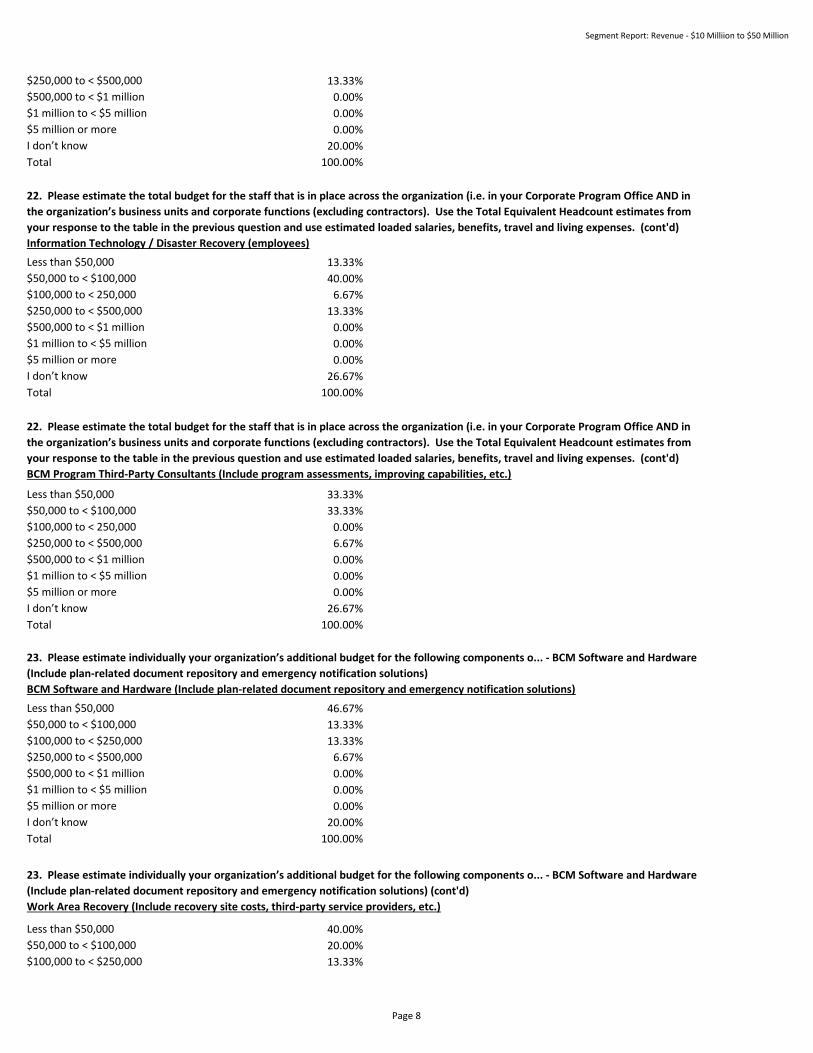
22. Please estimate the total budget for the staff that is in place across the organization (i.e. in your Corporate Program Office AND in
the organization’s business units and corporate functions (excluding contractors). Use the Total Equivalent Headcount estimates from
your response to the table in the previous question and use estimated loaded salaries, benefits, travel and living expenses. (cont'd)
BCM Program Third-Party Consultants (Include program assessments, improving capabilities, etc.)
23. Please estimate individually your organization’s additional budget for the following components o... - BCM Software and Hardware
(Include plan-related document repository and emergency notification solutions)
BCM Software and Hardware (Include plan-related document repository and emergency notification solutions)
23. Please estimate individually your organization’s additional budget for the following components o... - BCM Software and Hardware
(Include plan-related document repository and emergency notification solutions) (cont'd)
Work Area Recovery (Include recovery site costs, third-party service providers, etc.)
22. Please estimate the total budget for the staff that is in place across the organization (i.e. in your Corporate Program Office AND in
the organization’s business units and corporate functions (excluding contractors). Use the Total Equivalent Headcount estimates from
your response to the table in the previous question and use estimated loaded salaries, benefits, travel and living expenses. (cont'd)
Information Technology / Disaster Recovery (employees)
Page 8
Segment Report: Revenue - $10 Milliion to $50 Million
$250,000 to < $500,000 6.67%
$500,000 to < $1 million 0.00%
$1 million to < $5 million 0.00%
$5 million or more 0.00%
I don’t know 20.00%
100.00%
Less than $50,000 33.33%
$50,000 to < $100,000 33.33%
$100,000 to < $250,000 6.67%
$250,000 to < $500,000 13.33%
$500,000 to < $1 million 0.00%
$1 million to < $5 million 0.00%
$5 million or more 0.00%
I don’t know 13.33%
Total 100.00%
Less than $50,000 46.67%
$50,000 to < $100,000 20.00%
$100,000 to < $250,000 6.67%
$250,000 to < $500,000 6.67%
$500,000 to < $1 million 0.00%
$1 million to < $5 million 0.00%
$5 million or more 0.00%
I don’t know 20.00%
Total 100.00%
Less than $50,000 46.67%
$50,000 to < $100,000 20.00%
$100,000 to < $250,000 6.67%
$250,000 to < $500,000 6.67%
$500,000 to < $1 million 0.00%
$1 million to < $5 million 0.00%
$5 million or more 0.00%
I don’t know 20.00%
Total 100.00%
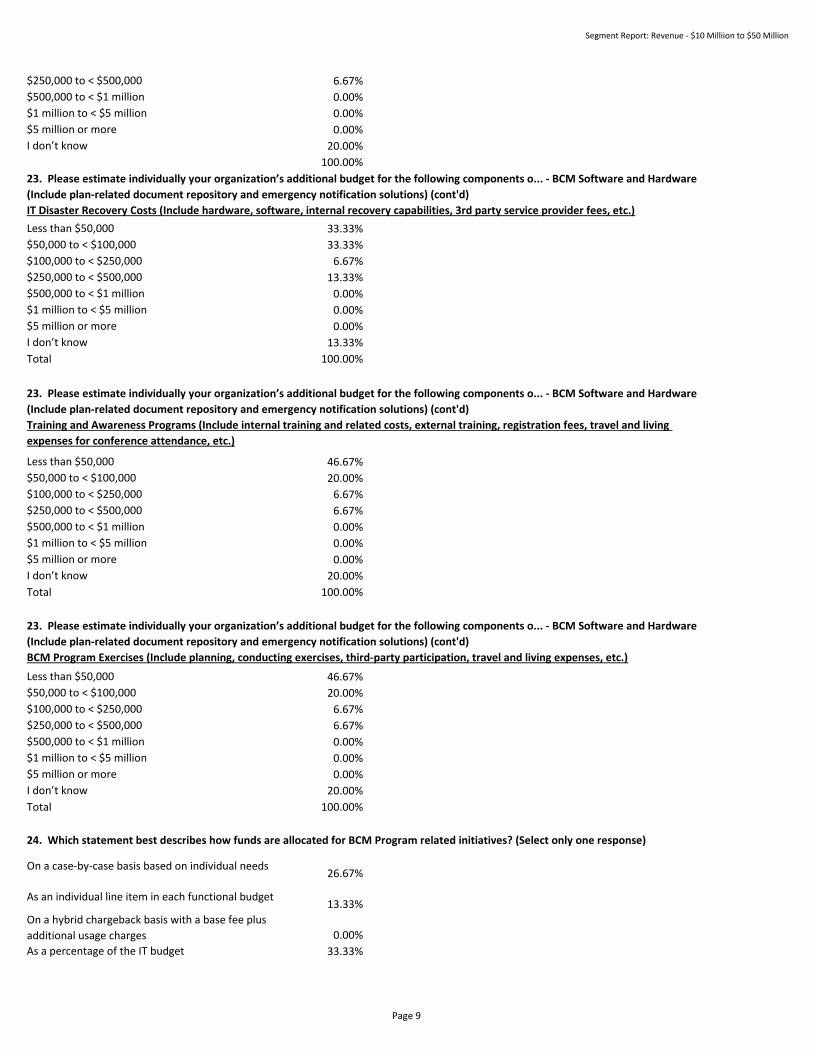
On a case-by-case basis based on individual needs26.67%
As an individual line item in each functional budget13.33%
On a hybrid chargeback basis with a base fee plus
additional usage charges 0.00%
As a percentage of the IT budget 33.33%
23. Please estimate individually your organization’s additional budget for the following components o... - BCM Software and Hardware
(Include plan-related document repository and emergency notification solutions) (cont'd)
BCM Program Exercises (Include planning, conducting exercises, third-party participation, travel and living expenses, etc.)
23. Please estimate individually your organization’s additional budget for the following components o... - BCM Software and Hardware
(Include plan-related document repository and emergency notification solutions) (cont'd)
IT Disaster Recovery Costs (Include hardware, software, internal recovery capabilities, 3rd party service provider fees, etc.)
23. Please estimate individually your organization’s additional budget for the following components o... - BCM Software and Hardware
(Include plan-related document repository and emergency notification solutions) (cont'd)
Training and Awareness Programs (Include internal training and related costs, external training, registration fees, travel and living
expenses for conference attendance, etc.)
24. Which statement best describes how funds are allocated for BCM Program related initiatives? (Select only one response)
Page 9
Segment Report: Revenue - $10 Milliion to $50 Million
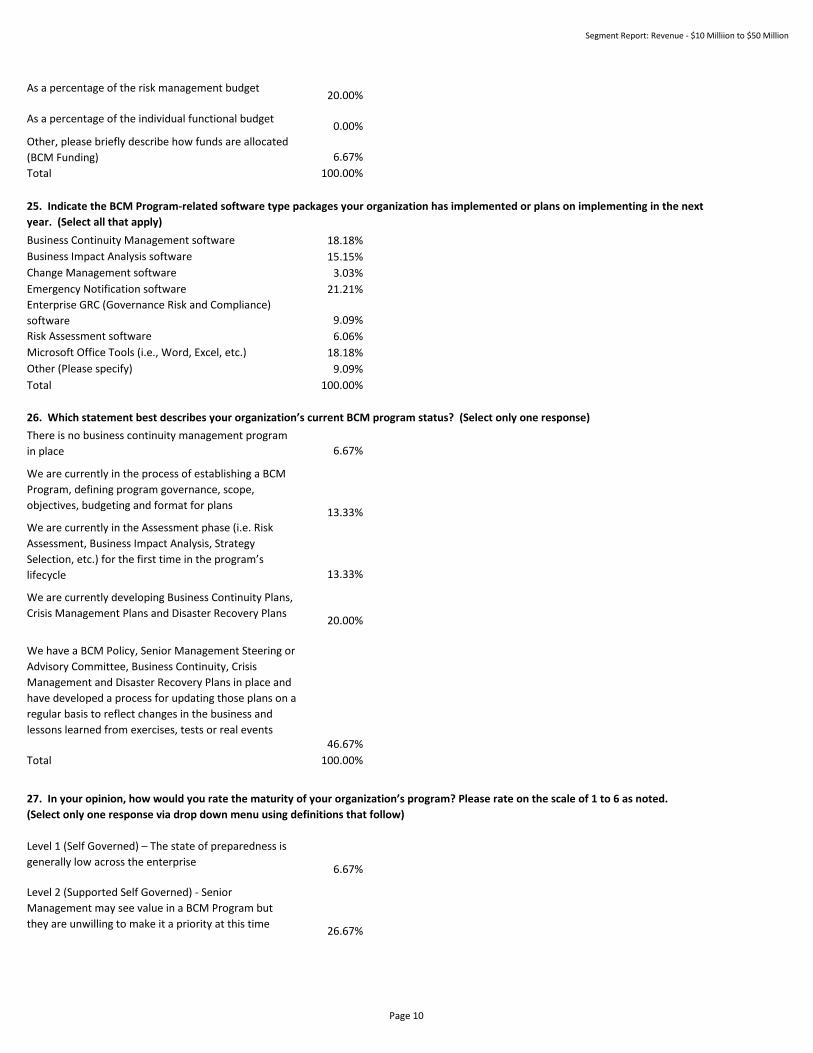
As a percentage of the risk management budget20.00%
As a percentage of the individual functional budget0.00%
Other, please briefly describe how funds are allocated
(BCM Funding) 6.67%
Total 100.00%
Business Continuity Management software 18.18%
Business Impact Analysis software 15.15%
Change Management software 3.03%
Emergency Notification software 21.21%
Enterprise GRC (Governance Risk and Compliance)
software 9.09%
Risk Assessment software 6.06%
Microsoft Office Tools (i.e., Word, Excel, etc.) 18.18%
Other (Please specify) 9.09%
Total 100.00%
There is no business continuity management program
in place 6.67%
We are currently in the process of establishing a BCM
Program, defining program governance, scope,
objectives, budgeting and format for plans13.33%
We are currently in the Assessment phase (i.e. Risk
Assessment, Business Impact Analysis, Strategy
Selection, etc.) for the first time in the program’s
lifecycle 13.33%
We are currently developing Business Continuity Plans,
Crisis Management Plans and Disaster Recovery Plans20.00%
We have a BCM Policy, Senior Management Steering or
Advisory Committee, Business Continuity, Crisis
Management and Disaster Recovery Plans in place and
have developed a process for updating those plans on a
regular basis to reflect changes in the business and
lessons learned from exercises, tests or real events46.67%
Total 100.00%
Level 1 (Self Governed) – The state of preparedness is
generally low across the enterprise 6.67%
Level 2 (Supported Self Governed) - Senior
Management may see value in a BCM Program but
they are unwilling to make it a priority at this time26.67%
26. Which statement best describes your organization’s current BCM program status? (Select only one response)
27. In your opinion, how would you rate the maturity of your organization’s program? Please rate on the scale of 1 to 6 as noted.
(Select only one response via drop down menu using definitions that follow)
25. Indicate the BCM Program-related software type packages your organization has implemented or plans on implementing in the next
year. (Select all that apply)
Page 10

Segment Report: Revenue - $10 Milliion to $50 Million
Level 3 (Centrally Governed) - A BCM Program Office or
Department has been established which centrally
delivers BCM Program governance and support services
to the business units and other departments within the
organization26.67%
Level 4 (Enterprise Awakening) – Senior management
understands and is committed to the strategic
importance of an effective BCM Program. All business
continuity plans are updated routinely 20.00%
Level 5 (Planned Growth) – A multi-year plan has been
plan has been adopted to “continuously raise the bar”
for planning sophistication and enterprise wide state of
preparedness 13.33%
Level 6 (Synergistic) – Cross functional coordination has
led participants to develop and successfully test
upstream and downstream integration of their business
continuity plans 6.67%
Total 100.00%
Yes 73.33%
No 13.33%
Don’t know 13.33%
Total 100.00%
Yes 40.00%
No 40.00%
Don’t know 20.00%
Total 100.00%
Extremely 6.67%
Very much 33.33%
Somewhat 40.00%
Not at all 13.33%
Not Applicable 6.67%
Total 100.00%
Extremely 6.67%
Very much 40.00%
Somewhat 33.33%
Not at all 6.67%
Not Applicable 13.33%
Total 100.00%
28. Does your organization maintain and foster relationships with external government agencies to ensure the recovery of your
organization during a disaster? (Select only one response)
29. Are mission critical 3rd party service providers required to show evidence they have a viable BCM Program? (Select only one
response)
30. How well integrated is the BCM Program with the following capabilities?
Compliance/Audit
30. How well integrated is the BCM Program with the following capabilities? (cont'd)
Corporate Security
Page 11
Segment Report: Revenue - $10 Milliion to $50 Million
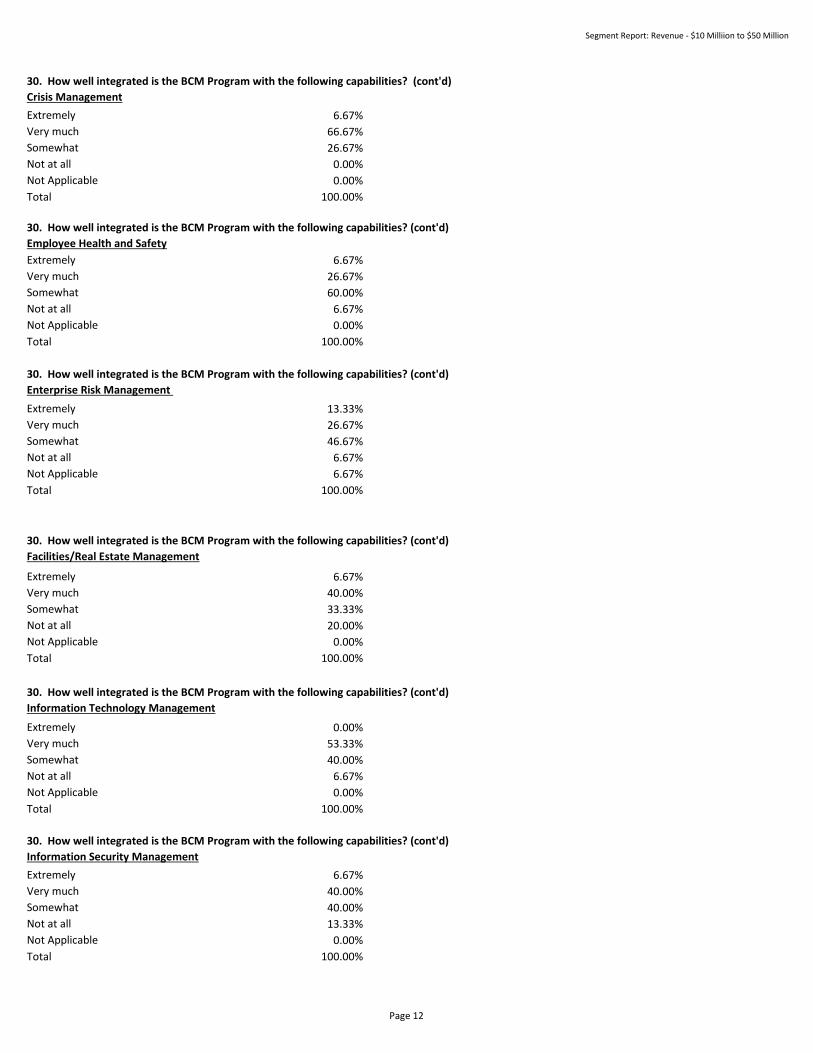
Extremely 6.67%
Very much 66.67%
Somewhat 26.67%
Not at all 0.00%
Not Applicable 0.00%
Total 100.00%
Extremely 6.67%
Very much 26.67%
Somewhat 60.00%
Not at all 6.67%
Not Applicable 0.00%
Total 100.00%
Extremely 13.33%
Very much 26.67%
Somewhat 46.67%
Not at all 6.67%
Not Applicable 6.67%
Total 100.00%
Extremely 6.67%
Very much 40.00%
Somewhat 33.33%
Not at all 20.00%
Not Applicable 0.00%
Total 100.00%
Extremely 0.00%
Very much 53.33%
Somewhat 40.00%
Not at all 6.67%
Not Applicable 0.00%
Total 100.00%
Extremely 6.67%
Very much 40.00%
Somewhat 40.00%
Not at all 13.33%
Not Applicable 0.00%
Total 100.00%
30. How well integrated is the BCM Program with the following capabilities? (cont'd)
Crisis Management
30. How well integrated is the BCM Program with the following capabilities? (cont'd)
Enterprise Risk Management
30. How well integrated is the BCM Program with the following capabilities? (cont'd)
Facilities/Real Estate Management
30. How well integrated is the BCM Program with the following capabilities? (cont'd)
Information Technology Management
30. How well integrated is the BCM Program with the following capabilities? (cont'd)
Information Security Management
30. How well integrated is the BCM Program with the following capabilities? (cont'd)
Employee Health and Safety
Page 12
Segment Report: Revenue - $10 Milliion to $50 Million
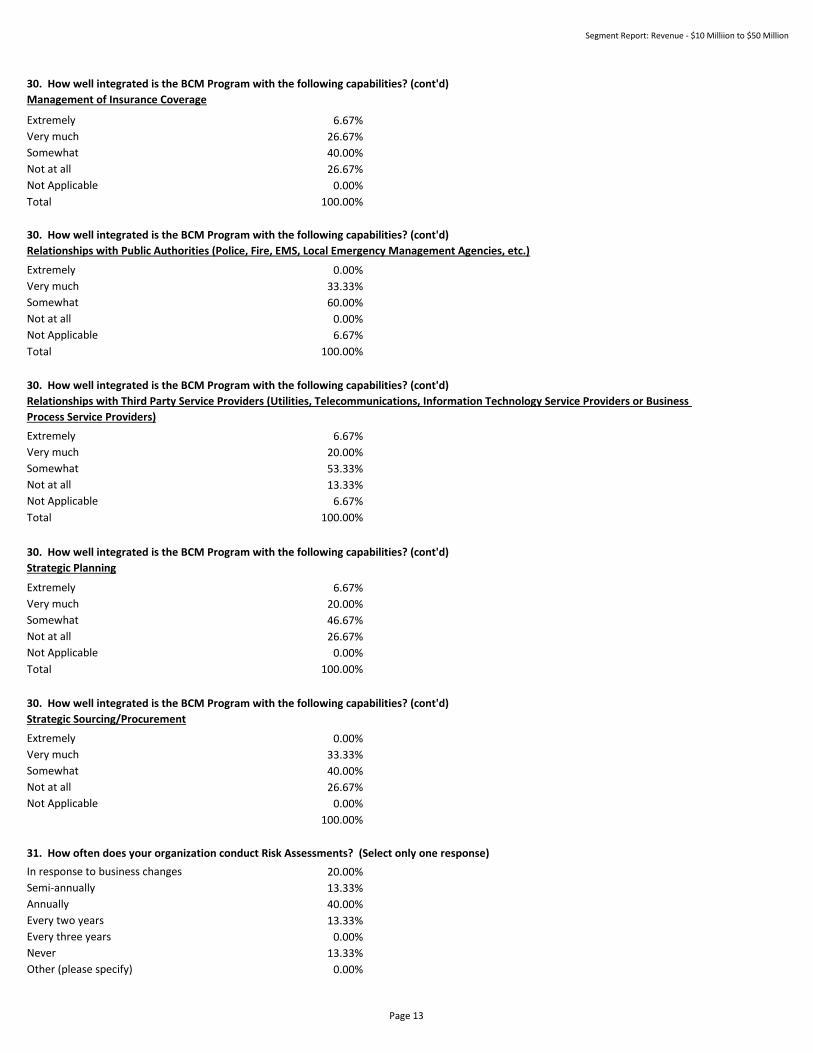
Extremely 6.67%
Very much 26.67%
Somewhat 40.00%
Not at all 26.67%
Not Applicable 0.00%
Total 100.00%
Extremely 0.00%
Very much 33.33%
Somewhat 60.00%
Not at all 0.00%
Not Applicable 6.67%
Total 100.00%
Extremely 6.67%
Very much 20.00%
Somewhat 53.33%
Not at all 13.33%
Not Applicable 6.67%
Total 100.00%
Extremely 6.67%
Very much 20.00%
Somewhat 46.67%
Not at all 26.67%
Not Applicable 0.00%
Total 100.00%
Extremely 0.00%
Very much 33.33%
Somewhat 40.00%
Not at all 26.67%
Not Applicable 0.00%
100.00%
In response to business changes 20.00%
Semi-annually 13.33%
Annually 40.00%
Every two years 13.33%
Every three years 0.00%
Never 13.33%
Other (please specify) 0.00%
30. How well integrated is the BCM Program with the following capabilities? (cont'd)
Management of Insurance Coverage
30. How well integrated is the BCM Program with the following capabilities? (cont'd)
Relationships with Public Authorities (Police, Fire, EMS, Local Emergency Management Agencies, etc.)
30. How well integrated is the BCM Program with the following capabilities? (cont'd)
Relationships with Third Party Service Providers (Utilities, Telecommunications, Information Technology Service Providers or Business
Process Service Providers)
30. How well integrated is the BCM Program with the following capabilities? (cont'd)
Strategic Planning
30. How well integrated is the BCM Program with the following capabilities? (cont'd)
Strategic Sourcing/Procurement
31. How often does your organization conduct Risk Assessments? (Select only one response)
Page 13
Segment Report: Revenue - $10 Milliion to $50 Million
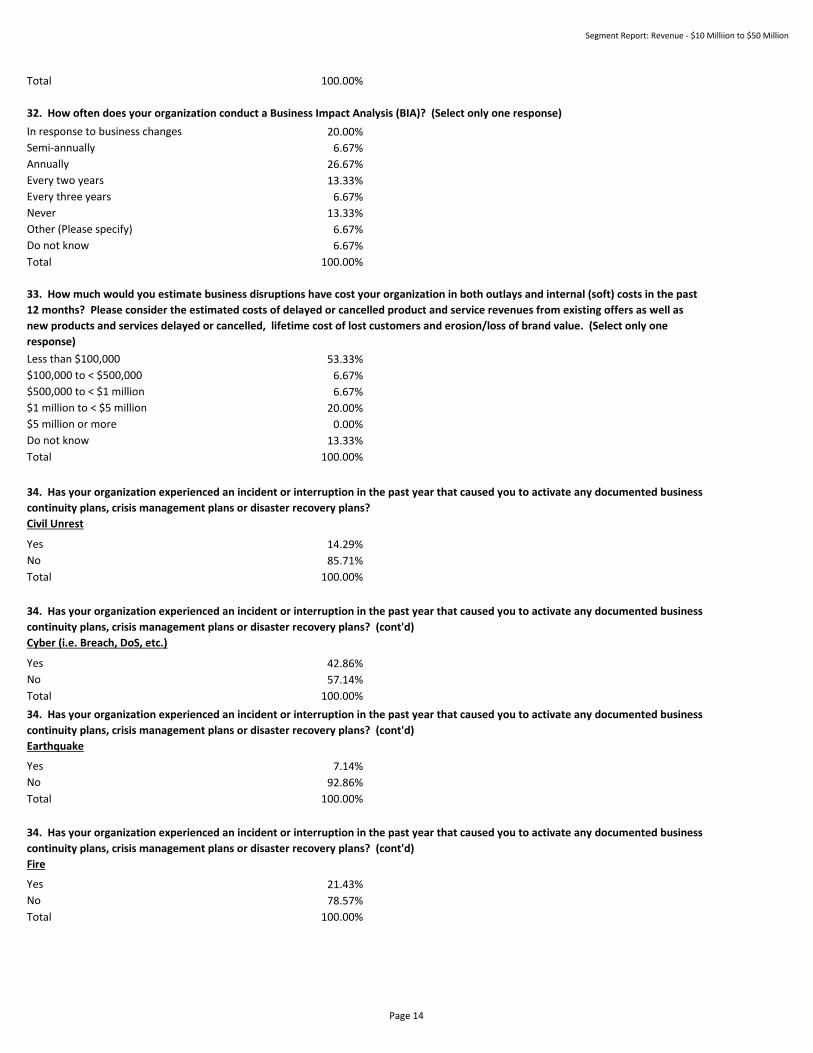
Total 100.00%
In response to business changes 20.00%
Semi-annually 6.67%
Annually 26.67%
Every two years 13.33%
Every three years 6.67%
Never 13.33%
Other (Please specify) 6.67%
Do not know 6.67%
Total 100.00%
Less than $100,000 53.33%
$100,000 to < $500,000 6.67%
$500,000 to < $1 million 6.67%
$1 million to < $5 million 20.00%
$5 million or more 0.00%
Do not know 13.33%
Total 100.00%
Yes 14.29%
No 85.71%
Total 100.00%
Yes 42.86%
No 57.14%
Total 100.00%
Yes 7.14%
No 92.86%
Total 100.00%
Yes 21.43%
No 78.57%
Total 100.00%
34. Has your organization experienced an incident or interruption in the past year that caused you to activate any documented business
continuity plans, crisis management plans or disaster recovery plans? (cont'd)
Earthquake
32. How often does your organization conduct a Business Impact Analysis (BIA)? (Select only one response)
33. How much would you estimate business disruptions have cost your organization in both outlays and internal (soft) costs in the past
12 months? Please consider the estimated costs of delayed or cancelled product and service revenues from existing offers as well as
new products and services delayed or cancelled, lifetime cost of lost customers and erosion/loss of brand value. (Select only one
response)
34. Has your organization experienced an incident or interruption in the past year that caused you to activate any documented business
continuity plans, crisis management plans or disaster recovery plans? (cont'd)
Fire
34. Has your organization experienced an incident or interruption in the past year that caused you to activate any documented business
continuity plans, crisis management plans or disaster recovery plans? (cont'd)
Cyber (i.e. Breach, DoS, etc.)
34. Has your organization experienced an incident or interruption in the past year that caused you to activate any documented business
continuity plans, crisis management plans or disaster recovery plans?
Civil Unrest
Page 14
Segment Report: Revenue - $10 Milliion to $50 Million
Yes 28.57%
No 71.43%
Total 100.00%
Yes 28.57%
No 71.43%
Total 100.00%
Yes 50.00%
No 50.00%
Total 100.00%
Yes 35.71%
No 64.29%
Total 100.00%
Yes 42.86%
No 57.14%
Total 100.00%
Yes 35.71%
No 64.29%
100.00%
Yes 57.14%
No 42.86%
Total 100.00%
Yes 50.00%
34. Has your organization experienced an incident or interruption in the past year that caused you to activate any documented business
continuity plans, crisis management plans or disaster recovery plans? (cont'd)
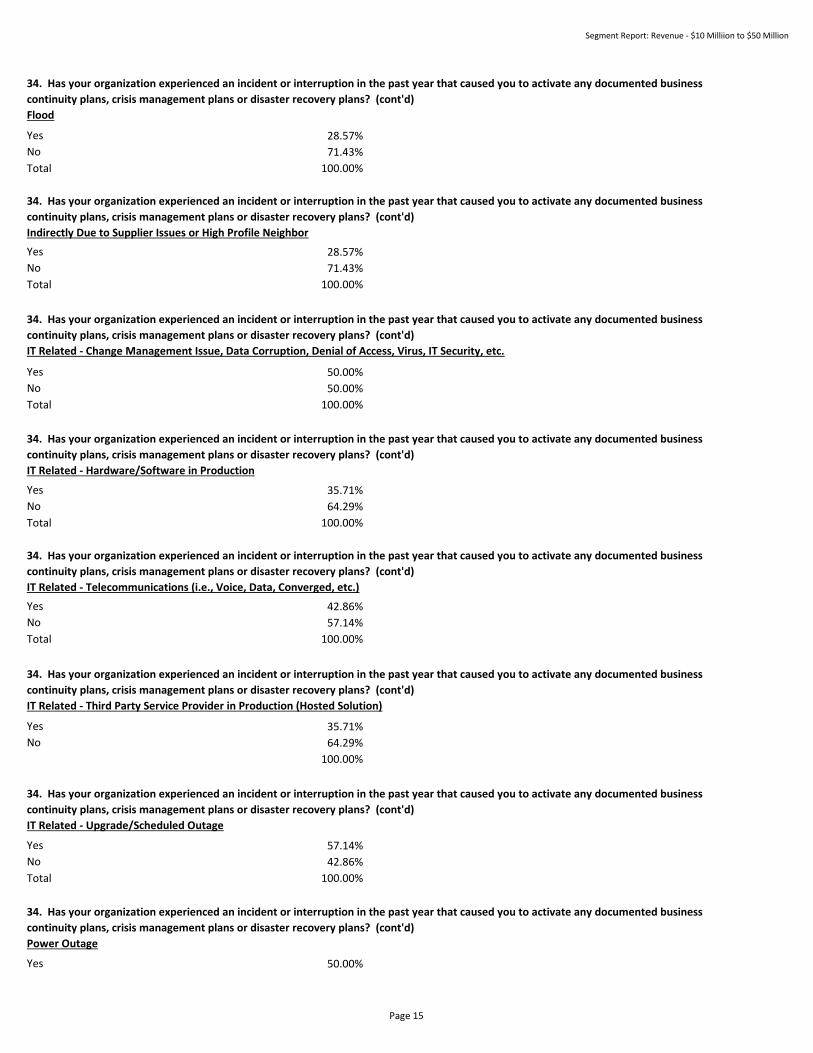
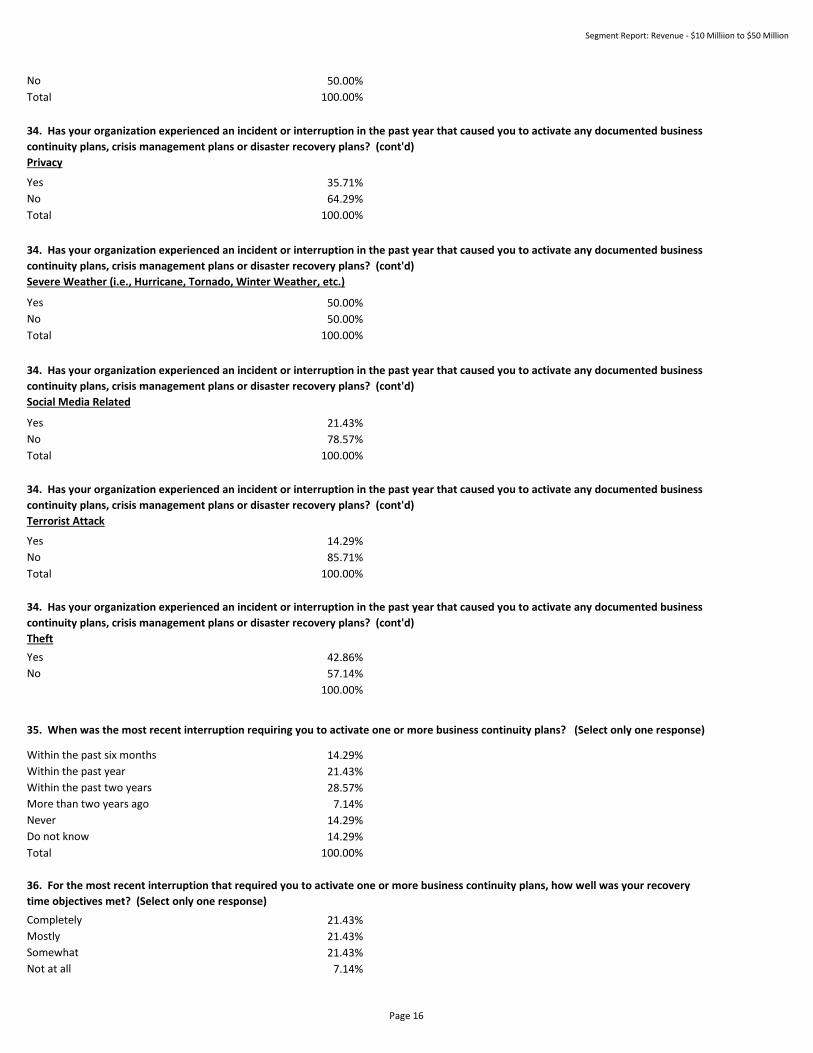
Power Outage
34. Has your organization experienced an incident or interruption in the past year that caused you to activate any documented business
continuity plans, crisis management plans or disaster recovery plans? (cont'd)
IT Related - Upgrade/Scheduled Outage
34. Has your organization experienced an incident or interruption in the past year that caused you to activate any documented business
continuity plans, crisis management plans or disaster recovery plans? (cont'd)
Flood
34. Has your organization experienced an incident or interruption in the past year that caused you to activate any documented business
continuity plans, crisis management plans or disaster recovery plans? (cont'd)
Indirectly Due to Supplier Issues or High Profile Neighbor
34. Has your organization experienced an incident or interruption in the past year that caused you to activate any documented business
continuity plans, crisis management plans or disaster recovery plans? (cont'd)
IT Related - Change Management Issue, Data Corruption, Denial of Access, Virus, IT Security, etc.
34. Has your organization experienced an incident or interruption in the past year that caused you to activate any documented business
continuity plans, crisis management plans or disaster recovery plans? (cont'd)
IT Related - Hardware/Software in Production
34. Has your organization experienced an incident or interruption in the past year that caused you to activate any documented business
continuity plans, crisis management plans or disaster recovery plans? (cont'd)
IT Related - Telecommunications (i.e., Voice, Data, Converged, etc.)
34. Has your organization experienced an incident or interruption in the past year that caused you to activate any documented business
continuity plans, crisis management plans or disaster recovery plans? (cont'd)
IT Related - Third Party Service Provider in Production (Hosted Solution)
Page 15
Segment Report: Revenue - $10 Milliion to $50 Million
No 50.00%
Total 100.00%
Yes 35.71%
No 64.29%
Total 100.00%
Yes 50.00%
No 50.00%
Total 100.00%
Yes 21.43%
No 78.57%
Total 100.00%
Yes 14.29%
No 85.71%
Total 100.00%
Yes 42.86%
No 57.14%
100.00%
Within the past six months 14.29%
Within the past year 21.43%
Within the past two years 28.57%
More than two years ago 7.14%
Never 14.29%
Do not know 14.29%
Total 100.00%
Completely 21.43%
Mostly 21.43%
Somewhat 21.43%
Not at all 7.14%
34. Has your organization experienced an incident or interruption in the past year that caused you to activate any documented business
continuity plans, crisis management plans or disaster recovery plans? (cont'd)
Privacy
34. Has your organization experienced an incident or interruption in the past year that caused you to activate any documented business
continuity plans, crisis management plans or disaster recovery plans? (cont'd)
Severe Weather (i.e., Hurricane, Tornado, Winter Weather, etc.)
34. Has your organization experienced an incident or interruption in the past year that caused you to activate any documented business
continuity plans, crisis management plans or disaster recovery plans? (cont'd)
Social Media Related
34. Has your organization experienced an incident or interruption in the past year that caused you to activate any documented business
continuity plans, crisis management plans or disaster recovery plans? (cont'd)
Terrorist Attack
36. For the most recent interruption that required you to activate one or more business continuity plans, how well was your recovery
time objectives met? (Select only one response)
34. Has your organization experienced an incident or interruption in the past year that caused you to activate any documented business
continuity plans, crisis management plans or disaster recovery plans? (cont'd)
Theft
35. When was the most recent interruption requiring you to activate one or more business continuity plans? (Select only one response)
Page 16

Segment Report: Revenue - $10 Milliion to $50 Million
Do Not Know 28.57%
Total 100.00%
Within the past 6 months 57.14%
Within the past year 7.14%
Within the past 2 years 14.29%
2 years or more 0.00%
We do not exercise our plans 21.43%
Other (Please specify) 0.00%
Do not know 0.00%
Total 100.00%
< 1% 21.43%
1% to < 2% 7.14%
2% to < 4% 28.57%
4% to < 10% 21.43%
10% or more 7.14%
Do Not Know 14.29%
100.00%
There is no BYOD Program in place and the
organization has no plans to establish one 42.86%
We are currently in the process of establishing a BYOD
Program in the next year14.29%
We have established a BYOD Program that includes
some implementation issues that we are addressing at
this time 7.14%
We have successfully established a BYOD Program that
includes smartphones only 7.14%
We have successfully established a BYOD Program that
currently includes smartphones with plans to include
laptops and/or tablets14.29%
We have successfully established a BYOD Program that
includes laptops, tablets and smartphones14.29%
Total 100.00%
Yes, included in current plans 42.86%
No, not included in current plans 21.43%
Plans to address in the future 21.43%
No plans to address it at this time 14.29%
Total 100.00%
In response to business changes 0.00%
41. How frequently does your organization carry out full scenario testing of its disaster recovery plan involving relevant people,
processes and technologies? (Select only one response)
40. Has your organization addressed cyber terrorism in your Business Continuity Management Program and related Business Continuity
Plans, Disaster Recovery Plans, and/or Crisis Management Plans? (Select only one response)
39. Which statement best describes the status of your organization’s "bring your own device" (BYOD) program? (Select only one
response)
37, When was the most recent Business Continuity Plan exercise? (Select only one response)
38. What percentage of your Information Technology budget does your organization spend on disaster recovery capabilities? (Select
only one response)
Page 17
Segment Report: Revenue - $10 Milliion to $50 Million
Semi-annually 7.14%
Annually 35.71%
Every two years 14.29%
Every three years 21.43%
Never 14.29%
Do not know 7.14%
Other 0.00%
Total 100.00%
Internal – Hardware and Software Solution 25.00%
External – Hardware and Software Solution 18.75%
Combination/Hybrid of Internal and External Solutions37.50%
Move certain capabilities to a Public Cloud Vendor6.25%
Move certain capabilities to a Private Cloud Solution6.25%
Other (Please specify) 6.25%
None 0.00%
Total 100.00%
BaaS Strategies (Backup as a Service) 21.05%
DRaaS Strategies (Disaster Recovery as a Service)10.53%
IaaS Strategies (Infrastructure as a Service) 5.26%
NaaS Strategies (Network as a Service) 10.53%
PaaS Strategies (Platform as a Service) 5.26%
RaaS Strategies (Recovery as a Service) 10.53%
SaaS Strategies (Software as a Service) 5.26%
Do Not Know 31.58%
Total 100.00%
None 21.43%
< 10% 7.14%
10% to < 25% 14.29%
25% to < 50% 0.00%
50% to < 75% 7.14%
75% or more 14.29%
Do not know 35.71%
Total 100.00%
Within the past six months 28.57%
Within the last year 21.43%
Within the last two years 0.00%
More than two years ago 0.00%
Never 7.14%
Do not know 42.86%
Total 100.00%
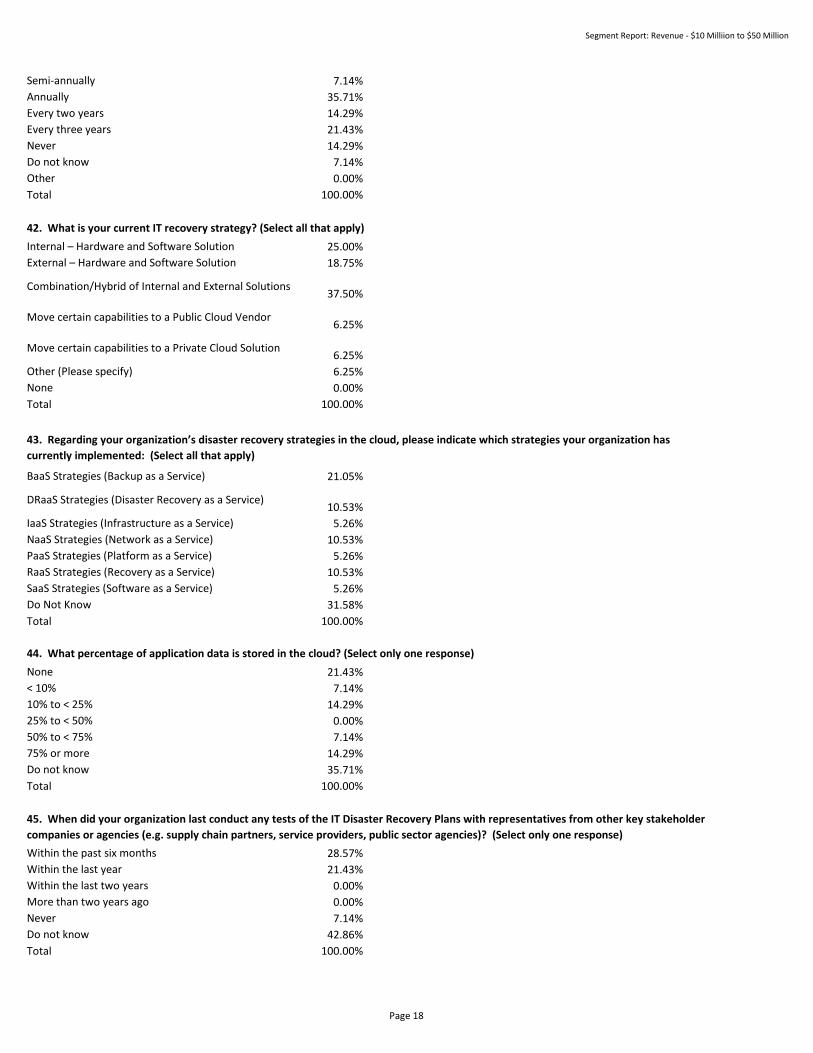
42. What is your current IT recovery strategy? (Select all that apply)
43. Regarding your organization’s disaster recovery strategies in the cloud, please indicate which strategies your organization has
currently implemented: (Select all that apply)
44. What percentage of application data is stored in the cloud? (Select only one response)
45. When did your organization last conduct any tests of the IT Disaster Recovery Plans with representatives from other key stakeholder
companies or agencies (e.g. supply chain partners, service providers, public sector agencies)? (Select only one response)
Page 18

Segment Report: Revenue - $10 Milliion to $50 Million
Bring Your Own Device 14.71%
Cloud applications 8.82%
Mobile applications 20.59%
Supply Chain Dependencies 8.82%
All of the above 11.76%
None of the above 11.76%
Cyber Attacks 11.76%
Social media 11.76%
100.00%
Attend industry conferences 25.00%
Attend association meetings 9.38%
Attend continuing education courses at
colleges/universities 12.50%
Attend internal company training 21.88%
Attend training provided by third-party companies9.38%
Pursue professional certification course 12.50%
Undergraduate degree program 0.00%
Graduate degree program 3.13%
None 6.25%
Other: (Please specify) 0.00%
Total 100.00%
46. For which of the following capabilities does your Disaster Recovery plan have documented procedures and written guidelines?
(Select all that apply)?
47. What types of ongoing business continuity management training have your organization’s employees utilized? (Select all that apply)
Page 19