Embed Size (px)
Citation preview
R-matrix calculations along iso-electronic
sequences
Michael Witthoeft, Allan Whiteford, Nigel BadnellUniversity of Strathclyde
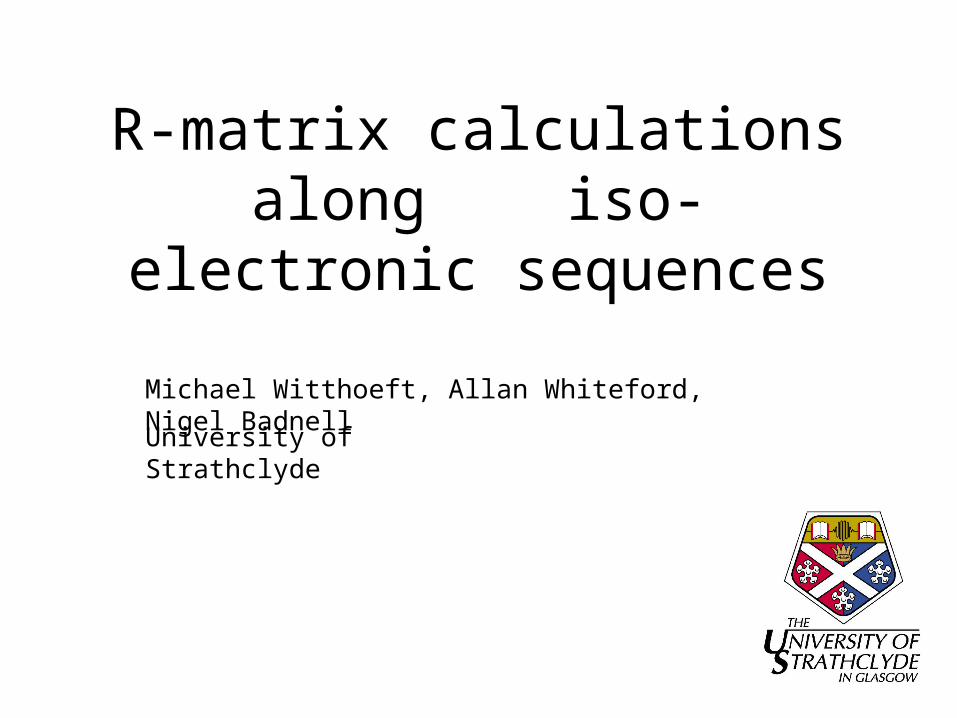
Introduction
Robust suite of R-matrix codes (LS, ICFT, Breit-Pauli, Dirac)
Increased availability of parallel computers
+
Ability to efficiently calculate collision strengths along an iso-electronic sequence
Need:
• an easier way to run an R-matrix calculation
• to be able to quickly analyze the large amount of data
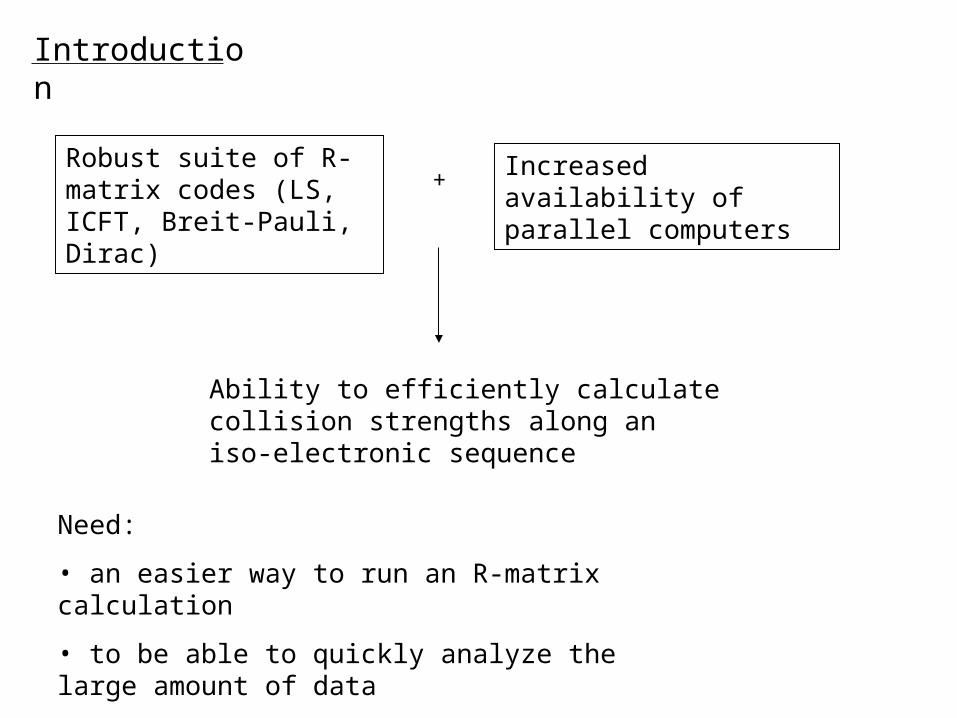
• A flexible Perl script to automate an R-matrix calculation
• works for serial or parallel machines
• calculation sequence:
• AUTOSCTRUCTURE (structure and high-energy limit points)
• ICFT R-matrix calculation
• produce adf04 file (fully commented)
• supports radiation damping
• no Auger damping yet
R-matrix Script
RAP base package:
• a set of Python routines that read and manipulate the R-matrix results
• reads in:
• adf04 files
• AUTOSTRUCTURE output files (GF values)
• TCCDW.DAT files (term coupling coefficients)
RAP GUI:
• Graphical interface to the routines in the base package
• Produce data files and plots of energies and effective collision strengths
R-matrix Analysis Package (RAP)
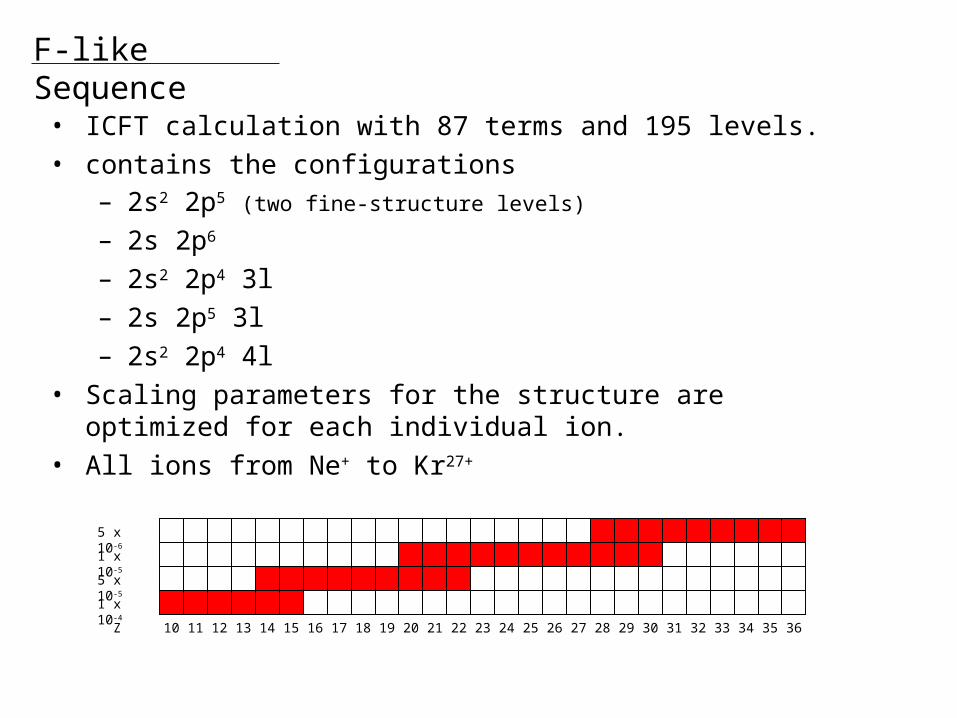
• ICFT calculation with 87 terms and 195 levels.• contains the configurations
– 2s2 2p5 (two fine-structure levels)
– 2s 2p6
– 2s2 2p4 3l– 2s 2p5 3l– 2s2 2p4 4l
• Scaling parameters for the structure are optimized for each individual ion.
• All ions from Ne+ to Kr27+
F-like Sequence
10 11 12 13 14 15 16 17 18 19 20 21 22 23 24 25 26 27 28 29 3630 31 32 33 34 35Z
1 x 10⁻⁴
5 x 10⁻⁵
1 x 10⁻⁵
5 x 10⁻⁶

Structure
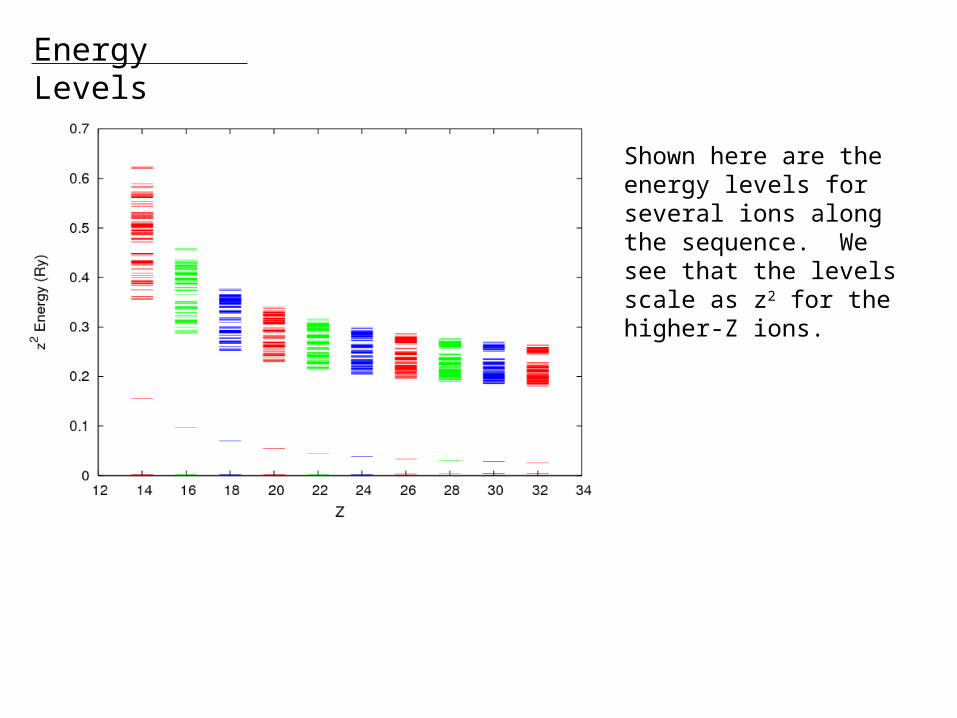
Energy Levels
Shown here are the energy levels for several ions along the sequence. We see that the levels scale as z2 for the higher-Z ions.
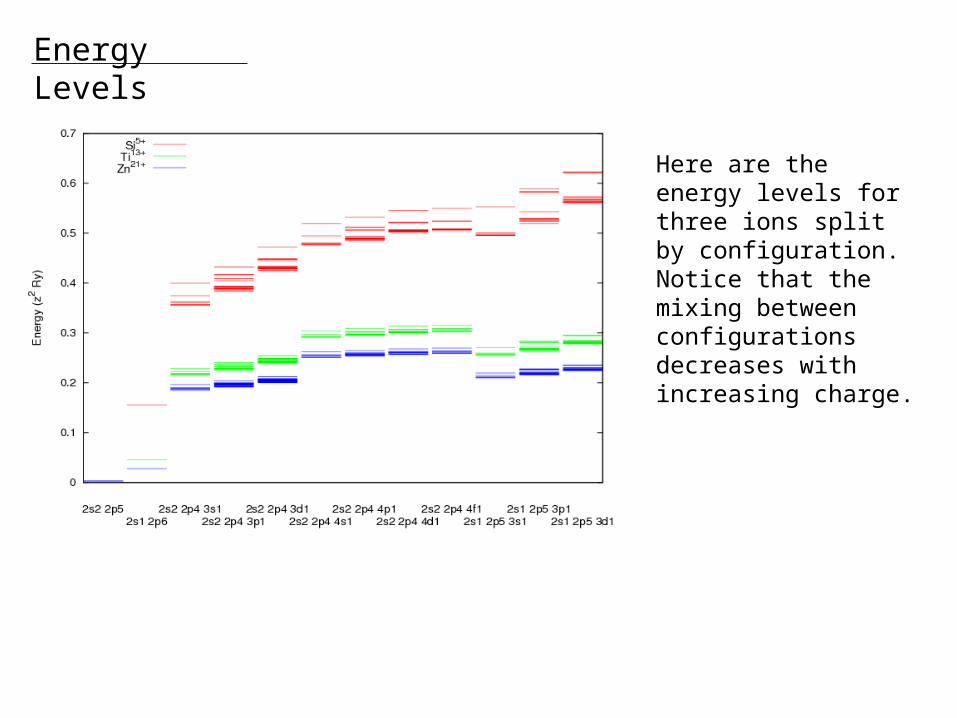
Energy Levels
Here are the energy levels for three ions split by configuration. Notice that the mixing between configurations decreases with increasing charge.
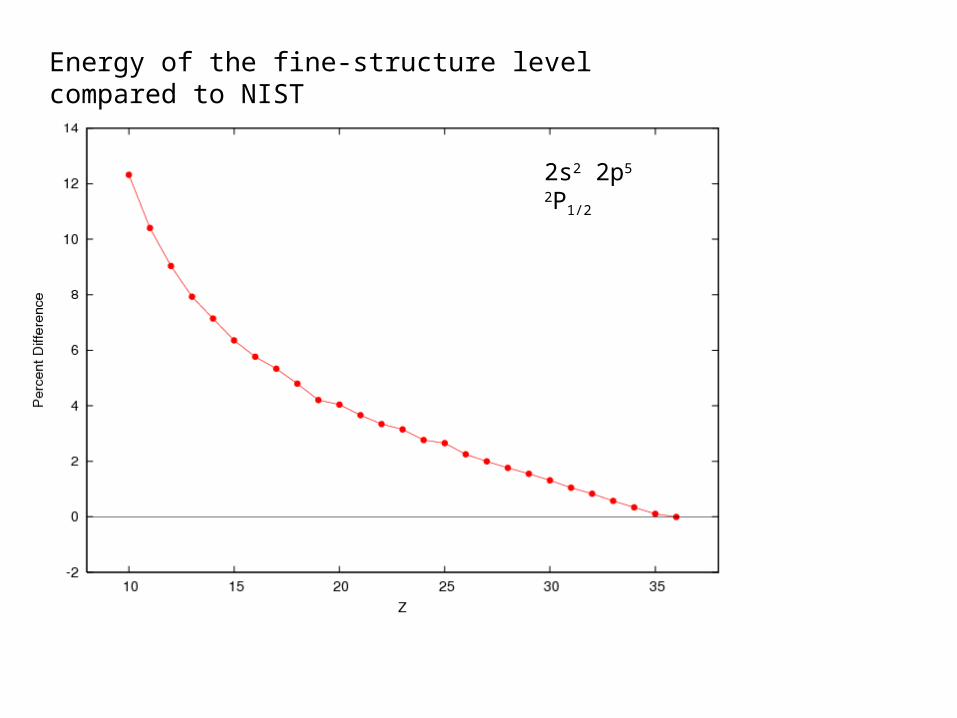
Energy of the fine-structure level compared to NIST
2s2 2p5 2P1/2
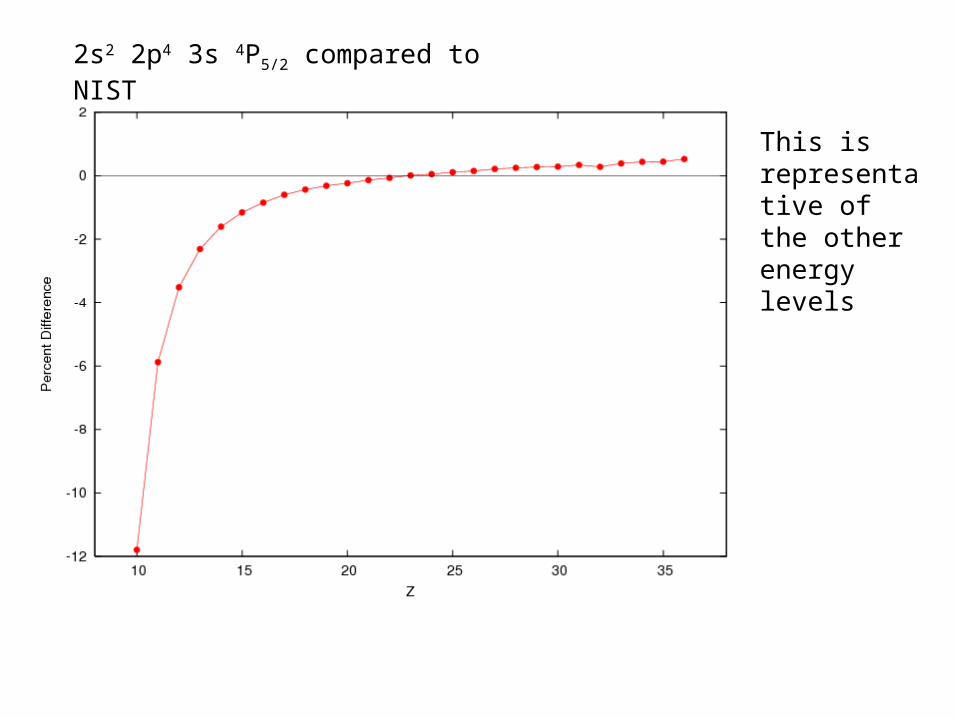
2s2 2p4 3s 4P5/2 compared to NIST
This is representative of the other energy levels
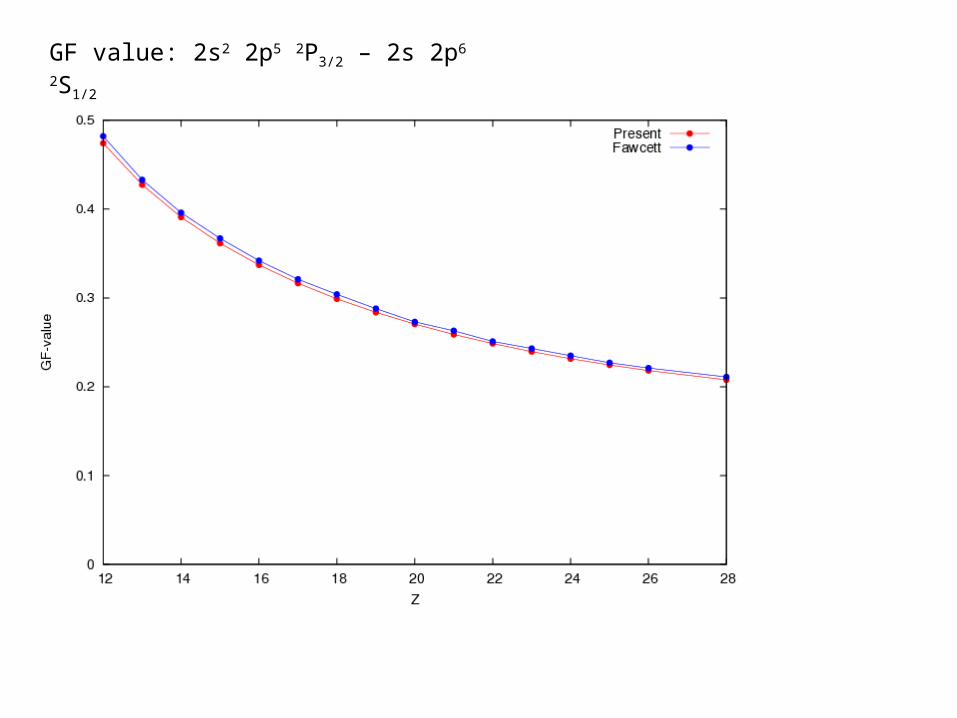
GF value: 2s2 2p5 2P3/2 – 2s 2p6 2S1/2
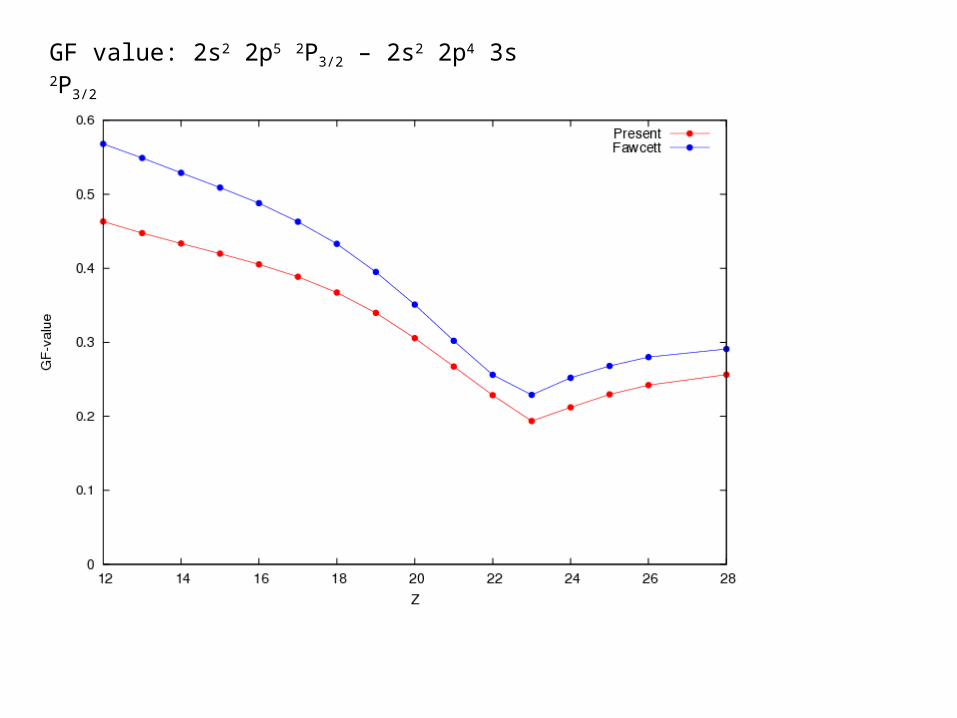
GF value: 2s2 2p5 2P3/2 – 2s2 2p4 3s 2P3/2
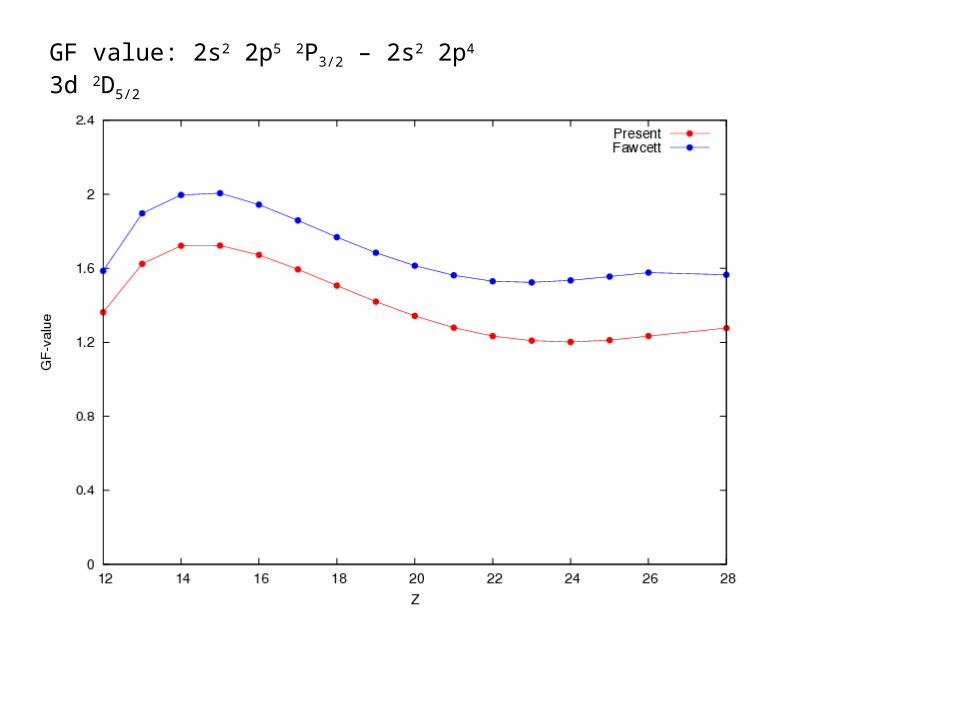
GF value: 2s2 2p5 2P3/2 – 2s2 2p4 3d 2D5/2
Resonance Resolution
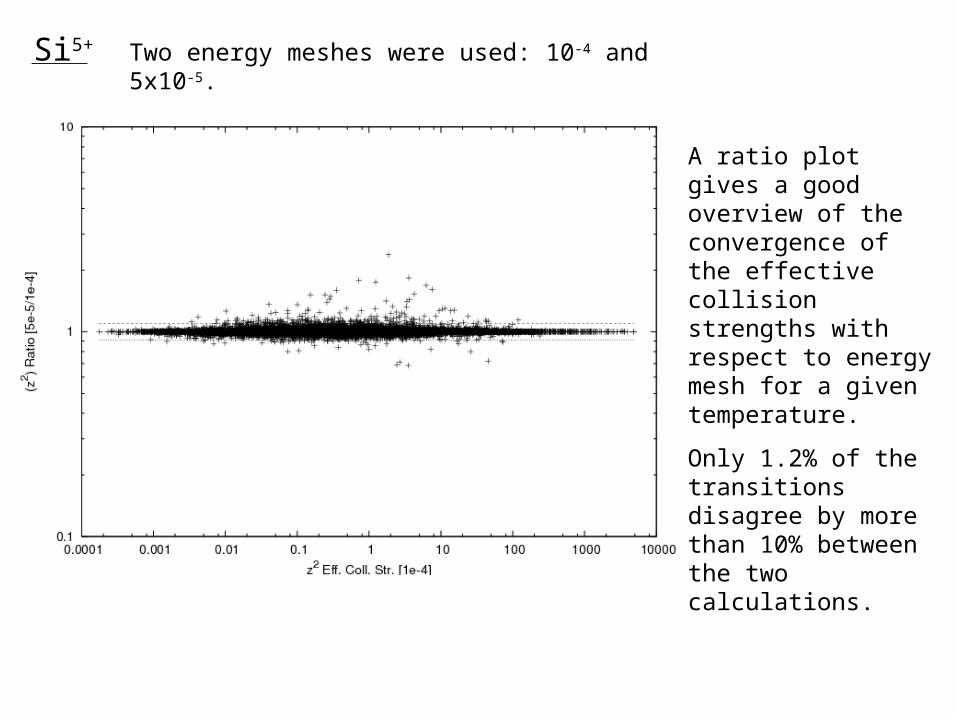
Si5+ Two energy meshes were used: 10-4 and 5x10⁻⁵.
A ratio plot gives a good overview of the convergence of the effective collision strengths with respect to energy mesh for a given temperature.
Only 1.2% of the transitions disagree by more than 10% between the two calculations.
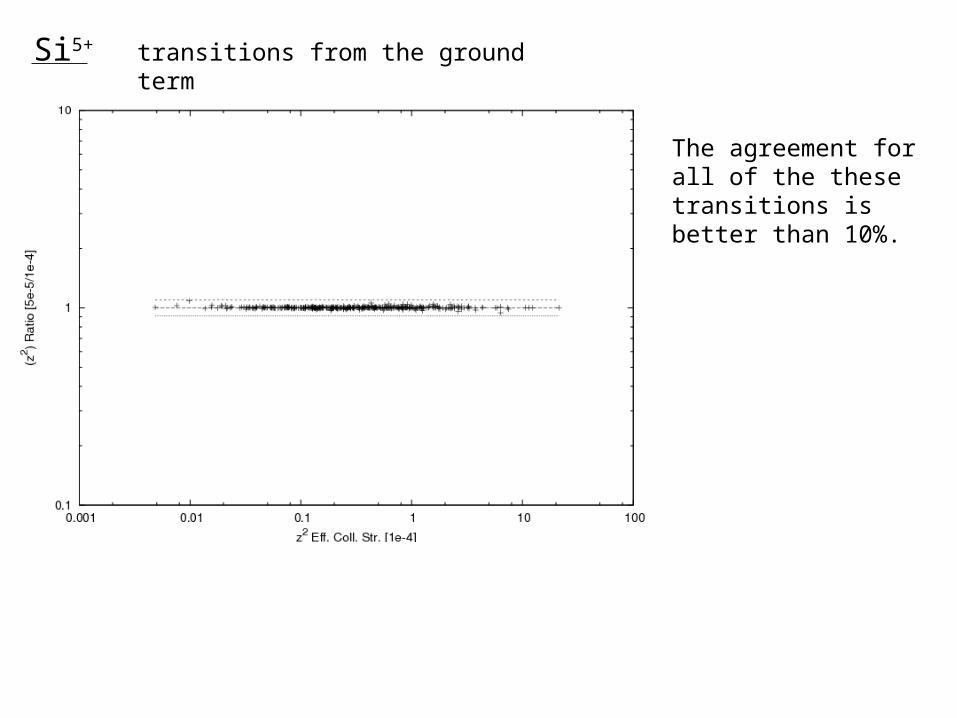
Si5+ transitions from the ground term
The agreement for all of the these transitions is better than 10%.
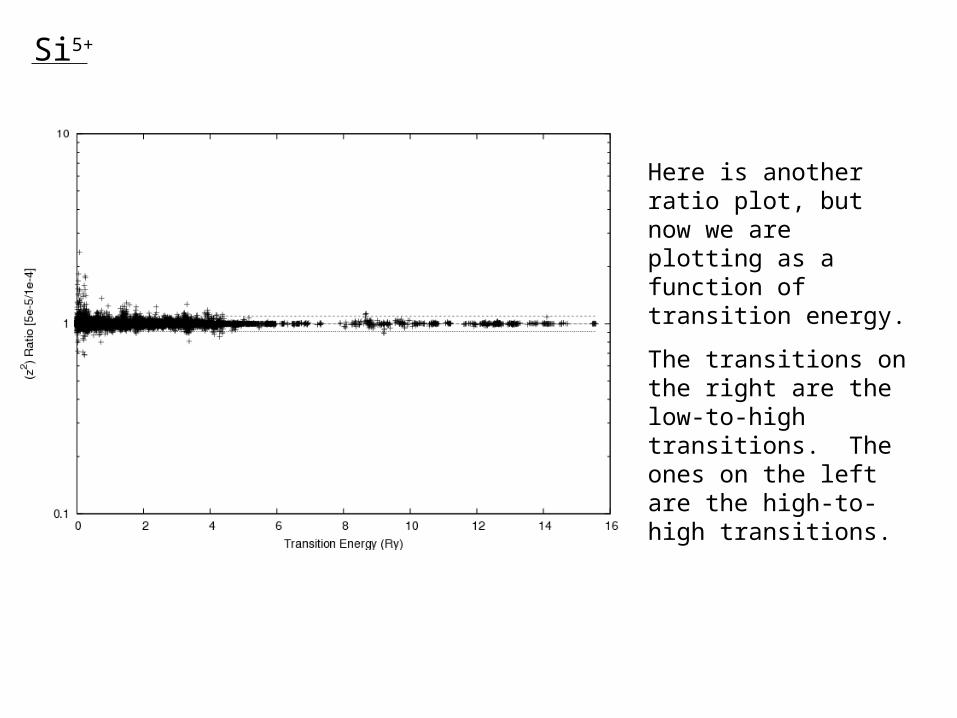
Si5+
Here is another ratio plot, but now we are plotting as a function of transition energy.
The transitions on the right are the low-to-high transitions. The ones on the left are the high-to-high transitions.
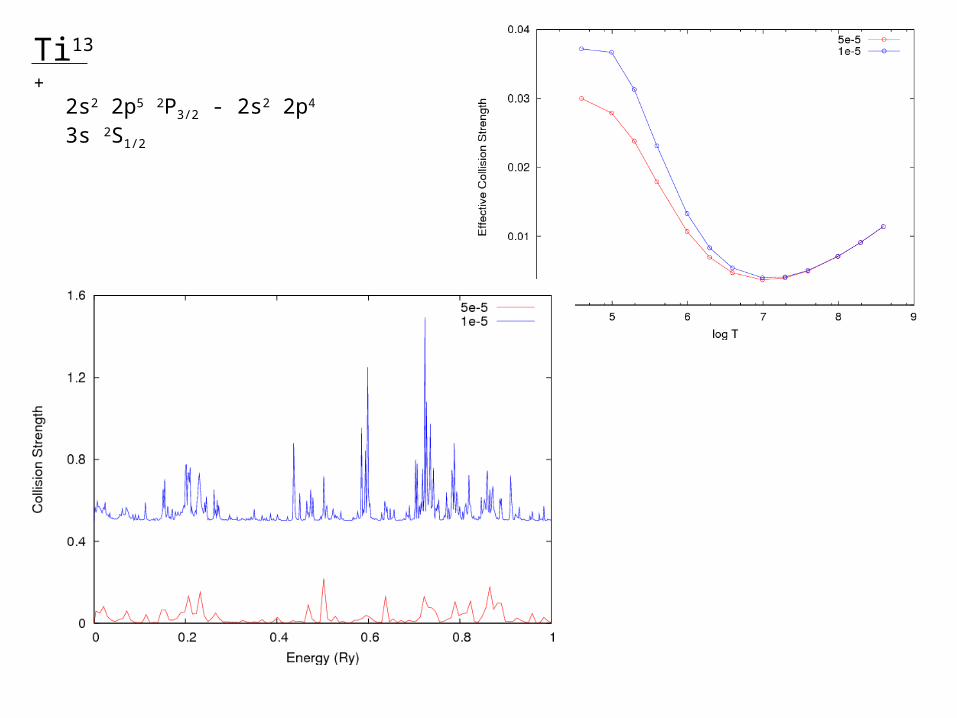
Ti13
+2s2 2p5 2P3/2 - 2s2 2p4 3s 2S1/2

Comparisons
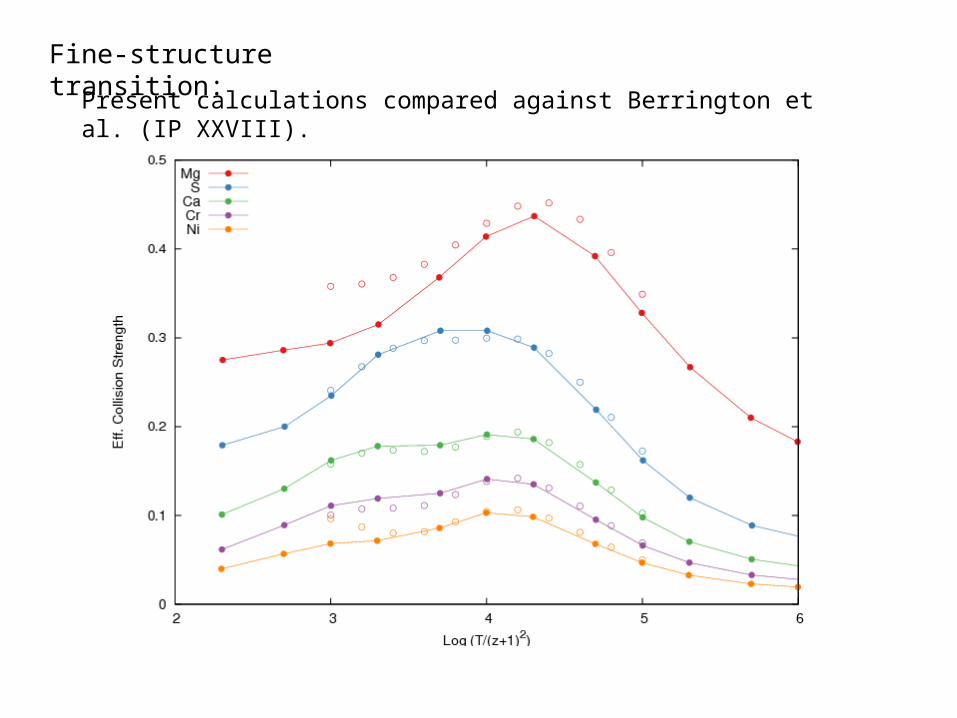
Present calculations compared against Berrington et al. (IP XXVIII).
Fine-structure transition:
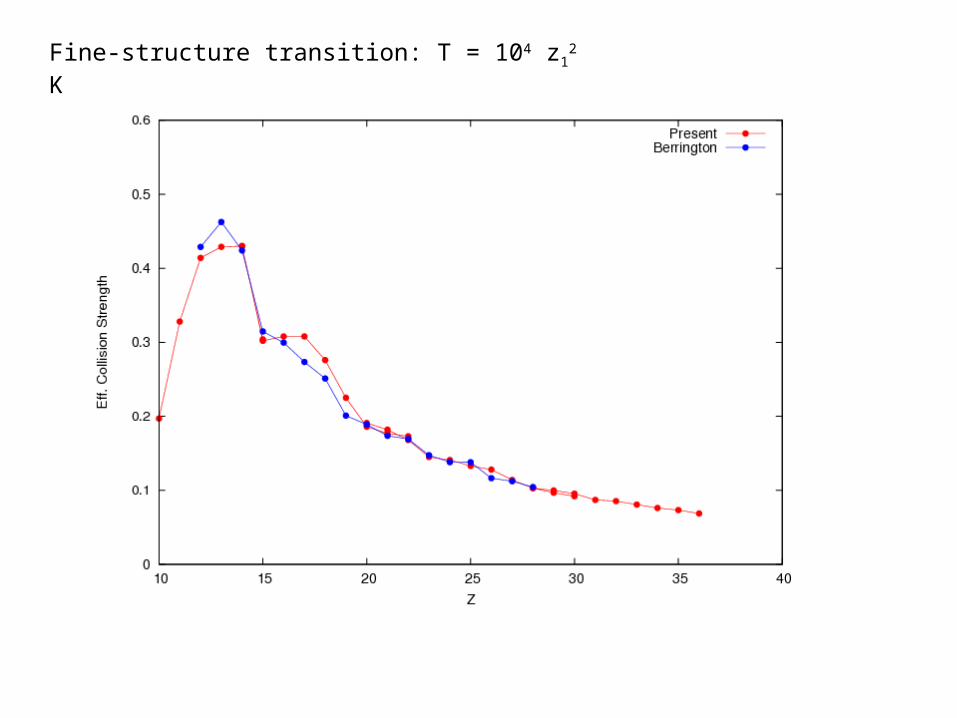
Fine-structure transition: T = 104 z12 K
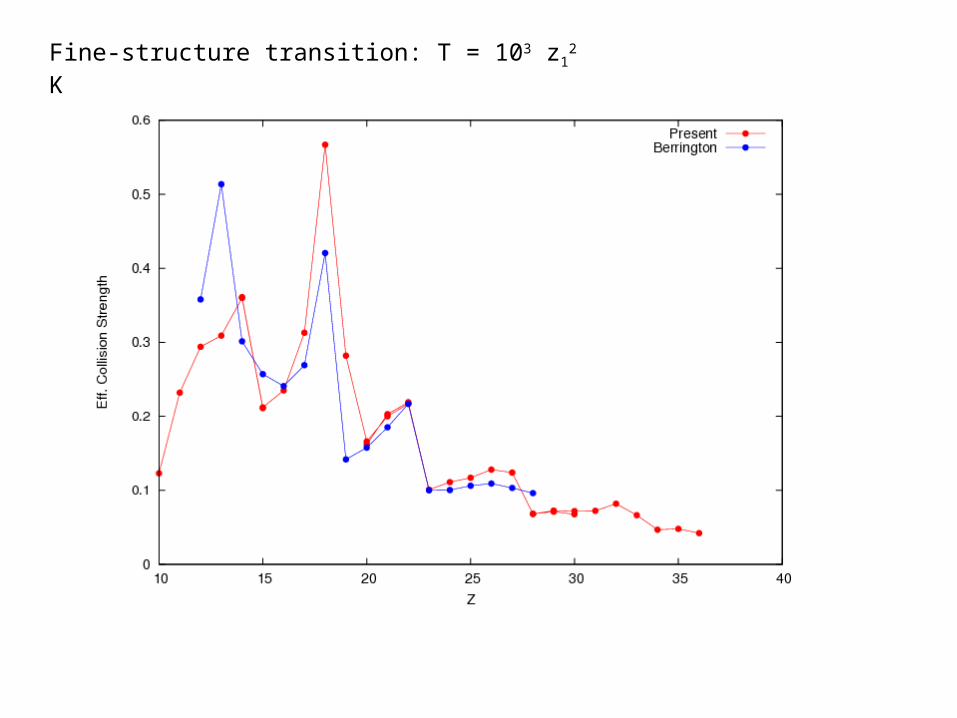
Fine-structure transition: T = 103 z12 K
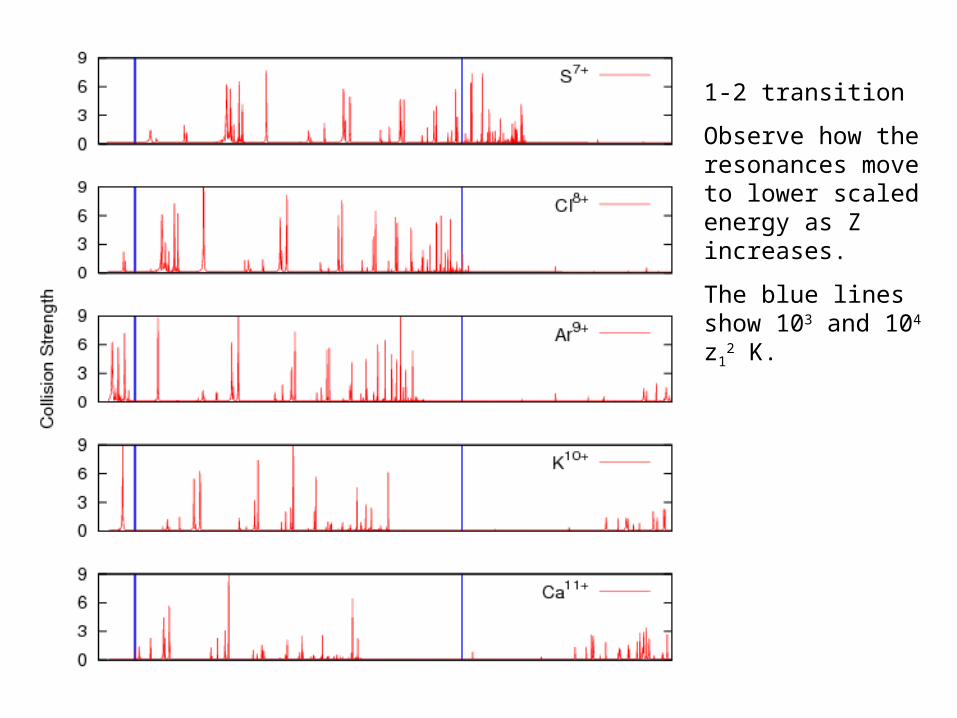
1-2 transition
Observe how the resonances move to lower scaled energy as Z increases.
The blue lines show 103 and 104 z1
2 K.
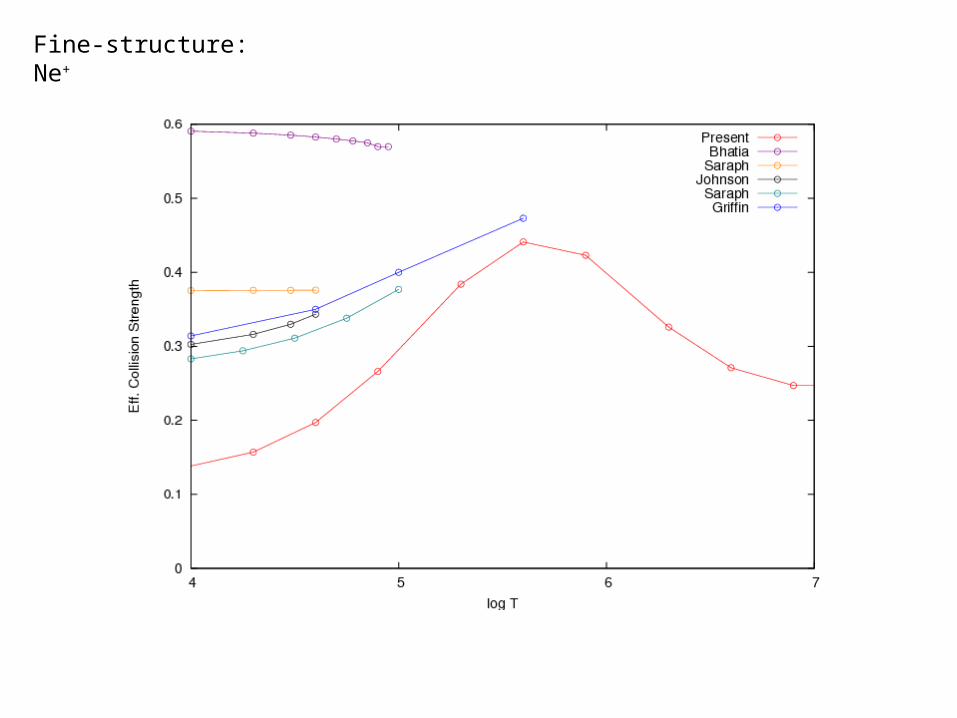
Fine-structure: Ne+
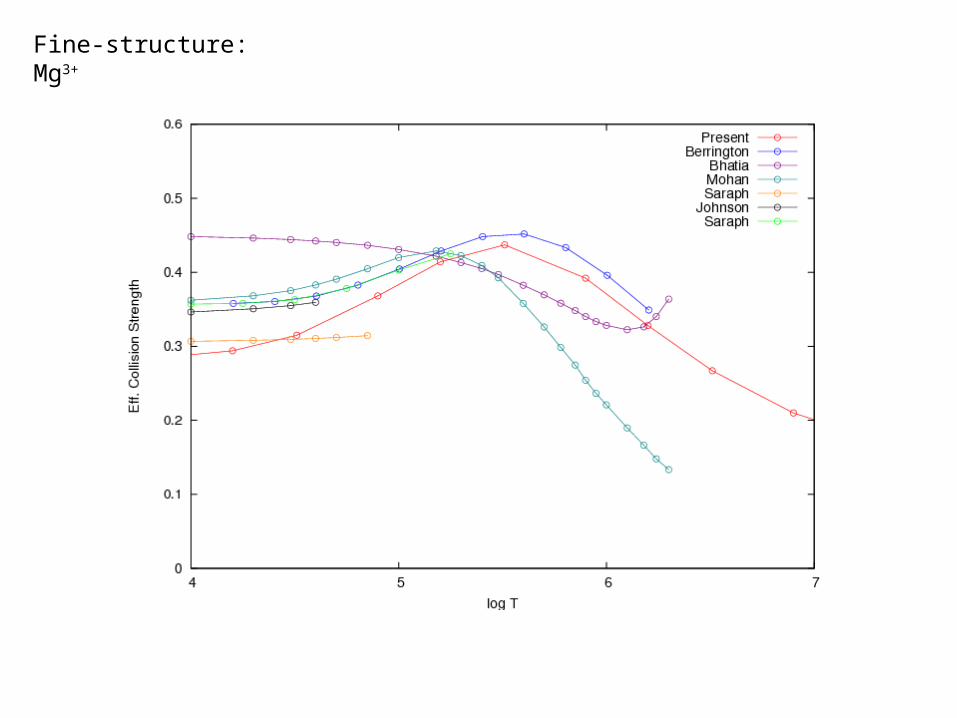
Fine-structure: Mg3+
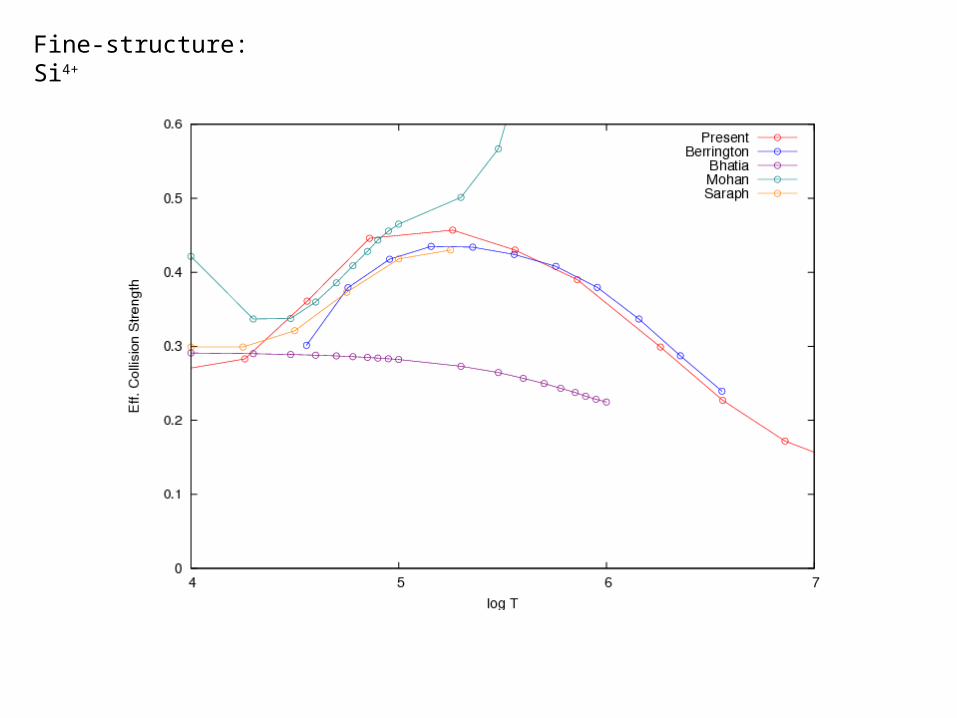
Fine-structure: Si4+
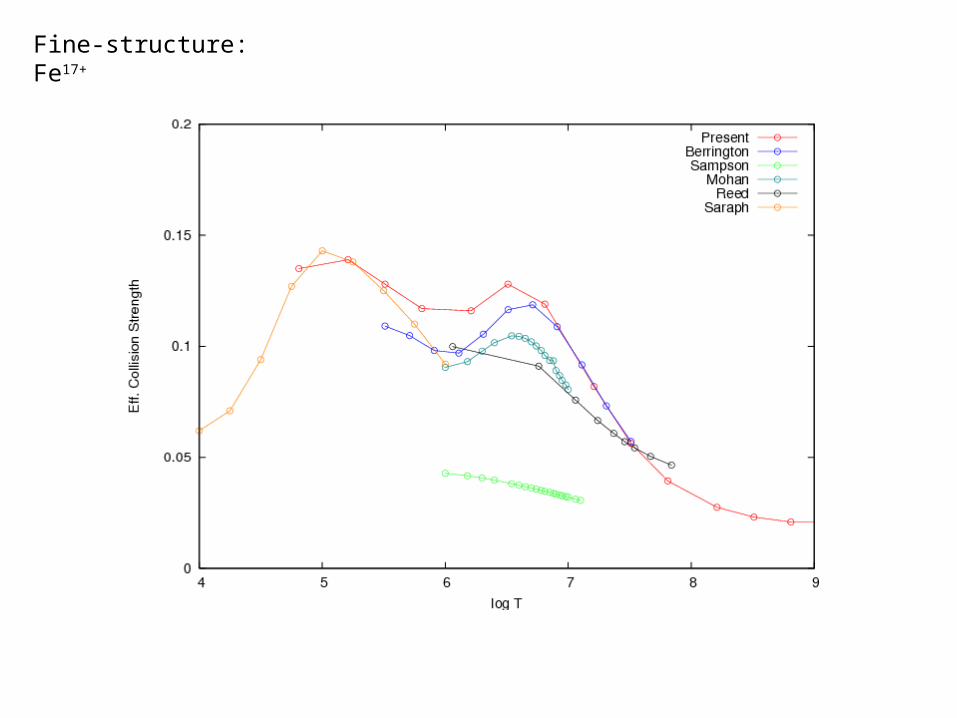
Fine-structure: Fe17+
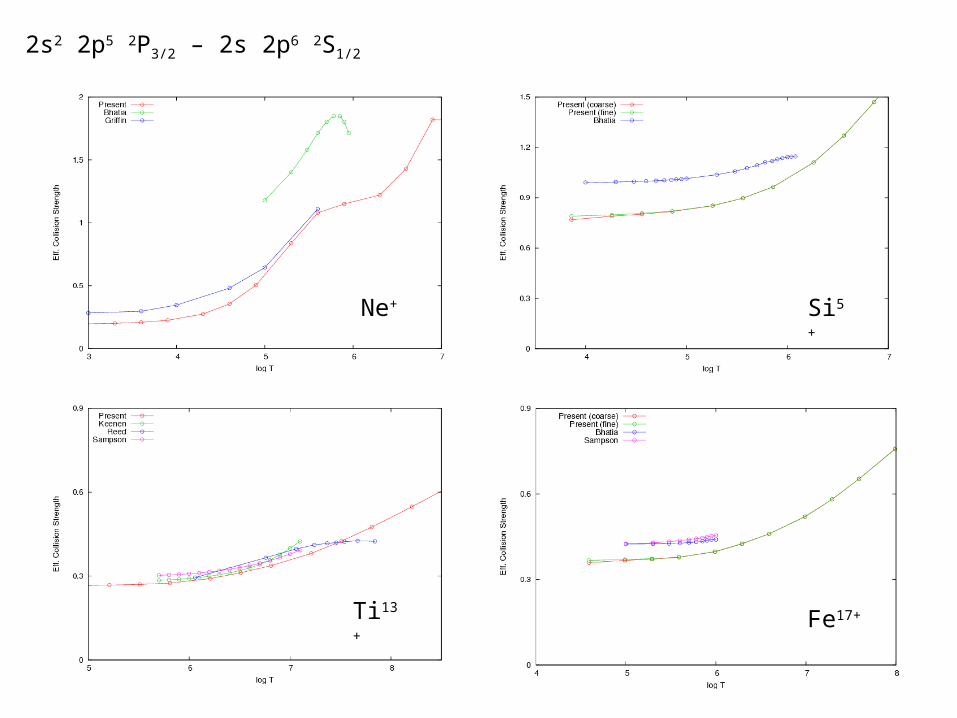
2s2 2p5 2P3/2 – 2s 2p6 2S1/2
Ne+ Si5+
Ti13+Fe17+
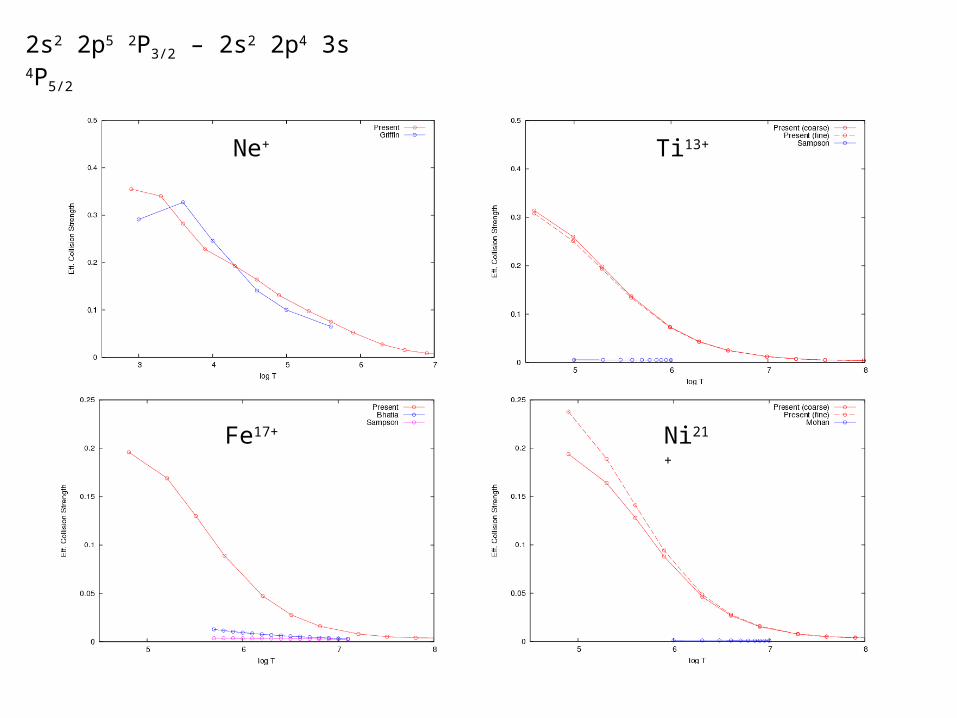
2s2 2p5 2P3/2 – 2s2 2p4 3s 4P5/2
Ne+ Ti13+
Ni21+Fe17+
Conclusions
• Complete F-like sequence has been calculated
• Ne, Na, and Mg will be recalculated using observed energies
• Sequences in progress: H-, He-, and Li-like (using radiation damping)
• Next sequences will be the Ne- and Na-like


![International Experience at Strathclyde - mabbett.eu · Spring 2013 - Issue 09] Caption Strathclyde Students Triumph Again at Talent Discovery Event [Strathclyde Students Triumph](https://img.pdfslide.us/doc/110x75/5e1039f32863e50a3d68e760/international-experience-at-strathclyde-spring-2013-issue-09-caption-strathclyde.jpg)