Embed Size (px)
Citation preview

. ' ' ] " : , ,
", , ' . . • .
. , . . . . : . 7 ~ : ', ' . :
ii !i
"' ' -'" -:i" , ? 7
: ~ -
7 . •
: " '
4
. ' , . r
: , . M I N I S T R Y O F S U P P L Y i . ' L ' , ' . , [ ' ' , - . ' . , , ' "
k
. . . . . . .' ", : A E R O N A U T I C A L . R E S E A R C H . C O U N C I L
- R E P O R T S A N D M E M O R A N D A • r ' , , '
i - -
. . , . . ' . , . .
E x p e r i m e n t s on , ..~ ~ .in-~Shear~ Flow
' ' B,v-
: : F . A . MACMILLAN
k
, , i :~ .':'.'~ , , . . . . , , ' , . , , ,
i."!i ' ' • . ' " r r
i , r " : r '
i : ! [ - : - : . . . . . . . : "
Pitot-TUbes:
c,o,,,,; c,,migl, t ~S,,, , ,a
.. . , .
L O N D O N " H E R M A J E S T Y , i S S T A T I O N E R Y O F F I C E
• J:' 1 9 5 7
F O U R SHILLI-NGS N E T / / i
' i
R , & M . No. 3028 0s,235)
A.R.C. Tedmical Report
, (

Experiments on Pitot-Tubes By
F. A. MACMILLAN
in Shear Flow
COMMUNICATED BY THE DIRECTOR-GENERAL OF SCIENTIFIC RESEARCH (AIR),
MINISTRY OF SUPPLY
Reports and Memoranda No. 3 o2 8
February, 19 5 6
Summary. When a pitot-tube is used in a pipe or boundary layer, the shear and the presence of the wall may cause the pressure in the tube to differ from the true total pressure on the axis of the tube. To investigate these effects, measurements were made in a pipe of circular section, with turbulent flow, using pitot-tubes of different external diameter D. Some supporting experiments were also made in a turbulent boundary layer on a flat plate with zero pressure gradient.
It was found that the effect of the shear alone could be conveniently expressed as a displacement $1 of the ' effective centre' of the tube towards the region of higher velocity. The value of $I/D was found to be 0.15, independent of Reynolds number and velocity gradient,
When the tube is near the wall, an additional correction must be applied. If this is expressed as a correction u to the measured velocity U, it is found that u/U is independent of Reynolds number within the accuracy of these experiments.
Alternatively, the effects of the wall and the shear together can be expressed as a total displacement $ of the effective centre, but $/D then depends on Reynolds number and also on the ratio of distance from the wall to tube diameter.
1. Introductio~.--When a p i t o t - t u b e is used to m e a s u r e t h e ve loc i ty d i s t r ibu t ion in a pipe or b o u n d a r y layer , i t is n e c e s s a r y to cons ider in some de ta i l t he va r ious fac tors t h a t m a y effect t h e p ressure in t h e tube . F o r n o n - t u r b u l e n t subsonic flow, t h e to t a l p ressure a t a n y po in t m a y be def ined as t h e p ressure t h a t is a t t a i n e d w h e n t h e fluid pass ing t h r o u g h t h a t po in t is b r o u g h t to res t w i t h o u t a n y viscous diss ipat ion. I t is well k n o w n t h a t in u n i f o r m n o n - t u r b u l e n t flow the p ressure in a p i t o t - t u b e is a lmos t e x a c t l y equa l to tt{e t rue t o t a l pressure , p r o v i d e d the R e y n o l d s n u m b e r of t he p i t o t - t u b e is no t too small . W h e n the R e y n o l d s n u m b e r of t he p i t o t - t u b e is small , v i scos i ty has an i m p o r t a n t effect ; th is has b e e n i n v e s t i g a t e d in severa l l abora to r i es a n d the resul t s h a v e been s u m m a r i s e d in an ear l ier p a p e r b y the a u t h o r I.
If t h e flow is t u r b u l e n t , t h e p ressure in t h e p i t o t - t u b e is n o t e x a c t l y equa l to t h e t o t a l p ressure in a n o n - t u r b u l e n t s t r e a m w i t h t h e s a m e m e a n ve loc i ty a n d s ta t i c pressure . T h e effect of t u r b u l e n c e on the p ressure in a p i t o t - t u b e has b e e n cons ide red t h e o r e t i c a l l y b y G o l d s t e i n t
W h e n the p i t o t - t u b e is u sed in a pipe or b o u n d a r y layer , t he r e are add i t i ona l effects due to t h e shea r a n d the p resence of t h e wall, so t h a t even if t h e flow is l a m i n a r a n d the t u b e R e y n o l d s n u m b e r is high, t h e p ressure in t h e t u b e is in genera l n o t e x a c t l y equa l to t h e t r u e to t a l p ressure on t h e axis of t h e tube .

The present exper iments were made in a pipe and in a boundary layer with zero pressure gradient, bo th wi th turbulent flow, to invest igate the effects of shear and of the wall . The effects of turbulence and viscosity were not invest igated in the present exper iments ; these effects have been considered elsewhere for the case of zero shear.
Fig. 1 shows a port ion of a velocity profile for a boundary layer or pipe. The apparent velocity U, as measured by a pi tot - tube of external diameter D, is p lo t ted against y, the distance of tile geometric centre of the p i to t - tube from the wall. The true velocity profile is also included in Fig. 1. I t is clear tha t the discrepancy between the measured and true profiles can be considered ei ther as an error in velocity A U, or as an error 0 in y.
Young and Maas 3 showed that , in the absence of a wall, it was convenient to consider the discrepancy as an error in y, i.e., as a displacement ~ of the ' effective.centre ' of the p i to t - tube from the geometric centre. Their results showed that , provided d/D was approximately constant and P could be considered to vary l inearly across the mou th of the tube, ~/D was independent of D, P, and dP/@. For d/D = 0-60 they found tha t d/D = O. 18 and, more generally, for any value of d/D, d/D = 0.13 + 0.08 d/D.
All the present exper iments were made wi th pi tot- tubes having did = 0.60, the value used by Young and Maas for most of their work. The object of the exper iments was to determine the discrepancy be tween the measured and true velocity profiles (Fig. 1) in the presence of a wall, and to express this either as a displacement $ or as a correction to velocity. I t was expected that , at large distances from the wall, ~/D would tend to a value near the one found by Young and Maas.
2. Dimensional Analysis : Pitot-Tube in a [email protected] the flow of an incompressible fluid ill a smooth pipe, at a large distance from the entry, wi th the flow specified as ei ther laminar or turbulent . The true mean velocity U~ at a distance y from the wall can only depend on the five variables p, ~, y, r, U,, where r is the radius of the pipe and U~ is the ' friction velocity, ' defined by the relation : shear stress at wall = 30 ---- # U~ 2.
Thus if a p i to t - tube of specified shape and external d iameter D is placed at a distance y from the wall, the displacement 3 of the effective" centre can only depend on D, p,/~, y, r, U,.
D ' D ' ' • . . . . . . . . . . . . . . (1)
where v = ~/0,
or a l ternat ively
D . . . . . . . . . . . . . . . (2)
Except near the centre of the pipe, the ratio U/U, should be almost a unique function of U~y/v, so tha t y/r ma y b e omi t ted from equations (1) and (2). I t shouid be noted, however, t ha t the omission of r as an independent variable is only permissible if curvature and blockage effects are negligible, i.e., if D/r is small.
In analysing t h e exper imental results it was found to be convenient to introduce the pipe Reynolds number Rp = Ucr/v. Since U~/U~ depends only on Rp, equat ion (1) may be re-wri t ten for this purpose as :
'Note t h a t i t is not possible to omit y/r from this.equation.)
2 ,,

3. Description of Apparatus.--For the pipe experiments t h e apparatus was essentially the same as that used earlier by Preston 4. The test section consisted of a piece of smooth brass pipe 7 It 5 in. long, with an average internal diameter of 1. 996 in. The pressure drop along the pipe was measured over a 6-ft length of the test section, and a static hole opposite the mouth of the pitot-tube was used to measure the static pressure ~b. Air was sucked through the pipe by four small centrifugal fans~ arranged in parallel.
The entry to the test section consisted of 10 in. of roughened pipe and 14 ft 10 in. (89 diameters) of smooth pipe, all of 2-in. internal diameter. To make sure that fully developed turbulent flow had been attained in the test section, further measurements of velocity distribution were m a d e at the traverse station, with the entry length increased from 89 to 133 pipe diameters. No change in velocity distribution could be detected for any Reynolds number within the available range.
Further experiments were made with various types of disturbance at the pipe entry, but none of these alterations had any effect on the velocity distribution at the traverse station. (These experiments, to confirm that fully developed turbulent flow had been attained at the test section, were important because the local shear stress at the wall was obtained by measuring the average pressure drop over a 6-ft length of pipe).
For the boundary-layer experiments a smooth flat Duralumin plate was used, spanning the working section of a wind tunnel. The plate was 6 ft long and 28 in. wide and was roughened near the leading edge to promote transition. The pitot-tubes were traversed along a line through the centre of the plate, at a distance of 30 in. irom the leading edge. A static hole placed off the centre-line, at the same distance from the leading edge, measured the static pressure p.
In both the pipe and the boundary-layer experiments, the measurements of y were made by a traverse gear incorporating an ordinary micrometer screw, with springs to eliminate back- lash. The traverse gear was electrically insulated from the pipe or plate, so that an electrical contact method could be used to determine the reading of the micrometer when the pitot-tube was just touching the wall. The estimated error in y was no more than 2 X 10 -~ in.
The pitot-tubes were the same as those used in an earlier investigation by Preston ~.
The tubes were all of circular section, with plane-faced ends and did = 0.600 4-0-006. The external diameters of the five tubes were 0.0239, 0.0292, 0.0544, 0.0907 and 0. 1214 in. (These tubes will be referred to later as numbers 1, 2, 3, 4 and 5).
All the pressure measurements were made with manometers of the null-reading, inclined-tube type, with movable reservoirs. The sensitivity of each manometer could be altered by changing the slope of the inclined tube, as discussed in an earlier paper by the author 5. The range of pressure differences measured was from about 0.02 to 3 in. alcohol, and the estimated error in an individual manometer reading within this range was always less than 1 per cent.
4. Measurements a~d Analysis.--Measurements in the pipe were made at three rates of flow, giving three nearly constant values of Rp. (Small variations of air temperature and pressure: caused changes of v and p, and hence of R, for a given pressure drop. These variations of R~ were not large enough to have any significant effect). Values of the measured velocity U were corrected for the effect of compressibility and for the previously measured effect of the pitot-tube: on the pressure at the static hole. The values of U were also corrected for the effect of viscosity on the pressure in the pitot-tube, at zero shear and in the absence of a wall, using the ,esults obtained in earlier experiments by the author 1. Thus the derived values of the displacement do not include the effects of viscosity, except in so far as these are altered by shear and the presence of a wall.
3 At

Values of U~ were obtained from measurements of pressure drop along a 6-ft length of the test section, with a correction applied for the effect of the acceleration caused by compressibility. Since the highest air speed was only about 100 It/sec, this correction was very small and it was sufficiently accurate to base it on the mean velocity across a section, using a one-dimensional theory. The temperature and pressure used in computing U~y/~, for a given value of y, were the average values at the traverse station f0r each series of measurements.
A preliminary analysis of the pipe measurements was made by tile following method, essentially similar to tha t used by Young and Maas 3. I t will be shown later that this method cannot be expected to give the correct value of ~ near the wall (small y/D), but it can be used to determine the correction $/D for large values of y/D. The true velocity profile can then be derived, for a considerable range of y, by applying this correction to the results obtained from all the pitot-tubes for large y/D.
Values of U~ U~ were found for each pitot-tube at a fixed value of y. The pressure drop in the test section was kept constant, so that U,y/~, and Rp were nearly constant. (As already mentioned, variations of air temperature and pressure caused small changes of v and 0-) The values of U/U, obtained for this one value of y were then plotted against tube diameter D, and a straight line drawn through the points using the method of least squares. Fig. 2 shows the straight lines obtained in this way, for a range of values of y, at one value of Rp. Similar sets of straight lines were obtained at two lower values of Rp.
A second series of measurements was obtained using a slightly different procedure ; the pipe was traversed with each pitot-tube in turn, and values of U/U, at specified vMues of y were obtained by cross-plotting.
In Fig. 2, let U0 be the value of U obtained by l inear extrapolation to D = 0. If U/U, were strictly a linear function of D, then U0 would be equal to the true velocity U~. I t can be shown, however, that this is not the case unless ~/D is independent of y/D. For if U/U~ varies linearly with D, for constant y and U,, U = Uo + ~D, where $ is independent of D. Put t ing AU= U--U~= U--Uo, Fig. 1 shows that AU/O=dU~/dy (if AU is small), and this is independent of D. Thus d/D = (zl U/D)(d/A U) =/3/(dU~/dy), and this is also independent of D .
Thus if a linear relationship between U/U, and D is assumed in analysing the experimental results, no dependence of the apparent displacement 30 on y/D can be found. In regions where the true displacement is dependent on y/D it may be expected that the values obtained for ,~0 will be misleading.
Notwithstanding this difficulty, useful results were obtained from the linear extrapolation by proceeding as if the velocity U0 were equal to the true velocity U~. T h e values of Uo/U~, found by extrapolation to D = 0 for different values of y, were plotted against U,y/~, at a constant value of R,. Values of U~ U, for an arbitrarily chosen value of y/D were then obtained from the straight lines as shown in Fig. 2, and plotted against U,y/~, on the same g raph as the Uo/U~ curve. Regarding U0 as the ' true ' velocity, .the apparent displacement ~0 could be found from the distance between the two curves.
If the process had been repeated for another arbitrarily chosen value of y/D, the derived values of Oo/D would have been exactly the same, because the method of analysis necessarily implies tha t ~o/D is independent of y/D. This analysis was completed for the three values Of R~, and after smoothing the results and plotting Oo/D against y/r the set of curves shown in Fig. 3 was obtained. In deriving these smooth curves, u se was also made of the second series of measurements.
I t is now necessary to consider the effect of the linear extrapolation, and the way in which the apparent displacement d0 may differ from the true displacement d. The experiments of Young and Maas suggest that in the absence of a wall ~/D should be constant, i.e., indepenclent
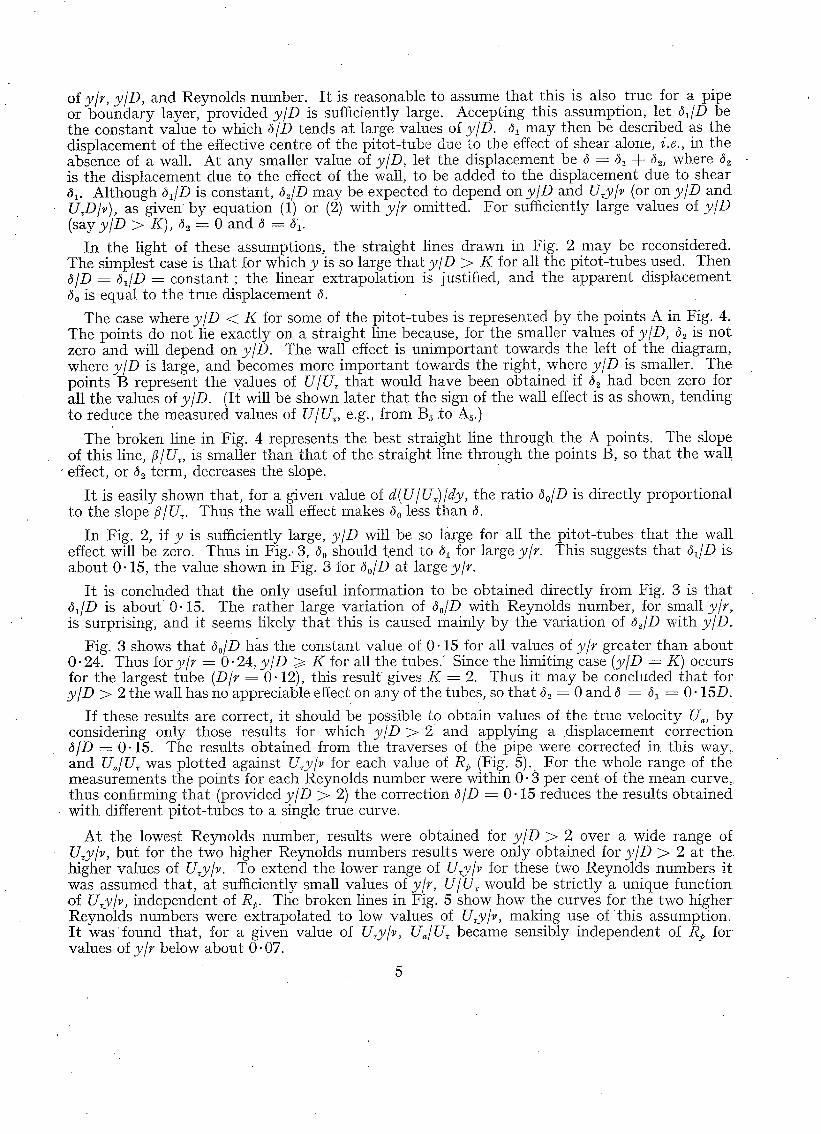
of y[r, y/D, and Reynolds number. It is reasonable to assume that this is also true for a pipe or boundary layer, provided y/D is sufficiently large. Accepting this assumption, let dl/D be the constant value to which O/D tends at large values of y/D. ~ may then be described as the displacement of the effective centre of the pitot-tube due to the effect of shear alone, i.e., in the absence of a wall. At any smaller value of y/D, let the displacement be ~ = b~ + d2, where d~ is the displacement due to tile effect of the wall, to be added to the displacement due to shear al. Although a~/D is constant, ~/D may be expected to depend on y/D and U~y/v (or on y/D and U,D/v), as given by equation (1) or (2) with y/r omitted. For sufficiently large values of y/D (say y/D > K), ~ = 0 and ~ = di.
In the light of these assumptions, the straight lines drawn in Fig. 2 may be reconsidered. The simplest case is that for which y is so large that y/D > K for all the pitot-tubes used. Then O/D = ~I/D = constant ; the linear extrapolation is justified, and the apparent displacement ~0 is equal to the true displacement ~.
The case where y/D < K for some of the pitot-tubes is represented by the points A in Fig. 4. Tile points do not lie exactly on a straight line because, for the smaller values of y/D, ~ is not zero and will depend on y/D. The wall effect is unimportant towards the left of the diagram, where y/D is large, and becomes more important towards the right, where y/D is smaller. The points B represent the values of U/U~ t ha t would have been obtained if d, had been zero for all the values of y/D. (It will be shown later that the sign of the wall effect is as shown, tending to reduce the measured values of U/U,, e.g., from B5 .to As.)
The broken line in F i g : 4 represents the best straight line through the A points. The slope of this line, ~/U~, is smaller than that of the straight line through the points B, so that the wa r effect, or ~ term, decreases the slope.
It is easily shown that, for a given value of d(U/U~)/dy, the ratio ~o/D is directly proportionaI to the slope ~/U~. Thus the wall effect makes d0 less than ~.
In Fig. 2, if y is sufficiently large, y/D will be so large for all the pitot-tubes that the wall effect will be zero. Thus in Fig.. 3, d0 should tend to d~ for large y/f. This suggests that ~/D is about 0" 15, the value shown in Fig. 3 for ~o/D at large y/r.
It is concluded that the only useful information to be obtained directly from Fig. 3 is that dJD is about 0.15. The rather large variation of ~o/D with Reynolds number, for small y/r, is surprising, and it seems likely that this is caused mainly by the variation of ~,/D with y/D.
Fig. 3 shows that $o/D has the constant value of 0.15 for all values of y/r greater than about 0" 24. Thus for y/,* = 0.24, y/D >~ K for all the tubes." Since the limiting case (y/D = K) occurs for the largest tube (D/r = 0.12), this result gives K = 2. Thus it may be concluded that for y/D > 2 the wall has no appreciable effect on any of the tubes, so that ~ = 0 and ~ = $~ = 0.15D.
If these results are correct, it should be possible to obtain values of the true velocity U~, by considering only those results for which y/D > 2 and applying a displacement correction ~/D = 0" 15. The results obtained from the traverses of the pipe were corrected in this way, and U~/U~ was plotted against U,y/v for each value of Rp (Fig. 5). For the whole range of the measurements the points for each Reynolds number were within 0-3 per cent of tile mean curve, thus confirming that (provided y/D > 2) the correction O/D = 0.15 reduces the results obtained with different pitot-tubes to a single true curve.
At the lowest Reynolds number, results were obtained for y/D > 2 over a wide range of U,y/v, but for the two higher Reynolds numbers results were only obtained for y/D > 2 at the higher values of U,y/v. To extend the lower range of U~y/v for these two Reynolds numbers it was assumed that, at sufficiently small values of y/r, U/U, would be strictly a unique function of U,y/v, independent of Rp. The broken lines in Fig. 5 show how the curves for the two higher Reynolds numbers were extrapolated to low values of U~y/~, making use of th is assumption. t t was found that, for a given value of U~y/v, U~/U, became sensibly independent of Rp for values of y/r below about 0.07.
5

By making use of the true velocity profiles shown in Fig. 5, the effect of the wall at low values of y/D could be determined. The measured values of U~ U, for each pitot-tube at each Reynolds number were corrected, for shear (using dl/D = 0.15), and then plotted against U,y/v on the same graph as the true curve of U~/U~. Fig. 6 shows a portion of the curves for pitot-tube No. 5 at Rp = 2.7 × 10⁴. The displacement 82 can be found as the change of y necessary to make the two curves coincide.
Although the wall effect can be expressed as a displacement 82, and this can be added to the known value of $1 to find the total displacement 8, it was found convenient to express the wall effect as a velocity correction of the form ~t/U, where ,t is to be added to the measured velocity U. The correction can be obtained in this form directly from curves such as those shown in Fig. 6.
Equation (1) shows that O~/D, or u/U, may depend on y/r, y/D, and U~y/v. At sufficiently small values of y/r, as already mentioned, U/U~ depends only on U~y/v, and 82/D or u/U should then be independent of y/r. It has already been shown that the wall effect only becomes appre- ciable, even with the largest pitot-tube, for y/r < 0-24. This value of y/f is smal lenough for U/U~ to be approximately a unique function of U~y/v, so that the dependence of the wall correction (82/D or u/U) on y/r should be negligible.
For each value of y/D, the derived values of the wall correction u/U were plotted against U~y/v, as in Fig. 7. The accuracy of the results was not sufficient to determine the dependence of ,t/U on U~y/v. An average value of u/U was therefore taken for each value of y/D, and it was assumed that u /U was independent of U,y/v. This is probably not strictly correct, since for small y/D the velocity profile across the mouth of the pitot-tube must depend on U,y/v, but the experimental results suggest that the variation of ~/U with U,y/v is small enough to be neglected in most practical cases.
The scatter 0f the points shown in Fig. 7 is typical of the results obtained. It may be noted that in this case 6 of the 9 points lie within 0.0025 of the horizontal straight line drawn through the arithmetic mean. Thus the scatter of these 6 points represents an error of only ~ per cent of the measured velocity.
Fig. 8 shows u/U plotted againsty/D. This curve can be used, in conjunction with the shear correction (81/D = 0.15) to find the total correction to be applied to a measured velocity profile. It is recommended, however, that these corrections should only be applied over the range of U.y/v (from about 30 to 230) covered by these experiments.
An alternative presentation is given in Fig. 9, in which the ratio 8/D of total displacement to tube diameter is plotted against D/y, for various values of U,D/v. The use of the reciprocal D/y, instead of y/D, allows the total possible range, from y/D = ½ to y/D = co, to be covered on the diagram. Since u is a correction to be added to the measured velocity, the corresponding displacement 82 is negative, so that d/D is less than 0.15 for small y/D.
The unbroken lines in Fig. 9, for U~D/v = 50, 100 and 200, cover approximately the range for which O/D has been determined in the present experiments. The broken lines, for U~D/v = 25, 500 and 1,000, were derived by assuming that Fig. 8 is correct at all Reynolds numbers. Thus these curves should be used with caution, although it seems unlikely that there can be any large
errors for the high values of U,D/v.
With the form of presentation used in Fig. 9, it is possible to include in the displacement 8 the effect of viscosity at zero shear. This makes no appreciable difference to the curves for U~D/v = 50 or more, but for U,D/v = 25 the effect is quite important. At this low Reynolds number, 8/D becomes greater than 0- 15 for large y/D, when the effect of viscosity at zero Shear is included. The interpretation of the viscous effect as a displacement depends on the velocity profile. Thus the curve given in Fig. 9 for U~D/v = 25, with the viscous effect included, is only applicable in cases where the functional relationship between U/U, and U~y/v is similar to that obtained in these experiments.
6

The results of the measurements ill the turbulent boundary layer on the fiat plate were analysed b y a method similar to that already described. The dimensional analysis for this case is similar to tha t already given for the pipe, but with the pipe radius r replaced b y the boundary-layer thickness d. The measurements were made at two values of the boundary-layer Reynolds number R~, equal to the two lower values of Rp used in the pipe experiments. T h e boundary layer was traversed with each of the five pitot-tubes at each Reynolds number, and for each tube (U/U1) ~ was plotted against y /d . (U/UI) ~ was then plotted against D, for constant values of
y/z]. Using the method of least squares, straight lines were drawn througtl the points and extrapolated to D = 0 to obtain (Uo/U1) 2. Values of the apparent displacement ~0 were then obtained, using the same method as in the pipe experiments. When ~o/D was plotted against y/d, curves resembling those in Fig. 3 were obtained, with Oo/D tending to an upper limit of about 0.15 at large values of y/d. As in the pipe experiments, it was found tha t the wall effect became negligible for y/D > 2.
The true velocity U~ was obtained by applying the correction ~/D = 0.15 to the results for y/D > 2, and U~/U, was then plotted against U~y/v. An at tempt was made to find the correction for wall effect u/U, as before. Unfortunately, this could not be done satisfactorily because the number of observations was not large enough, but the few results obtained were in fairly good agreement with the earlier results obtained from the pipe experiments.
5. Experimental Errors.--After careful consideration of all the sources of experimental error, i t was estimated that the possible error in the correction for shear effect (~/D =- 0- 15) was about 4- 0.01. The possible error in the correction for wall effect u/U was estimated to be about 4- 0.004. This error ill u/U may lead to an error in $2/D of as much as 0.02, so tha t the total error in O/D (as shown in Fig. 9) may be as large as 0.03 in some cases.
6. Comlusio~s.--The experiments have shown that for y/D > 2 the total correction may be expressed as a displacement given by b/D = 0.15 4- 0.01, where the effective centre is displaced from the geometric cen t re towards the region ~ of higher velocity. Provided y/D > 2, $/D is independent of y/D, y/r (or y/d) , and Reynolds number.
When y/D < 2, an additional correction must be applied for the effect of the wall. This can be expressed as 'a correction u, to be added to the measured velocity U: Within the limits of accuracy of these experiments, u/U is found to depend only on y/D, as shown in Fig. 8, and is independent of U,D/v.
Alternatively, the corrections for the effects of shear and of the wall can be combined and expressed as a single displacement ~. The ratio ~/D is conveniently expressed as a function of D/y and of U~D/v., as shown in Fig. 9.
These results ma# require modification at Reynolds numbers outside the range of the present experiments (see Fig. 9). Additional corrections may also be required to allow for effects of turbulence and of viscosity at zero shear.
The experiments were made in turbulent shear flow for which U/U, was very nearly a unique funct ion of U~y/v. In considering the application of the results to more general flows, it may be expected tha t the correction for shear (~I/D) would apply to any shear flow, whether laminar or turbulent, for sufficiently large values of y/D. I t should be noted, however, tha t the way in which the correction for wall effect (~2/D) varies with y/D and U~D/v will in general depend on the velocity profile, defined by the relation between U/U~ and U~y/v. Moreover, the limiting value of y/D, above which the wall effect becomes negligible, may also depend on the velocity profile.
I t is known, however, tha t the velocity profile near the wall in any turbulent boundary layer, except near separation, is similar to tha t found in a pipe. Thus the corrections found in these experiments may be applied to measurements made in any turbulent boundary layer, provided the pitot-tube diameter D is small compared with the boundary-layer thickness, so tha t y/D is only less than 2 for those regions in which the unique velocity profile is obtained.
7

Acknowledgments.--Thanks are expressed to Professor W. A. Mair, who supervised the above work, and to Dr. J. H. Preston for his many helpful suggestions. Thanks are also expressed to Mr. N. B. Surrey and Mr. ]3. R. Piggott who constructed the apparatus.
d
D
P P
R~
U
U
Uo
AU
Y
6o
61
62 6
A
#
P "6O
NOTATION
Internal diameter of pitot-tube
External diameter of pitot-tube
Static pressure, at position of pitot-tube
Pressure in pitot-tube
Radius of pipe
Ucr/v Reynolds number of pipe
U1A/v Reynolds number of fiat plate
Correction for wall effect, to be added to measured velocity U
[ 2(P _-- P)_ll/~' Measured velocity P
Velocity obtained by linear extrapolation to (D = 0)
True mean velocity at position of centre of pitot-tube
Velocity at edge of boundary layer on flat plate
Velocity at centre of pipe
(z0/p) 1/~ ' Friction velocity'
U - - U s
Distance from wall to centre of pitot-tube
Apparent displacement of effective centre of pitot-tube, obtained by linear extrapolation to (D ~-- 0)
Displacement of effective centre of pitot-tube due to effect of shear alone
Displacement of effective centre of pitot-tube due to effect of the wall
~1 + $, Total displacement of effective centre
Thickness of boundary layer on flat, plate
( V - Vo)/D Viscosity of air
Kinematic viscosity of air
Density of air
Shear stress at wall
8

No. Author
1 F .A . MacMillan ..
2 S. Goldstein . . . .
3 A .D. Young and J. N. Maas
4 J . H . Preston . . . .
5 F .A . MacMillan . . . .
R E F E R E N C E S
Title, etc.
Viscous effects on pitot-tubes at low speeds.
p. 570. 1954.
J. R. Ae. Soc. Vol. 58,
A note on the measurement of total head and static pressure. Proc. Roy. Soc. A. Vol. 55, p. 570. 1936.
The behaviour of a pitot-tube in a transverse total-pressure gradient.
R. & M. 1770. 1936.
The determination of turbulent skin friction by means of pitot
tubes. J. R. Ae. Soc. Vol. 58, p. 109. 1954.
Liquid manometers with high sensitivity and small time-tag, jr. Sci. Inst. Vol. 31, p. 17. 1954.

U
u
FIG. 1. Portion of velocity profile, showing displacement ~ of effective
centre of pitot-tube.
21" 0
20.8 = -""~"-"-"-"-~ " - - ' - - ~ - A ~ " "- 0"21 ,---------'-'~'~ " ~ ' ~ . ~ 0 " 2 0
20-6 _ - - - - - - - - ~ - - ' - "T '~ , - - ..___E.__x ~ -~ '0 '19
__._..--.---- 20"4- L _ . . . . . - - - - - - ~ - - - " ~ - . _ . ~ , .__..Z,.__...__._-.--- 4 ~ - ~ 0 ' t 8
v ~ ' 0 " 1 7
..~--tz~---- v ~ / .A-- 0,16 _ _ ~ _ _ . . 2 ~ - - ~ " - - ~ - - ' - - - -
/ - -
20.2
20 '0
19,8
19'6
U'I? 9 ' 2 _ _ . _ . _ _ . _ _ _ ~ x c . . - ~ - .~---~' 0"H
Jg'0 " ~ ' X ' " ~
1S'8 / .~-~-* ,~ 0 Io
t 8 ' 6 ~ . ~ - ' ~ . c ~ ~ Z o ' og
18' 0 j _ _ _ x ~ * - - - - - ~ o o~
17"8 / ~ . . _ . . _ . _ ~ - -
17-6
0`06
17"2 ...,.,.-,~ O" 05
16"8D 0 ' 0 2 0"04 0 .06 0,08 0,10 0,12 0q4
D ( i n c h e s )
FIG. 2. Measured values of U/U~ plotted against pitot- tube diameter, showing linear extrapolation to
D = 0 . (Rp = 5 . 9 x 10⁴).
0,2C
0'15
@o
0.10
0,05
FIG. 3 .
27
x (0
0-05 0-10 0.15 0-20 y ] ~ 0'25 0-30
Apparen.t displacement ~o as obtained by linear extrapolation in Fig. 2.
10

u~
~ A~.
8j A= ~ n3
O%~/: ConsLan5 V M = Cons~nb Rp = Cor~qbanb
D
FIG. 4. Schematic representation of effects of shear and wall on measured values of U/U,.
I0
U_~ Ur
,7
16
15
14
13 2O
/
Pi~ol:., t,ubc o No. I % No.2 o No. 3 + No. ,4- " No. 5
/ ~Rp- 5'9~< i0 "1" r", No. 2
FIG. 5. True velocity profiles.
2-40
18"0
u u~
17'5
1"7'0 ~ ~ r ~ w e r s e resulbs for pib::,b r~u~ "~" I%k~5 ab Rn = 2'7~I0 ~"
(correcbePd for" shear')
16"0 90 100 110 120 1~30 140 150 180
lJ
FIG. 6. A portion of a velocity profile, illustrating the wall effect.
11

D02~
0.020 --- 0"015
U {~010
C>O05
0 0
FIG. 7.
o
o
Io i i ) AriLhlmobic me/~
20 40 60 . 8 0 tO0 120
Z~
T h e w a l l effect e x p r e s s e d as a f u n c t i o n of
U+y/+i (y/D = 0 .8 ) .
14'0
~L-', . . . . .. ,/.,_, -.- --. L> ",~?
d: . i .):,
0'016
~ 0 1 5 .
0 . 0 1 4
0.013 /
0'012
O.Otl
O.OtO
(~009 ~ . :
-~ O.OOB
0 - 0 0 7
0 -O 0 8
0"005 ~ .
0"004
0"003
0"002
0.001 0 0.5 -~: 0'7
/.
FIG. 8.
O' 16
0 ' 1 4
_s D
0 - 1 2
OqO
0.08 0
\ \
~'----..;..,,._L r:, 0'9 I'I 1'3 1'5 1"7 l'g
D
T h e w a l l effect e x p r e s s e d as a f u n c t i o n of y/D.
t I #
Vi'.,..~c.ous e£'Fec~ ag . "'~ %% , zero sh~r=
~,~ ~, /No~ incluc~d
~X~..-~---22-:-=- ... . . \ \
\
5o t I00 U ~ D
~.00
500
000 j
o.5 ~.o L.~ o/v 2.0
FIG. 9. T o t a l d i s p l a c e m e n t effect.
2,1
(Note : curves for U,D/v = 25, 500 and 1,000 are obtained by extrapolation beyond the range of the present experiments)
$ 4 3 7 7 W t . 2 0 / 9 0 3 6 K 7 11/56 D & C o . 3 4 / 2 6 3 PRINTED IN OREAT BRITAIN
12

i
R. & M. No. 3028
. L
7 7.
. '-.
J
/
/ , r
Publications of the Aeronautical Research Council
, i . ,
• ANNUAL TECHNICAL REPORTS OF THE AERONAUTICAL RESEARCH COUNCIL (BOUND VOLUMES)
1939 Vol. I. Aerodynamics General, Performance, AirscreWs, Engines. 5os. (5IS: 9d.) Vol. II. Stability and Control, Flutter and Vibrafi0n, Instruments, Structures, Seaplanes, etc.
63 s. (64 s. 9d.) : i94o Aero and Hydrodynamics, Aerofofls, Airscrews, Engines, Flutter, Icing, Stability and Control,
Structures , and a miscellaneous section. 5os . (5IS. 9d.) 1941 Aero and Hydrodynamics, Aerofofls, Airscrews, Engines, Flutter, Stability and Control, Structures.
63 s. (64 s. 9d.) 1942 Vol. I. Aero and Hydrodynamics, Aerof0ils, Airscrews, Engines. 75 s. (76s. 9d.) :
Vol. II. Noise, Parachutes, Stability and Control, Structures, Vibration, Wind Tumlels. 47 s. 6d. (49 s. 3d.)
I943Vol. I. Aerodynamics, Aerofoils, Airscrews. 8os. (8is. 9 &) I Vol. II. Engines, Flutter, Materials, Parachutes; Performance, Stability and Control, Structures.
9os. (92s. 6d.) 1944 VoL I. Aero and Hydrodynamics, Aerofoils, Aircraft, Airserews, Controls. 84s: (86s. 3d.)
Vol. II. Flutter and Vibration, Materials, Miscellaneous , Navigation, Parachutes, Performance, Plates and Panels, Stability, Structures, Test Equipment, Wind Tunnels~ 84 s. (86s. 3d.)
1945 Vol. I. Aero and Hydrodynamics, Aerofoils, i3os. (i32s. 6d.) Vol. II. Aircraft, Airscrews, Controls. I3OS. (I32S. 6d.) Vol. III. Flutter and Vibration, Instruments, Miscellaneous, Parachutes] Plates mad Panels,
Propulsion. I3OS (I32S. 3d.) Vol. IV. Stability, Structures, Wind tunnels, Wind Tunnel Technique. I30S. (I32S. 3d.)
ANNUAL REPORTS OF THE AERONAUTICAL RESEARCH 'COUNCIL--
1937 2s. (2s. 2d.) 1938 Is. 6d. (IS. 8d.) 1939-48 3 s. (3 s. 3 d.) INDEX TO ALL REPORTS AND ~ MEMORANDA PUBLISHED IN THE ANNUAL TECHNICAL
REPORTS, AND SEPARATELY m April, 195o . . . . - R~ & M. No. 26oo. 2s. 6d. (2s. 8d.)
AUTHOR INDEX TO ALL REPORTS AND MEMORANDA OF THE AERONAUTICAL RESEARCH COUNCIL--
I9O9-January, 1954 - - - R. & M. No. 2570. 'I5 s. (I5 s. 6d.)
INDEXES TO THE TECHNICAL REPORTS OF THE AERONAUTICAL RESEARCH COUNCII.r-
December I, 1936- - June 30, 1939. R. & M.No. 185o. is. 3 d. (is. 5d.) . . . . July I, 1 9 3 9 - June 30, 1945. - R. &M~ No. 195o. is. (is. 2d.) July I, 1945 - - June 30, 1946. -= R. & M. No. 2050. Is. (IS. 2d.) July I, 1946 - - December 31, I946. R .& M. No. 2!5o. I8. 3 d. (IS. 5d.) 1 ' # January 1, 1 9 4 7 - June 30, 1947. - R; & M. No. 2250. IS. 3 d. (IS. 5d.)
PUBLISHED REPORTS AND MEMORANDA OF THE AERONAUTICAL RESEARCH C O U N C I L - -
Between Nos. 2251-2349. - - R. & M. No. 2350. is. 9& (is. iid.) Between Nos. 2351-2449. - - R. & M. No. 2450. 2s. (2s. 2d.) Between Nos. 2451-2549. - - R . & M . No. 255o. 2s. 6d. (2s. 8d.) Between Nos. 2551-2649. - - R. & M. No, 265o. 2s. 6d. (2s. 8d.)
Prices in brackets include postage
HER MAJESTY'S STATIONERY OFFICE York House, Kingsway. London W . C . 2 : 4 2 3 Oxford Street. London W . ! ;
13a Castle Street, Edinburgh 2; 39 King Street. Manchester 2 ; 2 Edmund Street. Birmingham 3; 109 St. Mary Streot, Cardiff; Tower Lane, Bristol l • 80 Chichester Street, Belfast, or through any bookaeller
I i
r S.O. Code No. 23-3028
R. & M. No . 13028
r