Embed Size (px)
Citation preview

A long term study of bonamiosis in Quiberon bay, France
I. Arzul*, L. Miossec, E. Blanchet, C. Garcia, J.P. Joly, C. Francois and F. Berthe
ww
w.i
fre
me
r.fr
lfre
mer
*Community Reference Laboratory for Mollusc Diseases - OIE reference laboratory for bonamiosis and marteiliosis- IFREMER - 17390 La Tremblade FRANCE
Do not
disse
minate
withou
t auth
or au
thoriz
ation

Introduction
� The flat oyster Ostrea edulis was the flagship of the Breton oyster production until two diseases due to the protozoans Bonamia ostreae and Marteilia refringens
spread in the 1970’s.
� These diseases drastically reduced the flat oyster production from nearly 20,000 t per year in 1970 to less than 2,000 t nowadays.
� Losses were estimated at about 20% of employment, 240 millions US$ of turn over and 200 millions US$ of added value between 1980 and 1983.
French flat oyster production (mt)
0
5000
10000
15000
20000
25000
30000
19
50
19
52
19
54
19
56
19
58
19
60
19
62
19
64
19
66
19
68
19
70
19
72
19
74
19
76
19
78
19
80
19
82
19
84
19
86
19
88
19
90
19
92
19
94
19
96
19
98
20
00
20
02
Marteilia refringens
Bonamia ostreae
Do not
disse
minate
withou
t auth
or au
thoriz
ation

Introduction
� The protozoan Bonamia ostreae was first reported in June 1979, in oyster farms of Tudy Island, Brittany, in association with abnormal mass mortalities (80-90%) (Pichot et al., 1979).
� During the following months, the same parasite was detected in all the Brittany farming centres and then has rapidly spread to most European oyster stocks (both reared and wild).
� The introduction is believed to have occurred with transfers of flat oysters, Ostrea edulis moved from California to France and Spain.
Rade
de
Brest
1979
1980
CancaleBinicMorlaix
Les Abers
Ile Tudy
Aven
Etel
Baie de
Quiberon
Pénerf
Do not
disse
minate
withou
t auth
or au
thoriz
ation

Aims of the study
� To draw an updated and dynamic picture of the French flat oysterproduction from data collected during the national shellfish culture census carried out in 2002 in France.
� To study the evolution of the disease in an endemic area (Quiberon Bay, Brittany) from pathological data collected between 1980 and2004.
Do not
disse
minate
withou
t auth
or au
thoriz
ation

Flat oyster spat production (2000):
375.6 106 units
Bay of QUIBERON
BREST
12.2%
ε %
87.8%
CANCALE
2001 data from national census (Agreste)
� 99.4% of spat is naturally collected on limed tiles or bags of mussel shells.
� 2.2 106 units are produced by 3 hatcheries in 2000.
� All the Brest spat production and 1/3 of the Quiberon bay spat production is moved to Cancale, North Brittany, when spat is 10 months.
Do not
disse
minate
withou
t auth
or au
thoriz
ation

Bay of QUIBERON
CANCALE
0
10
20
30
40
50
%
NN BN BS PL PC A M
Marketing
Main production areas, including marketing
Marketing areas
Adult flat oyster transfer beforemarketing
Flat oyster marketing (2001):
1 653 tons
NN
NB
SB
PL
PC
A
M
2001 data from national census (Agreste)Do n
ot dis
semina
te with
out a
uthor
autho
rizati
on

The French flat oyster production is located in few specialised areas:
� 2 spat collection areas: Brest and Quiberon bays
� 2 growth areas: Quiberon and Cancale
� 4 main marketing areas: Cancale, Belon, Golfe du Morbihan and Arcachon
The French flat oyster production implies transfers:� Spat is moved from Brest or Quiberon bays to Cancale for growth
� 83% of adults are moved from a farm to another before marketing
French flat oyster production
nowadays
Do not
disse
minate
withou
t auth
or au
thoriz
ation

Quiberon study: material and methods
� About 41 425 pathological data were collected in Quiberon Bay for different purposes with different sampling strategies on the period 1980-2004.
� Diagnostic analysis were performed by tissue imprints (heart or gill) or less
frequently by histology.
� Data were analysed by year, season and age and compared with some from other important production areas.
Google earth (2004)
Do not
disse
minate
withou
t auth
or au
thoriz
ation
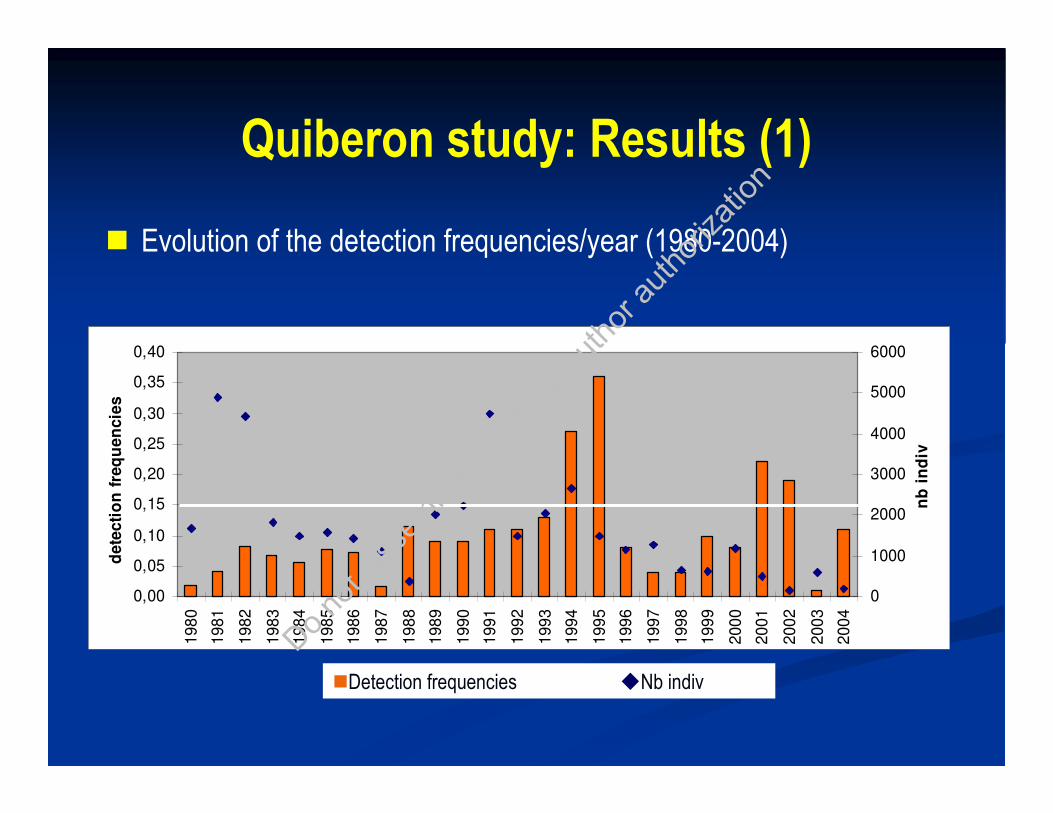
Quiberon study: Results (1)
� Evolution of the detection frequencies/year (1980-2004)
0,00
0,05
0,10
0,15
0,20
0,25
0,30
0,35
0,40
198
0
198
1
198
2
198
3
198
4
198
5
198
6
198
7
198
8
198
9
199
0
199
1
199
2
199
3
199
4
199
5
199
6
199
7
199
8
199
9
200
0
200
1
200
2
200
3
200
4
dete
cti
on
fre
qu
en
cie
s
0
1000
2000
3000
4000
5000
6000
nb
in
div
�Detection frequencies �Nb indiv
Do not
disse
minate
withou
t auth
or au
thoriz
ation

Quiberon study: Results (2)
� Evolution of the detection frequencies/season (1989-2004)
0,1382011031Autumn
0,062919179Summer
0,1669081104Spring
0,134663610Winter
DetectionfrequenciesTotalPositive
0
0,05
0,1
0,15
0,2
0,25
0,3
0,35
0,4
0,45
0,5
H P E A H P E A H P E A H P E A H P E A H P E A H P E A
1989 1990 1991 1992 1993 1994 1995
0
200
400
600
800
1000
1200
1400
1600
�Detection frequencies �Nb indivDo n
ot dis
semina
te with
out a
uthor
autho
rizati
on

Quiberon study: Results (3)
� Evolution of the detection frequencies/age (1989-2004)
0
0,1
0,2
0,3
0,4
0,5
0,6
1989 1990 1991 1992 1993 1994 1995 1996 1997 1998 1999 2000 2001
0
500
1000
1500
2000
2500
3000
3500
Spat
Juveniles
Adults
Nb spat
Nb juveniles
Nb adults
Do not
disse
minate
withou
t auth
or au
thoriz
ation

Quiberon study: Discussion (1)
� Comparison with other production areas
Cancale
0,00
0,05
0,10
0,15
0,20
0,25
0,30
0,35
0,40
1980
1981
1982
1983
1984
1985
1986
198719
8819
8919
9019
9119
9219
9319
9419
9519
9619
9719
9819
99200020
0120
0220
0320
04
0
500
1000
1500
2000
Quiberon
0,00
0,05
0,10
0,15
0,20
0,25
0,30
0,35
0,40
19
80
19
81
19
82
19
83
19
84
19
85
19
86
19
87
19
88
19
89
19
90
19
91
19
92
19
93
19
94
19
95
19
96
19
97
19
98
19
99
20
00
20
01
20
02
20
03
20
04
0
1000
2000
3000
4000
5000
6000
Brest
0,00
0,05
0,10
0,15
0,20
0,25
0,30
0,35
0,40
1980
1981
1982
1983
1984
1985
1986
1987
1988
1989
1990
1991
1992
1993
1994
1995
1997
1998
1999
2001
2002
020040060080010001200140016001800
St Brieuc
0,00
0,10
0,20
0,30
0,40
19
80
19
81
19
82
19
83
19
84
19
85
19
86
19
87
19
88
19
89
19
90
19
91
19
92
19
93
19
94
19
95
19
96
19
97
0
500
1000
1500
2000
Do not
disse
minate
withou
t auth
or au
thoriz
ation

Quiberon study: Discussion (2)
� Potential impact of temperature and salinity?
0,000
0,050
0,100
0,150
0,200
0,250
0,300
0,350
0,400
1987 1988 1989 1990 1991 1992 1993 1994 1995 1996 1997 1998 1999 2000 2001 2002 2003 2004
0
500
1000
1500
2000
2500
3000
3500
4000
4500
5000detection frequencies Nb indiv
0,00
5,00
10,00
15,00
20,00
25,00
janv
-87
janv-
88ja
nv-89
janv
-90
janv
-91
janv
-92
janv-
93ja
nv-94
janv
-95
janv
-96
janv
-97
janv
-98
janv-
99ja
nv-0
0ja
nv-0
1ja
nv-0
2ja
nv-0
3ja
nv-04
Temp
Mean
20,00
22,00
24,00
26,00
28,00
30,00
32,00
34,00
36,00
38,00
40,00
janv-
87ja
nv-88
janv-
89ja
nv-90
janv-
91ja
nv-92
janv-
93ja
nv-94
janv-
95ja
nv-96
janv-
97ja
nv-98
janv-
99ja
nv-00
janv-
01ja
nv-02
janv-
03ja
nv-04
Salinity
Mean
Rephy data Rephy data
Do not
disse
minate
withou
t auth
or au
thoriz
ation
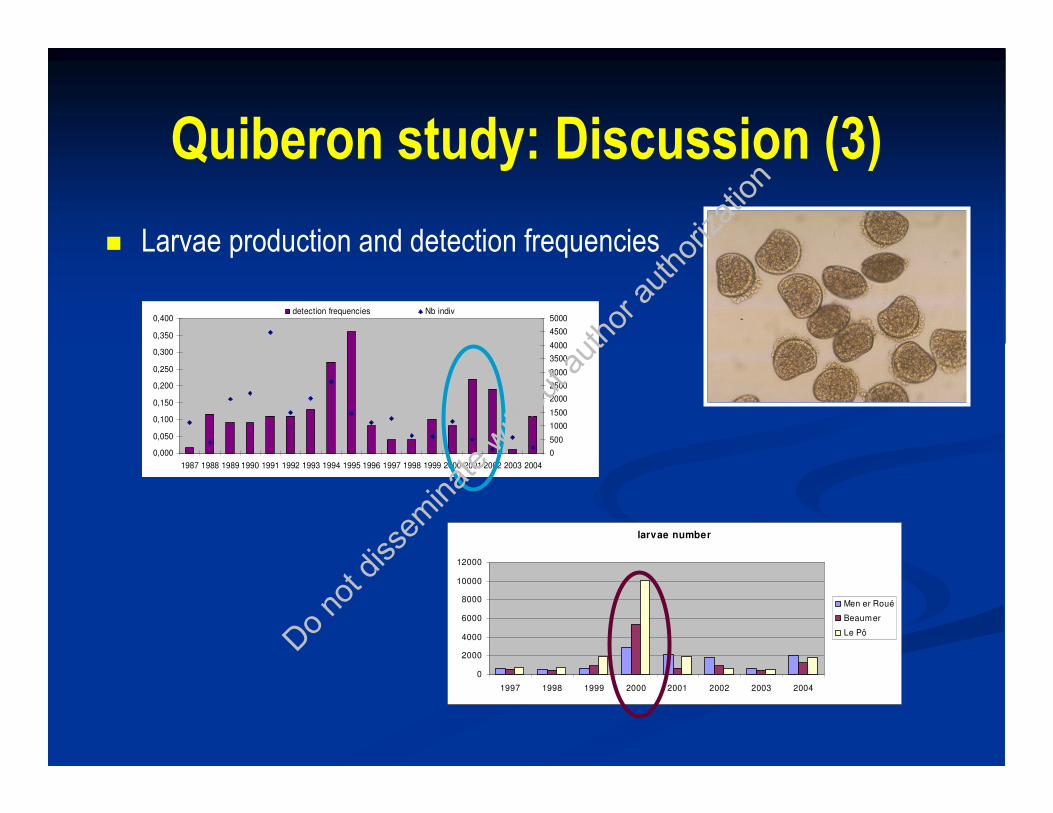
Quiberon study: Discussion (3)
� Larvae production and detection frequencies
0,000
0,050
0,100
0,150
0,200
0,250
0,300
0,350
0,400
1987 1988 1989 1990 1991 1992 1993 1994 1995 1996 1997 1998 1999 2000 2001 2002 2003 2004
0
500
1000
1500
2000
2500
3000
3500
4000
4500
5000detection frequencies Nb indiv
larvae number
0
2000
4000
6000
8000
10000
12000
1997 1998 1999 2000 2001 2002 2003 2004
Men er Roué
Beaumer
Le PôDo not
disse
minate
withou
t auth
or au
thoriz
ation

Conclusions
� The history of bonamiosis in France highlights the risks related to transfers of live molluscs.
� However the French flat oyster production still relies on many transfers of spat and of adults before marketing.
� Bonamia ostreae is present in Quiberon Bay since 1980 with prevalence usually lower than 0.15. Detection frequencies present fluctuations on the studied period and seasonal fluctuations within a year.
� The host-parasite system appears stable: since 25 years, Bonamia ostreae seems to have adapted itself to the flat oyster production, inducing less outbreaks than in the past. The flat oyster in endemic areas seems to have developed a relative natural tolerance to the parasite.
� Data are still needed to understand the evolution and distribution of the disease...
Do not
disse
minate
withou
t auth
or au
thoriz
ation

� Thanks for your attention
� Aknowledgements:
Anne-Geneviève Martin & Aimé Langlade
Do not
disse
minate
withou
t auth
or au
thoriz
ation