Embed Size (px)
Citation preview
,~ ~
r CALIFORNIA t ~ · JUVENILE CAMPS AND RANCHES ~~
r ~ POPULATION ~i I
~
~ f " ,
• SUMMARY REPORT NO. 15 CALENDAR YEAR 1991
DEPARTMENT OF THE YOUTH AUTHORITY RESEARCH DIVISION
March 1993
If you have issues viewing or accessing this file contact us at NCJRS.gov.

STATE OF CALIFORNIA PETE WILSON
GOVERNOR
YOUTH AND ADULT CORRECTIONAL AGENCY
JOE G. SANDOVAL SECRETARY
~ . .,. . ~1*" ~. I_
93-5
. .
DEPARTMENT OF THE YOUTH AUTHORITY
Elaine Duxbury, Chief Research Division
Ted Palmer Research Manager
Prevention & Community Corrections Research Bureau
Author:
Robert F. W~dge Research Analyst II
* * * Jackie Hummel Statistical Clerk
Karen Deering Office Technician (Typing)
LDA
Wm. B. Kolender Director
Francisco J. Alarcon Chief Deputy Director
Richard W. Tillson, Deputy Director Institutions and Camps Branch
George McKinney, Deputy Director Parole Senrices and Community Corrections Branch
Barbara Allman, Deputy Director Administrati"e Senrices Branch

CONTENTS
Page
Data Highl ights.... .... ... .. .. .... ..... . . ... . . .... . .. . . .... .. .. ... ... . .. iii
Camp Population Monitoring System....................................... 1
Statewide Capacity and Population in 1991............................... 2
Population Trends From 1987 to 1991..................................... 9
Admissions to Camps..................................................... 10
Facility Overcrowding................................................... 16
APPENDIX A: Brief History of County Camp System ..................... .
APPENDIX B: Population Monitoring Report Form ....................... .
APPENDIX C: Average Daily Population in Camps During 1991, by Month ................................................ .
APPENDIX D: Probation Camps Classified as Secure as of December 1991 ........................................... .
APPENDIX E: Camp Capacity Changes Since 1986 ........................ .
APPENDIX F: Average Daily Population of Individual Camps, 1987 through 1991 ....................................... .
LIST OF TABLES
TABLE 1: Statewide Camps Average Daily Population by Sex and Percent of Beds Occupied During Calendar Year 1991 ...... .
TABLE 2: Juvenile Probation Camps and Ranches 1991 Calendar Year Population Summary: Low and High Monthly ADP and Average Annual Population and Percentage of Capacity Used ........................................... .
TABLE 3: Bed Capacity and Average Daily Population in Secure and Non-Secure Camps as of December 1991 ................ .
TABLE 4: Statewide Camp Population Trends From 1987 to 1991, by Quarters ............................................. .
21
25
27
31
33
35
3
5
8
10
500.rpt

TABLE 5:
TABLE 6:
TABLE 7:
TABLE 8:
TABLE 9:
SOO.rpt
LIST OF TABLES (Continued)
Number of Total Admissions and Transfers to Camps, 1989 to 1991 ............................................ .
Number and Percentage of Each Type of Admission to Probation Camps in 1991 .............................. .
Number and Type of Admissions to Probation Camps During 1991, by Individual Camp ......................... .
Number of Days That Total Facility Population Exceeded Maximum Legal Rated Capacity During 1991, by Month ................................................ .
Number of Days That Maximum Legal Rated Capacity Was Exceeded in Any Living Unit During 1991, by Month ................................................ .
U.S. Department of Justice National Institute of Justice
144014
This document has been reproduced exactly as recei~ed from t~e person or organization originating It. Points of view or oplm~ns stated In this document are those of the authors and do not necessanly represent the official position or policies of the National Institute of Justice.
Permission to reproduce this copyrighted material has been granted b¥,. • th Cali:torma Department of e
Youth Authority to the National Criminal Justice Reference Service (NCJRS).
Further reproduction outside of the NCJRS system requires permission of the copyright owner.
i i
12
13
14
18
19

CALIFORNIA JUVENILE PROBATION CAMPS AND RANCHES SUMMARY REPORT NO~ 15
1991 CALENDAR YEAR
Data Highlights
• During 1991, local probation departments in 20 counties operated 52
residential camps and ranches with a combined average capacity for the
year of 4,143 beds. The statewide average daily population (ADP) was
3,642. The rate at which beds were occupied was 87.9%.
• As 1991 began, there were 51 camps. By December, three camps had closed
and one camp was added to the list, leaving at year's end 49 camps with
4,095 beds.
• Of the 49 camps in operation in December 1991, 17 were considered secure
and 32 nonsecure. The 17 secure facilities provided 1,411 beds, 36% of
the total beds statewide. Secure camps had an ADP of 1,309, for a 92.8%
occupancy rate. The 32 nonsecure camps had 2,682 beds in December and
an ADP of 2,299, for an occupancy rate of 85.7%.
• As of December 1991, Los Angeles County had 2,094 beds, or 51.1% of the
4,095 total statewide beds. The ADP in Los Angeles camps was 1,990, or
56.3% of the statewide average of 3,537.
• Population trends from 1987 to 1991 show the following: Available beds,
up from 4,136 in 1987 to 4,143; average population, down from 3,690 in
1987 to 3,642.
• The camps and ranches reported 13,293 admissions during 1991. The
admissions data collection system is still in the process of removing
iii SOO.rpt
reporting flaws, so comparisons with statewide admission figures for
prior years are discouraged. However, data for 1991 are considered more
reliable .
• In 1991, there were 1,052 incidents of facility overcrowding. Of these
incidents, 777, or 73.9%, occurred in camps in Los Angeles County.
• In the past 5 years, overcrowding incidents have been as high as 1,897
(in 1988) and as low as 753 (in 1989). The lower figure in 1989 is
partly explained by the closure of the Los Angeles Special Treatment
Program, which had been overcrowded 365 days in 1988.
iv 500.rpt

CALIFORNIA JUVENILE PROBATION CAMPS AND RANCHES POPULATION SUMMARY REPORT NO. 15
CALENDAR YEAR 1991
This report provides population information on juvenile residential
treatment facilities operated by county probation departments during calendar
year 1991. Reports on the population of these facilities have been published
annually by the Department of the Youth Authority since 1980. These reports
summarize average daily population and annual admissions by facility and
statewide total. The collective group of county-operated residential
facil it i es wi 11 hereafter be referred to as camps--a term long in popul ar
usage.
Camp Population Monitoring System
The Youth Authority is authorized by Section 885 of the Welfare and
Institutions Code to set standards for the operation of juvenile camps.
Additionally, the California Administrative Code states that the Youth
Authority shall establish maximum facility capacities (Article 2, Section
4358). In order to carry out this mandated responsibility, it is necessary
for the Youth Authority to collect data on camp population.
The purpose of th is report is to provi de probat i on departments and 1 oca 1
and state decision makers with information on (1) the statewide capacity of
the local juvenile probation camps system (that is, the number of available
beds), (2) the average daily population residing in camps, (3) the number of
days on which camp populations exceeded maximum rated capacity (overcrowding),
and, (4) the number of admissions to camps.
The system for monitoring the population of camps was initiated in January
1980. For this purpose, Form YA 10.408 was provided to each facility (see
1
501.rpt

Appendix 8). Staff are instructed to record population based on a count taken
at 12:01 a.m., thereby reflecting the number of youths occupying beds. Youths
absent on furlough, court appearance, etc., are not intended to be included in
the daily population count. Camp staff complete the forms and submit them to
the Youth Authority Research Di vi s i on each month. Research staff edi t the
forms and, when errors are detected, return the forms to the respective camps
for correction.
Statewide Capacity and Population in 1991
During 1991, there were 52 camps in operation, at one time or another, in
20 counties. This number includes two counties that jointly operate the Fouts
Springs Camp in northern California. Fouts Springs is also unique in that it
includes an adjacent but completely separate dormitory of 44 beds (opened
August 1990) for housing youth Authority wards on a contractual agreement.
These youth Authority wards are not included in the admissions and population
counts in this report.
Table 1 shows the statewide camp capacity, by month. The average capacity
over the 12 months of 1991 was 4,143 beds. During the year, three camps
closed. Capacity was increased in three camps. LA's Camp Smith, although it
opened December 13, 1990, was added to the camp count for 1991. As of
December 1991, there were 49 operating camps with 4,095 beds.
Camp population. There was a composite average daily population (ADP) of
3,642 in the 52 camps operating during 1991. The average percentage of beds
occupied was 87.9%. These figures are shown in Table 1, along with the ADP
during each month. The statewide ADP ranged from a high of 3,758 in March to
a low of 3,520 in September. The corresponding occupancy rates were 90.0% and
86.1%.
2
501.rpt

Month
Jan
Feb
Mar
Apr
May
Jun
Jul
Aug
Sep
Oct
Nov
Dec
Annual
TABLE 1
Statewide Camps Average Daily Population by Sex and Percent of Beds Occupied
During Calendar Year 1991
Avg. Beds Avg. Daily Available Population Males Females
4,271 3,727 3,513 214
4,241 3,722 3,509 213
4,174 3,758 3,548 210
4,150 3,746 3,531 215
4,145 3,662 3,428 234
4,145 3,641 3,409 232
4,145 3,6l7 3,385 232
4,079 3,619 3,390 229
4,089 3,520 3,297 223
4,089 3,570 3,334 236
4,095 3,587 3,332 255
4,095 3,537 3,280 257
4,143 3,642 3,413 229
Pet. Beds Occupied
87.3
87.8
90.0
90.3
88.3
87.8
87.3
88.7
86.1
87.3
87.6
86.4
87.9
Note. During 1991, 3 camps increased capacity, 3 camps decreased capacity, and 3 camps closed. See footnotes to Table 2.
Individual camps. Table 2 summarizes maximum capacity, ADP, and bed
occupancy data for each of the 52 camps that were open at some point in 1991.
The table shows the lowest and highest monthly ADP and the ADP for the full
year. For example, the Byron Boys Ranch in Contra Costa County is shown as
having a capacity of 74, an annual ADP of 66.6, and an average occupancy rate
of 90.0%. The lowest monthly ADP at Byron Ranch was 57.0 (77.0% occupancy)
3
501.rpt

and the highest was 70.4 (95.1% occupancy). Monthly ADPs for each camp are
shown in Appendix C.
Secure vs. non secure camps. While all camps are residential, not all are
secure or closed. For the purpose of this report, a secure camp is identified
by the existence of a locked perimeter fence or locked living units.
Information used to identify secure camps was obtained from the Youth
Authori ty' s Juvenil e Probation Camps Study, the Statewi de Needs Assessment
conducted by Farbstein and Associates, and directly from camp directors or
other probation staff. As of December 1991, 17 secure camps were in
operation. These are listed in Appendix D. Table 3 shows the bed capacity
and ADP for camps grouped as secure and non secure . These data are also
presented separately for Los Angeles County camps and camps in the rest of the
state. All figures are for those camps in operation at the end of the year.
The number of beds and ADP may not agree with numbers in Tables 1 and 2 since
those tables represent annualized data and Table 3 is based on figures at a
specific point in time.
4 501.rpt

TABLE 2
Juvenile Probation Camps and Ranches 1991 Calendar Year Population Summary! Low and High Monthly ADP and Average Annual Population and
Percentage of Capacity Used
Avg. % of ADP Capacity Used
Maximum Monthly Cal. Yr. Monthly Ca 1. Yr. Facilities Capacity Low High 1991 Low High 1991
Alameda Chabot 90a 44.3 65.6 56.0 49.2 72.9 62.2 Los Cerros 100/125b 60.8 89.1 77 .4 55.1 80.7 70.1
Colusa l Solano Fouts Springs 60 24.4 37.2 31.5 40.7 62.0 52.5
Contra Costa Byron Boys Ranch 74 57.0 70.4 66.6 77 .0 95.1 90.0
Del Norte Bar-O-Boys Ranch 42 27.0 35.3 31.2 64.3 84.0 74.3
Fresno C. K. Wakefield 60 41.3 52.3 48.1 68.8 87.2 80.2
Kern --camp Erwin W. Owen 125 121. 7 124.8 124.0 97.4 99.8 99.2
Youth Facil ity 72c 33.4 72.0 52.2 46.4 100.0 72.5
Los Angeles Camp Afflerbaugh 116 105.1 114.2 110.1 90.6 98.4 94.9 Camp Gonzales 125 119.1 128.1 124.1 95.3 102.5 99.3 Camp Karl Holton 125 119.9 131.1 122.6 95.9 104.9 98.1 Camp Kilpatrick 119 115.0 120.5 117.0 96.6 101.3 98.3 Camp D. Kirby 100 95.3 97.9 96.6 95.3 97.9 96.6 Camp Mendenhall 105 94.1 102.4 98.6 89.6 97.5 93.9 Camp Mi 11 er 115 103.8 110.8 107.8 90.3 96.3 93.7 Camp Munz 105 91.9 103.8 98.8 87.5 98.9 94.1 Camp Paige 116 107.3 113.8 110.7 92.5 98.1 95.4 Camp Rockey 125 117.6 126.6 121. 2 94.1 101.3 97.0 Camp Scott 116 102.1 111.6 106.4 88.0 96.2 91.7 Camp Scudder 105 99.5 105.4 102.1 94.8 100.4 97.2 Barley Flats 92 85.6 89.9 87.8 93.0 97.7 95.4 Louis Routh 90
d 77 .0 88.2 84.8 85.6 98.0 94.2
Lathrop Comm. Program 67 27.5 34.4 33.3 41.0 51.3 49.7 Camp Holton II 30e 19.9 66.3 Challenger - Onizuka 110 92.3 113.4 104.9 83.9 103.1 95.4
5
SOl.rpt

• TABLE 2 {Continued)
Avg. % of ADP Capacity Used
Maximum Monthly Cal. Yr. Monthly Cal. Yr. Facil ities Capacity Low High 1991 Low High 1991
Los Angeles (Cont/d) Challenger - McNair 110 99.8 111.5 105.6 90.7 101.4 96.0 Challenger - Jarvis 110 94.5 110.2 104.2 85.9 100.2 94.7 Challenger - Resnik 105/100 f 71.4 99.4 85.8 70.2 97.7 84.4 Challenger - Smith 110 80.5 108.6 101.4 73.2 98.7 92.2
Orange Los Pinos 125 105.5 122.9 115.5 84.4 98.3 92.4 Joplin 60 53.5 59.7 57.1 89.2 99.5 95.2 Youth Guidance Ctr. 125 104.3 119.3 114.4 83.4 95.4 91.5
Placer Treatment Ctr. 20 13.2 19.6 16.5 66.0 98.0 82.5
Riverside Twi.n Pines 70 37.4 62.5 48.2 53.4 89.3 68.9 Van Horn 44 25.7 40.1 33.5 58.4 91.1 76.1
Sacramento Boys Ranch 100 69.1 92.9 83.7 69.1 92.9 83.7 Thornton Youth Center 50 40.1 52.0 46.3 80.2 104.0 92.6
San Bernardino Regional Education 40 31.2 39.6 36.3 78.0 99.0 90.8 Kuiper Youth Ctr. 44/20g 12.8 17.1 14.9 49.2 65.8 57.3
San Diego Rancho Del Rayo 106 97.5 104.3 102.6 92.0 98.4 96.8 Rancho Del Campo 100 86.1 96.9 93.6 86.1 96.9 93.6 Girls Rehab. Facility 20/30h 19.5 30.0 25.1 83.7 128.8 107.7
San Francisco Log Cabin 84 21.2 38.6 30.6 25.2 46.0 36.4
San Mateo Glenwood 60 37.5 53.1 44.5 62.5 88.5 74.2
Santa Barbara 50/56; Los Prietos 40.0 48.2 44.4 78.4 94.5 87.1
Santa Clara Wm. F. James 105. 73.3 94.9 88.8 69.8 90.4 84.6 Harold Holden 109/108J 46.4 83.0 70.9 42.7 76.4 65.3 Mur;el Wright 41 25.9 36.6 32.4 63.2 89.3 79.0
6
501.rpt
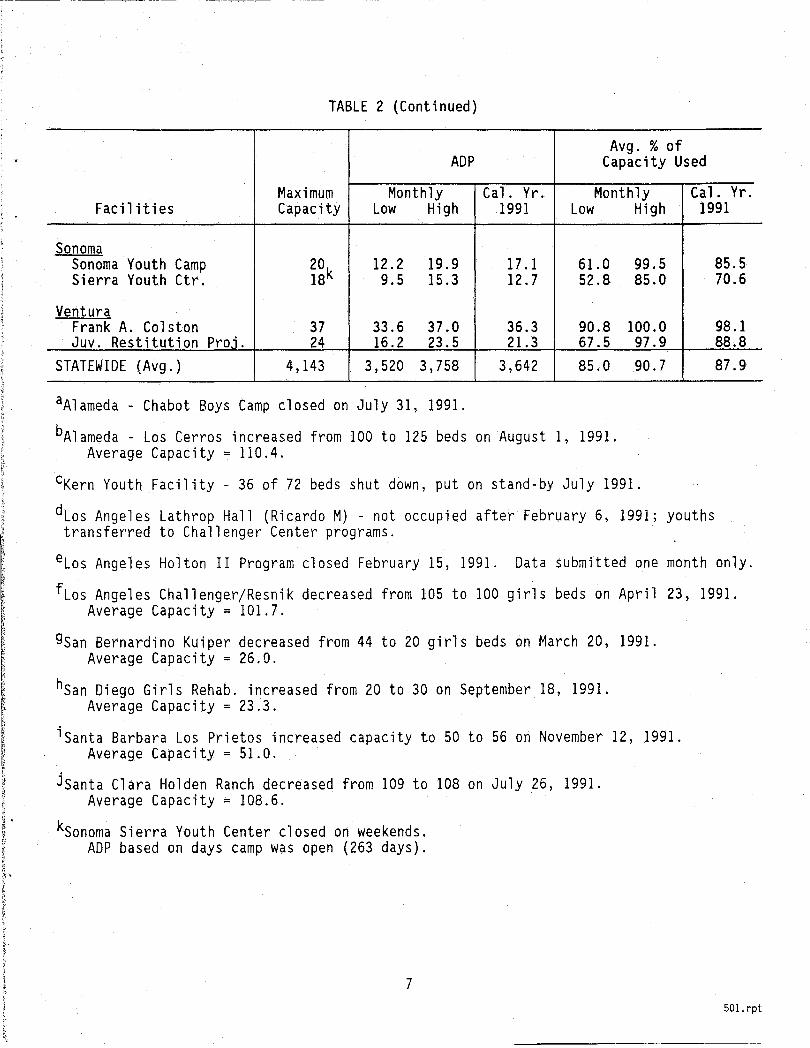
TABLE 2 (Continued)
Avg. % of ADP Capacity Used
Maximum Monthly Cal. Yr. Monthly Cal. Yr. Facilities Capacity Low High 1991 Low High 1991
Sonoma Sonoma Youth Camp 20 k
12.2 19.9 17.1 61.0 99.5 Sierra Youth Ctr. 18 9.5 15.3 12.7 52.8 85.0
Ventura Frank A. Colston 37 33.6 37.0 36.3 90.8 100.0 Juv. Restitution Proj. 24 16.2 23.5 21.3 67.5 97.9
STATEWIDE (Avg.) 4,143 3,520 3,758 3,642 85.0 90.7
aAlameda - Chabot Boys Camp closed on July 31, 1991.
bAlameda - Los Cerros increased from 100 to 125 beds on August 1, 1991. Average Capacity 110.4.
cKern Youth Facility - 36 of 72 beds shut down, put on stand-by July 1991.
dLos Angeles Lathrop Hall (Ricardo M) - not occupied after February 6, 1991; youths transferred to Challenger Center programs.
85.5 70.6
98.1 88.8 87.9
eLos Angeles Holton II Program closed February 15, 1991. Data submitted one month only.
fLos Angeles Challenger/Resnik decreased from 105 to 100 girls beds on April 23, 1991. Average Capacity = 101.7.
gSan Bernardino KUiper decreased from 44 to 20 girls beds on March 20, 1991. Average Capacity = 26.0.
hSan Diego Girls Rehab. increased from 20 to 30 on September 1B, 1991. Average Capacity = 23.3.
iSanta Barbara Los Prietos increased capacity to 50 to 56 on November 12, 1991. Average Capacity = 51.0.
jSanta Clara Holden Ranch decreased from 109 to lOB on July 26, 1991. Average Capacity = 10B.6.
kSonoma Sierra Youth Center closed on weekends. ADP based on days camp was open (263 days).
7
501.rpt

These 17 secure camps contained 1,411 beds, about one-thi rd of the beds
available statewide. The secure camps had an ADP of 1,309, and an occupancy
rate of 92.8% during 1991. The occupancy rate was slightly higher in secure
camps than in nonsecure camps in both Los Angeles County and in the rest of
the state. The occupancy rate was higher in Los Angeles County in both secure
and nonsecure camps. The lowest occupancy rate of 80.8% occurred in the group
of 23 non secure camps in counties other than Los Angeles.
TABLE 3
Bed Capacity and Average Daily Population in Secure and Non-Secure Camps
As of December 1991
Type of Camp
Secure Non-Secure
TOTAL STATE
Number of Camps No. 17 32 Number of Beds Avg. 1 ,411 2,682 1991 ADP Avg. 1,309 2,299 Occupancy Rate Pct. 92.8 85.7
STATE LESS LOS ANGELES COUNTY Number of Camps No. 7 23 Number of Beds Avg. 277 1,722 1991 ADP Avg. 226 1,392 Occupancy Rate Pct. 81.6 80.8
LOS ANGELES COUNTY Number of Camps No. 10 9 Number of Beds Avg. 1,134 960 1991 ADP Avg. 1,083 907 Occupancy Rate Pct. 95.5 94.5
Note. Data in Table 3 are based on those camps in operation in December 1991. Not included are LA County's Lathrop Hall and Holton II secure programs, which were only open during January. Also not included is Alameda's secure Camp Chabot, which closed July 31, 1991.
8
501.rpt

Population Trends From 1987 to 1991
Table 4 contains a summary of statewide camp capacity and population data
for the five-year period beginning in 1987 and ending with 1991. The data are
grouped in three-month (quarterly) periods to better identify any population
trends.
Beds available. The number of available camp beds decreased annually from
1987 through 1989, from 4,136 to 3,994. In 1990, total beds increased to
4,082 and in 1991 increased again to 4,143. The recent increases are
primarily due to the opening of five camps in Los Angeles County's Challenger
camp complex in 1990.
Average daily population. Table 4 also shows that the statewide ADP in
1991 was 3,642, not much different than the ADP of 3,690 in 1987. This lack
of an increase occurred in spite of the opening of 540 beds in Los Angeles
County's Cha 11 enger Center. These beds have been counter- ba 1 anced by the
closure of eight camps between 1987 and 1991. See Appendix E for a list of
increases and decreases in camp beds since 1986. Over this five-year period,
the highest ADP--3,833--occurred in the second quarter of 1988, and the
1 owest--3,362--was registered in the fourth quarter of 1989. Appendix F
contains annual ADPs for the years 1987 through 1991, by individual camp.
Average occupancy rate. The average occupancy rate, or percentage of
available beds occupied, has remained remarkably consistent. It was 89.2% in
1987,90.8% in 1988,87.7% in 1989,88.1% in 1990, and 87.9% in 1991. This
would seem to indicate that, on the average, 10% to 12% of the statewide camp
beds are genera 11 y vacant. However, both ADP and occupancy rate vary across
counties. For instance, the 1991 occupancy rate in nine camps was 70% or
lower, whil e in 20 other camps, 100% occupancy was exceeded on one or more
days. Overcrowding is discussed in a following section.
9
501.rpt

Quarterly Period
1987 - 1st Quarter 2nd Q 3rd Q 4th Q
1987 Total
1988 - 1st Quarter 2nd Q 3rd Q 4th Q
1988 Total
1989 - 1st Quarter 2nd Q 3rd Q 4th Q
1989 Total
1990 - 1st Quarter 2nd Q 3rd Q 4th Q
1990 Total
1991 - 1st Quatter 2nd Q 3rd Q 4th Q
1991 Total
Admissions to Camps
TABLE 4
Statewide Camp Population Trends From 1987 to 1991, by Quarters
Beds Avail- Avg. %
Facility Overcrowding
No. of No. of Facil Hies
able ADP Occupancy Incidents w/Overcr.
4,144 3,692 89.1 216 13 4,131 3,799 92.0 431 16 4,131 3,719 90.0 462 17 4,138 3,550 85.8 336 16 4,136 3,690 89.2 1,445 19
4,141 3,667 88.6 410 14 4,141 3,833 92.6 551 19 4,141 3,765 90.9 459 18 4,085 3,728 91.3 477 17 4,127 3,749 90.8 1,897 23
4,010 3,656 91.2 262 15 4,010 3,576 89.2 254 15 3,990 3,503 87.8 131 14 3,967 3,362 84.8 106 7 3,994 3,502 87.7 753 22
3,965 3,392 85.5 124 7 4,007 3,598 89.8 376 19 4,192 3,694 88.1 328 18 4,161 3,694 88.8 430 19 4,082 3,596 88.1 1,258 25
4,229 3,736 88.3 256 16 4,147 3,683 88.8 303 19 4,104 3,585 87.4 251 17 4,093 3,565 87.1 242 15 4,143 3,642 87.9 1,052 23
There has been a recurri ng need for i nformat i on on the numbet of youths
admitted to camps. During 1987, the Research Division developed a form for
collecting data on admissions. This form was reviewed by the Probation
10 .~Ql. rpt

Institution Administrators Association and suggestions and recommendations
made by that group were incorporated into the form. In January 1988
probation camps were asked to begin submitting monthly reports providing the
following admission counts:
1. New court-ordered commitments from within county.
2. New commitments on contract from other counties.
3. Returns from field probation (including previous camp releases returned to camp on a new commitment).
4. Transfers in from other camps, particularly transfers from reception centers.
The intent of the system was to count the number of youths commi tted to
camp programs each year. However, it was discovered that some double-counting
had occurred in the first two years of reporting-1989 and 1990. At least two
counties-San Diego and Los Angeles-have more than one camp, one or more of
which serve as "reception centers.11 New commitments are initially sent to
these reception camps , usually for di agnost i c purposes, and then transferred
to another camp for program. To some degree, these youths may have been
counted twice: once by the reception camp and again when admitted to the camp
of final assignment.
The probl em surfaced duri ng 1990, too 1 ate to correct data that year.
Staff in various camps were instructed to count admissions to reception camps
as new commitments. When these cases were moved to camp of final destination,
the youths should be counted as incoming transfers. Camp admissions
identified as transfers are not included in the total count of admissions
shown in Table 5. It is believed that, beginning in 1991, the problem of
double-counting transfers has been eliminated. The statistics in Table 5 seem
to indicate an improvement in the accuracy of the count of camp commitments.
11
501.rpt

TABLE 5
Number of Total Admissions and Transfers to Camps, 1989 to 1991
Total Transferred Camps Reporting Year Admissions* Youths Transfers
1989 15,117 861 12 (6 in LA Co.)
1990 15,595 1,050 16 (13 in LA Co.)
1991 13,293 4,650 30 (19 in LA Co.)
*Excludin~ those identified as transfers.
These figures reflect an increase from 1989 to 1990 to 1991 in the number of
youths identified as transfers (from 861 to 1,050 to 4,650), and in the number
of camps reporting transfers (from 12 to 16 to 30). The overall reported
admissions decreased from over 15,000 to 13,293. This decrease most likely
reflects a decrease 'in double-counting rather than an actual decrease in
youths committed to camps. Data on number of admissions shown in Table 6
should probably not be compared with data for previous years, due to the
double-counting problem. Data for 1991 are considered reasonably accurate and
may be used as basel ine data for determining trends to be reported in future
years.
Number of admissions. With the preceding caveats in place, the reader is
directed to Table 6, which lists the number and percentage of each type of new
admission to the statewide group of camps during 1991.
transfers is not included in these statewide figures.
The number of
There were 13,293 admissions during 1991. Of this number, 11,182 (84.1%)
were new commitments, 131 were commitments from other counties, 1,644 were
probationers returned to camp, and 336 were other types of new admissions.
12 SOl.rpt

TABLE 6
Number and Percentage of Each Type of Admission to Probation Camps in 1991
N % MaTes
Total Admissions a 13,293 100.0 12,342
New Commitments 11,182 84.1 10,444
Contract Commitmentsb 131 1.0 114
Probationer Returns 1,644 12.4 1,460
Other New Admissions 336 2.5 324
Females
951
738
17
184
12
aTotal admissions does not include youths transferred into camp, as these were already counted as admissions.
bCommitments to a camp on contract from another county.
Admissions by camp. The number and type of admissions to each individual
camp is shown in Table 7. These figures include transfers into a camp from a
reception camp. In this way, the table reflects the total volume of youths
entering each individual camp, regardless of reason for admission.
The 336 youths listed under "Other New Admissions" in Table 6 are primarily
associated with two camps: San Diego's Rancho Del Campo and Ventura's Colston
School. For Rancho Del Campo, 270 youths were admitted to the "Short Term
Offenders Program." For Colston, 55 youths who had been removed from camp as
program failures were readmitted after rebooking and court appearance. It was
also found that the 131 contract commitments were located in 10 camps.
13 501.rpt

TABLE 7
Number and Type of Admissions to Probation Camps During 1991, by Individual Camp
Total New Contract Admis- Commit- Comrnit-
County/Camp sions Males Females ments ments Returns
Alameda Chabota 129 107 22 101 1 27 Los Cerros 320 320 0 236 0 54
Colusa Fouts Springs 100 100 0 77 19 4
Contra Costa Byron Soys Ranch 389 389 0 247 0 142
Del Norte Bar-a-Boys Ranch 47 47 0 9 28 3
Fresno Wakefield 544 544 0 441 0 103
Kern Camp Erwin W. Owen 414 414 0 412 0 2 Youth Facil ity 199 146 53 142 0 47
Los Angeles Camp Afflerbaugh 346 346 0 42 0 288 Camp Gonzales 279 279 0 0 0 0 Camp Holton 237 237 0 192 0 4 Camp Kilpatrick 300 300 0 56 0 10 Camp D. Kirby 180 115 65 180 0 0 Camp Mendenhall 313 313 0 0 0 0 Camp Miller 432 432 0 14 0 0 Camp Munz 306 306 0 14 0 0 Camp Paige 334 334 0 9 0 0 Camp Rockey 267 267 0 6 0 0 Camp Scott 467 467 0 0 0 0 Camp Scudder 370 . 370 0 45 0 19 Camp Barley Flats 27l 271 0 238 0 0 Louis Routh t 237 237 0 14 0 0 Lathrop Comm. Prog. 110 110 0 62 0 4 Ho 1 ton lI c 50 50 0 50 0 0 Camp Onizukad 2,112 2,112 0 2,091 0 0 Camp McNair
d 372 372 0 6 0 0
Camp Jarvis 2,144 2,144 0 2,126 0 0
14 501.rpt
Trans- Other New fers Admissions
0 0 30 0
0 0
0 0
7 0
0 0
0 0 0 0
16 0 279 0
41 0 234 0
0 0 313 0 418 0 292 0 325 0 256 5 467 0 306 0 33 0
222 1 44 0 0 0
21 0 366 0
18 0

TABLE 7 (Continued)
Total New Contract Admis- Commit- Commit- Trans- Other' New
County/Camp sions Males Females ments ments Returns fers Admissions
Los Angeles (Cont/d) Camp Resnik 291 45 246 207 0 12 72 0 Camp Smith 360 360 0 0 0 0 360 0
Orange I
Los Pinos 366 366 0 276 4 85 1 0 Joplin 240 240 0 45 9 184 2 0 Youth Guidance Ctr. 1,340 1,048 292 821 0 518 1 0
Placer Treatment Ctr. 77 77 0 59 0 18 0 0
Riverside Twin Pines 140 140 0 103 34 3 0 0 Van Horn 93 51 42 67 12 14 0 0
Sacramento Boys Ranch 329 329 0 329 0 0 0 0 Thornton Youth Ctr. 260 223 37 260 0 0 0 0
San Bernardino Regional Education 94 94 0 74 16 4 0 0 Kuiper Youth Ctr. 32 0 32 25 4 3 0 0
San Diego Rancho Del Rayo 463 463 0 0 0 0 463 0 Rancho Del Campod 960 960 0 588 0 44 58 270 Girls Rehab. Fac. 70 0 70 69 0 0 1 0
San Francisco Log Cabin 78 78 0 64 0 14 0 0
San Mateo Glenwood 122 122 0 121 0 1 0 0
Santa Barbara Los Prietos 121 121 0 98 4 14 0 5
Santa Clarg Wm. F. James 312 312 0 310 0 1 1 0 Harold Holden 304 304 0 303 0 0 1 0 Muriel Wright 145 1 88 57 145 0 0 0 0
15 501. rpt

TABLE 7 (Continued)
Total New Contract Admis- Commit- Commit- Trans- Other New
County/Camp sions Males Females ments ments Returns fers Admissions
Sonoma Sonoma Youth Camp 52 52 0 52 0 0 0 Sierra Youth Ctr. 51 38 13 51 0 0 0
Ventura Frank A. Colston 203 169 34 138 0 10 0 Juv. Rest. Project 171 155 16 167 0 2 2
aAlameda Chabot closed July 31, 1991.
bLos Angeles Lathrop moved all youths to Challenger Centers by February 7, 1991.
cLos Angeles Holton II closed February 15, 1991.
dOperates as a reception camp.
Facility Overcrowding
One purpose of collecting population data from county camps is to allow
monitoring of overcrowding in these facilities. Overcrowding is defined two
ways. Fi rst, overcrowd i ng occurs when the popul at i on of a fac il ity exceeds
its maximum legal rated capacity by one or more youths on one or more days.
Second, it occurs when individual living units exceed their capacity, as based
on state standards governing the operation of youth facilities. When the
population of an individual living unit exceeds its rated capacity,
overcrowdi ng is cons i dered to have occurred, even if total facil ity capaci ty
has not been exceeded.
The Parole Services and Community Corrections Branch of the Youth Authority
closely monitors the daily population of all county juvenile facilities. When
overcrowding in a facility occurs on more than 15 days during any consecutive
30-day period, a Branch consultant contacts staff of the facil ity and works
16
501.rpt
0 0
55 0
with them to identify causes of the overcrowding and to develop plans and
procedures for reducing or eliminating the overcrowding problem.
Table 8 lists those facilities that had one or more days when the total
facility population exceeded capacity. Twenty-three (23) facilities had one
or more days of overcrowding, for a total of 1,052 daily incidents. Seventeen
(17) of the 23 camps with overcrowding are located in Los Angeles County. In
recent years, the overcrowdi ng rate was 1 east frequent in 1989, when there
were 753 occurrences. Number of days of overcrowdi ng has fl uctuated up and
down. Generally, however, overcrowding occurred less frequentlj in the three
most recent years (1989, 1990, and 1991) than it did in the preceding years
(1987 and 1988). The figures are 1,445 in 1987, 1,897 in 1988, 753 in 1989,
1,258 in 1990, and 1,052 in 1991 (see Table 4).
Table 9 displays the second measure of overcrowding-the number of days
that any individual living unit exceeded its legal rated capacity. There were
1,116 such incidents in 1991. Occasionally, overcrowding may be counted more
often in total f;;l,cilities than in living units. The explanation for this
seeming anomaly is that some camps have "floating" unit capacities, which, in
aggregate, may exceed the capacity for the total camp. For example, a camp
with a maximum facility capacity of 100 may have two living units with maximum
capacities of 60 beds each. This means that either unit may have up to 60
youths in residence as long as the combined population in the two units does
not exceed the maximum facility capacity of 100. Camps known to be operating
under this condition are Camp Owen in Kern County, Los Pinos in Orange County,
and Los Angeles County Camps Gonzales, Kilpatrick, and Rockey.
17
SOl.rpt

Facilities
Contra Costa Byron Boys Ranch
los Angeles· Camp Afflerbaugh Camp Gonzales Camp Holton Camp Kil patri ck Camp Mendenhall Camp Munz Camp Paige Camp Rockey Camp Scott Camp Scudder Barley Flats Louis Routh Camp Onizuka Camp McNair Camp Jarvis Camp Resnik Camp Smith
Placer Placer Juv. Ctr.
Sacramento Thornton Youth Ctr.
San Diego Rancho Del Rayo Rancho Del Campo Girls Rehab. Fac.
TOTAL
SOl.rpt
TABLE 8
Number of Days That Total Facility Population Exceeded Maximum Legal Rated Capacity
During 1991, by Month
DAYS OF TOTAL FACILITY OVERCROWDING
Jan Feb Mar Apr May Jun Jul Aug Sep Oct
1 1
7 6 14 15 24 19 15 14 16 5 5 1 13 6 10 21 9 2 3
13 5 10 4 9 7 2 1 9 3
1 6 3 1 4 6 5 2 2 2 5
18 2 1 1 4 1 1 1
1 5 14 15 2 3 4 7 4 1 6 2 2 1 1 6
2 1 5 2 3 6 4 1 1 22 6 12 1 1 8 5 22 9 10
9 4 2 5 8 3 8 1 1
7 1 3 5 4 11
9 7
30 6 1 2
1 1
18 19 12 27 31 30 31 31 17
105 67 84 135 81 87 116 89 46 66
18
Nov Dec Total
2
4 11 4 132
6 6 82 18 11 89 2 5 10 3 2 16 1 27
28 1
11 10 72 5 6 34 3 13 8 19 82 5 10 71
11 13 63 2
6 7 44
16
39
1 1
216
83 93 1,052

Facil ities
Alameda Los Cerros
Contra Costa Byron Boys Ranch
Kern ~rn Youth Center
Los Angeles Camp Afflerbaugh Camp Gonzales Camp Holton Camp Kil patri ck Camp D. Kirby Camp Mendenha 11 Camp Munz Camp Paige Camp Rockey Camp Scott Camp Scudder Barley Flats Louis Routh Camp Onizuka Camp McNair Camp Jarvis Camp Resnik
Placer Placer Juv. Ctr.
Sacramento
TABLE 9
Number of Days That Maximum Legal Rated Capacity Was Exceeded in Any Living Unit
During 1991, by Month
DAYS OF LIVING UNIT OVERCROWDING
Jan Feb Mar Apr May Jun Jul Aug Sep Oct
7 1 1
1 1
17 28
7 1 1 7 5 1 1 2
23 23 31 19 29 30 26 24 20 23 6 7
1 1 3
1 6 3 1 4 6 5 2 2 2 5 4 1 4
1 1 5 14 15 2 3 4 7
13 6 7 14 22 14 ,.. 4 18 19 ~
2 6 5 16 12 2 2 6 4 2 1 2 2 10 3
1 2 1 1 1 1
1 8
9 7
Thornton Youth Ctr. 30 6 1 2
San Diego Rancho Del Rayo 1 2 1 1 Rancho Del Campo 1 Girls Rehab. Fac. 18 19 12 27 31 30 31 31 17
Santa Clara Muriel Wright 1
TOTAL 120 106 94 130 III 82 84 80 68 65
19
Nov Dec Total
9
2
45
4 11 1 19
·25 29 302 16 11 40
2 2 5 10 3 2 16 1 27
9 1
11 10 72 23 16 165 9 66 2 20
1 2 4 1 11
9
16
39
5 1
216
1
100 76 1,116
501.rpt

-I
20
SOl.rpt

APPENDIX A
Brief History of County Camp System
The first county facility for children "in conflict with their community,"
the San Francisco Industrial School, opened its doors in 1859 and, due to
financial difficulties, closed them in 1892. California was then without
institutions for juvenile offenders until 1927, when Riverside County opened a
"road camp." In 1932, Los Angel es County establ i shed a forestry camp for
transient youths. This concept worked so well that legislation for
establishing other such camps was enacted the same year. By 1945, the number
of these forestry or conservation camps had grown to 11, wi th 690 beds.
Gradually, camps were recognized as a possible medium for rehabilitation.
This spurted expansion in counseling and education services which, in turn,
increased camp costs.
The first state subsidy program for local camps was initiated in 1945, with
a monthly payment to counties of $50 per child admitted to their facilities.
The amount was increased to $80 in 1949 and to $95 in 1953. In 1957, further
legislation provided matching state funds for construction of county camps,
ranches, or schools for youthful offenders. By 1964, there were 41 camps in
22 counties providing beds for 2,842 young persons. 1
In 1965, the Probation Subsidy Program was enacted and provided $4,000 for
each youth considered a potential state commitment retained in the community.
The Subsidy Program was replaced by the County Justice System Subvention
Program in 1978, which in that year distributed $55 million to county
governments. In 1982, the subvention method was changed to a block grant
lCalifornia Correctional System Study. State Board of Corrections, July 1971.
21 S01.rpt
system, and reached a cost of $67.3 million in Fiscal Year 1988-89. The
subvention program was phased out after the 1989/90 Fiscal Year.
In recent years, bond acts have been used as a means of providing revenue
for county juvenile facilities. Proposition 52, the County Correctional
Facility Capital Expenditure Bond Act of 1986, provided $50 million.
Proposition 86, the County Correctional Facilities Capital Expenditure and
Youth Facil ity Bond Act of 1988, provided $65 mill ion. These bond acts
provided funds not only for camps, but al so for juvenil e hall s and other
proposed special facilities. Some of these funds were distributed on a per
capita basis while others were provided based on the results of a statewide
juvenile facilities needs assessment.· The funds were available for building,
maintenance, and repair to meet health and safety standards, and for
construction or modificCltion of facilities to ameliorate chronic crowding
problems. The bond funds were also available to counties without facilities
for the construction of special purpose juvenile halls.
22 501.rpt

" ,
APPENDIX 8
POPULATION MONITORING REPORT
FORM VA 10.408
23

24

SfAT£ OF CALIFORNIA APPENDIX B Prqmed by: DEPARTMENT OF THE yourn AUfHORITY JUVENILE CAMPS, RANCHES, AND HOMES POPULATION REPORT YA 10.408 (3/88) flnstructions on Reverse Side) Telephon.'
County/FacUity Coonty Code FacUity Code Facility MIX. Capacity Dale: (9 - 12) (I - 2) (3 - S) (6-8) MoDlh Yw
I I I I I I ,
I I I I I I I I I I
CYA UNIT DESIGNATION A B C 0 E F 0 H J J
UNIT MAXIMUM CAPACITY
DAn..YTOTALS D.~IL Y USIT POI'L'LATIOSS
DAT£ TOTAL MAlE FEMALE (13 -14) (15 -17) (18 - 20) (21 - 23) (24 - 26) (27 - 29) (30 - 32) (33 - 35) (36 -38) (39 - 41) (42 - 44) (45 - ~7) (48 -50) (51- 53)
01
02
OJ
001
05
06
fJ/
--08 i
.0-
09 I J
10 I I II i 12 I
:
13 ! I I -I
I' I
IS ! ,
16 j , 17
18
19
20 I I I
21
22
23
24
2S
26
27
28
29
30
31
25

I INSTRUCTIONS FOR JUVENILE CAMPS, RANCHES, OR HOMES POPULATION REPORT
This report may be typed or hand written. however, if done by hand, special care must be taken to ensure that it is clear and easy to read. Population detennination will be actual count in each living unit at 12:01 a.m. daily. Completed forms for each month are to be submitted by the 10th of the following month to:
COUNTY IF ACILITY
Chief, Division ofField Services Department of the Youth Authority
4241 Williamsbourgh Drive Sacramento, California 95823
Enter name ot; county and facility and then fill in the codes for county and facility. These are the stan-dard codes and may be obtained from the Youth Authority.
FACILITY MAXIMUM CAPACITY Enter maximum rated facility capacity in appropriate box,
DATE Enter the month and year using a four-did,it code. For example, January 1988 would be entered as 0188;
November would be 1188,
UNIT MAXIMUM CAPACITY Enter maximum capacity for each living unit in columns A, B, C, et,~, The same units should appear in
the same columns each month. For example, if your Unit I is listed in form column A, it should 'appear in that column each month.
Note. If facility or unit capacities change during the month, please attach note. 0, memorandum indicating date and nature of change.
DAILY TOTALS Enter total facility population and total number of male and female residents. For facilities consisting of
a single living unit, no further populati0n information need be entered, For facilities with two or more units, please complete daily unit populations,
DAILY UNIT POPULATIONS Enter population for each living unit. Sum of unit populations must equal daily total population shown
in columns 15-17.
Note. Because these data are to be entered into a computer file, population entries must contain three (3) digits. For example, if actual number is 45, u&e a leading zero by writing "045".
YA10,oIOI
26
N -.J
Facil ities
Alameda Chabot Los Cerros
Colusa l Solano l Yolo Fouts Springs
Contra Costa Byron Boys Ranch
Del Norte Bar-O-Boys Ranch
Fresno C. K. Wakefield
Kern Camp Erwin W. Owen Youth Facil ity
Los Angeles Camp Afflerbaugh Camp Gonzales Camp Karl Holton Camp Kilpatrick Camp D. Kirby Camp Mendenhall Camp Miller Camp Munz Camp Paige Camp Rockey
Max. Pop. Limit
90a 100/125b
60
74
42
60
125 72c
116 125 125 119 100 105 115 105 116 125
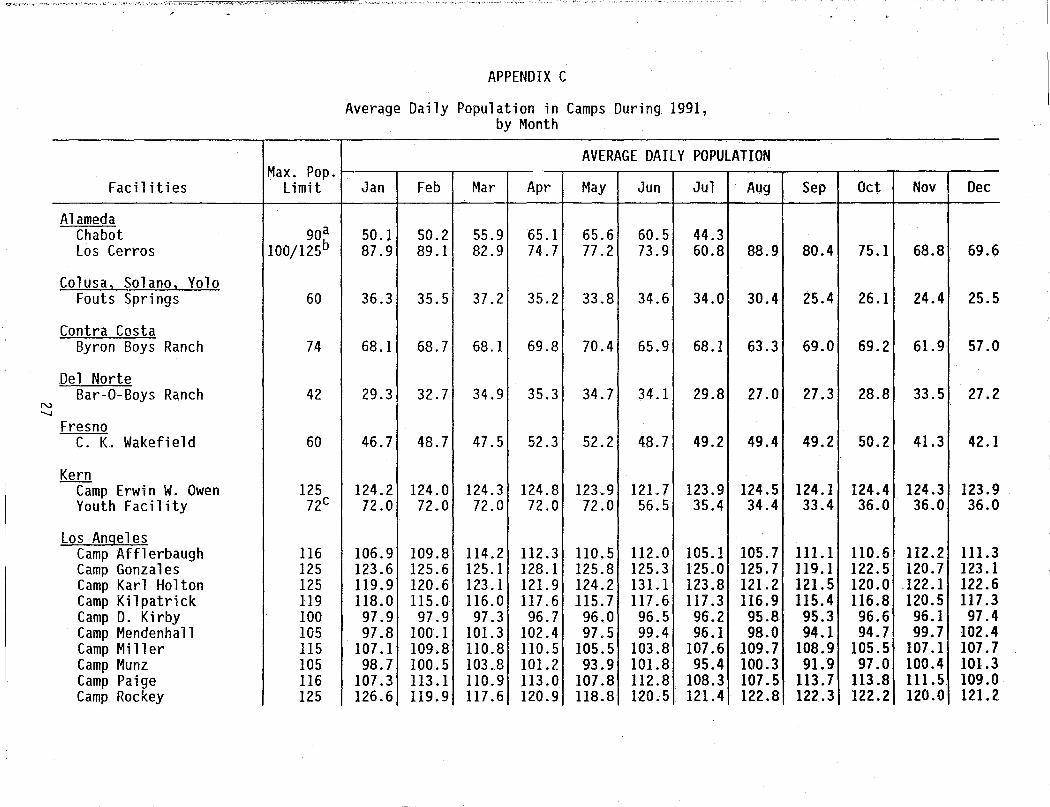
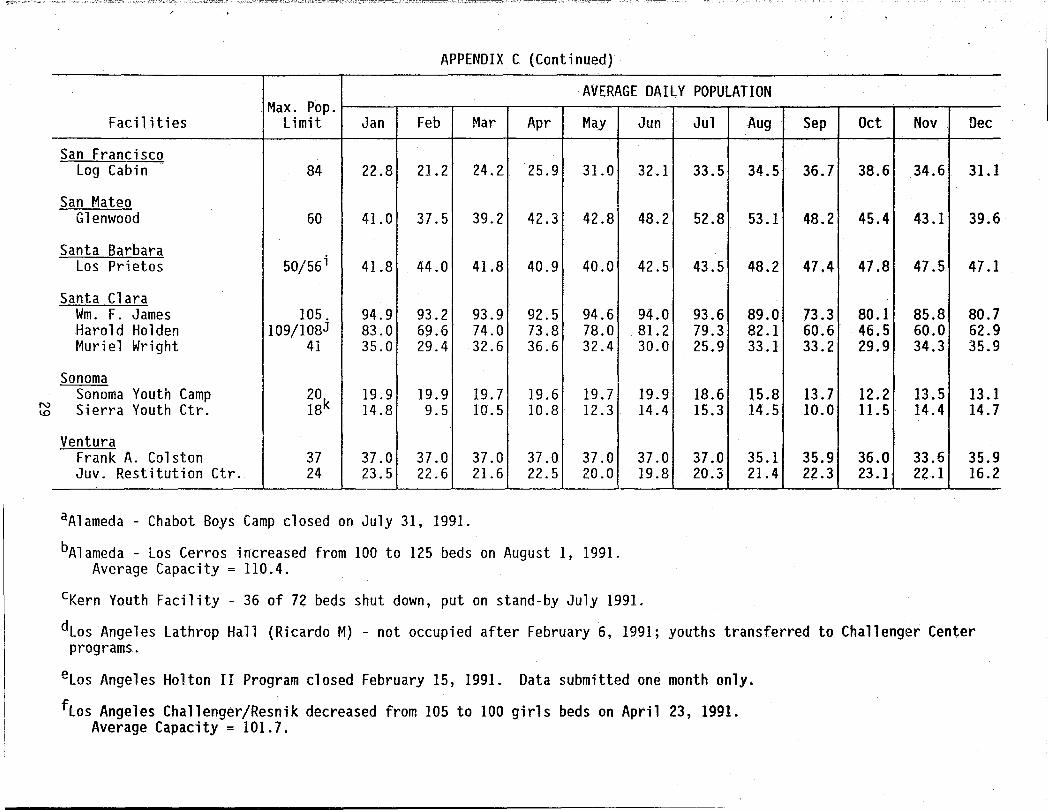
APPENDIX C
Average Daily Population in Camps During 1991, by Month
AVERAGE DAILY POPULATION
Jan Feb Mar Apr May Jun Jul Aug
50.1 50.2 55.9 65.1 65.6 60.5 44.3 87.9 89.1 82.9 74.7 77 .2 73.9 60.8 88.9
,
36.3 35.5 37.2 35.2 33.8 34.6 34.0 30.4
68.1 68.7 68.1 69.8 70.4 65.9 68.1 63.3
29.3 32.7 34.9 35.3 34.7 34.1 29.8 27.0
46.7 48.7 47.5 52.3 52.2 48.7 49.2 49.4
124.2 124.0 124.3 124.8 123.9 121. 7 123.9 124.5 72.0 72.0 72.0 72.0 72.0 56.5 35.4 34.4
106.9 109.8 114.2 112.3 110.5 112.0 105.1 105.7 123.6 125.6 125.1 128.1 125.8 125.3 125.0 125.7 119.9 120.6 123.1 121. 9 124.2 131.1 123.8 121.2 118.0 115.0 116.0 117.6 115.7 117.6 117.3 116.9 97.9 97.9 97.3 96.7 96.0 96.5 96.2 95.8 97.8 100.1 101.3 102.4 97.5 99.4 96.1 98.0
107.1 109.8 110.8 110.5 105.5 103.8 107.6 109.7 98.7 100.5 103.8 101.2 93.9 101.8 95.4 100.3
107.3 113.1 110.9 113.0 107.8 112.8 108.3 107.5 126.6 119.9 117.6 120.9 118.8 120.5 121.4 122.8
Sep Oct Nov Dec
80.4 75.1 68.8 69.6
25.4 26.1 24.4 25.5
69.0 69.2 61.9 57.0
27.3 28.8 33.5 27.2
49.2 50.2 41.3 42.1
124.1 124.4 124.3 123.9 33.4 36.0 36.0 36.0
111.1 110.6 112.2 111.3 119.1 122.5 120.7 123.1 121.5 120.0 122.1 122.6 115.4 116.8 120.5 117.3 95.3 96.6 96.1 97.4 94.1 94.7 99.7 102.4
108.9 105.5 107.1 107.7 91.9 97.0 100.4 101.3
113.7 113.8 111.5 109.0 122 .. 3 122.2 120.0 121.2

f',)
co
Facil ities
Camp Scott Camp Scudder Barley Flats Louis Routh Lathrop Camp Holton II Camp Onizuka Camp McNair Camp Jarvis Camp Resnik Camp Smith
Orange Los Pinos Joplin Youth Guidance Center
Placer Treatment Center
Riverside Twin Pines Van Horn
Sacramento Boys Ranch Thornton Youth Center
San Bernardino Regional Education Kuiper Youth Center
San Diego Rancho Del Rayo Rancho Del Campo Girls Rehab. Fac.
Max. Pop. Limit Jan
116 105.8 105 101.1 92 86.8 90d
77 .0 67 34.4 30e 19.9
110 101.6 110 100.9 110 99.8
105/l00f 97.9 110 80.5
125 117.6 60 59.7
125 113.2
20 17 .2
70 57.6 44 37.2
100 80.1 50 52.0
40 37.1 44/20g 14.3
106 99.5 100 86.3
20/30h 21.3
APPENDIX C (Continued)
AVERAGE DAILY POPULATION
Feb Mar Apr May Jun Jul Aug Sep Oct Nov Dec
111.6 108.5 108.6 106.0 102.1 107.2 109.4 106.8 103.5 103.8 104.1 101.3 104.5 105.4 99.5 100.7 99.7 100.6 103.2 102.7 104.6 102.4 87.0 86.1 89.9 88.3 88.4 87.4 85.6 87.4 88.8 89.8 88.2 84.1 87.9 88.2 85.9 85.1 87.1 85.0 84.1 87.1 88.2 83.2 27.5
108.1 107.3 99.9 92.3 95.8 113.4 108.3 100.4 110.4 -109.2 111.9 99.8 102.4 106.7 102.2 106.4 111.5 108.9 108.8 104.7 108.1 106.2
110.2 106.7 98.1 94.5 96.4 108.9 107.7 101.3 107.4 109.0 110.0 96.8 99.4 89.7 72.3 71.4 79.1 76.9 72.3 86.3 93.8 93.8 99.4 102.5 106.6 104.5 95.7 95.3 106.4 105.2 108.6 105.8 106.4
122.8 120.3 113.1 114.5 111.6 105.5 109.6 113.6 122.9 119.6 115.7 59.1 57.6 56.8 57.9 54.5 56.2 55.7 56.4 59.2 58.5 53.5
118.5 119.3 116.8 112.6 110.9 113.2 117.3 112.2 118.7 115.9 104.3
17.6 19.6 18.8 18.9 17 .4 17.3 15.3 13.2 13.7 14.1 15.4
62.5 54.9 50.5 43.5 37.4 41.3 41.6 43.0 48.5 47.9 50.3 36.3 35.9 30.9 27 .5 25.7 28.6 30.9 34.1 35.6 39.6 40.1
82.6 91.0 92.4 90.0 92.9 90.1 88.3 78.2 78.2 71.4 69.1 48.4 48.9 47.4 47.8 48.0 47.3 45.1 41.9 42.6 45.9 40.1
37.6 39.1 37.2 38.7 37.5 37.5 36.5 36.5 31.6 31.2 35.3 12.8 13.2 13.8 15.5 17.1 17.0 16.9 13.2 13.2 15.8 16.3
97.5 103.6 103.6 103.1 103.1 102.8 104.3 104.3 103.5 103.3 101.7 86.1 96.0 96.7 94.2 91.1 95.1 96.9 95.6 95.4 96.7 92.4 21.5 19.5 22.1 23.1 24.0 24.2 27.4 28.3 30.0 30.0 30.0
~,.,,"r·_
N lO
w '" __ . ~>, .~ .C,' ~,~.-- -. <~ ,,_,~ ·c~, .. '_ ~ ,. ~,,(.~.,. " ._,,.-.. .. ,' .. ' ___ , , .. ~ .. ,
APPENDIX C (Continued)
AVERAGE DAILY POPULATION Max. Pop.
Facil ities Limit Jan Feb Mar Apr May Jun Jul Aug Sep Oct Nov Dec
San Francisco Log Cabin 84 22.8 21.2 24.2 25.9 31.0 32.1 33.5 34.5 36.7 38.6 34.6 31.1
San Mateo Glenwood 60 41.0 37.5 39.2 42.3 42.8 48.2 52.8 53.1 48.2 45.4 43.1 39.6
Santa Barbara 50/56 i Los Prietos 41.8 44.0 41.8 40.9 40.0 42.5 43.5 48.2 47.4 47.8 47.5 47.1
Santa Clara Wm. F. James 105. 94.9 93.2 93.9 92.5 94.6 94.0 93.6 89.0 73.3 80.1 85.8 80.7 Harold Holden 109/108J 83.0 69.6 74.0 73.8 78.0 81.2 79.3 82.1 60.6 46.5 60.0 62.9 Muriel Wright 41 35.0 29.4 32.6 36.6 32.4 30.0 25.9 33.1 33.2 29.9 34.3 35.9
Sonoma Sonoma Youth Camp 20
k 19.9 19.9 19.7 19.6 19.7 19.9 18.6 15.8 13.7 12.2 13.5 13 .1
Sierra Youth Ctr. 18 14.8 9.5 10.5 10.8 12.3 14.4 15.3 14.5 10.0 1l.5 14.4 14.7
Ventura Frank A. Colston 37 37.0 37.0 37.0 37.0 37.0 37.0 37.0 35.1 35.9 36.0 33.6 35.9 Juv. Restitution Ctr. 24 23.5 22.6 21.6 22.5 20.0 19.8 20.3 21.4 22.3 23.1 22.1 16.2
aAlameda - Chabot Boys Camp closed on July 31, 1991.
bAlameda - Los Cerros increased from 100 to 125 beds on August 1, 1991. Average Capacity = 110.4.
cKern Youth Facility - 36 of 72 beds shut down, put on stand-by July 1991.
dLos Angeles Lathrop Hall (Ricardo M) - not occupied after February 6, 1991; youths transferred to Challenger Center programs.
eLos Angeles Holton II Program closed February 15, 1991. Data submitted one month only.
fLos Angeles Challenger/Resnik decreased from 105 to 100 girls beds on April 23, 1991. Average Capacity = 101.7.
w <:)
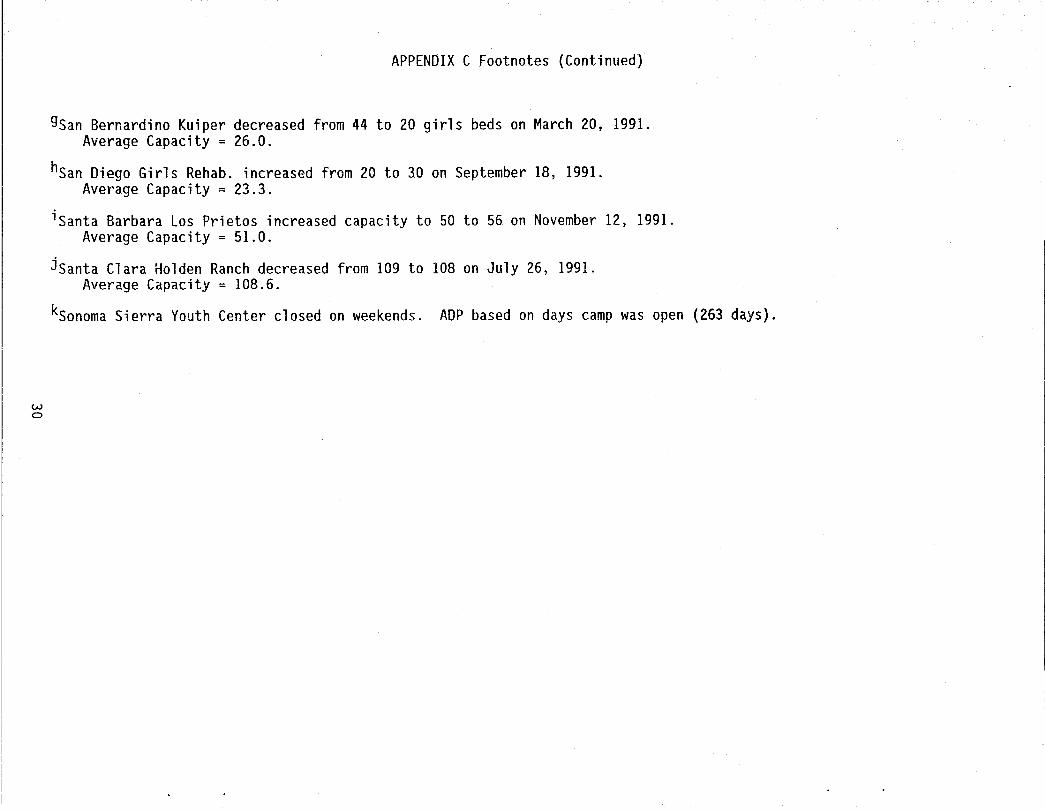
APPENDIX C Footnotes (Continued)
gSan Bernardino Kuiper decreased from 44 to 20 girls beds on March 20, 1991. Average Capacity = 26.0.
hSan Diego Girls Rehab. increased from 20 to 30 on September 18, 1991. Average Capacity = 23.3.
iSanta Barbara Los Prietos increased capacity to 50 to 56 on November 12, 1991. Average Capacity = 51.0.
jSanta Clara Holden Ranch decreased from 109 to 108 on July 26, 1991. Average Capacity = 108.6.
kSonoma Sierra Youth Center closed on weekends. ADP based on days camp was open (263 days).

APPENDIX D
Probation Camps Classified as Secure as of December 1991
County and Camp
Fresno - Wakefield School
Kern - Youth Facility
Los Angeles - Gonzales
Los Angeles - Holton
Los Angeles - Kilpatrick
Los Angeles - Kirby
Los Angeles - Rockey
Los Angeles - Onizuka
Los Angeles - McNair
Capacity County and Camp Capacity
60 Los Angeles - Jarvis 110
110
100
72 Los Angeles - Smith
125 Los Angeles - Resnick
125
119
100
125
110
110
San Bernardino - Reg. Ed. Ctr. 40
San Bernardino - Kuiper Ctr. 20
San Diego - Girls Rehab. 30
Sonoma - Sierra Youth Ctr. 18
Ventura - Colston 37
Total Secure Camp Beds 1,411
Definition of Secure Facility
A secure facility has either or both a locked perimeter (fence, wall,
etc.) and locked living units or individual rooms. All of the above
facilities have locked perimeters, with the exception of the Sonoma Sierra
Youth Center. All of the facilities have locked rooms or living units. Not
all living units or rooms within a facility are locked. Camp Rockey in
Los Angeles County has one locked unit and one that is not locked. This type
of mixture appl ies to several camps. However, since these units are located
within a locked perimeter, the camp is classified as secure. Sonoma County's
Sierra Youth Center, with no locked perimeter, only locks its rooms at night.
31
S02.rpt

32 S02.rpt

APPENDIX E
Camp Capacity Changes Since 1986
1986 - lnyo closed its girls facility. Los Angeles added 24 beds to 3 camps. Orange opened a 20-bed facility for girls and added 10 beds to its Youth Guidance Center. San Bernardino opened the 40-bed Regional Education Center. San Diego added 6 beds to Rancho Del Rayo.
1987 - Mono's Camp O'Neal closed. Orange's Girls Re-entry was changed to boys Short-Term and gained 10 beds. Riverside Crossroads ceased functioning as a camp program.
1988 - Tulare's Camp Meyers closed 55 beds. Orange's Boys Short-Term closed 30 beds, but transferred 29 of them to Los Pinos. The 100 beds of the Los Angeles Special Treatment Program were returned to San Fernando Juvenile Hall as of December 31, 1988.
1989 - Contra Costa Boys Preplacement Center (20 beds) closed. LA's Camp Holton increased by 25 beds. Camp Holton II opened 30 beds and closed all 30 beds during the year.
1990 - Contra Costa Girls Center (19 beds) closed. LA's Mira Lorna - North and Mira Lorna - South closed. LA's Holton II program was in operation for part of the year. LA's Challenger Center Camps Onizuka, McNair, Jarvis, and Resnik opened. San Bernardino's Verdemont closed. San Diego's Rancho del Campo added 50 beds. San Mateo's Camp Glenwood closed 4 beds. Santa Barbara's Los Prietos added 5 beds. Santa Clara's James Ranch added 7 beds.
1991 - Alameda's Chabot Boys' Camp closed. Alameda's Los Cerros added 25 beds. Los Angeles' Lathrop Hall (Ricardo M) vacant most of year. Los Angeles' Holton II Program closed. Los Angeles' Resnick closed 5 beds. San Bernardino's Kuiper closed 24 beds. San Diego's Girls Rehab. Ctr. added 10 beds. Santa Barbara's Los Prietos added 6 beds. Santa Clara's Holden Ranch closed 1 bed.
33 502.rpt

34
502.rpt
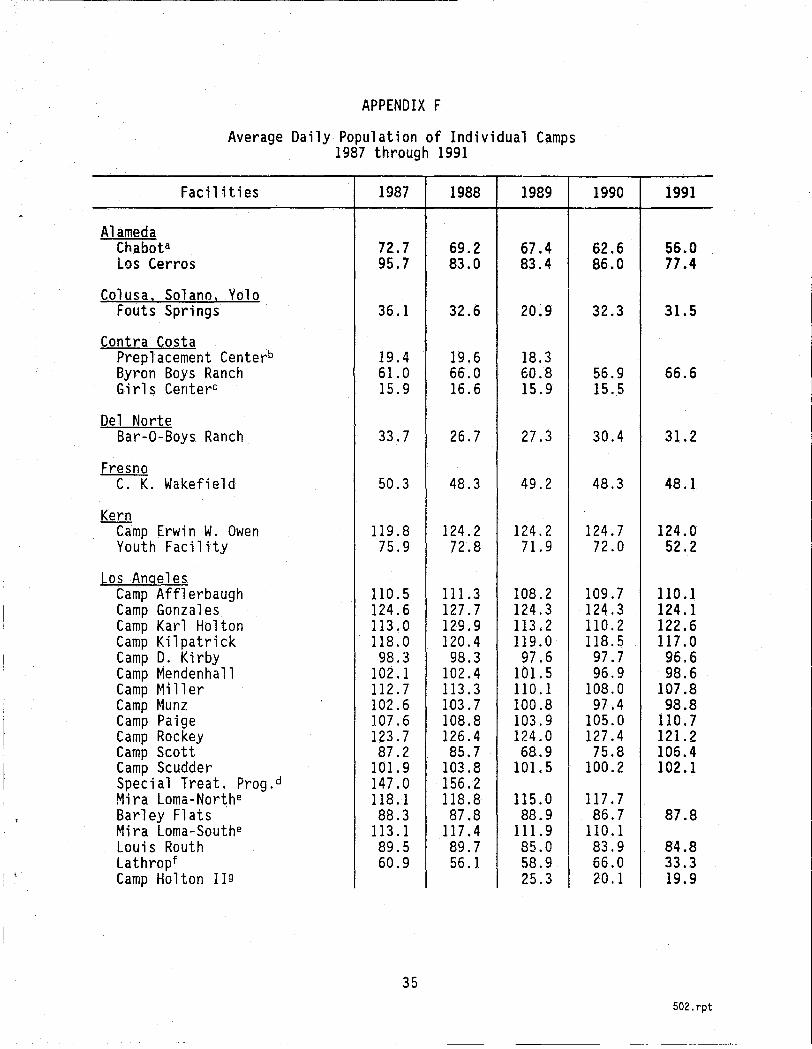
APPENDIX F
Average Daily Population of Individual Camps 1987 through 1991
Facilities 1987 1988 1989
Alameda Chabota 72.7 69.2 67.4 Los Cerros 95.7 83.0 83.4
Colusa 2 Solano 2 Yolo Fouts Springs 36.1 32.6 20.9
Contra Costa Preplacement Centerb 19.4 19.6 18.3 Byron Boys Ranch 61.0 66.0 60.8 Girls Centerc 15.9 16.6 15.9
Del Norte Bar-O-Boys Ranch 33.7 26.7 27.3
Fresno C. K. Wakefield 50.3 48.3 49.2
Kern Camp Erwin W. Owen 119.8 124.2 124.2 Youth Faci 1 ity 75.9 72.8 71.9
Los Angeles Camp Afflerbaugh 110.5 111.3 108.2 Camp Gonzales 124.6 127.7 124.3 Camp Karl Holton 113.0 129.9 113.2 Camp Kilpatrick 118.0 120.4 119.0 Camp D. Kirby 9S.3 9S.3 97.6 Camp Mendenhall 102.1 102.4 101. 5 Camp Mi 11 er 112.7 113.3 110.1 Camp Munz 102.6 103.7 100.S Camp Paige 107.6 10S.S 103.9 Camp Rockey 123.7 126.4 124.0 Camp Scott 87.2 85.7 6S.9 Camp Scudder 101. 9 103.8 101. 5 Special Treat. Prog. d 147.0 156.2 Mira Loma-Northe 118.1 118.S 115.0 Barley Flats 8S.3 87.8 8S.9 Mira Loma-Southe 113.1 117.4 111. 9 Louis Routh 89.5 89.7 85.0 Lathropf 60.9 56.1 58.9 Camp Holton II9 25.3
35
1990 1991
62.6 56.0 86.0 77 .4
32.3 31.5
56.9 66.6 15.5
30.4 31.2
48.3 48.1
124.7 124.0 72.0 52.2
109.7 110.1 124.3 124.1 110.2 122.6 118.5 117.0 97.7 96.6 96.9 98.6
10S.0 107.8 97.4 98.8
105.0 110.7 127.4 121. 2 75.8 106.4
100.2 102.1
117.7 86.7 87.8
110.1 83.9 84.8 66.0 33.3 20.1 19.9
502.rpt
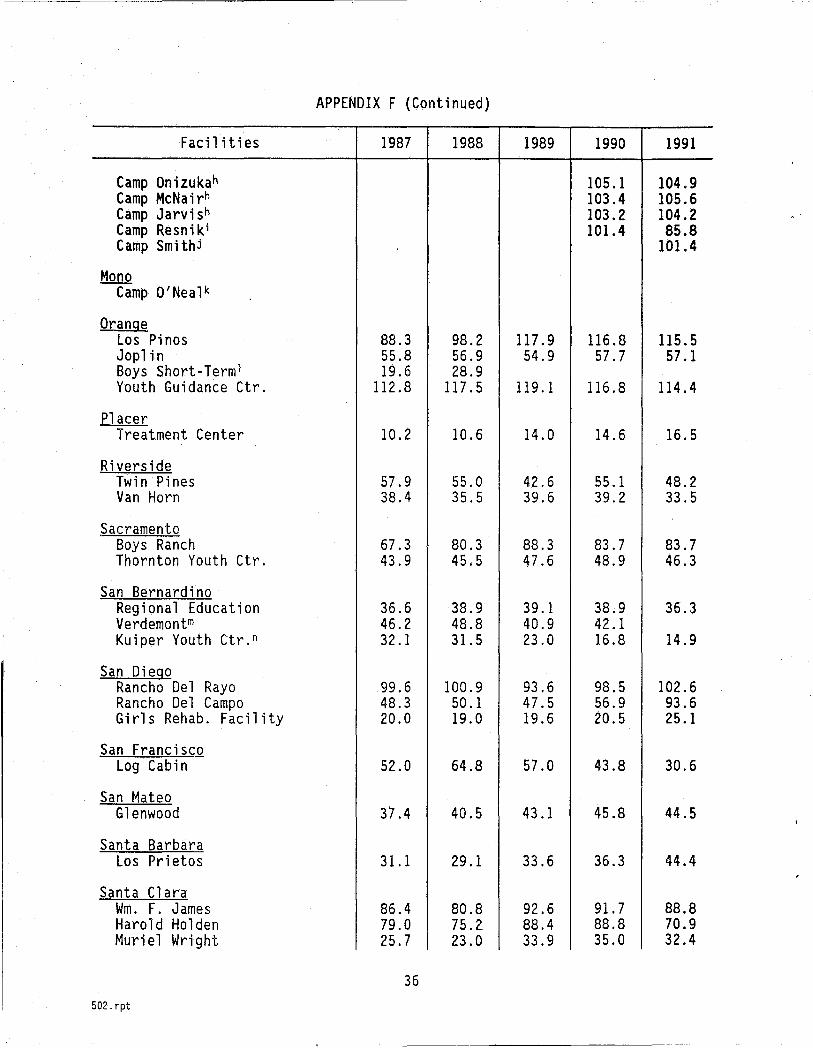
APPENDIX F (Continued)
Facil ities 1987 1988 1989 1990 1991
Camp Onizukah 105.1 104.9 Camp McNairh 103.4 105.6 Camp Jarvish 103.2 104.2 Camp Resni ki 101.4 85.8 Camp Smithj 101.4
Mono Camp O'Neal k
Orange Los Pinos 88.3 98.2 117.9 116.8 115.5 Joplin 55.8 56.9 54.9 57.7 57.1 Boys Short-Term' 19.6 28.9 Youth Guidance Ctr. 112.8 117.5 119.1 116.8 114.4
Placer Treatment Center 10.2 10.6 14.0 14.6 16.5
Riverside Twin Pines 57.9 55.0 42.6 55.1 48.2 Van Horn 38.4 35.5 39.6 39.2 33.5
Sacramento Boys Ranch 67.3 80.3 88.3 83.7 83.7 Thornton Youth Ctr. 43.9 45.5 47.6 48.9 46.3
San Bernardino Regional Education 36.6 38.9 39.1 38.9 36.3 Verdemont rn 46.2 48.8 40.9 42.1 Kuiper Youth Ctr.n 32.1 31.5 23.0 16.8 14.9
San Diego Rancho Del Rayo 99.6 100.9 93.6 98.5 102.6 Rancho Del Campo 48.3 50.1 47.5 56.9 93.6 Girls Rehab. Facility 20.0 19.0 19.6 20.5 25.1
San Francisco Log Cabin 52.0 64.8 57.0 43.8 30.6
San Mateo Glenwood 37.4 40.5 43.1 45.8 44.5
Santa Barbara Los Prietos 31.1 29.1 33.6 36.3 44.4
Santa Clara Wm. F. James 86.4 80.8 92.6 91.7 88.8 Harold Holden 79.0 75.2 88.4 88.8 70.9 Muriel Wright 25.7 23.0 33.9 35.0 32.4
36 S02.rpt

APPENDIX F (Continued)
Facil ities 1987 1988 1989
Sonoma Sonoma Youth Camp 15.8 19.3 17 .9 Sierra Youth Ctr.o 12.8 14.5 15.8
Tulare Camp Meyersp 30.6 35.5
Ventura Frank A. Colston 34.0 36.3 36.7 Juv. Re$titution Project 16.3 19.1 17.3
STATEWIDE (Avg.) 3,690 3,749 3,502
aAlameda's Chabot closed July 31, 1991.
bContra Costa's Preplacement Center closed November 1, 1989.
cContra Costa's Girls Center closed October 10, 1990.
1990
19.3 11.9
36.9 20.5
3,596
dLos Angeles' Special Treatment Program closed December 31, 1988.
eLos Angeles' Camps Mira Lorna-North and South closed May 13,1990.
1991
17 .1 12.7
36.3 21.3
3,642
fLos Angeles' Lathrop moved all youths to the Challenger Center February 7, 1991.
gLos Angeles' Camp Holton II opened January 1, 1989 and closed August 12, 1989. Reopened July 16, 1990 and closed February 15, 1991. No report for February.
hLos Angeles' Camps Onizuka, McNair, and Jarvis opened May 14, 1990.
iLos Angeles' Camp Resnik opened July 1, 1990.
jLos Angeles' Camp Smith opened December 23, 1990. No data for 1990.
kMono's Camp O'Neal closed March 1, 1987.
lOrange's Los Amigos closed June 1985, reopened as Girls Re-entry January 1986, then in November 1986 changed to Boys Short-Term then closed October 16, 1988.
mSan Bernardino's Verdemont closed September 20, 1990.
nSan Bernardino's Kuiper closed on weekends in 1989. ADP based on days camp was open.
.37 502.rpt
°Sonoma's Adolescent Center changed its name to Sierra Youth Center. In 1991, closed weekends. ADP based on days camp was open.
PTulare's Meyers Youth Center closed September 30, 1988.
38
S02.rpt