Embed Size (px)
Citation preview

2003 AGA Report i October 2002Berkeley Rent Stabilization Board Seifel Consulting Inc.
EXECUTIVE SUMMARY
The analysis presented in this report provides a basis for determining an equitable annual generaladjustment (AGA) on 2003 rents in the City of Berkeley. The result of this analysis is intended to serve asa guideline for the City of Berkeley Rent Stabilization Board. It is based on the City’s establishedmethodology that calculates the overall in rent necessary to cover annual changes in operating costs.
Changes in operating expenses can vary significantly between a building where the landlord isresponsible for covering gas and electric costs for all units and a building where each unit is individuallymetered. Therefore, a separate rent adjustment is provided for each. For individually metered buildings,the estimated change in rent necessary to cover changes in operating costs is a 0.1 percent increase. Formaster metered buildings, it is a 2.7 percent decrease.
Percent Change in RentNeeded to Cover Changes in Operating Expenses
Based on the City of Berkeley’s Standardized Analysis Methodology
Individually Metered Buildings 0.1%Master Metered Buildings -2.7%
These calculations are based on an analysis of 27 operating expenses and their changes from July 1, 2001to July 1, 2002. The relative impact of these annual changes on property owners has also been estimated.All assumptions and methodologies are in accordance with previous AGA Reports. Most operatingexpenses, with the exception of gas, did not change during this year, or grew only slightly.
In master metered buildings, the property owner pays for gas and electricity for all of the rental units, inaddition to the cost of heating water. Changes in utility prices impact these buildings more than individualmetered buildings. To adjust for this discrepancy, individually metered and master metered buildingshave different “expense ratios” for gas and electricity charges. The expense ratios for gas and electricityare higher for master metered buildings since a greater percentage of the property owner’s expenses arededicated to utility costs.
The 2002 AGA report found a 0.1 percent rent increase for individually metered buildings and a2.7 percent rent decrease for master metered buildings. The decrease for master metered buildings thisyear was due to a decrease in gas rates between 2001 and 2002.
The expenses associated with gas has decreased 38.7 percent, based on the application of the consistentAGA calculation methodology employed in prior AGA reports. The decrease in gas expense is calculatedbased on the decrease in price per therm from the month closest to July 1 for each year multiplied byconsumption levels as described more fully in this report. Consumption levels have not decreased, but theprice per therm decreased 38.7 percent from July 2001 to July 2002.
Table ES-1 shows the changes for each operating expense tracked in this analysis. It also lists the“expense ratios” which are used to weight the relative significance of these changes. The final column ofthe table shows the net effect the change in the expense has on rental property owners (by weighting thechange in expense by its “expense ratio”).

Table ES-1Calculated Rent Change Necessary to Cover Operating Expenses
Percent Change Necessary Rent ChangeOperating Expense Category in Expense Expense Ratio to Cover Expenses
1. Water Service 3.608% 0.02061 0.074%
2. Wastewater Treatment 3.214% 0.00991 0.032%
3. Sewer Service 3.986% 0.02481 0.099%
4. City Business License 3.883% 0.01048 0.041%
5. Library Assessment 4.903% 0.01472 0.072%
6. Refuse Collection 5.009% 0.02721 0.136%
7. Property Taxes 1.837% 0.06012 0.110%
8. Insurance 0.748% 0.05277 0.039%
9. Management 1.205% 0.08190 0.099%
10. Maintenance 1.205% 0.07405 0.089%
11. Street Lighting 0.000% 0.00147 0.000%
12. Landscaping and Park 2.125% 0.01282 0.027%
13. Rent Board Registration 0.000% 0.01689 0.000%
14. School Bonds 4.616% 0.02183 0.101%
15. Fire Inspection 0.000% 0.00188 0.000%
16. Mosquito Abatement 0.000% N/A [3] 0.000%
17. Vector Control 0.000% 0.00081 0.000%
18. Paramedical Care 1.073% 0.00667 0.007%
19. Wet Weather Facilities 0.000% 0.00667 0.000%
20. Clean Storm Water 0.000% 0.00252 0.000%
21. Lead Abatement 0.000% 0.00136 0.000%
22. Regional Trails District 0.000% 0.00037 0.000%
23. Disaster Fire Protection 0.000% 0.00170 0.000%
24. Disabled Emergency Services 2.132% 0.00121 0.003%
25. Seismic Improvements 0.000% N/A 0.000%
Subtotal 0.45279 0.930%
26. Gas (individually metered) -38.732% 0.02232 -0.864%
27. Electricity (individually metered) 0.000% 0.01947 0.000%
Subtotal: Individually Metered 0.04179 -0.864% Gas & Electricity
28. Gas (master metered) -38.732% 0.09293 -3.599%
29. Electricity (master metered) 0.000% 0.05489 0.000%
Subtotal: Master Metered 0.14782 -3.599%
Total, Individually Metered Buildings 0.065%(Total of 1 to 25 plus 26 & 27) rounded 0.1%
Total, Master Metered Buildings -2.670%(Total of 1 to 25 plus 28 & 29) rounded -2.7%
____________________________________________________________2003 AGA ReportBerkeley Rent Stabilization Board Page ii
____________________________________________________________October 2002
Seifel Consulting Inc.

2003 AGA Report iii October 2002Berkeley Rent Stabilization Board Seifel Consulting Inc.
Table of Contents2003 AGA Report
Berkeley Rent Stabilization Board
Introduction.......................................................................................................... 1
I. Changes in Operating Expenses ................................................................ 2
1. Water Service..........................................................................................................................................................4
2. Wastewater Treatment............................................................................................................................................4
3. Sewer Service .........................................................................................................................................................5
4. City Business License.............................................................................................................................................5
5. Library Assessment ................................................................................................................................................6
6. Refuse Collection....................................................................................................................................................6
7. Property Taxes ........................................................................................................................................................6
8. Insurance .................................................................................................................................................................7
9. Management............................................................................................................................................................7
10. Maintenance............................................................................................................................................................7
11. Street Lighting ........................................................................................................................................................7
12. Landscaping and Parks ...........................................................................................................................................8
13. Rent Board Registration .........................................................................................................................................8
14. School Bonds (Measure B and School Facility Maintenance) .............................................................................8
15. Fire Inspection ........................................................................................................................................................8
16. Mosquito Abatement ..............................................................................................................................................8
17. Vector Control ........................................................................................................................................................9
18. Paramedical Care ....................................................................................................................................................9
19. Wet Weather Facilities ...........................................................................................................................................9
20. Clean Storm Water .................................................................................................................................................9
21. Lead Abatement......................................................................................................................................................9
22. Regional Trails District ..........................................................................................................................................9
23. Disaster Fire Protection (Measure Q) ....................................................................................................................9
24. Disabled Emergency Services (Measure E) ........................................................................................................10

2003 AGA Report iv October 2002Berkeley Rent Stabilization Board Seifel Consulting Inc.
25. Seismic Improvement ...........................................................................................................................................10
26. & 28. Gas (Individually Metered and Master Metered) ...........................................................................................10
27. & 29. Electricity (Individually Metered and Master Metered) ................................................................................11
II. Expense Ratios.......................................................................................... 13
1. Expense Ratios Related to Median Rent..............................................................................................................13
2. Expense Ratios Based on Established Ratios ......................................................................................................15
III. Percent Change in Rent Needed to Cover Changes in OperatingExpenses.................................................................................................... 17
IV. Historical Rent Board General Adjustments .......................................... 19
TablesTable 1 Changes in Operating Expenses, 2001 to 2002.......................................................................................................3Table 2 Expense Ratios, Calculated Based on 2001 Expenses as Percent of 2002 Median Rent ....................................14Table 3 Expense Ratios for Master Metered Buildings, Calculated Based on Historical Annual Adjustments to
Existing Ratios.......................................................................................................................................16Table 4 Calculated Rent Change Necessary to Cover Operating Expenses......................................................................18

2003 AGA Report 1 October 2002Berkeley Rent Stabilization Board Seifel Consulting Inc.
Introduction
The analysis presented in this report provides a basis for determining an equitable annual generaladjustment (AGA) on rents in the City of Berkeley. It is based on the City of Berkeley’s establishedmethodology used by the Rent Stabilization Board to calculate the overall change in rent necessary tocover the changes in operating costs for rental units.
This report is organized as follows:
• Chapter I documents changes in 27 operating expenses between July 1, 2001 and July 1, 2002 foraverage or representational rental units.
• Chapter II presents “expense ratios” that are used to weight the impact these changes in operatingexpenses has on rental property owners.
• Chapter III summarizes the results of the analysis. It discusses the net effect that each change inoperating expense has on rental property owners. This net is calculated by weighting the change inexpense by its expense ratio.
• Chapter IV presents a summary of past adjustments in order to put this analysis into historicalcontext.
2003 AGA Report 2 October 2002Berkeley Rent Stabilization Board Seifel Consulting Inc.
I. Changes in Operating ExpensesThe rent adjustment is calculated based on the change in specified operating expenses betweenJuly 1, 2001 and July 1, 2002, modified by the expense ratios discussed in Chapter III.
The operating expenses and the assumptions used in determining them are documented in the followingpages. They are organized as follows:
1. Water Service
2. Wastewater Treatment
3. Sewer Service
4. City Business License
5. Library Assessment
6. Refuse Collection
7. Property Taxes
8. Insurance
9. Management
10. Maintenance
11. Street Lighting
12. Landscaping and Parks
13. Rent Board Registration
14. School Bonds (Measure B and School Facility Maintenance)
15. Fire Inspection
16. Mosquito Abatement
17. Vector Control
18. Paramedical Care
19. Wet Weather Facilities
20. Clean Storm Water
21. Lead Abatement
22. Regional Trails District
23. Disaster Fire Protection (Measure Q)
24. Disabled Emergency Services (Measure E)
25. Seismic Improvement
26. Gas (individually metered)
27. Electricity (individually metered)
28. Gas (master metered)
29. Electricity (master metered)
Table 1 also shows the expense levels as of July 1, 2002. It also calculates the percent change in operatingexpenses from July 1, 2001 to July 1, 2002. Expense levels from July 1, 2001 are documented in the2002 AGA. The table also itemizes these expenses and their original source.

Table 1Changes in Operating Expenses, 2001 to 2002 [1]
2001 2002 PercentExpense Category (2002 AGA) (2003 AGA) Change Source
1. Water Service $75.66 $78.39 3.608% East Bay Municipal Utility District
2. Wastewater Treatment $36.40 $37.57 3.214% East Bay Municipal Utility District3. Sewer Service $15.18 $15.79 3.986% City of Berkeley
4. City Business License N/A [2] N/A [2] 3.883% City of Berkeley
5. Library Assessment $0.1081 $0.1134 4.903% City of Berkeley6. Refuse Collection [3] $23.16 $24.32 5.009% City of Berkeley7. Property Taxes [4] 1.2495% 1.2475% 1.837% State of California/Voter-Approved Bonds8. Insurance [5] 107.0 107.8 0.748% CPI (Bureau of Labor Statistics)9. Management [5] 190.9 193.2 1.205% CPI (Bureau of Labor Statistics)
10. Maintenance [5] 190.9 193.2 1.205% CPI (Bureau of Labor Statistics)
11. Street Lighting $0.0108 $0.0108 0.000% City of Berkeley
12. Landscaping and Park $0.0941 $0.0961 2.125% City of Berkeley
13. Rent Board Registration $124.00 $124.00 0.000% City of Berkeley
14. School Bonds $0.1603 $0.1677 4.616% City of Berkeley
15. Fire Inspection $83.00 $83.00 0.000% City of Berkeley
16. Mosquito Abatement N/A N/A 0.000% Alameda County Mosquito Abatement District
17. Vector Control $5.92 $5.92 0.000% Board of Supervisors, County of Alameda
18. Paramedical Care $48.94 $49.465 1.073% Board of Supervisors, County of Alameda
19. Wet Weather Facilities $49.00 $49.00 0.000% East Bay Municipal Utility District
20. Clean Storm Water $1.54 $1.54 0.000% City of Berkeley
21. Lead Abatement $10.00 $10.00 0.000% Board of Supervisors, County of Alameda
22. Regional Trails District $2.72 $2.72 0.000% Board of Directors, Regional Trails Assessment
23. Disaster Fire Protection $1.0417 $1.0417 0.000% City of Berkeley
24. Disabled Emergency Services $0.00891 $0.0091 2.132% City of Berkeley
25. Seismic Improvement [6] N/A [7] N/A [7]0.000% East Bay Municipal Utility District
26. Gas (individually metered) N/A [7] N/A [7] -38.732% Pacific Gas and Electric Company
27. Electricity (individually metered) N/A [7] N/A [7] 0.000% Pacific Gas and Electric Company
28. Gas (master metered) N/A [7] N/A [7] -38.732% Pacific Gas and Electric Company
29. Electricity (master metered) N/A [7] N/A [7] 0.000% Pacific Gas and Electric Company
[1] From the sources listed in the far right column.[2] The 3.883% increase reflects the increase in gross rental receipts due to the 2002 AGA.[3] This expense calculation was updated in the 1999 AGA to reflect refuse collection charges for District 2 only.
The City of Berkeley estimates that over 73% of apartments are located in District 2. [4] Numbers shown under "operating expense" reflect property tax rates. The percent increase in expense is also
dependent upon the 2% increase in property value allowed under Proposition 13; refer to discussion in text.[5] Numbers shown under "operating expense" are CPI indices; refer to discussion in text.
Household Insurance CPI discontinued 12/97.[6] EBMUD has adopted alternative funding for the Seismic Improvement Program (FY 1996/97) and no longer collects a
separate parcel tax.[7] Please refer to text for a breakdown of the change in these operating expenses.
N/A= Not Applicable
Operating Expense Factors
____________________________________________________________2003 AGA ReportBerkeley Rent Stabilization Board Page 3
____________________________________________________________October 2002
Seifel Consulting Inc.

2003 AGA Report 4 October 2002Berkeley Rent Stabilization Board Seifel Consulting Inc.
1. Water ServiceThe water service expense is based on four charges:
• A consumption charge, based on the units of water delivered.
• A monthly service charge, based on the size of the meter serving the building.
• An elevation charge, based on the reservoir serving the residence.
• A seismic improvement program surcharge, at a flat rate for all multiple family residential accounts.
The assumptions described below are used in order to estimate a representative monthly water charge.These are consistent with the six prior AGA reports, so that annual changes in charges can be accuratelytracked.
Based on discussions with and data provided by the City of Berkeley Department of Public Works andEast Bay Municipal Utility District, the average consumption is assumed to be 5.5 units (1 unit = 100cubic feet of water) per rental unit. It is also assumed a six unit building uses a one-inch meter. For thepurposes of this report, water service charges are calculated monthly, although a typical rental unit a sixunit building is billed every two months, using an average of 11 water units for a two month period. Theelevation charge assumes that the water storage reservoir which supplies the water to the building is zeroto 200 feet above sea level.1
While the elevation charge remained zero, the unit consumption and monthly service charges haveincreased. The representative monthly water charges on both July 1, 2001 and July 1, 2002 are shown inthe following table. The total monthly water service expense for a typical six unit building as ofJuly 1, 2002 is $78.39. This reflects a 3.608 percent increase from the previous year’s total of $75.66.
As ofJuly 1, 2001
As ofJuly 1, 2002
Consumption Charge per Unit of Water $1.78 $1.85Monthly Consumption Charge2 $58.74 $61.05Monthly Service Charge $13.16 $13.58Elevation Charge $0.00 $0.00Seismic Improvement Surcharge $3.76 $3.76Total Monthly Charge for a Six Unit Building $75.66 $78.39Percent Change from 2001 to 2002 3.608%
Source: East Bay Municipal Utility District
2. Wastewater TreatmentIn tracking wastewater treatment costs, a representative six unit building is used. While residentialdwellings of one to four units are charged residential rates, apartment buildings of five or more units arecharged non-residential rates. These rates consist of a monthly service charge per account, and a treatmentcharge per unit of wastewater.3
1 This elevation falls into “Elevation Band 1” in the East Bay Municipal District Water Rate.2 Based on an average monthly consumption of 5.5 units of water.3 Note: Apartment buildings are exempt from the “monthly waste minimization fee”: which is charged to most other non-
residential accounts.

2003 AGA Report 5 October 2002Berkeley Rent Stabilization Board Seifel Consulting Inc.
The treatment charge is estimated based on the 2002 updated average consumption of 5.5 water units perrental unit per month, in a building with six rental units.4 This is the same assumption used to calculatethe water consumption (see previous “Water Service” description). The same number is used based on theassumption that little, if any, water would be used for landscaping; thus, the wastewater generated by arental unit would be equal to the water consumed.
The representative monthly wastewater charges on both July 1, 2001 and July 1, 2002 are shown in thefollowing table. The treatment charge per unit of wastewater and the monthly service charge were bothincreased. As of July 1, 2002, the wastewater treatment expense for a representative six unit building is$37.57, representing a 3.214 percent increase from the previous year.
As ofJuly 1, 2001
As of July 1, 2002
Treatment Charge per Unit of Wastewater $0.99 $1.02Monthly Treatment Charge $32.67 $33.66Monthly Service Charge $3.73 $3.91Total Monthly Charge for a Six Unit Building $36.40 $37.57Percent Change from 2001 to 2002 3.214%
Source: East Bay Municipal Utility District
3. Sewer ServiceThe per unit charge for sewer service in the city rose from $2.76 in FY 2001/02 to $2.87 in FY 2002/03 or3.986 percent. As in the calculations for water and wastewater treatment, the sewer service charge isestimated based on the 2002 average consumption of 5.5 water units per rental unit per month.5 Assuminga representative six unit building, this results in a charge of $15.79 per unit or $94.74 per building. Thiscalculation results in an increase of 3.986 percent as compared to $15.18 per unit last year.
4. City Business LicenseThe City of Berkeley’s business license renewal fee is based on $10.81 per $1,000 of gross receipts. Noordinance was passed between July 1, 2001 and July 1, 2002 to raise this fee from its 2001 level;therefore, no increase in the fee occurred.
Nevertheless, the expense of the business license to property owners has risen from its 2001 level due tothe increase in gross receipts. This increase resulted from the 2002 annual general adjustment, whichpermitted a 3.5 percent or a $30.00 per month rent increase for individually metered apartments,whichever is less. The allowable rent increase was an additional $9.00 per month for master meteredapartments. The estimated median allowable rent increase was $22.87 per month. This was calculatedbased on the assumption that 75 percent of apartments are individually metered and 25 percent are mastermetered.
The estimated median rent for units in 2001 was $589.01. Given the estimated median allowable rentincrease of $22.87, the estimated median rent in 2002 is $611.88. This increase in median rent results in a3.883 percent increase in gross receipts, and likewise, in the City of Berkeley business license cost.
4 As described in the previous section, the assumed average monthly water consumption is 5.5 units of water.5 Based on an average monthly consumption of 5.5 units of water.

2003 AGA Report 6 October 2002Berkeley Rent Stabilization Board Seifel Consulting Inc.
5. Library AssessmentThe library assessment is levied per square foot of improvement. The expense is $0.1134 per square footfor all dwelling units during FY 2002/03. The library assessment increased by 4.903 percent from itsFY 2001/02 level of $0.1081 per square foot.
6. Refuse CollectionThe method for calculating the refuse collection expense was updated in the 1999 AGA.6 Based ondiscussions with the City of Berkeley Public Works Department, over 73 percent of apartment units inBerkeley are located in District 2. The Public Works Department indicated that the District 2 containercharges best represent the refuse collection charges for all apartment buildings in Berkeley.
The expense ratios for refuse were established by a survey conducted in the early 1980s, and the ratioswere confirmed again in FY 1992/93 as reported in the 1994 AGA Report. Based on this historicalanalysis, a 45 gallon container with one weekly collection has been used as the basis for the annualincreases throughout the 1990s. Thus, the refuse collection assessment in this AGA report is based on aDistrict 2, 45 gallon container with one weekly collection, or $24.32 per month for FY 2002/03.7 Thisrepresents a 5.009 percent increase from the FY 2001/02 level of $23.16 per month.
The City also places surcharges on customers that do not place their waste containers next to the curb.Containers located more than 100 feet from the curb or contained below a flight of stairs incur a surchargeof $3.15 per month per container. The City of Berkeley Public Works Billing Department verified thatfew multifamily residential customers pay the surcharge. The frequency of the surcharge is consideredinsignificant and is not included in the AGA analysis.
7. Property TaxesThe change in property tax expense is based both on a property’s change in value and any change in thetax rate. Under Proposition 13, property value increases are limited to 2.000 percent per year unless theproperty is reassessed, which occurs upon an improvement made to or the sale of a property. This analysisassumes that the representational unit will not be reassessed during the year, so that its value increasesonly by 2.000 percent.
Proposition 13 also ensures that property owners pay 1 percent basic property tax rate, with no increaseallowed. The total tax rate includes this basic 1 percent rate and also any voter-approved bonds. The ratesin FY 2002/03 of 1.2475 percent. This is a 0.160 percent decrease from the FY 2001/02 level of1.2495 percent.
6 AGA Reports prior to the 1999 AGA were based on the average of the container costs of District 1 and 3.7 T he City of Berkeley Public Works Billing Department verified that less than 10 percent of the six unit buildings have pick-ups
more than once a week.

2003 AGA Report 7 October 2002Berkeley Rent Stabilization Board Seifel Consulting Inc.
Property Tax Expense Changes betweenFY 2001/02 and FY 2002/03
FY 2001/02
FY2002/03
Countywide Tax 1.0000% 1.0000%City of Berkeley8 .0850% .0750%Berkeley Unified School District .1335% .1400%Peralta Community College .0154% .0176%Bay Area Rapid Transit (BART) .0000% .0000%East Bay Regional Park (#1) .0072% .0065%East Bay Municipal Utility District9 .0084% .0084%Total 1.2495% 1.2475%
Source: Tax Analysis Unit, Alameda County Office of the Auditor-Controller.
Thus, the net effect was an increase in the property tax expense of 1.837 percent:
Increase in Decrease in Increased Change inProperty Value Tax Rate Expense Expense
102.000% x 99.840% = 101.837% 1.837%(1.00000 + 0.02000) (1.00000 – 0.00160)
8. InsuranceInsurance expenses have been assumed to increase at a rate equal to the Consumer Price Index for AllUrban Consumers, US city average, for “tenants’ and household insurance.” As noted in the 2000 Report,the index used in prior AGA reports (“household insurance”) was discontinued by the Bureau of LaborStatistics in December 1997.
Between June 2001 and June 2002 the “tenants’ and household” insurance index grew slightly from 107.0to 107.8. This reflects an increase of 0.748 percent in insurance costs.
9. ManagementManagement expenses are assumed to increase at a rate equal to the Consumer Price Index for All UrbanConsumers within the San Francisco-Oakland-San Jose Metropolitan Area. This index rose slightly from190.9 in June of 2001 to 193.2 in June of 2002. This represents a 1.205 percent increase.
10. MaintenanceMaintenance expenses are assumed to increase at a rate equal to the Consumer Price Index for All UrbanConsumers within the San Francisco-Oakland-San Jose Metropolitan Area. This index rose slightly from190.9 in June of 2001 to 193.2 in June of 2002. This represents a 1.205 percent increase.
11. Street LightingThe street lighting assessment is levied per square foot of improvement. The expense of $0.0108 persquare foot for all dwelling units during FY 2002/03 has not changed from its FY 2001/02 level.
8 Includes General Obligation Bonds Measure S and G.9 Includes General Obligation Bond for EBMUD Special District 1.

2003 AGA Report 8 October 2002Berkeley Rent Stabilization Board Seifel Consulting Inc.
12. Landscaping and ParksIn May 1997, the voters of Berkeley approved a special tax solely to provide income for the direct cost ofacquisition and maintenance of improvements related to parks and landscaping in the City of Berkeley. InNovember 2000, Berkeley voters re-authorized the City to continue collecting this special tax for anotherfour years, levied per square foot of improvements (Measure W). In addition, the voters overwhelminglypassed Measure S that increased the special tax to fund park maintenance, city trees and landscaping by$.0079 per square foot of taxable improvements.
The FY 2002/03 tax increase is based on two authorized adjustments: 1) an annual cost of living increaseof 2.1 percent (or $.0020) in the San Francisco Bay Area and 2) a $.0079 per square foot increaseauthorized under Measure S. The City Council approved the FY 2002/03 tax at $0.0961 per square footfor all dwelling units based on these dual adjustments. This results in a 2.125 percent increase from itsFY 2001/02 level of $0.0941.
13. Rent Board RegistrationThe annual rent registration fee for each rental unit in FY 2002/03 is the same as the FY 2001/02 level of$124.
14. School Bonds (Measure B and School Facility Maintenance)School Measure B is levied per square foot of improvement. The expense is $0.121 per square foot for alldwelling units during FY 2002/03. The rate from FY 2001/02 was $0.1153. A School FacilityMaintenance Fee was introduced at $0.045 per square foot of improvement for all dwellings inFY 2001/02, and the rate was increased to $0.0467 per square foot of improvement in FY 2002/03. Thecumulative charges result in a 4.616 percent increase from last year.
15. Fire InspectionThe fire inspection expense is based on a 30 minute inspection for a building with six rental units, asindicated in the eight prior AGA reports.10
The fire inspection fee in FY 2002/03 is the same as the FY 2001/02 level of $41.50 per 15 minutes ofinspection. This yields an annual expense to property owners of $83 for a 30 minute inspection of a sixunit building.
16. Mosquito AbatementThe mosquito abatement tax expense is based on a building with six rental units. In FY 2000/01, thespecial tax assessment rate was $4.00. On July 11 in 2001, the Board of the Alameda County MosquitoAbatement District adopted Resolution 853-2, dropping the rate to zero. The rate in FY 2002/03 did notchange from zero. Therefore, the change in expense is 0.0 percent from June 2001 to June 2002.
10 Historically, different standards have been used for the fire inspection fee. The following discussion was offered in the 1997
AGA Report (Glen Elder): “The average inspection was estimated to take 15 minutes for a four unit building in the 1982 AGA,15 minutes for a six unit building in the 1987 AGA, and 15 minutes for a single unit in the 1989 AGA. In the summer of 1991,the fire department indicated that between 15 and 30 minutes for a small building containing no problem would be a reasonableguess. If the building had problems, the inspection could take much longer. No estimate of the proportion of buildings withproblems was available. Also, this discussion took place prior to the 1991 Oakland Hills fire. Lacking survey estimates, astandard of 30 minutes for the inspection of a six unit building is used in this year’s [1996 AGA] report, as in previous AGAReports.” The same approach was used in the 1997, 1998, 1999, 2000, 2001 and 2002 AGA reports prepared by SeifelConsulting.

2003 AGA Report 9 October 2002Berkeley Rent Stabilization Board Seifel Consulting Inc.
17. Vector ControlThe Alameda County Vector Control Services District assessment rate has remained at $5.92 per dwellingunit. This represents no change from FY 2001/02.
18. Paramedical CareThe City and County each adopt ordinances to set their share of the Paramedical Care fee. The City’s ratewas increased to $0.025525 per square foot in FY 2002/03, which equals $25.525 per unit for an averagesix unit building (1,000 building square feet per unit).11 The County’s rate has remained at $23.94 perunit. When added to the City’s rate of $25.525, this totals $49.465 per unit. Compared to last year’s fee of$48.94 per unit, this results in an increase of $0.525, or a 1.073 percent increase from FY 2001/02.
19. Wet Weather FacilitiesThe Wet Weather Facilities expense of $49.00 per unit has not changed from FY 2001/02.12
20. Clean Storm WaterThe Standard Runoff Unit charge of $50.00 per unit has not changed since July 1, 2001. Employing allthe same assumptions as used in the 1996 through 2002 AGA reports, the current fee is calculated by thefollowing formula: 1,350 square feet of land area per rental unit based on a six unit building multiplied byrunoff factor of 0.6 divided by Standard Runoff Unit of 2,196 square feet and multiplied by the StandardRunoff Unit charge of $50.00 per unit divided by twelve months. The per unit per month fee remains at$1.54.13
21. Lead AbatementFor dwelling units built before 1978, the Alameda County Lead Abatement District assessment rate hasbeen established at $10.00 per dwelling unit for FY 2002/03. This represents no change from itsFY 2001/02 level.
22. Regional Trails DistrictThe East Bay Regional Park District established the Alameda/Contra Costa County Regional TrailsLandscaping and Lighting District in 1993. The rates are calculated based upon Equivalent DwellingUnits (EDU). This rate was set at $5.44 per EDU. Apartments are assessed at 0.5 EDU. Therefore, therate is $2.72 per unit, the same as the FY 2001/02 level.
23. Disaster Fire Protection (Measure Q)The Special Fire District assessment rate was eliminated by the City of Berkeley as of July 1, 1997.14
However, in November 2000, voters approved Measure Q, creating the new Community Facilities SpecialDistrict for Disaster Fire Protection. In FY 2001/02, the tax rate was set at $0.0125 per square foot ofimprovements, assumed to be residential building square footage. Based on the methodologies used in
11 The average unit size of 1,000 building square feet per unit has been consistently used since the 1996 AGA.12 An annual rate is charged to property owners based on the number of dwelling units on the property. The maximum rate that
can be charged is five times the rate per dwelling unit. The rate per dwelling unit has increased to $58.80, effectiveJuly 1, 1997. Thus, the maximum charge per property would be five times this amount, or $294 annually. On a per unit basis,assuming a building with six dwelling units, the expense is one sixth of this, or $49.
13 The average land area per rental unit of 1,350 square foot has been consistently used since the 1996 AGA.14 The 1998 AGA report reflected an elimination of this special fire district assessment rate and a corresponding 100 percent
decrease in this operating expense item.

2003 AGA Report 10 October 2002Berkeley Rent Stabilization Board Seifel Consulting Inc.
prior AGA reports for fire fees, the current tax rate is calculated by the following formula: $0.0125 persquare foot of improvements multiplied by an average of 1,000 square feet in improvements (typicalrental unit including common area) divided by twelve months.15 The tax rate in FY 2002/03 has remainedat $0.0125.
24. Disabled Emergency Services (Measure E)Ballot Measure E was approved by Berkeley voters during the November 1998 elections and went intoeffect January 1, 1999. Measure E established a tax for each square foot of improvements in Berkeley.The measure funds emergency services for Berkeley residents who are severely physically disabled. ForFY 2002/03, the rate is $0.0091 per square foot of improvement. This is a 2.132 percent increase from theFY 2001/02 rate of $0.00891.
25. Seismic ImprovementThe Seismic Improvement Program, managed by the East Bay Municipal Utility District, once generatedrevenue through a parcel tax based on the parcel size in addition to a rate surcharge on water service.16
However, the assessment rate based on parcel size was eliminated in FY 1996/97. Therefore, no expenseis assumed, and the change in expense is 0.0 percent from June 2001 to June 2002.
26. & 28. Gas (Individually Metered and Master Metered)The City of Berkeley has a 7.5 percent utility tax for gas and electricity. The tax rate has not changedsince July 1, 1991. However, when gas utility costs change, the dollar amount of tax paid on themchanges at the same rate.
Four factors are used in determining the change in gas utility costs:1. Price per therm for usage at or below the baseline quantity.2. Price per therm for usage above the baseline quantity.3. The baseline quantity.4. The level of consumption.
For this analysis, consistent with prior AGA reports, it is estimated that 60 percent of the usage occursbelow the baseline quantity and 40 percent of the usage is above the baseline quantity.17
Consistent with prior AGA reports, the change in gas expense is calculated based on the change in priceper therm from the month closest to July 1 for each year. The table below shows the price per therm as ofJuly 1, 2001 and July 8, 2002. 18
15 This prototypical 1,000 square feet includes the size of the unit and also its share of common areas, such as hallways,
stairways, offices, basements, garages, utility rooms, and vacant apartments.16 This program currently generates revenue through a rate surcharge on water service, as previously described and included
under the “Water Service” expense.17 These percentages of usage above the baseline have been consistently used since the 1998 AGA Report. As of July 2002, for
individually metered units, the summer baseline quantities remained the same at July 2001 level of 0.7 therms per day. Thewinter baseline quantities for individually metered units have slightly increased from 1.7 to 2.0 therms per day. Summerbaseline quantities for master metered units have slightly decreased from 0.7 to 0.6 therms per day. Winter baseline quantitiesfor master metered units have slightly decreased from 1.4 therms per day.
18 Using PG&E Baseline Territory “T.”

2003 AGA Report 11 October 2002Berkeley Rent Stabilization Board Seifel Consulting Inc.
Average Monthly Consumption Changes for Gas Utilityas of July 7, 2000 and July 1, 2002
Priceper Therm
As ofJuly 1, 2001
As ofJuly 8, 2002
PercentChange
PercentDistribution
NetChange
For usage at or belowthe baseline quantity $0.90424 $0.52669 -41.753% 60%
-38.732%For usage above the
baseline quantity $1.09723 $0.72197 -34.201% 40%
The price decreases per therm shown above yield a net decrease of 38.732 percent in gas expense. Thisdecrease is the same for individually metered and master metered buildings.
In master metered buildings, the property owner carries the gas cost for all of the rental units, in additionto the cost of heating water. These buildings are more highly impacted by changes in gas prices than areindividually metered buildings. To adjust for this discrepancy, individually metered and master meteredbuildings have different expense ratios for gas charges. (Expense ratios are used in the AGA calculationto weight the impact of changes in operating expenses, as discussed in Chapter III.
27. & 29. Electricity (Individually Metered and Master Metered)The City of Berkeley has a 7.5 percent utility tax for gas and electricity. As in the case of gas, the percentof the tax has not changed since July 1, 1991. However, when electricity costs change, the amount of taxpaid on them changes also.
Four factors are used in determining the change in electricity utility costs:1. Price per kilowatt-hour for usage at or below the baseline quantity.2. Price per kilowatt-hour for usage above the baseline quantity.3. The baseline quantity.4. The level of consumption.
The following table shows the price per kilowatt-hour as of July 1, 2001 and July 1, 2002 for each of fivetiers. Both the consumption levels and the prices for each tier are shown in the following table. The AGAcalculation does not take into account that a portion of this increase would not occur for CARE customersand customers who receive medical baseline allowances.

2003 AGA Report 12 October 2002Berkeley Rent Stabilization Board Seifel Consulting Inc.
Average Monthly Consumption Changes for Electricity Utilityas of July 1, 2001 and July 1, 2002
Baseline[1] ExcessTier 1[2] Tier 2[3] Tier 3[4] Tier 4[5] Tier 5[6]
2001Rates $0.11589 $0.13321 $0.13321 $0.13321 $0.13321Surcharge A ($0.01/kwh)[7] $0.01000 $0.01000 $0.01000 $0.01000 $0.01000Surcharge B[8] None None $0.05124 $0.09517 $0.11505Total[9] $0.12589 $0.14321 $0.19445 $0.23838 $0.25826
2002Rates $0.11589 $0.13321 $0.13321 $0.13321 $0.13321Surcharge A ($0.01/kwh)[7] $0.01000 $0.01000 $0.01000 $0.01000 $0.01000Surcharge B[8] None None $0.05124 $0.09517 $0.11505Total[9] $0.12589 $0.14321 $0.19445 $0.23838 $0.25826
Increase $0.00000 $0.00000 $0.00000 $0.00000 $0.00000
Percent Change 0.00% 0.00% 0.00% 0.00% 0.00%
Distribution[10] 62.78% 9.86% 13.43% 7.80% 6.13%
Average Increase from 2001 to 2002 0.00%
[1] The baseline quantities for individually metered units have increased from 7.7 to 8.5 kilowatt-hours per day in summer andhave increased from 8.9 to 10.2 kilowatt-hours per day in winter. For master metered accounts, the baseline quantities remainedat 5.2 kilowatt-hours per day in summer and have slightly increased from 5.9 to 6.1 kilowatt-hours per day in winter.[2] 0-100% of baseline quantity.[3] 101-129% of baseline quantity.[4] 130-200% of baseline quantity.[5] 201-300% of baseline quantity.[6] 301% & over baseline quantity.[7] Effective January 1, 2001. Applies to all electric service customers, except customers taking service on the CARE program.[8] Applies to residential customers, except those taking service on the CARE program or who receive a medical baselineallowance.[9] Surcharges are applied after all other calculations are made pursuant to the terms set forth in each rate schedule.[10] Provided by the City of Berkeley and PG&E for the 2002 AGA Report. As indicated in prior AGA Reports, the Citypreviously estimated that 60 percent of the usage occurred below the baseline quantity while 40 percent of the usage was abovethe baseline quantity. The 2002 analysis confirmed that this was a reasonable estimate, as PG&E indicated Tier 1 usage in 2001at 62.78 percent.Source: PG&E
For both individually metered and master metered buildings, the prices per kilowatt-hour have remainedthe same as last year’s.
In master metered buildings, the property owner carries the electricity cost for all of the rental units, inaddition to the common areas. These buildings are more highly impacted by changed in electricity pricesthan are individually metered buildings. To adjust for this discrepancy, individually metered and mastermetered buildings have different expense ratios for electricity charges. (Expense ratios are used in theAGA calculation to weight the impact of changes in operating expenses, as discussed in Chapter III.)

2003 AGA Report 13 October 2002Berkeley Rent Stabilization Board Seifel Consulting Inc.
II. Expense RatiosIn order to gauge the impact that changes in operating expenses have on rental property owners, eachexpense is weighted by an expense ratio. The majority of expense ratios reflect the expense as a percentof the median rent. These are discussed in Section 1 below. The remainder of the expense ratios are basedon the established expense ratio as reported in the previous AGA report, adjusted to reflect the changes inthe expenses. This is further explained in Section 2 below.
1. Expense Ratios Related to Median RentThe majority of expense ratios are calculated based on the prior year’s expense as a percent of a currentestimate of median rent. The June 2002 expenses were previously discussed in Chapter I. For thepurposes of this analysis, the estimated current median rent is calculated by increasing the estimatedmedian rent reported in the prior year’s AGA by the general adjustment (which was levied last year).19
2001 estimated median rent per unit, from 2002 AGA Report: $589.01Increase, based on legislated 2002 general adjustment (at $22.87):20 $22.872002 estimated median rent per unit: $611.88
Some expenses are calculated one a per unit basis, while others apply to an entire building. Someexpenses accrue monthly, while others accrue annually. The expense ratios reflect the basis of the originalexpense. The following table illustrates the estimated median annual rent on a monthly and annual basis,for both one unit and for a six unit building, which is the typical building size used in this analysis:
Estimated 2002 Median Rent
Monthly AnnualOne Unit $611.88 $7,342.56Six Unit Building $3,671.28 $44,055.36
Table 2 summarizes the expense ratios, which are based on the prior year’s expense as a percent ofmedian rent.
19 At the true median rent, half of the registered units rent for more than the median rent and half of the units rent for less. This is
different from the average rent, which is the total amount paid for rent divided by the number of units rented. A differencebetween the estimated median rent used in the AGA Reports and the true median rent will arise, due to four factors: (1) unitsregistered and rented in prior years but no longer rented, (2) units registered and rented in 2000 that were not registered in prioryears, (3) rents not increased by the full amount allowed by the AGAs, and (4) rents changed through the Individual RentAdjustment (IRA) process.
20 Calculation assumes allowable increase of rent $20.62 for individually metered units and $29.62 for master meteredapartments. (2002 AGA was 3.5 percent or $30 for individually metered apartments, whichever was less, plus an additional $9per month for master metered apartments.) Assuming that 75 percent of apartments are individually metered and 25 percent aremaster metered, the estimated average rent adjustment is $22.87.

Table 2Expense Ratios
Calculated Based on 2001 Expenses as Percent of 2002 Median Rent
Calculated2002 AGA 2003 AGA Median Ratio for
Expense Expense [1] Rent Basis [2] 2003 AGA
Monthly expenses charged per unit3. Sewer Service $15.18 $611.88 0.02481
20. Clean Storm Water $1.54 $611.88 0.0025223. Disaster Fire Protection [3] $1.04 $611.88 0.00170
Monthly expenses based on a six unit building1. Water Service $75.66 $3,671.28 0.020612. Wastewater Treatment $36.40 $3,671.28 0.00991
Annual expenses charged per unit13. Rent Board Registration $124.00 $7,342.56 0.0168917. Vector Control $5.92 $7,342.56 0.0008118. Paramedical Care $48.94 $7,342.56 0.0066719. Wet Weather Facilities $49.00 $7,342.56 0.0066721. Lead Abatement $10.00 $7,342.56 0.0013622. Regional Trails District $2.72 $7,342.56 0.00037
Annual expenses per unit, assuming
1,000 improved building square feet per unit [3]
5. Library Assessment $108.10 $7,342.56 0.0147211. Street Lighting $10.80 $7,342.56 0.0014712. Landscaping and Park $94.10 $7,342.56 0.0128214. School Bonds $160.30 $7,342.56 0.0218324. Disabled Emergency Services $8.91 $7,342.56 0.00121
Annual expenses based on a six unit building15. Fire Inspection $83.00 $44,055.36 0.00188
[1] July 1, 2001 expenses from 2002 AGA Report.
[2] Based on 2002 median rent of $611.88 per unit, per month, as shown below.
Monthly AnnualOne Unit $611.88 $7,342.56Six Unit Building $3,671.28 $44,055.36
These figures are calculated based on the median rent shown in the 2002 AGA
[3] Based on 1993, 1994, 1995 and 1996 AGA Reports' (Glen Elder) estimates of medianbuilding square feet (including common areas) per unit.
____________________________________________________________2003 AGA ReportBerkeley Rent Stabilization Board Page 14
____________________________________________________________October 2002
Seifel Consulting Inc.
2003 AGA Report 15 October 2002Berkeley Rent Stabilization Board Seifel Consulting Inc.
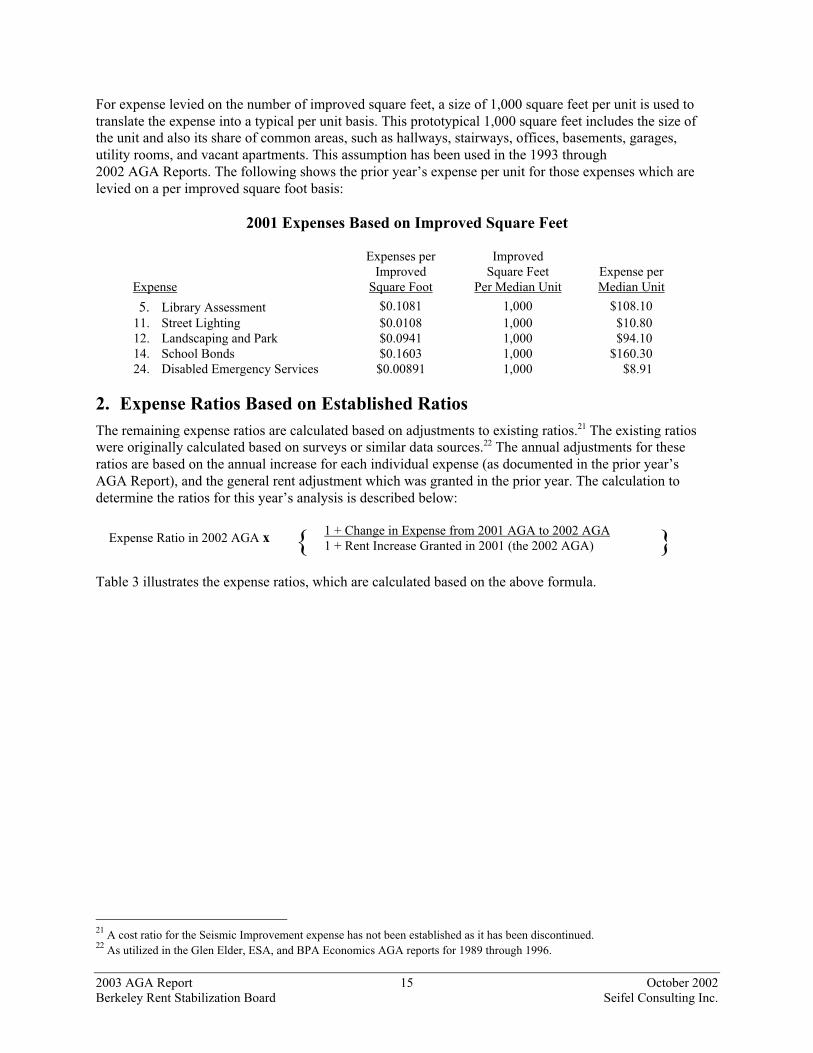
For expense levied on the number of improved square feet, a size of 1,000 square feet per unit is used totranslate the expense into a typical per unit basis. This prototypical 1,000 square feet includes the size ofthe unit and also its share of common areas, such as hallways, stairways, offices, basements, garages,utility rooms, and vacant apartments. This assumption has been used in the 1993 through2002 AGA Reports. The following shows the prior year’s expense per unit for those expenses which arelevied on a per improved square foot basis:
2001 Expenses Based on Improved Square Feet
Expense
Expenses perImproved
Square Foot
ImprovedSquare Feet
Per Median UnitExpense perMedian Unit
5. Library Assessment $0.1081 1,000 $108.1011. Street Lighting $0.0108 1,000 $10.8012. Landscaping and Park $0.0941 1,000 $94.1014. School Bonds $0.1603 1,000 $160.3024. Disabled Emergency Services $0.00891 1,000 $8.91
2. Expense Ratios Based on Established RatiosThe remaining expense ratios are calculated based on adjustments to existing ratios.21 The existing ratioswere originally calculated based on surveys or similar data sources.22 The annual adjustments for theseratios are based on the annual increase for each individual expense (as documented in the prior year’sAGA Report), and the general rent adjustment which was granted in the prior year. The calculation todetermine the ratios for this year’s analysis is described below:
Expense Ratio in 2002 AGA x { 1 + Change in Expense from 2001 AGA to 2002 AGA1 + Rent Increase Granted in 2001 (the 2002 AGA) }
Table 3 illustrates the expense ratios, which are calculated based on the above formula.
21 A cost ratio for the Seismic Improvement expense has not been established as it has been discontinued.22 As utilized in the Glen Elder, ESA, and BPA Economics AGA reports for 1989 through 1996.
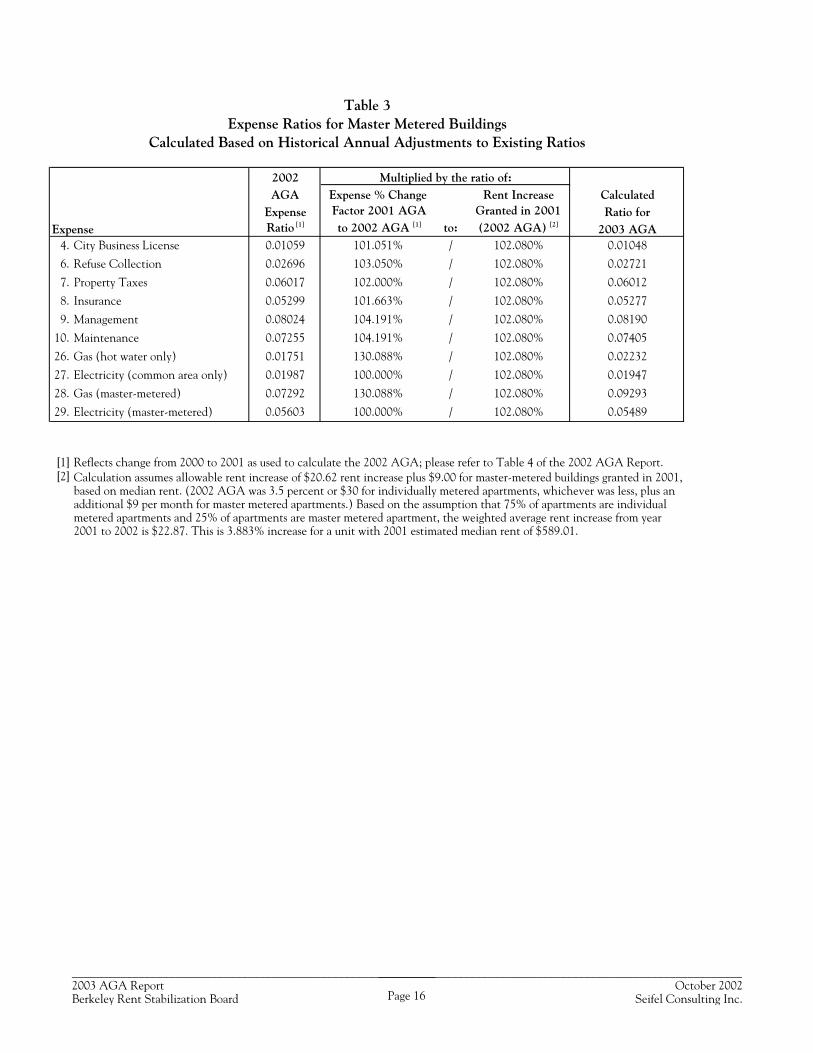
Table 3Expense Ratios for Master Metered Buildings
Calculated Based on Historical Annual Adjustments to Existing Ratios
2002 Multiplied by the ratio of:AGA Expense % Change Rent Increase Calculated
Expense Factor 2001 AGA Granted in 2001 Ratio forExpense Ratio [1] to 2002 AGA [1] to: (2002 AGA) [2] 2003 AGA
4. City Business License 0.01059 101.051% / 102.080% 0.01048
6. Refuse Collection 0.02696 103.050% / 102.080% 0.02721
7. Property Taxes 0.06017 102.000% / 102.080% 0.06012
8. Insurance 0.05299 101.663% / 102.080% 0.05277
9. Management 0.08024 104.191% / 102.080% 0.08190
10. Maintenance 0.07255 104.191% / 102.080% 0.07405
26. Gas (hot water only) 0.01751 130.088% / 102.080% 0.02232
27. Electricity (common area only) 0.01987 100.000% / 102.080% 0.01947
28. Gas (master-metered) 0.07292 130.088% / 102.080% 0.09293
29. Electricity (master-metered) 0.05603 100.000% / 102.080% 0.05489
[1] Reflects change from 2000 to 2001 as used to calculate the 2002 AGA; please refer to Table 4 of the 2002 AGA Report.[2]
Calculation assumes allowable rent increase of $20.62 rent increase plus $9.00 for master-metered buildings granted in 2001, based on median rent. (2002 AGA was 3.5 percent or $30 for individually metered apartments, whichever was less, plus an additional $9 per month for master metered apartments.) Based on the assumption that 75% of apartments are individual metered apartments and 25% of apartments are master metered apartment, the weighted average rent increase from year 2001 to 2002 is $22.87. This is 3.883% increase for a unit with 2001 estimated median rent of $589.01.
____________________________________________________________2003 AGA ReportBerkeley Rent Stabilization Board Page 16
____________________________________________________________October 2002
Seifel Consulting Inc.

2003 AGA Report 17 October 2002Berkeley Rent Stabilization Board Seifel Consulting Inc.
III. Percent Change in Rent Needed to CoverChanges in Operating Expenses
Table 4 breaks down the percent change in rent needed to cover changes in operating costs by expensecategory. In the first column, it shows the changes for each operating expense described in Chapter I(refer to Table 1). The second column shows the expense ratios that are used to weight the relativesignificance of these changes, as discussed in Chapter II (refer to Tables 2 and 3). The final column of thetable shows the net effect of the expense change on rental property owners (by weighting the change inexpense by its expense ratio).
Changes in operating expenses can vary significantly between a building in which the landlord isresponsible for covering gas and electric costs for all units, and a building, which is individually meteredfor each unit. Therefore, a separate rent adjustment is provided for each. As shown at the bottom ofTable 4, for individually metered buildings, the estimated change in rent necessary to cover changes inoperating costs is a 0.1 percent increase; for master metered buildings, it is a 2.7 percent decrease.
Percent Change in RentNeeded to Cover Changes in Operating Expenses
Based on the City of Berkeley’s Standardized Analysis Methodology
Individually Metered Buildings 0.1%Master Metered Buildings -2.7%
For the median unit, which rents at an estimated $611.88 per month, this change would translate into anincrease of about $0.61 per month for individually metered buildings and a decrease of $16.52 per monthfor master metered buildings.

Table 4Calculated Rent Change Necessary to Cover Operating Expenses
Percent Change Necessary Rent Change
Operating Expense Category in Expense [1] Expense Ratio [2] to Cover Expenses1. Water Service 3.608% 0.02061 0.074%2. Wastewater Treatment 3.214% 0.00991 0.032%3. Sewer Service 3.986% 0.02481 0.099%4. City Business License 3.883% 0.01048 0.041%5. Library Assessment 4.903% 0.01472 0.072%6. Refuse Collection 5.009% 0.02721 0.136%7. Property Taxes 1.837% 0.06012 0.110%8. Insurance 0.748% 0.05277 0.039%9. Management 1.205% 0.08190 0.099%
10. Maintenance 1.205% 0.07405 0.089%11. Street Lighting 0.000% 0.00147 0.000%12. Landscaping and Park 2.125% 0.01282 0.027%13. Rent Board Registration 0.000% 0.01689 0.000%14. School Bonds 4.616% 0.02183 0.101%15. Fire Inspection 0.000% 0.00188 0.000%16. Mosquito Abatement 0.000% N/A [3] 0.000%17. Vector Control 0.000% 0.00081 0.000%18. Paramedical Care 1.073% 0.00667 0.007%19. Wet Weather Facilities 0.000% 0.00667 0.000%20. Clean Storm Water 0.000% 0.00252 0.000%21. Lead Abatement 0.000% 0.00136 0.000%22. Regional Trails District 0.000% 0.00037 0.000%23. Disaster Fire Protection 0.000% 0.00170 0.000%24. Disabled Emergency Services 2.132% 0.00121 0.003%25. Seismic Improvements 0.000% N/A [4] 0.000%
Subtotal 0.45279 0.930%
26. Gas (individually metered) -38.732% 0.02232 -0.864%
27. Electricity (individually metered) 0.000% 0.01947 0.000%Subtotal: Individually Metered 0.04179 -0.864% Gas & Electricity
28. Gas (master metered) -38.732% 0.09293 -3.599%
29. Electricity (master metered) 0.000% 0.05489 0.000%Subtotal: Master Metered 0.14782 -3.599%
Total, Individually Metered Buildings 0.065%
(Total of 1 to 25 plus 26 & 27) rounded: 0.1%Total, Master Metered Buildings -2.670%
(Total of 1 to 25 plus 28 & 29) rounded: -2.7%
[1] Refer to Table 2.[2] Refer to Table 3.[3] Alameda County Mosquito Abatement District adopted Resolution 853-2, dropping the rate to zero in
FY 2001/02 and this expense is no longer being charged.[4] EBMUD has adopted alternative funding for the Seismic Improvement Program (FY 1996/97)
and no longer collects a separate parcel tax.
____________________________________________________________2003 AGA ReportBerkeley Rent Stabilization Board Page 18
____________________________________________________________October 2002
Seifel Consulting Inc.

2003 AGA Report 19 October 2002Berkeley Rent Stabilization Board Seifel Consulting Inc.
IV. Historical Rent Board General AdjustmentsThe following table summarizes the historical adjustments granted by the City of Berkeley RentStabilization Board.
Year General Adjustment
1981 5.0 percent plus 1.2 percent if landlord pays for all space heating
1982 9.0 percent plus $4 to $16 if landlord pays for heat and electricity (depending on
apartment size)
1983 4.75 percent plus 0.25 percent if landlord pays for gas or electricity
1984 0.0 percent
1985 2.0 percent
1986 3.0 percent plus $2.50 per month
1987 3.5 percent
1988 $25.00 per month
1989 3.0 percent plus 0.5 percent if landlord pays for gas or electricity
1990 $16.00 per month
1991 Greater of 4.0 percent or $17.00 per month
1992 $26 per month
1993 $20 per month
1994 $18 per month
1995 1.5 percent
1996 1.0 percent
1997 1.15 percent
1998 0.8 percent
1999 1 percent or $8.00 per month, whichever is less
2000 $6.00 per month
2001 $10 for individually metered apartments and $18 for master metered apartments
2002 3.5 percent or $30 for individually metered apartments, whichever was less, plus
an additional $9 per month for master metered apartments
Sources: Berkeley Rent Stabilization Board, BPA Economics; Glen Elder, Urban Economist;Seifel Consulting.
![DIRECTORY OF AGA CERTIFIED PRODUCTSDIRECTORY OF AGA CERTIFIED PRODUCTS June 2011 Edition ISSN 1328 – 2700 AGA PRODUCT CERTIFICATION SCHEME [Please refer to AGA office for entry updates/queries]](https://img.pdfslide.us/doc/110x75/60ac0f9dc317e30e6b343f7f/directory-of-aga-certified-products-directory-of-aga-certified-products-june-2011.jpg)
![Data Book AGA 60 D · Aluminium for version AGA 076 - AGA 106 [8] With gasket in NBR only for version single phase AGA 106 . CENTRIFUGAL PUMPS AGA CONSTRUCTIONS 60Hz 301 EBARA Pumps](https://img.pdfslide.us/doc/110x75/5e694725e04bf5741b5a9b0e/data-book-aga-60-d-aluminium-for-version-aga-076-aga-106-8-with-gasket-in-nbr.jpg)