Embed Size (px)
Citation preview
Spring 2013 End of Term Report
Published by the Office of Institutional
Research
Ivy Tech Community College
October 2013
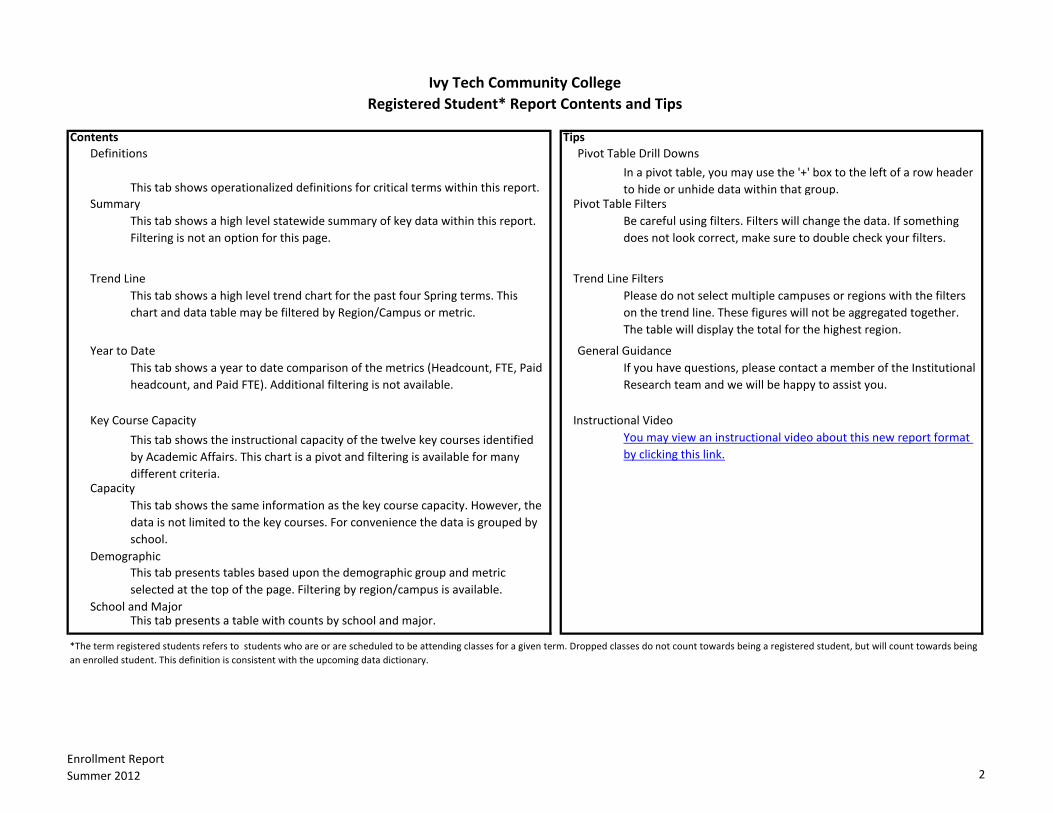
Contents Tips
Definitions Pivot Table Drill Downs
Summary Pivot Table Filters
Trend Line Trend Line Filters
Year to Date General Guidance
Key Course Capacity Instructional Video
Capacity
Demographic
School and Major
*The term registered students refers to students who are or are scheduled to be attending classes for a given term. Dropped classes do not count towards being a registered student, but will count towards being
an enrolled student. This definition is consistent with the upcoming data dictionary.
This tab presents a table with counts by school and major.
This tab presents tables based upon the demographic group and metric
selected at the top of the page. Filtering by region/campus is available.
Ivy Tech Community College
Registered Student* Report Contents and Tips
This tab shows the same information as the key course capacity. However, the
data is not limited to the key courses. For convenience the data is grouped by
school.
Please do not select multiple campuses or regions with the filters
on the trend line. These figures will not be aggregated together.
The table will display the total for the highest region.
Be careful using filters. Filters will change the data. If something
does not look correct, make sure to double check your filters.
If you have questions, please contact a member of the Institutional
Research team and we will be happy to assist you.
This tab shows operationalized definitions for critical terms within this report.In a pivot table, you may use the '+' box to the left of a row header
to hide or unhide data within that group.
This tab shows a high level statewide summary of key data within this report.
Filtering is not an option for this page.
This tab shows a high level trend chart for the past four Spring terms. This
chart and data table may be filtered by Region/Campus or metric.
This tab shows a year to date comparison of the metrics (Headcount, FTE, Paid
headcount, and Paid FTE). Additional filtering is not available.
You may view an instructional video about this new report format
by clicking this link.This tab shows the instructional capacity of the twelve key courses identified
by Academic Affairs. This chart is a pivot and filtering is available for many
different criteria.
Enrollment Report
Summer 2012 2
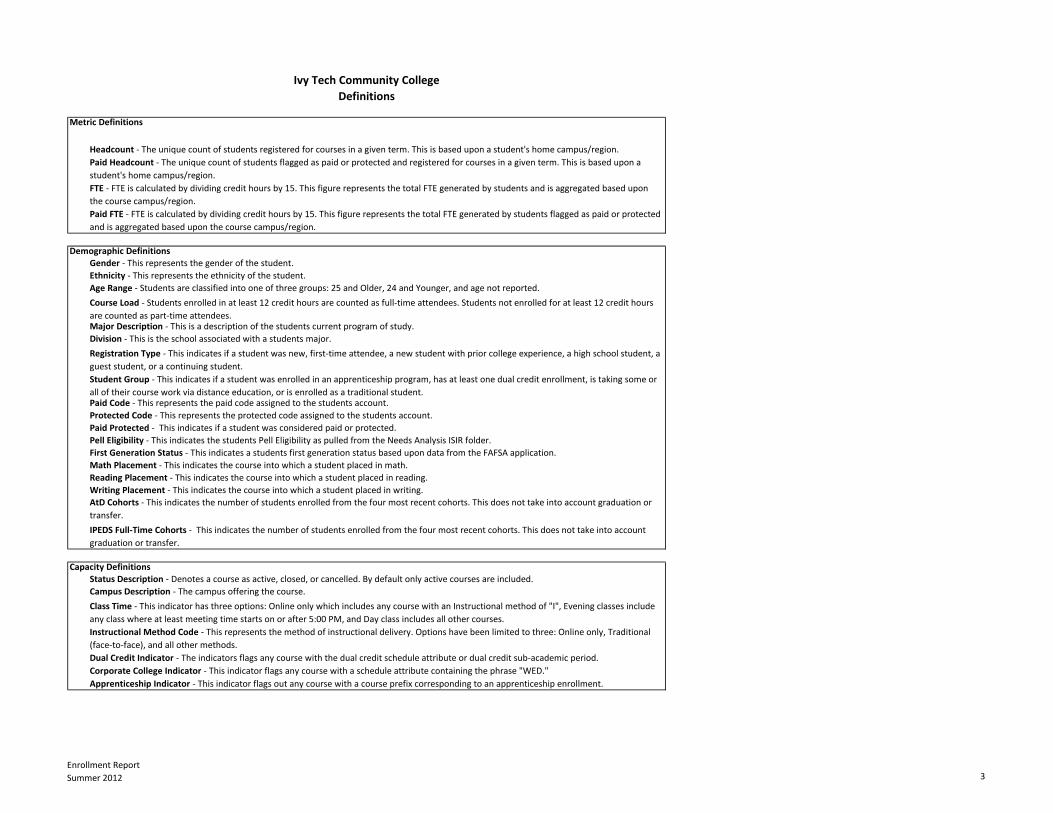
Metric Definitions
Demographic Definitions
Capacity Definitions
Apprenticeship Indicator - This indicator flags out any course with a course prefix corresponding to an apprenticeship enrollment.
Corporate College Indicator - This indicator flags any course with a schedule attribute containing the phrase "WED."
Dual Credit Indicator - The indicators flags any course with the dual credit schedule attribute or dual credit sub-academic period.
Headcount - The unique count of students registered for courses in a given term. This is based upon a student's home campus/region.
Paid Headcount - The unique count of students flagged as paid or protected and registered for courses in a given term. This is based upon a
student's home campus/region.
AtD Cohorts - This indicates the number of students enrolled from the four most recent cohorts. This does not take into account graduation or
transfer.
IPEDS Full-Time Cohorts - This indicates the number of students enrolled from the four most recent cohorts. This does not take into account
graduation or transfer.
FTE - FTE is calculated by dividing credit hours by 15. This figure represents the total FTE generated by students and is aggregated based upon
the course campus/region.
Paid FTE - FTE is calculated by dividing credit hours by 15. This figure represents the total FTE generated by students flagged as paid or protected
and is aggregated based upon the course campus/region.
Class Time - This indicator has three options: Online only which includes any course with an Instructional method of "I", Evening classes include
any class where at least meeting time starts on or after 5:00 PM, and Day class includes all other courses.
Instructional Method Code - This represents the method of instructional delivery. Options have been limited to three: Online only, Traditional
(face-to-face), and all other methods.
Campus Description - The campus offering the course.
Status Description - Denotes a course as active, closed, or cancelled. By default only active courses are included.
Paid Protected - This indicates if a student was considered paid or protected.
Pell Eligibility - This indicates the students Pell Eligibility as pulled from the Needs Analysis ISIR folder.
First Generation Status - This indicates a students first generation status based upon data from the FAFSA application.
Math Placement - This indicates the course into which a student placed in math.
Reading Placement - This indicates the course into which a student placed in reading.
Writing Placement - This indicates the course into which a student placed in writing.
Major Description - This is a description of the students current program of study.
Division - This is the school associated with a students major.
Registration Type - This indicates if a student was new, first-time attendee, a new student with prior college experience, a high school student, a
guest student, or a continuing student.
Student Group - This indicates if a student was enrolled in an apprenticeship program, has at least one dual credit enrollment, is taking some or
all of their course work via distance education, or is enrolled as a traditional student.Paid Code - This represents the paid code assigned to the students account.
Protected Code - This represents the protected code assigned to the students account.
Course Load - Students enrolled in at least 12 credit hours are counted as full-time attendees. Students not enrolled for at least 12 credit hours
are counted as part-time attendees.
Ivy Tech Community College
Definitions
Gender - This represents the gender of the student.
Ethnicity - This represents the ethnicity of the student.
Age Range - Students are classified into one of three groups: 25 and Older, 24 and Younger, and age not reported.
Enrollment Report
Summer 2012 3

1
2
31
-1% -4% 70%
7% 5% 74%
Capacity
Currently we are at 70% of the instructional
capacity for all courses in the Spring.
Currently we are at 74% of the instructional
capacity for identified key courses in Spring
2012.
Ivy Tech Community College
Statewide Summary
Spring 2012 Registered Student Counts as of May 6, 2012
Indicates enrollment is up 5% or more compared to last year
Indicates enrollment is between 5% down or 5% up compared to last year
Indicates enrollment is down 5% or more compared to last year
The more complete the bar chart the closer we are to 100% capacity.
FTE for Spring 2012 is down 4% compared to
Spring 2011.
Headcount for Spring 2012 is down 1%
compared to Spring 2011.
Paid Headcount for Spring 2012 is up
7% compared to Spring 2011.
Headcount FTE
Paid FTE for Spring 2012 is up 5% compared
to Spring 2011.
Enrollment Report
Summer 2012 4
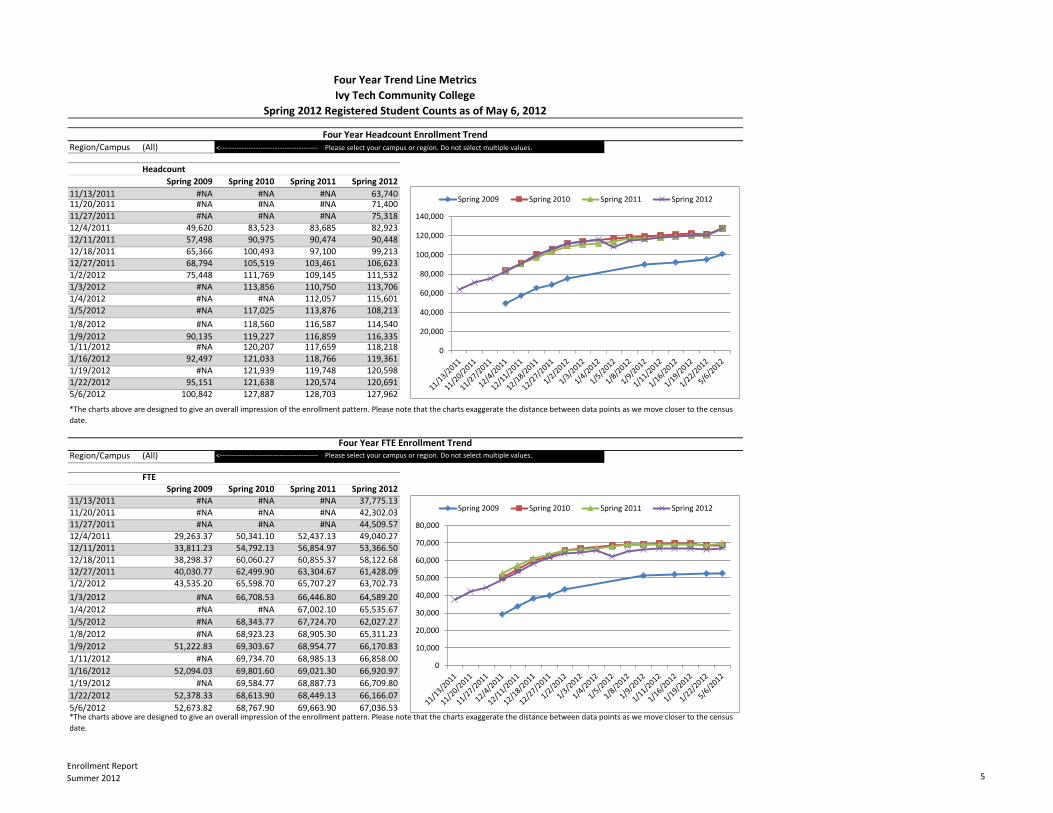
Region/Campus (All)
Headcount
Spring 2009 Spring 2010 Spring 2011 Spring 2012
11/13/2011 #NA #NA #NA 63,74011/20/2011 #NA #NA #NA 71,400
11/27/2011 #NA #NA #NA 75,318
12/4/2011 49,620 83,523 83,685 82,923
12/11/2011 57,498 90,975 90,474 90,448
12/18/2011 65,366 100,493 97,100 99,213
12/27/2011 68,794 105,519 103,461 106,623
1/2/2012 75,448 111,769 109,145 111,532
1/3/2012 #NA 113,856 110,750 113,706
1/4/2012 #NA #NA 112,057 115,601
1/5/2012 #NA 117,025 113,876 108,213
1/8/2012 #NA 118,560 116,587 114,540
1/9/2012 90,135 119,227 116,859 116,3351/11/2012 #NA 120,207 117,659 118,218
1/16/2012 92,497 121,033 118,766 119,361
1/19/2012 #NA 121,939 119,748 120,598
1/22/2012 95,151 121,638 120,574 120,691
5/6/2012 100,842 127,887 128,703 127,962
Region/Campus (All)
FTE
Spring 2009 Spring 2010 Spring 2011 Spring 2012
11/13/2011 #NA #NA #NA 37,775.13
11/20/2011 #NA #NA #NA 42,302.03
11/27/2011 #NA #NA #NA 44,509.57
12/4/2011 29,263.37 50,341.10 52,437.13 49,040.27
12/11/2011 33,811.23 54,792.13 56,854.97 53,366.50
12/18/2011 38,298.37 60,060.27 60,855.37 58,122.68
12/27/2011 40,030.77 62,499.90 63,304.67 61,428.09
1/2/2012 43,535.20 65,598.70 65,707.27 63,702.73
1/3/2012 #NA 66,708.53 66,446.80 64,589.20
1/4/2012 #NA #NA 67,002.10 65,535.67
1/5/2012 #NA 68,343.77 67,724.70 62,027.27
1/8/2012 #NA 68,923.23 68,905.30 65,311.23
1/9/2012 51,222.83 69,303.67 68,954.77 66,170.83
1/11/2012 #NA 69,734.70 68,985.13 66,858.00
1/16/2012 52,094.03 69,801.60 69,021.30 66,920.97
1/19/2012 #NA 69,584.77 68,887.73 66,709.80
1/22/2012 52,378.33 68,613.90 68,449.13 66,166.07
5/6/2012 52,673.82 68,767.90 69,663.90 67,036.53*The charts above are designed to give an overall impression of the enrollment pattern. Please note that the charts exaggerate the distance between data points as we move closer to the census
date.
*The charts above are designed to give an overall impression of the enrollment pattern. Please note that the charts exaggerate the distance between data points as we move closer to the census
date.
Four Year Trend Line Metrics
Ivy Tech Community College
Four Year Headcount Enrollment Trend
Four Year FTE Enrollment Trend
Spring 2012 Registered Student Counts as of May 6, 2012
<----------------------------------------- Please select your campus or region. Do not select multiple values.
<----------------------------------------- Please select your campus or region. Do not select multiple values.
0
10,000
20,000
30,000
40,000
50,000
60,000
70,000
80,000
Spring 2009 Spring 2010 Spring 2011 Spring 2012
0
20,000
40,000
60,000
80,000
100,000
120,000
140,000
Spring 2009 Spring 2010 Spring 2011 Spring 2012
Enrollment Report
Summer 2012 5
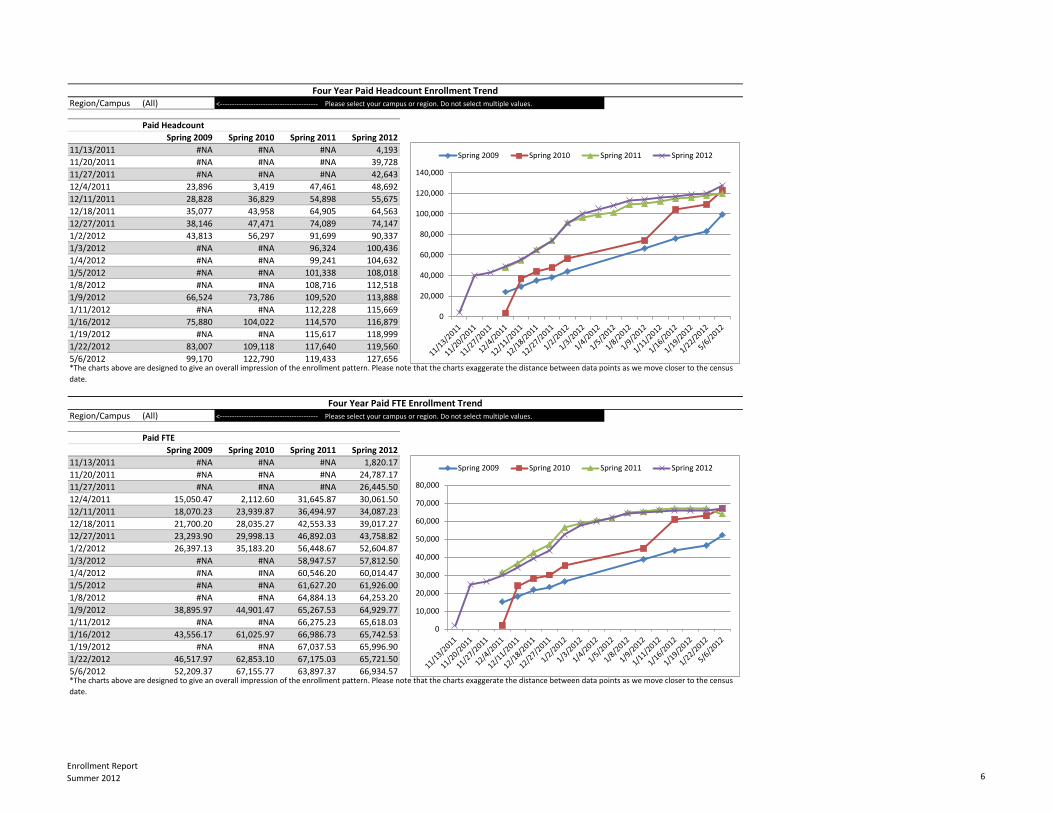
Region/Campus (All)
Paid Headcount
Spring 2009 Spring 2010 Spring 2011 Spring 2012
11/13/2011 #NA #NA #NA 4,193
11/20/2011 #NA #NA #NA 39,728
11/27/2011 #NA #NA #NA 42,643
12/4/2011 23,896 3,419 47,461 48,692
12/11/2011 28,828 36,829 54,898 55,675
12/18/2011 35,077 43,958 64,905 64,563
12/27/2011 38,146 47,471 74,089 74,147
1/2/2012 43,813 56,297 91,699 90,337
1/3/2012 #NA #NA 96,324 100,436
1/4/2012 #NA #NA 99,241 104,632
1/5/2012 #NA #NA 101,338 108,018
1/8/2012 #NA #NA 108,716 112,518
1/9/2012 66,524 73,786 109,520 113,888
1/11/2012 #NA #NA 112,228 115,669
1/16/2012 75,880 104,022 114,570 116,879
1/19/2012 #NA #NA 115,617 118,999
1/22/2012 83,007 109,118 117,640 119,560
5/6/2012 99,170 122,790 119,433 127,656
Region/Campus (All)
Paid FTE
Spring 2009 Spring 2010 Spring 2011 Spring 2012
11/13/2011 #NA #NA #NA 1,820.17
11/20/2011 #NA #NA #NA 24,787.17
11/27/2011 #NA #NA #NA 26,445.50
12/4/2011 15,050.47 2,112.60 31,645.87 30,061.50
12/11/2011 18,070.23 23,939.87 36,494.97 34,087.23
12/18/2011 21,700.20 28,035.27 42,553.33 39,017.27
12/27/2011 23,293.90 29,998.13 46,892.03 43,758.82
1/2/2012 26,397.13 35,183.20 56,448.67 52,604.87
1/3/2012 #NA #NA 58,947.57 57,812.50
1/4/2012 #NA #NA 60,546.20 60,014.47
1/5/2012 #NA #NA 61,627.20 61,926.00
1/8/2012 #NA #NA 64,884.13 64,253.20
1/9/2012 38,895.97 44,901.47 65,267.53 64,929.77
1/11/2012 #NA #NA 66,275.23 65,618.03
1/16/2012 43,556.17 61,025.97 66,986.73 65,742.53
1/19/2012 #NA #NA 67,037.53 65,996.90
1/22/2012 46,517.97 62,853.10 67,175.03 65,721.50
5/6/2012 52,209.37 67,155.77 63,897.37 66,934.57
<----------------------------------------- Please select your campus or region. Do not select multiple values.
*The charts above are designed to give an overall impression of the enrollment pattern. Please note that the charts exaggerate the distance between data points as we move closer to the census
date.
*The charts above are designed to give an overall impression of the enrollment pattern. Please note that the charts exaggerate the distance between data points as we move closer to the census
date.
Four Year Paid Headcount Enrollment Trend
Four Year Paid FTE Enrollment Trend
<----------------------------------------- Please select your campus or region. Do not select multiple values.
0
20,000
40,000
60,000
80,000
100,000
120,000
140,000
Spring 2009 Spring 2010 Spring 2011 Spring 2012
0
10,000
20,000
30,000
40,000
50,000
60,000
70,000
80,000
Spring 2009 Spring 2010 Spring 2011 Spring 2012
Enrollment Report
Summer 2012 6

% Change % Change % Change % Change
Spring 2011
End of Term
Spring 2012
End of Term
Spring 2012
End of Term
Spring 2011
End of Term
Spring 2012
End of Term
Spring 2012
End of Term
Spring 2011
End of Term
Spring 2012
End of Term
Spring 2012
End of Term
Spring 2011
End of Term
Spring 2012
End of Term
Spring 2012
End of Term
Northwest 12,001 11,946 0% 7,446.90 7,197.27 -3% 11,868 11,897 0% 7,276.57 7,180.40 -1%East Chicago 2,429 2,664 10% 1,075.73 1,074.13 0% 2,422 2,650 9% 1,072.73 1,070.87 0%Gary 4,147 3,865 -7% 3,800.60 3,647.77 -4% 4,043 3,845 -5% 3,645.07 3,638.90 0%Michigan City 1,606 1,577 -2% 708.63 659.77 -7% 1,602 1,574 -2% 705.50 659.57 -7%Valparaiso 3,819 3,840 1% 1,861.93 1,815.60 -2% 3,801 3,828 1% 1,853.27 1,811.07 -2%
North Central 9,139 9,472 4% 4,823.57 4,746.67 -2% 6,773 9,438 39% 3,564.10 4,737.60 33%Elkhart 2,056 2,264 10% 1,066.07 1,095.07 3% 1,442 2,260 57% 724.47 1,093.40 51%South Bend 5,750 5,840 2% 3,096.93 3,046.47 -2% 4,076 5,816 43% 2,234.80 3,040.93 36%Warsaw 1,333 1,368 3% 660.57 605.13 -8% 1,255 1,362 9% 604.83 603.27 0%
Northeast 12,069 12,052 0% 6,195.27 6,284.93 1% 12,047 12,048 0% 6,151.33 6,283.07 2%Lafayette 9,496 9,249 -3% 5,306.23 5,161.27 -3% 7,966 9,227 16% 4,303.17 5,152.27 20%Kokomo 6,065 5,852 -4% 3,325.50 3,060.33 -8% 4,649 5,832 25% 2,484.10 3,055.60 23%
Kokomo 4,914 4,521 -8% 2,728.83 2,506.73 -8% 3,800 4,507 19% 2,053.70 2,502.67 22%Logansport 1,151 1,331 16% 596.67 553.60 -7% 849 1,325 56% 430.40 552.93 28%
East Central 9,257 8,615 -7% 6,058.67 5,729.20 -5% 7,197 8,580 19% 4,750.50 5,721.27 20%Anderson 2,501 2,269 -9% 1,221.13 1,250.67 2% 1,910 2,258 18% 922.53 1,248.00 35%Marion 1,566 1,604 2% 905.47 983.40 9% 1,230 1,598 30% 705.73 981.67 39%Muncie 5,190 4,742 -9% 3,932.07 3,495.13 -11% 4,057 4,724 16% 3,122.23 3,491.60 12%
Terre Haute 6,947 6,721 -3% 4,051.30 3,681.33 -9% 6,924 6,696 -3% 4,002.63 3,673.60 -8%Central Indiana 26,363 27,520 4% 12,345.57 12,403.53 0% 26,149 27,493 5% 12,192.80 12,392.70 2%Richmond 4,663 4,176 -10% 2,539.40 2,128.07 -16% 4,589 4,161 -9% 2,472.90 2,122.20 -14%Columbus 7,272 7,320 1% 3,877.73 3,544.00 -9% 6,111 7,302 19% 3,202.83 3,536.87 10%Southeast 4,134 4,080 -1% 2,215.60 2,116.80 -4% 3,961 4,065 3% 2,126.13 2,111.20 -1%
Lawrenceburg 2,499 2,523 1% 1,218.13 1,193.60 -2% 2,446 2,515 3% 1,185.47 1,191.27 0%Madison 1,635 1,557 -5% 997.47 923.20 -7% 1,515 1,550 2% 940.67 919.93 -2%
Southwest 8,131 7,810 -4% 4,297.87 3,834.50 -11% 8,093 7,805 -4% 4,265.13 3,833.10 -10%Sellersburg 6,791 6,786 0% 3,399.83 3,399.20 0% 6,763 6,778 0% 3,374.83 3,396.60 1%Bloomington 6,338 6,318 0% 3,769.47 3,739.23 -1% 6,312 6,290 0% 3,720.13 3,728.10 0%Distance Appr 37 45 22% 10.60 10.20 -4% 31 44 42% 10.00 10.00 0%
Grand Total 128,703 127,962 -1% 69,663.50 67,036.53 -4% 119,433 127,656 7% 63,897.17 66,934.57 5%
Headcount FTE Paid Headcount Paid FTE
Metric Comparison by Region
Ivy Tech Community College
Spring 2011 End of Term vs. Spring 2012 End of Term
*Headcount is based upon a student's home campus and FTE is based upon the course campus of each course enrollment.
Year to Date Spring 2011 vs. Spring 2012
Enrollment Report
Summer 2012 7

0.75
Status Description Active Monday Ind (All)
Campus Description (All) Tuesday Ind (All)
Class Time (All) Wednesday Ind (All)
Instructional Method Code (All) Thursday Ind (All)
Dual Credit Indicator Not Dual Credit Friday Ind (All)
Corporate College Indicator Not Corporate College Saturday Ind (All)
Apprenticeship Indicator Not Apprentice
Spring 2011 End of Term Spring 2012 End of Term
Number of Sections
Actual
Enrollment
Maximum
Enrollment Capacity
Average
Actual
Enrollment Number of Sections
Actual
Enrollment
Maximum
Enrollment Capacity
Average Actual
Enrollment
APHY101 296 6,332 7,248 87% 21.4 299 5,910 7,101 83% 19.8
ENGL083 0 0 0 0% 0.0 339 5,327 7,984 67% 15.7
ENGL093 0 0 0 0% 0.0 391 6,003 8,811 68% 15.4
ENGL111 767 15,526 18,227 85% 20.2 795 14,714 18,205 81% 18.5
IVYT101 486 8,785 11,746 75% 18.1 515 7,916 12,136 65% 15.4
IVYT120 365 7,123 9,044 79% 19.5 475 8,379 11,549 73% 17.6
MATH015 450 9,374 11,294 83% 20.8 430 8,229 10,512 78% 19.1
MATH023 331 6,165 8,265 75% 18.6 318 5,660 7,613 74% 17.8
MATH035 225 4,397 5,687 77% 19.5 268 4,231 6,495 65% 15.8
MATH043 238 4,474 6,113 73% 18.8 236 3,723 5,486 68% 15.8
MATH118 353 7,723 9,679 80% 21.9 365 7,658 9,824 78% 21.0
MATH136 195 4,654 5,681 82% 23.9 231 4,808 6,320 76% 20.8
Grand Total 3,706 74,553 92,984 80% 20.1 4,662 82,558 112,036 74% 17.7
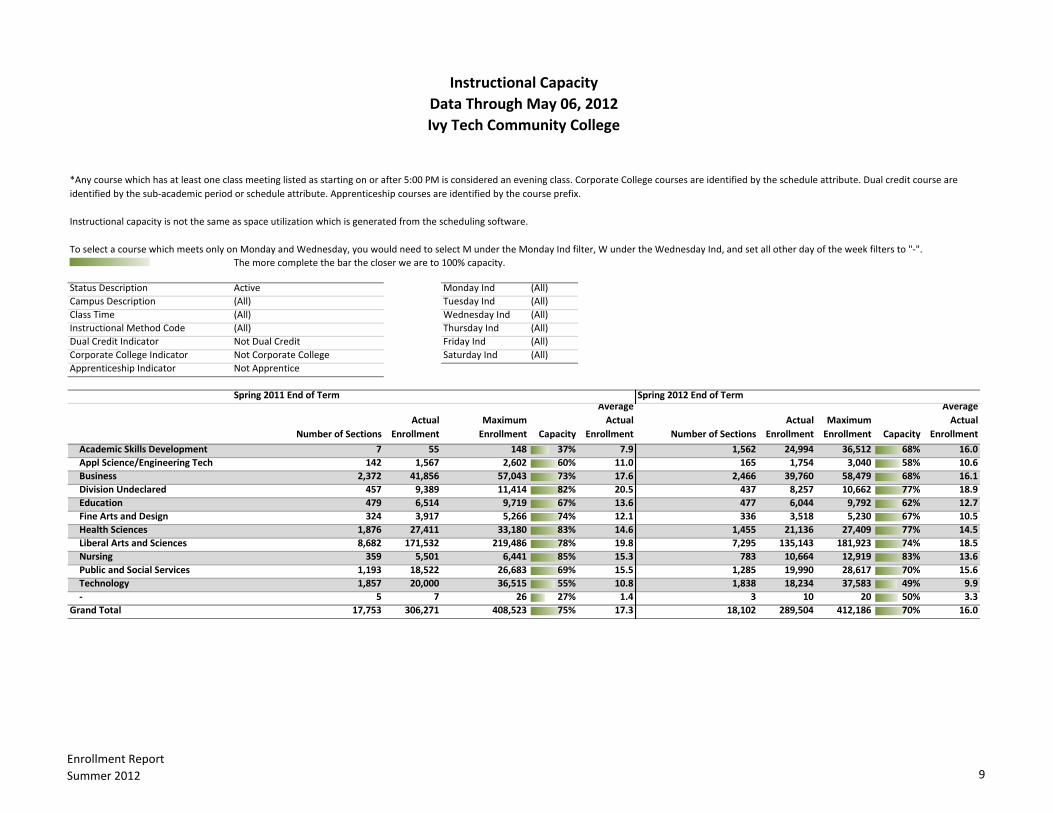
Key Course Instructional Capacity
Data Through May 06, 2012
Ivy Tech Community College
*Any course which has at least one class meeting listed as starting on or after 5:00 PM is considered an evening class. Corporate College courses are identified by the schedule attribute. Dual credit course are identified by
the sub-academic period or schedule attribute. Apprenticeship courses are identified by the course prefix.
Instructional capacity is not the same as space utilization which is generated from the scheduling software.
To select a course which meets only on Monday and Wednesday, you would need to select M under the Monday Ind filter, W under the Wednesday Ind, and set all other day of the week filters to "-".
The more complete the bar the closer we are to 100% capacity.
Enrollment Report
Summer 2012 8
0.75
Status Description Active Monday Ind (All)
Campus Description (All) Tuesday Ind (All)
Class Time (All) Wednesday Ind (All)
Instructional Method Code (All) Thursday Ind (All)
Dual Credit Indicator Not Dual Credit Friday Ind (All)
Corporate College Indicator Not Corporate College Saturday Ind (All)
Apprenticeship Indicator Not Apprentice
Spring 2011 End of Term Spring 2012 End of Term
Number of Sections
Actual
Enrollment
Maximum
Enrollment Capacity
Average
Actual
Enrollment Number of Sections
Actual
Enrollment
Maximum
Enrollment Capacity
Average
Actual
Enrollment
Academic Skills Development 7 55 148 37% 7.9 1,562 24,994 36,512 68% 16.0
Appl Science/Engineering Tech 142 1,567 2,602 60% 11.0 165 1,754 3,040 58% 10.6
Business 2,372 41,856 57,043 73% 17.6 2,466 39,760 58,479 68% 16.1
Division Undeclared 457 9,389 11,414 82% 20.5 437 8,257 10,662 77% 18.9
Education 479 6,514 9,719 67% 13.6 477 6,044 9,792 62% 12.7
Fine Arts and Design 324 3,917 5,266 74% 12.1 336 3,518 5,230 67% 10.5
Health Sciences 1,876 27,411 33,180 83% 14.6 1,455 21,136 27,409 77% 14.5
Liberal Arts and Sciences 8,682 171,532 219,486 78% 19.8 7,295 135,143 181,923 74% 18.5
Nursing 359 5,501 6,441 85% 15.3 783 10,664 12,919 83% 13.6
Public and Social Services 1,193 18,522 26,683 69% 15.5 1,285 19,990 28,617 70% 15.6
Technology 1,857 20,000 36,515 55% 10.8 1,838 18,234 37,583 49% 9.9
- 5 7 26 27% 1.4 3 10 20 50% 3.3
Grand Total 17,753 306,271 408,523 75% 17.3 18,102 289,504 412,186 70% 16.0
Instructional Capacity
Data Through May 06, 2012
Ivy Tech Community College
*Any course which has at least one class meeting listed as starting on or after 5:00 PM is considered an evening class. Corporate College courses are identified by the schedule attribute. Dual credit course are
identified by the sub-academic period or schedule attribute. Apprenticeship courses are identified by the course prefix.
Instructional capacity is not the same as space utilization which is generated from the scheduling software.
To select a course which meets only on Monday and Wednesday, you would need to select M under the Monday Ind filter, W under the Wednesday Ind, and set all other day of the week filters to "-".
The more complete the bar the closer we are to 100% capacity.
Enrollment Report
Summer 2012 9

Region Description (All)
Campus Description (All)
Spring 2011
End of Term
Spring 2012
End of Term
Headcount FTE Headcount FTE % Headcount Change % FTE Change
Female 70,632 39,693.00 69,450 38,216.70 -2% -4%
Male 55,264 28,852.63 55,366 27,767.00 0% -4%
Gender Not Reported 2,807 1,117.87 3,146 1,052.83 12% -6%
Grand Total 128,703 69,663.50 127,962 67,036.53 -1% -4%
Region Description (All)
Campus Description (All)
Spring 2011
End of Term
Spring 2012
End of Term
Headcount FTE Headcount FTE % Headcount Change % FTE Change
Caucasian 89,816 50,469.10 87,633 47,696.17 -2% -5%
African American 16,054 9,198.27 16,234 9,247.40 1% 1%
Hispanic 4,175 2,248.33 4,364 2,341.93 5% 4%
Other Ethnicity or Ethnicity Not Reported 18,658 7,747.80 19,731 7,751.03 6% 0%
Grand Total 128,703 69,663.50 127,962 67,036.53 -1% -4%
Region Description (All)
Campus Description (All)
Spring 2011
End of Term
Spring 2012
End of Term
Headcount FTE Headcount FTE % Headcount Change % FTE Change
24 and Younger 66,050 34,444.43 69,142 34,371.13 5% 0%
25 and Older 61,892 34,989.40 57,939 32,460.13 -6% -7%
Age Not Reported 761 229.67 881 205.27 16% -11%
Grand Total 128,703 69,663.50 127,962 67,036.53 -1% -4%
Demographic Profile
One Year Comparison of Headcount and FTE by Gender
One Year Comparison of Headcount and FTE by Ethnicity
Year to Date Spring 2011 vs. Spring 2012
May 08, 2011 vs. May 06, 2012
Ivy Tech Community College
One Year Comparison of Headcount and FTE by Age Range
Enrollment Report
Summer 2012 10
Region Description (All)
Campus Description (All)
Spring 2011
End of Term
Spring 2012
End of Term
Headcount FTE Headcount FTE % Headcount Change % FTE Change
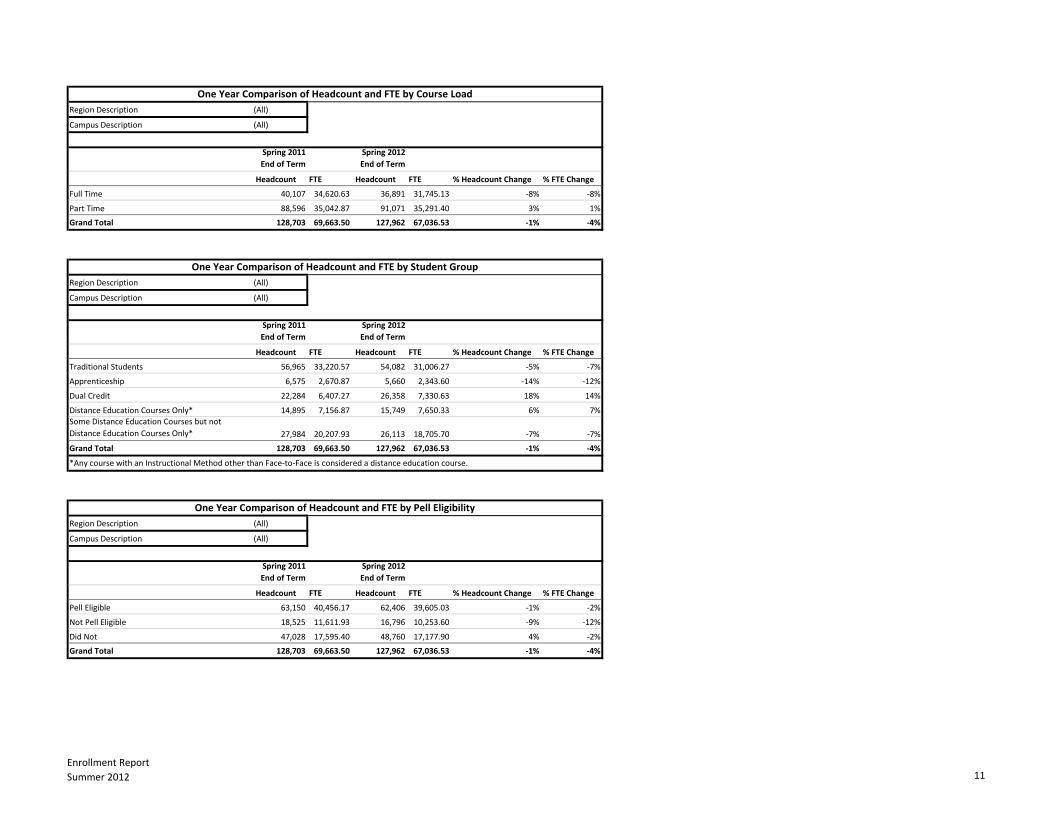
Full Time 40,107 34,620.63 36,891 31,745.13 -8% -8%
Part Time 88,596 35,042.87 91,071 35,291.40 3% 1%
Grand Total 128,703 69,663.50 127,962 67,036.53 -1% -4%
Region Description (All)
Campus Description (All)
Spring 2011
End of Term
Spring 2012
End of Term
Headcount FTE Headcount FTE % Headcount Change % FTE Change
Traditional Students 56,965 33,220.57 54,082 31,006.27 -5% -7%
Apprenticeship 6,575 2,670.87 5,660 2,343.60 -14% -12%
Dual Credit 22,284 6,407.27 26,358 7,330.63 18% 14%
Distance Education Courses Only* 14,895 7,156.87 15,749 7,650.33 6% 7%
Some Distance Education Courses but not
Distance Education Courses Only* 27,984 20,207.93 26,113 18,705.70 -7% -7%
Grand Total 128,703 69,663.50 127,962 67,036.53 -1% -4%
Region Description (All)
Campus Description (All)
Spring 2011
End of Term
Spring 2012
End of Term
Headcount FTE Headcount FTE % Headcount Change % FTE Change
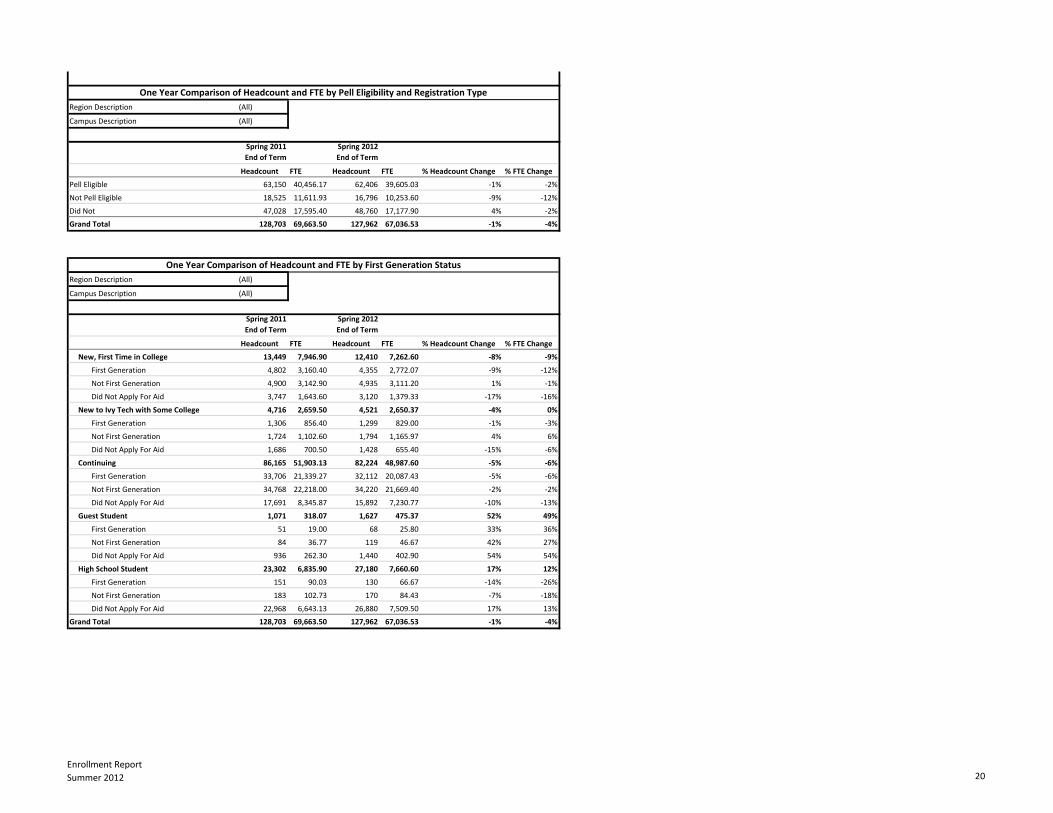
Pell Eligible 63,150 40,456.17 62,406 39,605.03 -1% -2%
Not Pell Eligible 18,525 11,611.93 16,796 10,253.60 -9% -12%
Did Not 47,028 17,595.40 48,760 17,177.90 4% -2%
Grand Total 128,703 69,663.50 127,962 67,036.53 -1% -4%
One Year Comparison of Headcount and FTE by Course Load
One Year Comparison of Headcount and FTE by Student Group
One Year Comparison of Headcount and FTE by Pell Eligibility
*Any course with an Instructional Method other than Face-to-Face is considered a distance education course.
Enrollment Report
Summer 2012 11

Region Description (All)
Campus Description (All)
Spring 2011
End of Term
Spring 2012
End of Term
Headcount FTE Headcount FTE % Headcount Change % FTE Change
First Generation 40,016 25,465.10 37,964 23,780.97 -5% -7%
Not First Generation 41,659 26,603.00 41,238 26,077.67 -1% -2%
Did Not Apply For Aid 47,028 17,595.40 48,760 17,177.90 4% -2%
Grand Total 128,703 69,663.50 127,962 67,036.53 -1% -4%
Region Description (All)
Campus Description (All)
Spring 2011
End of Term
Spring 2012
End of Term
Headcount FTE Headcount FTE % Headcount Change % FTE Change
Assessment below minimum standard. 3,653 1,915.87 2,554 1,212.43 -30% -37%
MATH015 32,982 19,680.43 30,736 18,193.23 -7% -8%
MATH023 24,874 15,132.80 24,786 14,870.17 0% -2%
MATH118 17,402 10,188.43 18,411 10,712.47 6% 5%
MATH043 2,770 1,615.33 2,910 1,673.83 5% 4%
MATH136 24,808 13,407.57 22,269 11,861.17 -10% -12%
MATH200 1,783 985.07 1,737 987.30 -3% 0%
MATH211 811 413.73 827 449.53 2% 9%
No assessment score found. 19,620 6,324.27 23,732 7,076.40 21% 12%
Grand Total 128,703 69,663.50 127,962 67,036.53 -1% -4%
Region Description (All)
Campus Description (All)
Spring 2011
End of Term
Spring 2012
End of Term
Headcount FTE Headcount FTE % Headcount Change % FTE Change
Assessment below minimum standard. 1,261 569.90 996 403.13 -21% -29%
ENGL083 20,991 12,065.03 20,721 11,692.73 -1% -3%
ENGL111 89,101 51,365.07 85,932 48,854.73 -4% -5%
No assessment score found. 17,350 5,663.50 20,313 6,085.93 17% 7%
Grand Total 128,703 69,663.50 127,962 67,036.53 -1% -4%
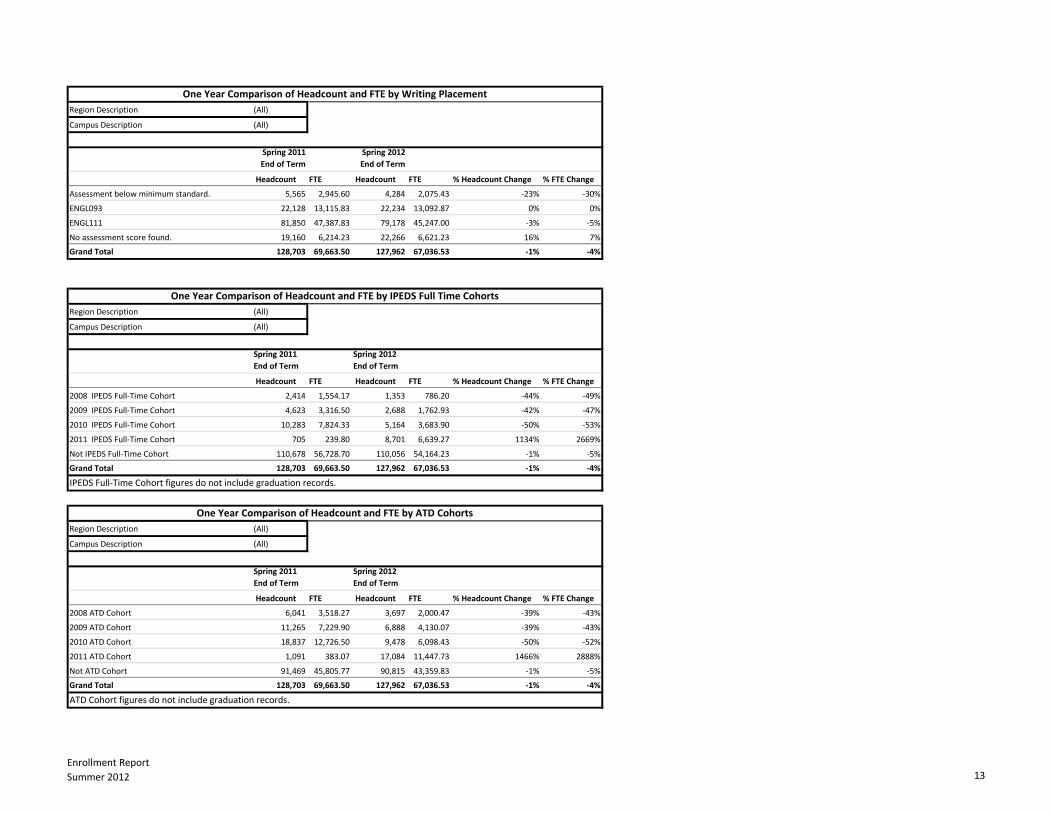
One Year Comparison of Headcount and FTE by Math Placement
One Year Comparison of Headcount and FTE by Reading Placement
One Year Comparison of Headcount and FTE by First Generation Status
Enrollment Report
Summer 2012 12
Region Description (All)
Campus Description (All)
Spring 2011
End of Term
Spring 2012
End of Term
Headcount FTE Headcount FTE % Headcount Change % FTE Change
Assessment below minimum standard. 5,565 2,945.60 4,284 2,075.43 -23% -30%
ENGL093 22,128 13,115.83 22,234 13,092.87 0% 0%
ENGL111 81,850 47,387.83 79,178 45,247.00 -3% -5%
No assessment score found. 19,160 6,214.23 22,266 6,621.23 16% 7%
Grand Total 128,703 69,663.50 127,962 67,036.53 -1% -4%
Region Description (All)
Campus Description (All)
Spring 2011
End of Term
Spring 2012
End of Term
Headcount FTE Headcount FTE % Headcount Change % FTE Change
2008 IPEDS Full-Time Cohort 2,414 1,554.17 1,353 786.20 -44% -49%
2009 IPEDS Full-Time Cohort 4,623 3,316.50 2,688 1,762.93 -42% -47%
2010 IPEDS Full-Time Cohort 10,283 7,824.33 5,164 3,683.90 -50% -53%
2011 IPEDS Full-Time Cohort 705 239.80 8,701 6,639.27 1134% 2669%
Not IPEDS Full-Time Cohort 110,678 56,728.70 110,056 54,164.23 -1% -5%
Grand Total 128,703 69,663.50 127,962 67,036.53 -1% -4%
Region Description (All)
Campus Description (All)
Spring 2011
End of Term
Spring 2012
End of Term
Headcount FTE Headcount FTE % Headcount Change % FTE Change
2008 ATD Cohort 6,041 3,518.27 3,697 2,000.47 -39% -43%
2009 ATD Cohort 11,265 7,229.90 6,888 4,130.07 -39% -43%
2010 ATD Cohort 18,837 12,726.50 9,478 6,098.43 -50% -52%
2011 ATD Cohort 1,091 383.07 17,084 11,447.73 1466% 2888%
Not ATD Cohort 91,469 45,805.77 90,815 43,359.83 -1% -5%
Grand Total 128,703 69,663.50 127,962 67,036.53 -1% -4%
One Year Comparison of Headcount and FTE by Writing Placement
One Year Comparison of Headcount and FTE by IPEDS Full Time Cohorts
One Year Comparison of Headcount and FTE by ATD Cohorts
IPEDS Full-Time Cohort figures do not include graduation records.
ATD Cohort figures do not include graduation records.
Enrollment Report
Summer 2012 13

Region Description (All)
Campus Description (All)
Spring 2011
End of Term
Spring 2012
End of Term
Headcount FTE Headcount FTE % Headcount Change % FTE Change
School of Applied Science and Engineering Technology 1,537 1,057.93 1,800 1,201.07 17% 14%
School of Business 18,303 11,428.97 17,867 11,006.80 -2% -4%
School of Education 5,323 3,274.73 4,763 2,885.53 -11% -12%
School of Fine Arts and Design 1,661 1,050.80 1,540 947.60 -7% -10%
School of Health Sciences 9,661 6,022.67 10,615 6,475.80 10% 8%
School of Liberal Arts and Sciences 19,123 11,878.93 16,954 10,515.93 -11% -11%
School of Nursing 3,444 2,240.10 2,774 1,784.53 -19% -20%
School of Public and Social Services 11,919 7,765.47 12,545 8,111.73 5% 4%
School of Technology 14,682 7,661.23 12,678 6,581.20 -14% -14%
Other 14,858 8,554.87 14,366 8,172.90 -3% -4%
Courses Only/High School 27,754 8,617.07 31,718 9,265.23 14% 8%
Indiana College Network 438 110.73 342 88.20 -22% -20%
Grand Total 128,703 69,663.50 127,962 67,036.53 -1% -4%
One Year Comparison of Headcount and FTE by School, Major, and Registration Type
School and Major Counts
Year to Date Spring 2011 vs. Spring 2012
May 08, 2011 vs. May 06, 2012
Ivy Tech Community College
Region Description (All)
Campus Description (All)
Spring 2011
End of Term
Spring 2012
End of Term
Headcount FTE Headcount FTE % Headcount Change % FTE Change
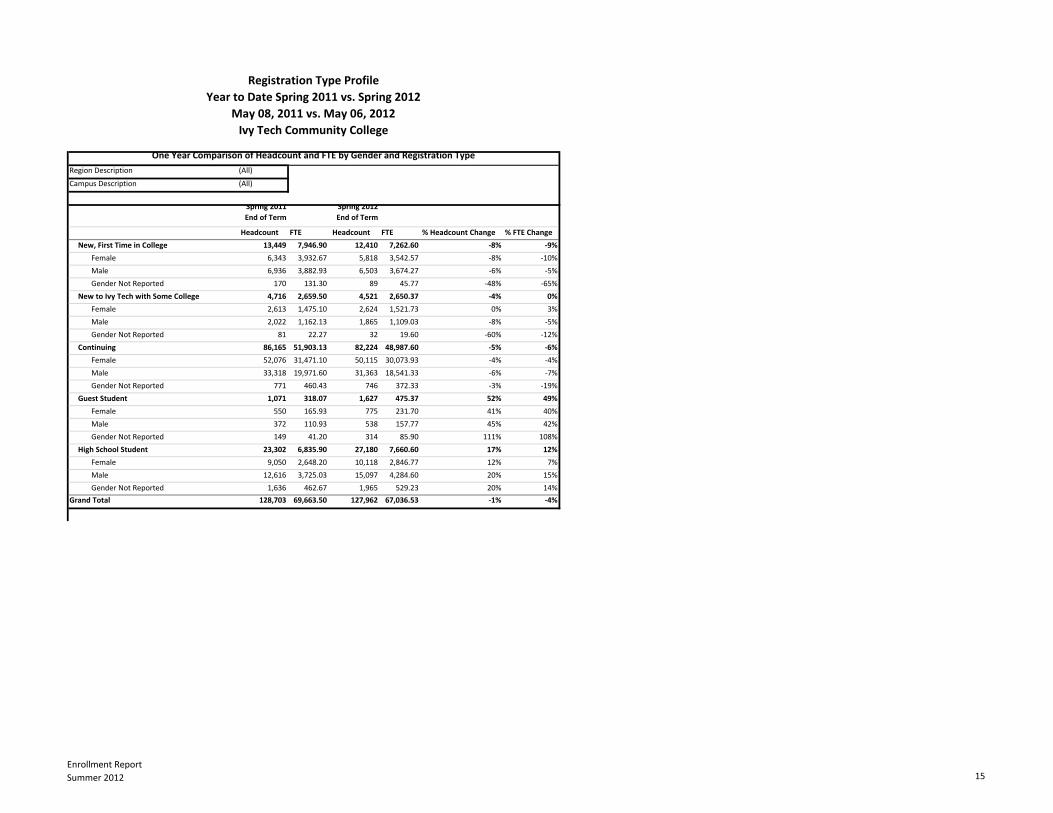
New, First Time in College 13,449 7,946.90 12,410 7,262.60 -8% -9%
Female 6,343 3,932.67 5,818 3,542.57 -8% -10%
Male 6,936 3,882.93 6,503 3,674.27 -6% -5%
Gender Not Reported 170 131.30 89 45.77 -48% -65%
New to Ivy Tech with Some College 4,716 2,659.50 4,521 2,650.37 -4% 0%
Female 2,613 1,475.10 2,624 1,521.73 0% 3%
Male 2,022 1,162.13 1,865 1,109.03 -8% -5%
Gender Not Reported 81 22.27 32 19.60 -60% -12%
Continuing 86,165 51,903.13 82,224 48,987.60 -5% -6%
Female 52,076 31,471.10 50,115 30,073.93 -4% -4%
Male 33,318 19,971.60 31,363 18,541.33 -6% -7%
Gender Not Reported 771 460.43 746 372.33 -3% -19%
Guest Student 1,071 318.07 1,627 475.37 52% 49%
Female 550 165.93 775 231.70 41% 40%
Male 372 110.93 538 157.77 45% 42%
Gender Not Reported 149 41.20 314 85.90 111% 108%
High School Student 23,302 6,835.90 27,180 7,660.60 17% 12%
Female 9,050 2,648.20 10,118 2,846.77 12% 7%
Male 12,616 3,725.03 15,097 4,284.60 20% 15%
Gender Not Reported 1,636 462.67 1,965 529.23 20% 14%
Grand Total 128,703 69,663.50 127,962 67,036.53 -1% -4%
Registration Type Profile
Year to Date Spring 2011 vs. Spring 2012
May 08, 2011 vs. May 06, 2012
Ivy Tech Community College
One Year Comparison of Headcount and FTE by Gender and Registration Type
Enrollment Report
Summer 2012 15
Region Description (All)
Campus Description (All)
Spring 2011
End of Term
Spring 2012
End of Term
Headcount FTE Headcount FTE % Headcount Change % FTE Change
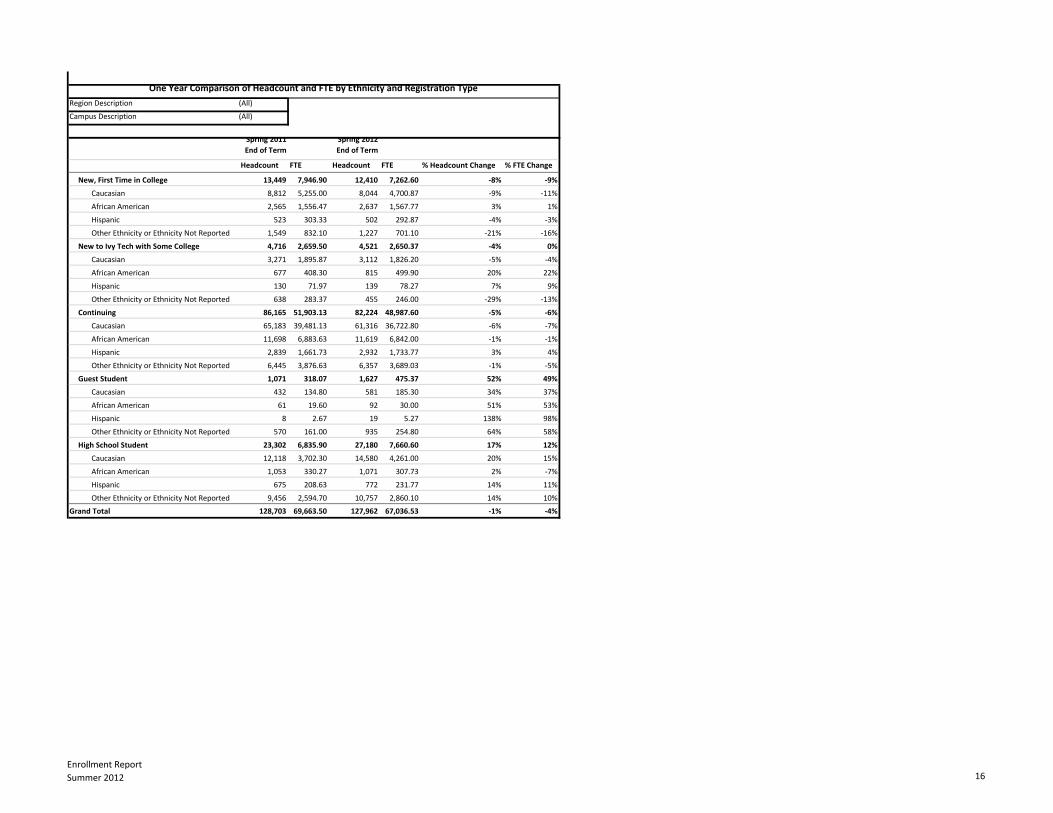
New, First Time in College 13,449 7,946.90 12,410 7,262.60 -8% -9%
Caucasian 8,812 5,255.00 8,044 4,700.87 -9% -11%
African American 2,565 1,556.47 2,637 1,567.77 3% 1%
Hispanic 523 303.33 502 292.87 -4% -3%
Other Ethnicity or Ethnicity Not Reported 1,549 832.10 1,227 701.10 -21% -16%
New to Ivy Tech with Some College 4,716 2,659.50 4,521 2,650.37 -4% 0%
Caucasian 3,271 1,895.87 3,112 1,826.20 -5% -4%
African American 677 408.30 815 499.90 20% 22%
Hispanic 130 71.97 139 78.27 7% 9%
Other Ethnicity or Ethnicity Not Reported 638 283.37 455 246.00 -29% -13%
Continuing 86,165 51,903.13 82,224 48,987.60 -5% -6%
Caucasian 65,183 39,481.13 61,316 36,722.80 -6% -7%
African American 11,698 6,883.63 11,619 6,842.00 -1% -1%
Hispanic 2,839 1,661.73 2,932 1,733.77 3% 4%
Other Ethnicity or Ethnicity Not Reported 6,445 3,876.63 6,357 3,689.03 -1% -5%
Guest Student 1,071 318.07 1,627 475.37 52% 49%
Caucasian 432 134.80 581 185.30 34% 37%
African American 61 19.60 92 30.00 51% 53%
Hispanic 8 2.67 19 5.27 138% 98%
Other Ethnicity or Ethnicity Not Reported 570 161.00 935 254.80 64% 58%
High School Student 23,302 6,835.90 27,180 7,660.60 17% 12%
Caucasian 12,118 3,702.30 14,580 4,261.00 20% 15%
African American 1,053 330.27 1,071 307.73 2% -7%
Hispanic 675 208.63 772 231.77 14% 11%
Other Ethnicity or Ethnicity Not Reported 9,456 2,594.70 10,757 2,860.10 14% 10%
Grand Total 128,703 69,663.50 127,962 67,036.53 -1% -4%
One Year Comparison of Headcount and FTE by Ethnicity and Registration Type
Enrollment Report
Summer 2012 16

Region Description (All)
Campus Description (All)
Spring 2011
End of Term
Spring 2012
End of Term
Headcount FTE Headcount FTE % Headcount Change % FTE Change
New, First Time in College 13,449 7,946.90 12,410 7,262.60 -8% -9%
24 and Younger 5,989 3,740.60 6,087 3,731.33 2% 0%
25 and Older 7,398 4,152.37 6,311 3,528.07 -15% -15%
Age Not Reported 62 53.93 12 3.20 -81% -94%
New to Ivy Tech with Some College 4,716 2,659.50 4,521 2,650.37 -4% 0%
24 and Younger 2,352 1,456.77 2,346 1,514.73 0% 4%
25 and Older 2,364 1,202.73 2,174 1,135.43 -8% -6%
Age Not Reported 0 0.00 1 0.20
Continuing 86,165 51,903.13 82,224 48,987.60 -5% -6%
24 and Younger 34,388 22,367.43 33,260 21,337.03 -3% -5%
25 and Older 51,722 29,513.17 48,931 27,639.10 -5% -6%
Age Not Reported 55 22.53 33 11.47 -40% -49%
Guest Student 1,071 318.07 1,627 475.37 52% 49%
24 and Younger 688 209.47 1,121 325.23 63% 55%
25 and Older 380 108.00 504 149.73 33% 39%
Age Not Reported 3 0.60 2 0.40 -33% -33%
High School Student 23,302 6,835.90 27,180 7,660.60 17% 12%
24 and Younger 22,633 6,670.17 26,328 7,462.80 16% 12%
25 and Older 28 13.13 19 7.80 -32% -41%
Age Not Reported 641 152.60 833 190.00 30% 25%
Grand Total 128,703 69,663.50 127,962 67,036.53 -1% -4%
One Year Comparison of Headcount and FTE by Age Range and Registration Type
Enrollment Report
Summer 2012 17

Region Description (All)
Campus Description (All)
Spring 2011
End of Term
Spring 2012
End of Term
Headcount FTE Headcount FTE % Headcount Change % FTE Change
New, First Time in College 13,449 7,946.90 12,410 7,262.60 -8% -9%
Full Time 4,669 4,109.47 4,014 3,447.07 -14% -16%
Part Time 8,780 3,837.43 8,396 3,815.53 -4% -1%
New to Ivy Tech with Some College 4,716 2,659.50 4,521 2,650.37 -4% 0%
Full Time 1,723 1,467.23 1,735 1,485.20 1% 1%
Part Time 2,993 1,192.27 2,786 1,165.17 -7% -2%
Continuing 86,165 51,903.13 82,224 48,987.60 -5% -6%
Full Time 32,895 28,307.70 30,285 26,029.17 -8% -8%
Part Time 53,270 23,595.43 51,939 22,958.43 -2% -3%
Guest Student 1,071 318.07 1,627 475.37 52% 49%
Full Time 46 40.67 46 40.07 0% -1%
Part Time 1,025 277.40 1,581 435.30 54% 57%
High School Student 23,302 6,835.90 27,180 7,660.60 17% 12%
Full Time 774 695.57 811 743.63 5% 7%
Part Time 22,528 6,140.33 26,369 6,916.97 17% 13%
Grand Total 128,703 69,663.50 127,962 67,036.53 -1% -4%
One Year Comparison of Headcount and FTE by Course Load and Registration Type
Enrollment Report
Summer 2012 18
Region Description (All)
Campus Description (All)
Spring 2011
End of Term
Spring 2012
End of Term
Headcount FTE Headcount FTE % Headcount Change % FTE Change
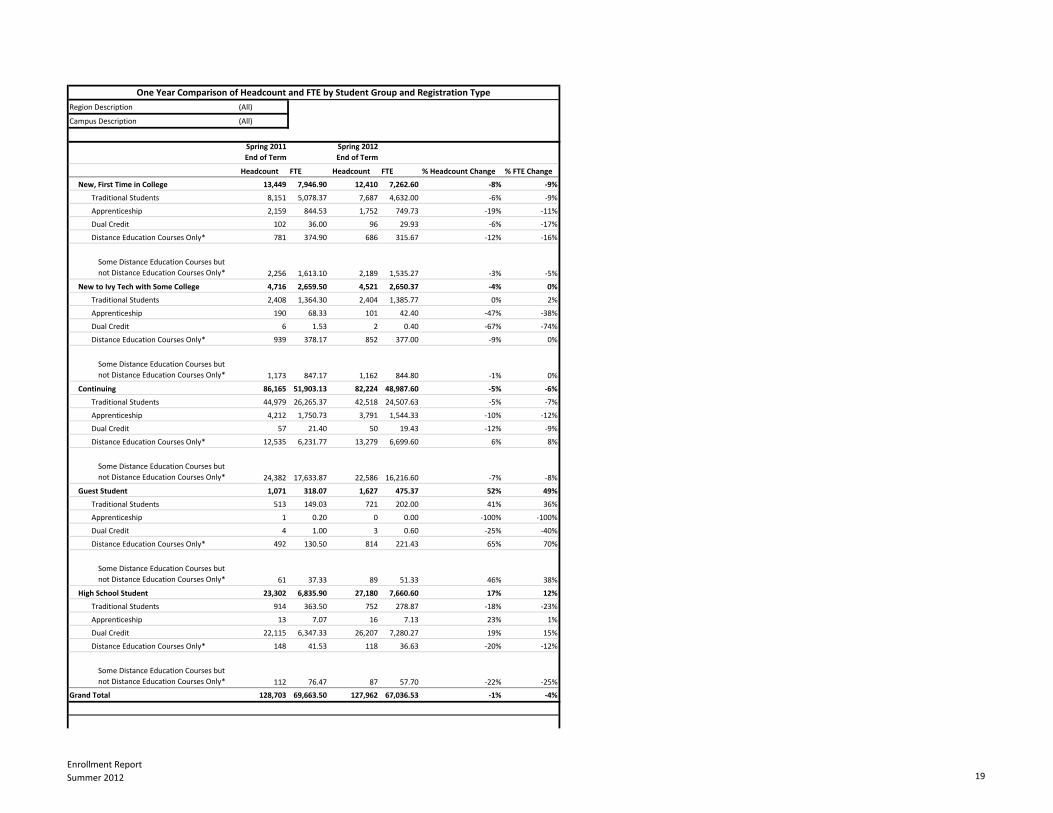
New, First Time in College 13,449 7,946.90 12,410 7,262.60 -8% -9%
Traditional Students 8,151 5,078.37 7,687 4,632.00 -6% -9%
Apprenticeship 2,159 844.53 1,752 749.73 -19% -11%
Dual Credit 102 36.00 96 29.93 -6% -17%
Distance Education Courses Only* 781 374.90 686 315.67 -12% -16%
Some Distance Education Courses but
not Distance Education Courses Only* 2,256 1,613.10 2,189 1,535.27 -3% -5%
New to Ivy Tech with Some College 4,716 2,659.50 4,521 2,650.37 -4% 0%
Traditional Students 2,408 1,364.30 2,404 1,385.77 0% 2%
Apprenticeship 190 68.33 101 42.40 -47% -38%
Dual Credit 6 1.53 2 0.40 -67% -74%
Distance Education Courses Only* 939 378.17 852 377.00 -9% 0%
Some Distance Education Courses but
not Distance Education Courses Only* 1,173 847.17 1,162 844.80 -1% 0%
Continuing 86,165 51,903.13 82,224 48,987.60 -5% -6%
Traditional Students 44,979 26,265.37 42,518 24,507.63 -5% -7%
Apprenticeship 4,212 1,750.73 3,791 1,544.33 -10% -12%
Dual Credit 57 21.40 50 19.43 -12% -9%
Distance Education Courses Only* 12,535 6,231.77 13,279 6,699.60 6% 8%
Some Distance Education Courses but
not Distance Education Courses Only* 24,382 17,633.87 22,586 16,216.60 -7% -8%
Guest Student 1,071 318.07 1,627 475.37 52% 49%
Traditional Students 513 149.03 721 202.00 41% 36%
Apprenticeship 1 0.20 0 0.00 -100% -100%
Dual Credit 4 1.00 3 0.60 -25% -40%
Distance Education Courses Only* 492 130.50 814 221.43 65% 70%
Some Distance Education Courses but
not Distance Education Courses Only* 61 37.33 89 51.33 46% 38%
High School Student 23,302 6,835.90 27,180 7,660.60 17% 12%
Traditional Students 914 363.50 752 278.87 -18% -23%
Apprenticeship 13 7.07 16 7.13 23% 1%
Dual Credit 22,115 6,347.33 26,207 7,280.27 19% 15%
Distance Education Courses Only* 148 41.53 118 36.63 -20% -12%
Some Distance Education Courses but
not Distance Education Courses Only* 112 76.47 87 57.70 -22% -25%
Grand Total 128,703 69,663.50 127,962 67,036.53 -1% -4%
One Year Comparison of Headcount and FTE by Student Group and Registration Type
Enrollment Report
Summer 2012 19
Region Description (All)
Campus Description (All)
Spring 2011
End of Term
Spring 2012
End of Term
Headcount FTE Headcount FTE % Headcount Change % FTE Change
Pell Eligible 63,150 40,456.17 62,406 39,605.03 -1% -2%
Not Pell Eligible 18,525 11,611.93 16,796 10,253.60 -9% -12%
Did Not 47,028 17,595.40 48,760 17,177.90 4% -2%
Grand Total 128,703 69,663.50 127,962 67,036.53 -1% -4%
Region Description (All)
Campus Description (All)
Spring 2011
End of Term
Spring 2012
End of Term
Headcount FTE Headcount FTE % Headcount Change % FTE Change
New, First Time in College 13,449 7,946.90 12,410 7,262.60 -8% -9%
First Generation 4,802 3,160.40 4,355 2,772.07 -9% -12%
Not First Generation 4,900 3,142.90 4,935 3,111.20 1% -1%
Did Not Apply For Aid 3,747 1,643.60 3,120 1,379.33 -17% -16%
New to Ivy Tech with Some College 4,716 2,659.50 4,521 2,650.37 -4% 0%
First Generation 1,306 856.40 1,299 829.00 -1% -3%
Not First Generation 1,724 1,102.60 1,794 1,165.97 4% 6%
Did Not Apply For Aid 1,686 700.50 1,428 655.40 -15% -6%
Continuing 86,165 51,903.13 82,224 48,987.60 -5% -6%
First Generation 33,706 21,339.27 32,112 20,087.43 -5% -6%
Not First Generation 34,768 22,218.00 34,220 21,669.40 -2% -2%
Did Not Apply For Aid 17,691 8,345.87 15,892 7,230.77 -10% -13%
Guest Student 1,071 318.07 1,627 475.37 52% 49%
First Generation 51 19.00 68 25.80 33% 36%
Not First Generation 84 36.77 119 46.67 42% 27%
Did Not Apply For Aid 936 262.30 1,440 402.90 54% 54%
High School Student 23,302 6,835.90 27,180 7,660.60 17% 12%
First Generation 151 90.03 130 66.67 -14% -26%
Not First Generation 183 102.73 170 84.43 -7% -18%
Did Not Apply For Aid 22,968 6,643.13 26,880 7,509.50 17% 13%
Grand Total 128,703 69,663.50 127,962 67,036.53 -1% -4%
One Year Comparison of Headcount and FTE by First Generation Status
One Year Comparison of Headcount and FTE by Pell Eligibility and Registration Type
Enrollment Report
Summer 2012 20