Embed Size (px)
Citation preview
QUT Digital Repository: http://eprints.qut.edu.au/
Rintoul, Llew and Wentrup-Byrne, Edeline and Suzuki, Shuko and Grondahl, Lisbeth (2007) FT-IR spectroscopy of fluoro-substituted hydroxyapatite: strengths and limitations. Journal of Materials Science: Materials in Medicine 18(9):pp. 1701-1709.
© Copyright 2007 Springer The original publication is available at SpringerLink http://www.springerlink.com
Title: FT-IR spectroscopy of fluoro-substituted hydroxyapatite: Strengths and
limitations.
Authors: Llew Rintoul1, Edeline Wentrup-Byrne1, Shuko Suzuki1, Lisbeth
Grøndahl*, 2
Addresses: 1: Tissue BioRegeneration and Integration Program, Science Research Centre Queensland University of Technology, 2 George St., GPO Box 2434 Brisbane Q 4001 Australia 2: School of Molecular and Microbial Sciences University of Queensland St Lucia Q 4072 Australia
Corresponding author: Lisbeth Grøndahl
School of Molecular and Microbial Sciences, University of Queensland St Lucia Q 4072 Australia Tel : +61 7 3365 3671 Fax : +61 7 3365 4299 l.grondahl@ uq.edu.au
Key words: Apatite, solid solutions, infrared emission spectroscopy, FT-IR, X-ray diffraction

2
Abstract
Fluoro substituted hydroxyapatite (FHAp) samples were prepared by a cyclic pH method.
Both calcined and uncalcined samples were subjected to elemental analysis (F, Ca, P) and
X-ray diffraction (XRD) analysis to verify composition and phase purity. Good
correlation between a-axis parameters and fluoride ion content was found for calcined
samples, however, for uncalcined samples the fluoride ion content was higher than
estimated from the a-axis values. Fourier transform infra red (FT-IR) spectroscopy
analysis of the calcined samples showed OH band shifts and splitting in accordance with
F-HO interactions affecting the OH vibration. We conclude that the OH libration (620 –
780 cm-1 range) is more suited for estimation of fluoride ion content than the OH
stretching. In contrast, uncalcined samples all displayed FT-IR spectra similar to that of
hydroxyapatite (HAp) despite the presence of fluoride ions (18 – 73%). FT-IR emission
spectroscopy was used to probe the changes occurring in the FT-IR spectra of HAp and
FHAp samples upon heating. Interpretation of the spectral changes occurring during
heating to 1000ºC and subsequent cooling is given. Room temperature spectra of samples
heated to various temperatures was used to determine the temperature necessary to
produce FT-IR spectra displaying the expected OH bands. A model accounting for the
combined observations is proposed.
3
Introduction
Hydroxyapatite (HAp), the mineral component of bones and hard tissues in mammals,
has been the subject of much research over the years, particularly in the field of
biomaterials science. This is due to its importance in clinical applications involving
medical devices and implants and more recently in the broad field of tissue engineering.
Substitutions within the HAp lattice are observed both for naturally occurring and
synthetic HAp. The most common are substitutions involving carbonate, fluoride and
chloride ions for hydroxyl ions. In addition, defects can occur resulting in non-
stoichiometric HAp. In the presence of fluoride ions, solid solutions of HAp and
fluoroapatite (FAp) occur and these solid solutions (FHAp) have been widely studied.[1]
Apatite is one of few inorganic materials that are classed as bioactive, since it supports
bone ingrowth and osseointegration when used in orthopaedic, dental and maxillofacial
applications. The use of HAp as a coating on orthopaedic metal implants has been shown
to improve the osseointegration of the implant. However, due to the thermal instability of
HAp particularly in contact with titanium, research is currently being undertaken into the
use of FHAp as an alternative coating material.[2,3]
FAp belongs to the hexagonal crystal system with the space group P63/m and with the
unit cell dimensions a = 9.367(1) Å and c = 6.884(1) Å.[1] Each unit cell contains one
formula unit of Ca10(PO4)6F2. If the phosphate ions are considered as spheres, then the
FAp structure can be described as hexagonal close-packing of the phosphate ions with
channels of octahedral holes through the structure parallel to the hexagonal c-axis; the
“X-channels”. There are two types of calcium ions in the structure; Ca(1) and Ca(2). Two
4
thirds of the channels within the structure are occupied by Ca(1) ions which are
connected to their neighbouring calcium ions above and below by three shared oxygen
atoms. In addition, each Ca(1) ion is coordinated by three more distant oxygen atoms.
One third of the X-channels in the structure are occupied by fluoride ions which in turn
are coordinated by three Ca(2) ions. The Ca(2) ions are seven-fold coordinated by six
oxygen atoms and one fluoride ion each.
Naturally occurring HAp has a hexagonal structure similar to that of FAp. However,
very pure synthetic HAp has a structure of lower symmetry, and belongs to the
monoclinic crystal system, space group P21/b, with unit cell dimensions a = 9.4214(8) Å,
b=2a, c = 6.8814(7) Å, and γ=120°.[1] In essence, the HAp structure can be viewed as the
FAp structure where fluoride ions have been substituted for the hydroxyl ions. The
“ordered column model” predicts that the hydroxyl ions within each of the X-channels
show long-range order, i.e. all hydroxyl ions are pointing in the same direction. Within
individual X-channels the hydroxyl ions are arranged such that they can point in either
possible direction. This explains the lower symmetry of HAp compared to FAp. Since
the fluoride ion is smaller than the hydroxyl ion, the substitution of hydroxyl ions for
fluoride ions results in a contraction of the unit cell dimensions, in particular the a-axis.
Detailed FT-IR spectroscopic analysis has been carried out on FHAp compounds and it
has been found that, depending on the degree of substitution, the OH libration and
stretching vibrations shift and split into a number of new bands.[4, 5] This has been
attributed to the distribution of the fluoride and hydroxyl ions in the X-channels. This

5
conclusion is based on evidence from the19F NMR data [6] suggesting that the hydroxyl
ions neighbouring fluoride ions orient themselves in such a way that the hydrogen atoms
point towards the fluoride ions. Thus, the fluoride ion forms stronger hydrogen bonds
with the hydroxyl ion than the hydroxyl ion itself resulting in chain reversal in the X-
channels. Correlations between the amount of fluoride ion and the position and intensity
of the OH vibration bands have been found making FT-IR spectroscopy an important
technique for the determination of the fluoride content in FHAp samples.[4,5] An
important point to note is that all the samples used in these studies were prepared using
high temperature solid state reactions.
FT-IR has also been used to follow solid state reactions between inorganic salts. Two
studies investigated the production of FHAp using HAp and either Na2PO3F or NH4F as
the fluoride source.[7,8] Room temperature FT-IR spectra of the reaction mixture heated
to various temperatures were used to determine the extent of the reaction. As will become
clear from results presented in this paper, it is questionable whether FT-IR spectroscopy
alone can be used to follow the extent of such reactions.
In the biomaterials literature there appears to be some confusion with respect to the FT-
IR band assignments for FHAp samples. Spectra are often presented without making full
use of the information available.[9-14] If biomaterials researchers wish to exploit FT-IR
spectroscopy as a reliable analytical tool then it is essential that they recognise both the
strengths and limitations of the technique.
6
In a recent study, we pointed out that FHAp samples prepared by solution precipitation
displayed FT-IR spectra identical to hydroxyapatite despite having a high fluoride
content (65%). However, a calcined sample (heated to 1000°C for 2 hours) showed good
correlation between the OH bands and the fluoride content. [15] In the present paper we
have investigated a number of FHAp samples before, after and during calcination. We
used IR emission spectroscopy to monitor in situ the changes in the OH band positions
during heating. Combining these results with x-ray diffraction (XRD) data we postulate a
model to explain the processes occurring during the heating process. In addition, we
assessed the use of OH band signatures in room temperature FT-IR spectra as a means for
determining the fluoride content in calcined FHAp samples.
7
Experimental
Synthesis of hydroxyapatite (HAp)
Calcium nitrate (11.74g; 98.0%, Chem-Supply, Australia) dissolved in water (450 mL)
was heated to 40oC. Diammonium hydrogen phosphate (3.94g; 98.0%, May & Baker,
Australia) dissolved in water (350 mL) was slowly added to the calcium nitrate solution
with vigorous stirring. The solution was brought to pH 11 by addition of concentrated
ammonia (20 mL; 28.0-30.0%, Ajax Finechem, Australia). To reduce the carbonate
content, the mixture was brought to the boil and immediately removed from the heat. The
precipitate was aged overnight before isolation and was thoroughly washed with
deionised water. The isolated product was oven dried overnight at 80oC. The resulting
HAp was ground into a fine powder using an agate mortar and pestle. A portion of this
HAp was subsequently calcined at 800oC for 1 hour in air and is labelled as calc-HAp.
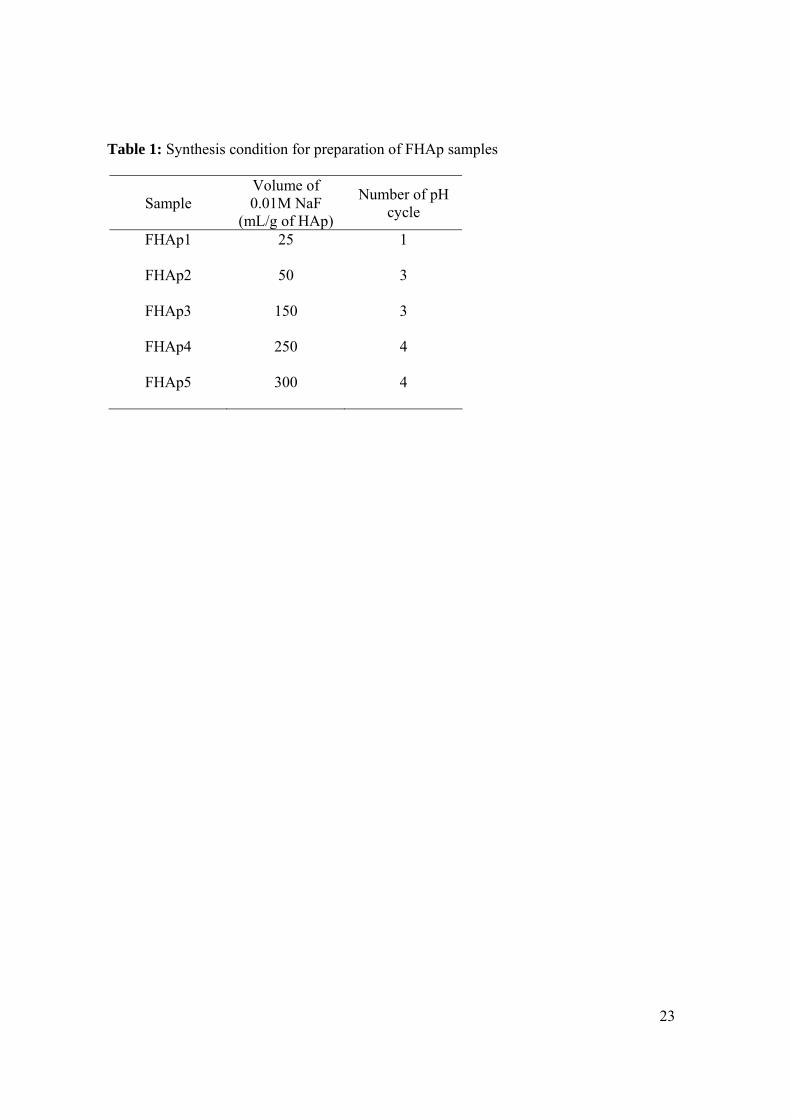
Synthesis of partially fluoride substituted hydroxyapatite (FHAp)
The cyclic pH variation technique described by Duff [16] was employed to incorporate
fluoride ions into the HAp structure. HAp was suspended in various volumes of 0.01M
sodium fluoride (98.0%, Ajax chemicals, Australia) as listed in Table 1. The suspension
was equilibrated to pH 7 overnight, after which the pH was lowered to 4 by the addition
of 10M HNO3 (69.0-71.0%, Lab-scan, Australia) under vigorous stirring. After 30 min of
equilibration, the pH was raised to 7 with 10M NaOH (97.0%, APS, Australia). This pH
cycle was repeated several times as listed in Table 1. The solid phase was filtered under
mild suction, washed thoroughly with deionised water, dried overnight at 80oC, and
ground into a fine powder. A portion of each sample was calcined at 800oC (FHAp1 and

8
2) or 1000oC (FHAp4 - 6) for 1 hour in air. These samples are referred to as calc-X,
where X refers to the sample ID prior to calcination.
Elemental analysis
Samples of 10 mg were dissolved in 1 M HCl (10 ml), diluted 1:100 and subjected to
calcium and phosphorous analysis on an ICPAES Spectro spectroflame P instrument
using a forward power of 1200W, a flow rate of 1.0 mL/min and a Meinhard concentric
nebuliser. Each value is an average of three 5 second integrations at 317.93 nm (Ca) or
178.29 nm (P). A fluoride selective electrode was used for fluoride analysis using citrate-
hydrochloric acid buffer.[17] Samples of 10 mg were dissolved in 0.2 M HCl (20 ml)
then water (10 ml) and 0.2 M trisodiumcitrate (40 ml) were added. Standard solutions
were made from NaF using the same buffer system.
Vibrational Spectroscopy
Infrared emission spectra were recorded on a Nicolet Nexus FT-IR (Thermo Electron,
Madison, WI USA) equipped with a liquid N2 cooled MCT detector. An emission
accessory designed by Vassallo et al [18], comprising a carbon rod furnace and an off
axis paraboloidal gold mirror housed in an acrylic enclosure, was coupled to the external
port of the spectrometer. The furnace was fitted with either a small Pt stub on which the
sample could be placed, or a graphite stub of identical size that acted as a blackbody
reference. Infrared emission was collected and directed into the interferometer via the
external port by the paraboloidal mirror mounted directly above the furnace. Spectra
were recorded at 50°C intervals on heating and 100°C intervals on cooling, from 100°C

9
to 1000°C. Single beam measurements of the graphite and the Pt stub were obtained for
each temperature. A light dusting of the sample was then placed on the Pt stub and a
series of single beam measurements at each temperature were recorded. The sample was
allowed to equilibrate at each temperature for a period of 5mins. Due to the low signal
strength at the lower temperatures, spectra at 100 and 150°C were acquired for 1024
scans; spectra at 200 and 250°C were acquired for 256 scans; whereas 128 scans were
acquired at higher temperatures. An optical path difference (OPD) velocity of 1.8988 cm
s-1 and a spectral resolution of 4 cm-1 were used throughout. Single beam emission
spectra were corrected for background emission and instrumental throughput and
linearised with respect to concentration using the equation[19]:
E = 0.5log[Ibb - Ie)/(Ibb --IPt)]
where Ibb, Ie and IPt are the intensities emitted by the graphite, the sample and the Pt stub,
respectively.
Infrared absorbance spectra were obtained using a Nicolet Smart Endurance horizontal,
single bounce, diamond ATR accessory on a Nicolet Nexus 870 FT-IR instrument fitted
with a DTGS detector. Spectra were recorded at 4 cm-1 resolution for 64 scans with an
OPD velocity of 0.6289 cm.s-1. Solids were pressed directly onto the diamond internal
reflection element of the ATR accessory without further sample preparation. The FHAp-2
sample was calcined in an electrical furnace at various temperatures; 200, 300, 400, 500,
600, 700, and 800ºC at a heating rate of 100oC/h for 1h in air before their room
temperature ATR-FT-IR spectra were recorded.
10
Spectral data processing was carried out using GRAMS32 software package (Galactic
Industries, Salem, NH, USA).
X-ray diffraction (XRD)
Powder X-ray diffraction of all samples were performed on a PAN alytical X'Pert Pro
MPD using Cu-Kα radiation generated at a voltage of 40 kV and a current of 40 mA. The
divergent slit was set to 0.5° and a scatter slit at 1°. The samples were examined from 5°
to 75° at a scanning speed of 0.67° /min and a step size of 0.0167°. The lattice parameters
were calculated using the MDI Jade 6.5, XRD Pattern Processing, USA computer
program.
11
Results and Discussion
Solid solutions of HAp and FAp were prepared by a cyclic pH method first developed by
Duff[16, 20]. Such solution prepared FHAp samples displayed FT-IR spectra similar to
that of HAp (Figure 1A-B) despite having fluoride contents in the range of 13 – 73% as
determined by chemical analysis. The corresponding calc-FHAp samples display FT-IR
spectra (Figure 1C) that correlated with previous studies [4, 5]. This paper evaluates the
use of FT-IR spectroscopy as a technique for the estimation of fluoride content in calc-
FHAp. We also investigate the processes occurring during heat treatment of solution
prepared FHAp materials.
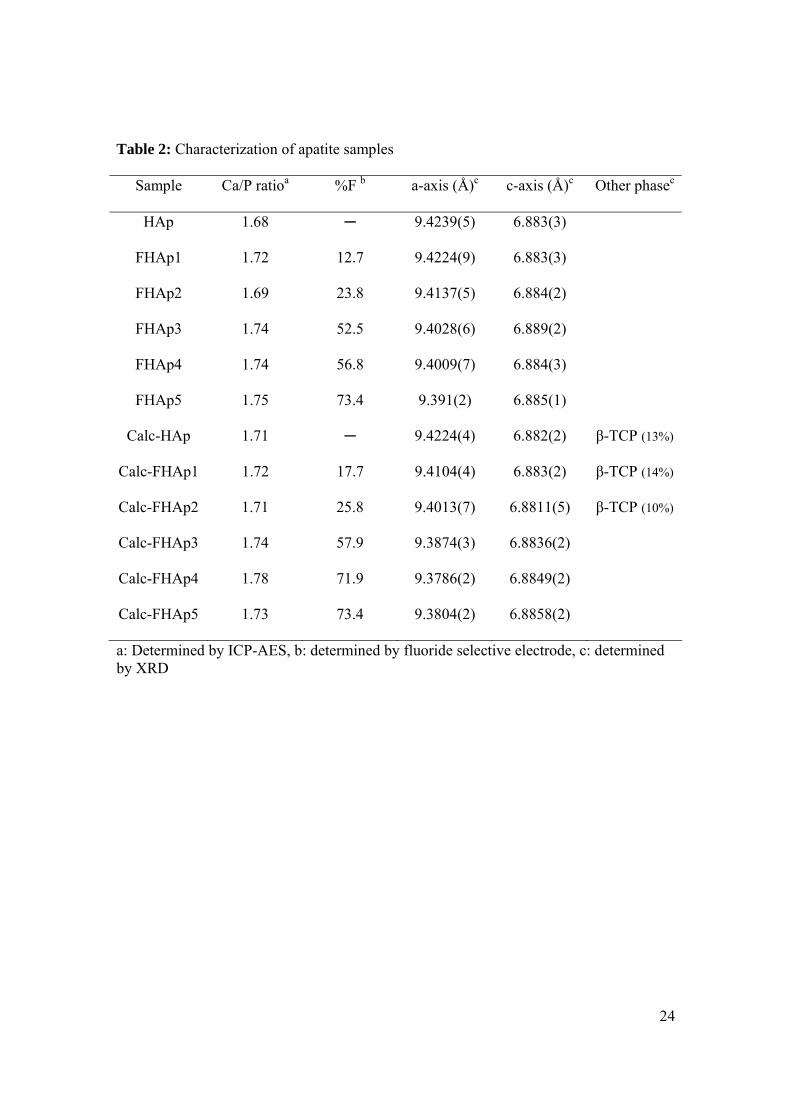
Characterisation by elemental analysis and XRD
A number of FHAp samples as well as a reference sample of pure HAp were studied
(Table 2). Elemental analysis generally gave values lower than the theoretical ones, but
the Ca/P ratios were close to the theoretical value of 1.67, thus indicating that small
amounts of impurities such as water or organic matter were present in the samples. After
calcination the fluoride ion content changed only slightly (increasing by up to 5%) except
for sample FHAp4 which increased from 57% to 72%. This calcined sample also
displayed the largest Ca/P ratio of 1.78.
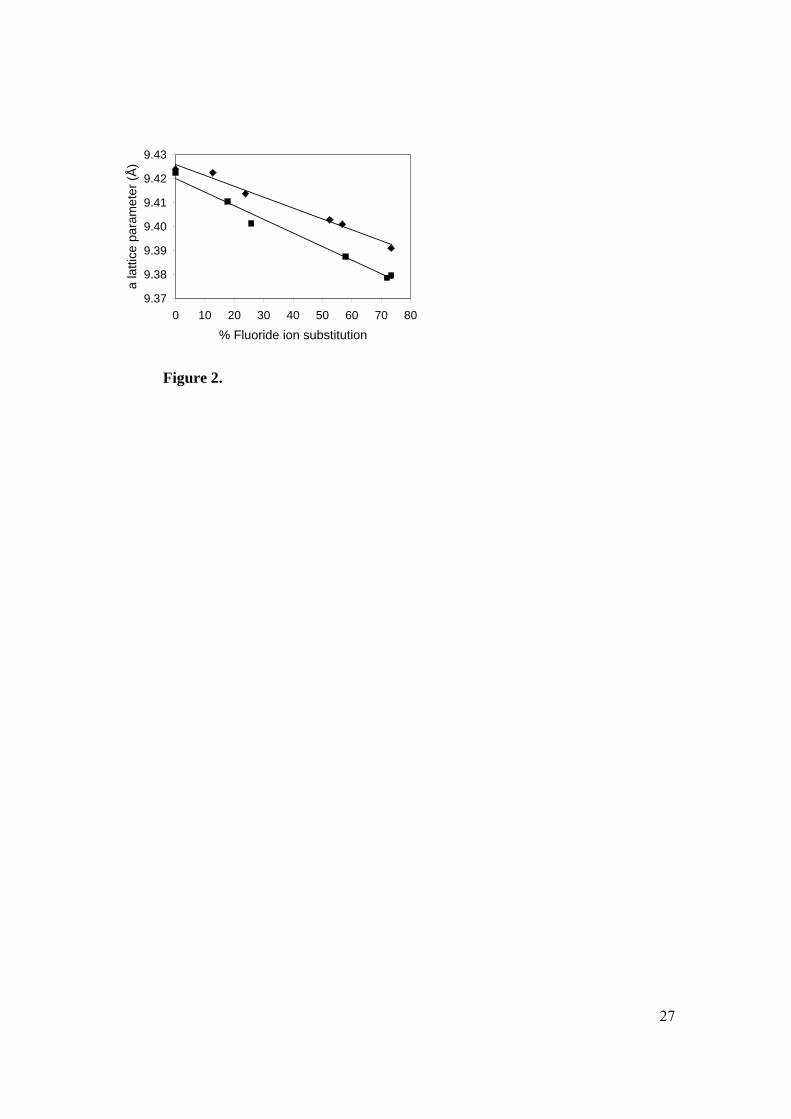
The XRD spectra indicated the presence of pure apatite with no indication of unreacted
CaF2 or coprecipitated Ca(OH)2. Assuming that FHAp is a solid solution of FAp and
HAp, a linear relationship between the %F and the a-axis parameter is predicted by
Vergard’s law. Such relationships are evident in both the solution-prepared and calcined
12
series (Figure 2). The values for the calcined samples agree closely with those predicted
from pure HAp and FAp. This implies that for the calcined samples the substitution of
fluoride ions for hydroxyl ions has occurred in the X-channels within the apatite lattice.
In contrast, for the solution-prepared samples, deviation from predicted values was found.
The a-axis parameter for all solution-prepared samples was larger than for their calcined
counterparts (Table 2). Thus, calculation of the fluoride content using the a-axis
parameter leads to an underestimation by 10-20% (Figure 2). Some disorder such as the
presence of fluoride ions within interstitial sites is probably occurring in these solution
prepared samples.
Use of FT-IR spectroscopy for estimation of F-content in calc-FHAp samples
The infrared spectra of all the samples studied show typical apatite phosphate modes near
1086, 1021, 961, 600 and 562 cm-1.[21] No HPO42- vibrations at 867 cm-1 [22] are
observed in any of the samples. However, minor carbonate bands at 1455, 1423 and 875
cm-1 [23] are present in some samples (data not shown). The OH stretching vibration at
3570 cm-1 and OH libration at 633 cm-1, indicative of hydroxyapatite, is observed in
HAp, calc-HAp and all FHAp samples. By contrast, in calc-FHAp samples (Figure 1),
the OH stretching and libration bands are shifted and in some cases additionally split into
several bands.
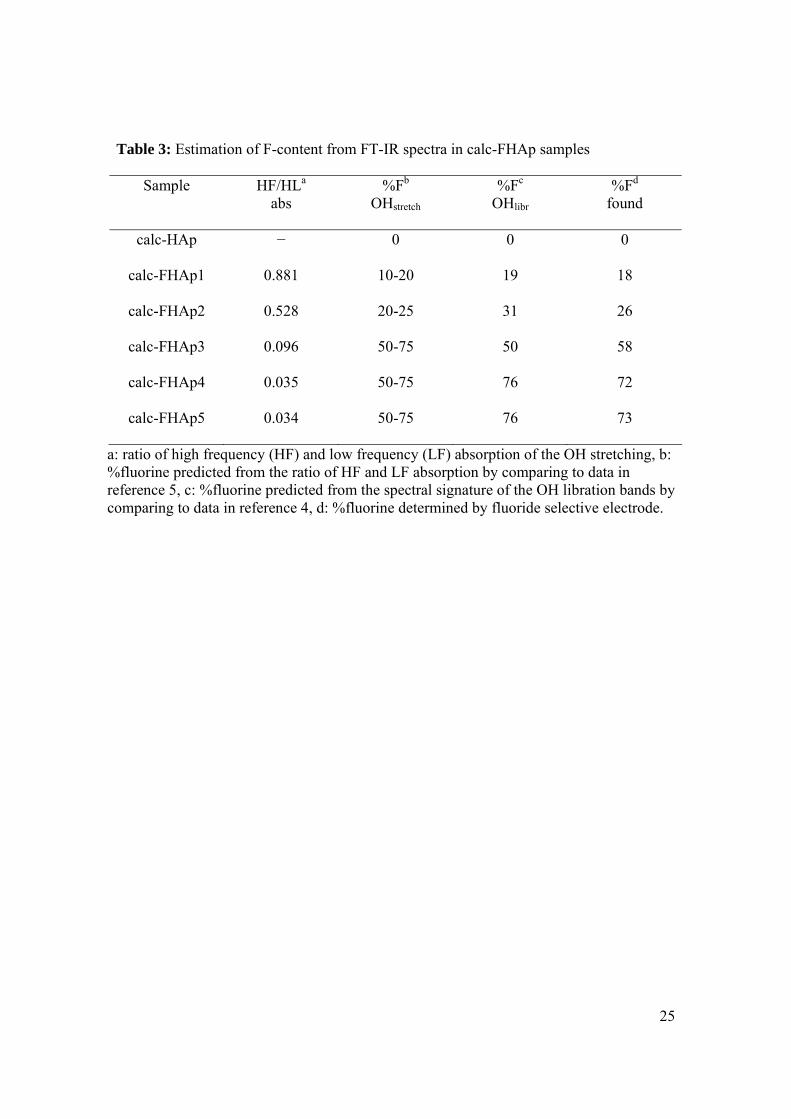
According to Baumer et. al. [5] the position, the number (one or two), and relative
integrated absorbance of OH stretching band(s) in the 3480 to 3650 cm-1 region can be
used to estimate the amount of fluoride ions in FHAp samples. A single band present at
13
3570 cm-1 indicates that less than 5% of the hydroxyl ions in HAp have been substituted
with fluoride ions, whereas for example, a single band at 3538 cm-1 indicates that at least
75% of the hydroxyl ions have been substituted with fluoride ions. The data for our
calcined samples showed similar trends to those obtained by Baumer et al. The fluoride
content can be estimated from the ratio of the absorbance of the two bands, and using this
approach we find that our observed values fall within the predicted ranges (Table 3).
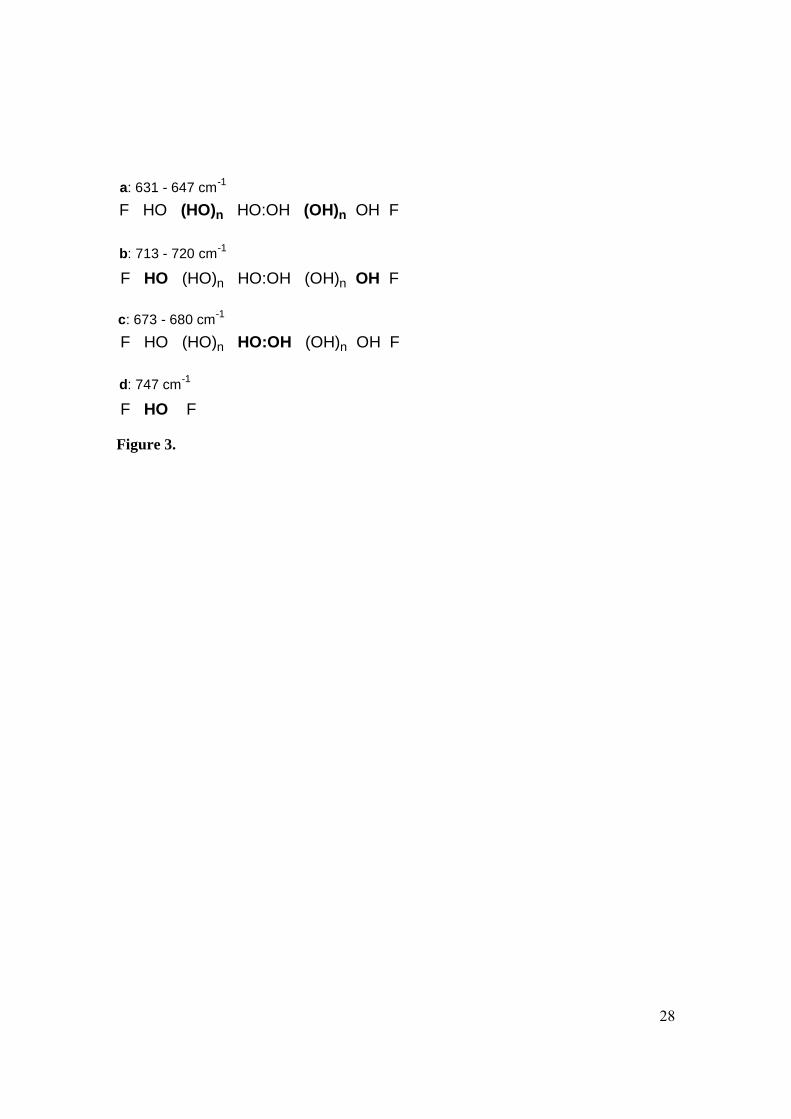
Freund et. al. investigated the position of the OH libration as a function of fluoride ion
substitution into the apatite lattice.[4] Their results indicate the possibility of detecting 6
– 10% fluoride ion from the shift in the 631 cm-1 band as well as the occurrence of
additional bands in the 630 – 750 cm-1 region. A schematic model giving the assignment
of the OH libration bands is given in Figure 3.[4, 24] A number of configurations of
fluoride and hydroxyl ions are possible and the model assumes that each configuration
gives rise to a different vibrational band. Depending on the degree of fluoride
substitution, specific configurations are more likely to predominate in the structure. By
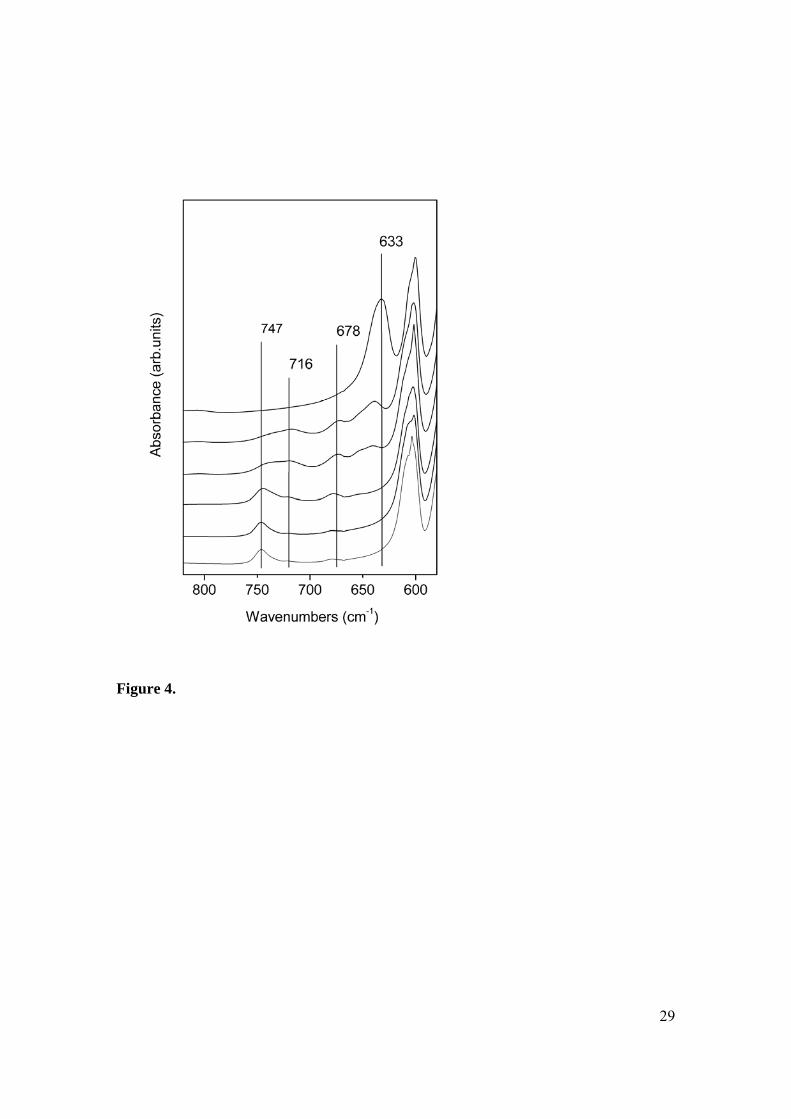
comparing the spectral features in the 800-600 cm-1 region of our spectra (Figure 4) with
those obtained by Freund et al[4], the fluoride ion content of each of our samples can be
estimated (Table 3). These correlate well with the experimentally obtained data. In our
opinion, this spectral region lends itself far better to the estimation of the fluoride ion
content in calc-FHAp samples than the 3500-3600 cm-1 region. It should be emphasised,
however, that using OH bands to estimate the fluoride content requires that the samples
be calcined in order to obtain meaningful results since no changes in band position or
multiplicity were observed for non-calcined samples (Figure 1).
14
Emission FT-IR spectroscopy
As stated above, prior to calcination solution-prepared FHAp samples displayed FT-IR
spectra similar to that of HAp. The FT-IR emission technique is an alternative method for
obtaining FT-IR spectra directly from samples at elevated temperatures and offers the
opportunity to gain insight into the processes that take place in situ during the calcination
process. At relatively low temperatures it is difficult to obtain data of sufficient signal-to-
noise ratios in the high wavenumber region of the emission spectrum due to the low
population of the excited state at these energies. However, by 200°C a good signal-to-
noise ratio is readily obtained.
FT-IR emission spectra of HAp in the 3800 – 3300 cm-1 region were obtained on heating
from 100 – 1000°C and then cooling back to 100°C. Figure 5 shows the spectra obtained
at 200°C intervals. At 200°C the hydroxyl band at 3568 cm-1appears as a band of
intermediate width, superimposed on a broad background. The background signal, which
is attributable to a broad water absorption centred at 3400 cm-1, is greatly reduced by
400°C, presumably because most of the absorbed water is driven off. As a result of
heating the HAp sample, a continuous shift in the ν(OH) band position to lower
wavenumbers is observed (from 3569 cm-1 at 100°C to 3552 cm-1 at 1000°C) which may
be attributed to a thermally induced lattice expansion.[25] By 1000°C the ν(OH) of HAp
has degenerated into a broad and weak band. However, on cooling the intensity of ν(OH)
is regained and this suggests that the hydroxyl group becomes quite mobile above 800°C.
By 200°C the major band shifts back to its original position, but is sharper and more
15
distinct after calcination. This is in agreement with the observation that the FT-IR spectra
of calcined HAp show sharper OH bands than room temperature prepared HAp [26, 27].
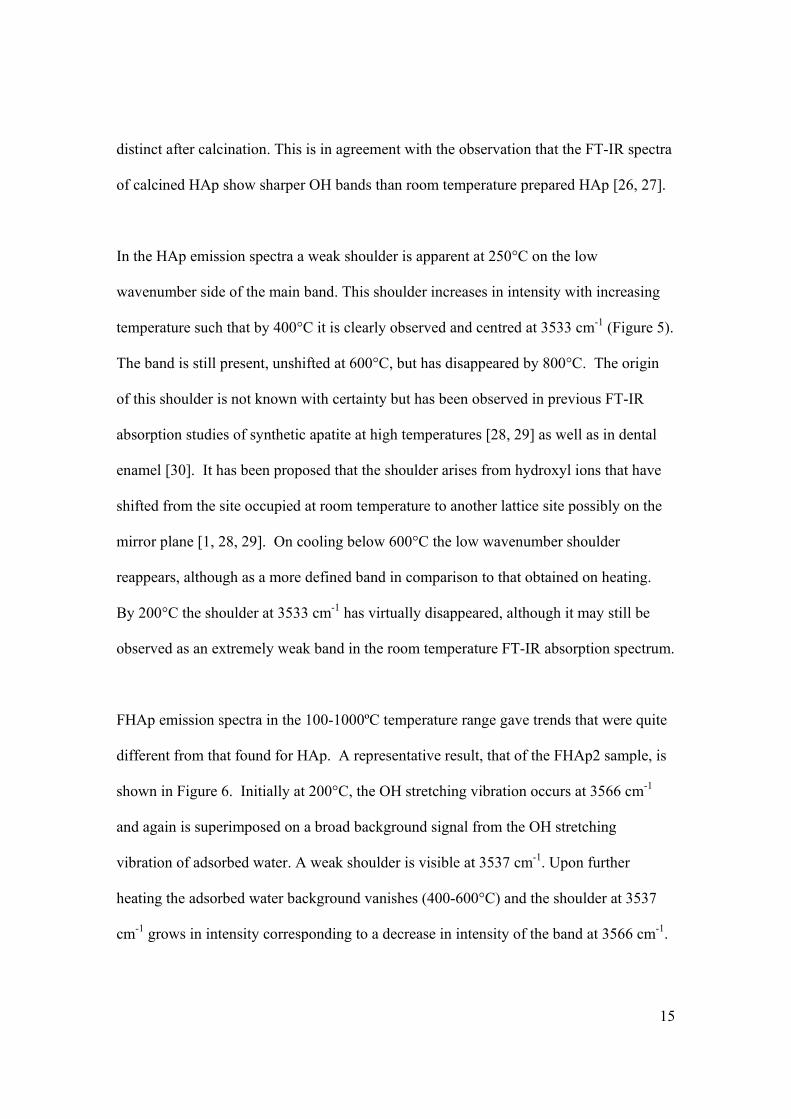
In the HAp emission spectra a weak shoulder is apparent at 250°C on the low
wavenumber side of the main band. This shoulder increases in intensity with increasing
temperature such that by 400°C it is clearly observed and centred at 3533 cm-1 (Figure 5).
The band is still present, unshifted at 600°C, but has disappeared by 800°C. The origin
of this shoulder is not known with certainty but has been observed in previous FT-IR
absorption studies of synthetic apatite at high temperatures [28, 29] as well as in dental
enamel [30]. It has been proposed that the shoulder arises from hydroxyl ions that have
shifted from the site occupied at room temperature to another lattice site possibly on the
mirror plane [1, 28, 29]. On cooling below 600°C the low wavenumber shoulder
reappears, although as a more defined band in comparison to that obtained on heating.
By 200°C the shoulder at 3533 cm-1 has virtually disappeared, although it may still be
observed as an extremely weak band in the room temperature FT-IR absorption spectrum.
FHAp emission spectra in the 100-1000ºC temperature range gave trends that were quite
different from that found for HAp. A representative result, that of the FHAp2 sample, is
shown in Figure 6. Initially at 200°C, the OH stretching vibration occurs at 3566 cm-1
and again is superimposed on a broad background signal from the OH stretching
vibration of adsorbed water. A weak shoulder is visible at 3537 cm-1. Upon further
heating the adsorbed water background vanishes (400-600°C) and the shoulder at 3537
cm-1 grows in intensity corresponding to a decrease in intensity of the band at 3566 cm-1.
16
Up to 400°C there appear to be similarities with the HAp emission spectra, although the
band positions are slightly different. Of greater significance is the fact that the FHAp2
sample shows a greater relative intensity of the low wavenumber shoulder. By 600°C it is
now the major band, unlike for HAp where the low wavenumber shoulder remains the
weaker band. The origin of this FHAp band is primarily attributed to the interaction of
the hydroxyl ions with neighbouring fluoride ions as well as to some extend, as in HAp,
to minor shifts in the hydroxyl ion lattice positions. On further heating the two bands
broaden and coalesce and at the same time shift to lower wavenumbers until at 1000°C
only a single band is visible at 3543 cm-1. The spectra of FHAp and HAp are very
different during the cooling process. In the FHAp sample; the single band at 1000°C
splits into two bands as evident from 600°C. By 400°C, a minor band at 3368 cm-1 and a
major band at 3538 cm-1 are clearly visible and apart from some broadening due to the
elevated temperature the resulting spectrum is identical to that of the room temperature
ATR FT-IR spectrum of calc-FHAp2 (Fig 1). Due to the broadening and coalescence of
the bands at 800ºC the exact temperature at which the spectrum becomes identical to that
of calc-FHAp2 cannot be determined from the emission spectra, however, it is clearly
above 600ºC.
Model for fluoride distribution in FHAp
Based on our observations of room temperature ATR-FT-IR and emission FT-IR spectra
of FHAp samples, it is clear that changes in the position of the fluoride ions within the
lattice occur during heating. The fact that the room temperature spectra of the uncalcined
FHAp samples resemble that of HAp indicates that less than 5% of the hydroxyl ions

17
have a neighbouring fluoride ion. On the other hand, the conclusion from the XRD data
was that the main portion of the fluoride ions (80-90%) are most likely occupying the X-
channels with a smaller portion occupying interstitial sites in the lattice. The apparent
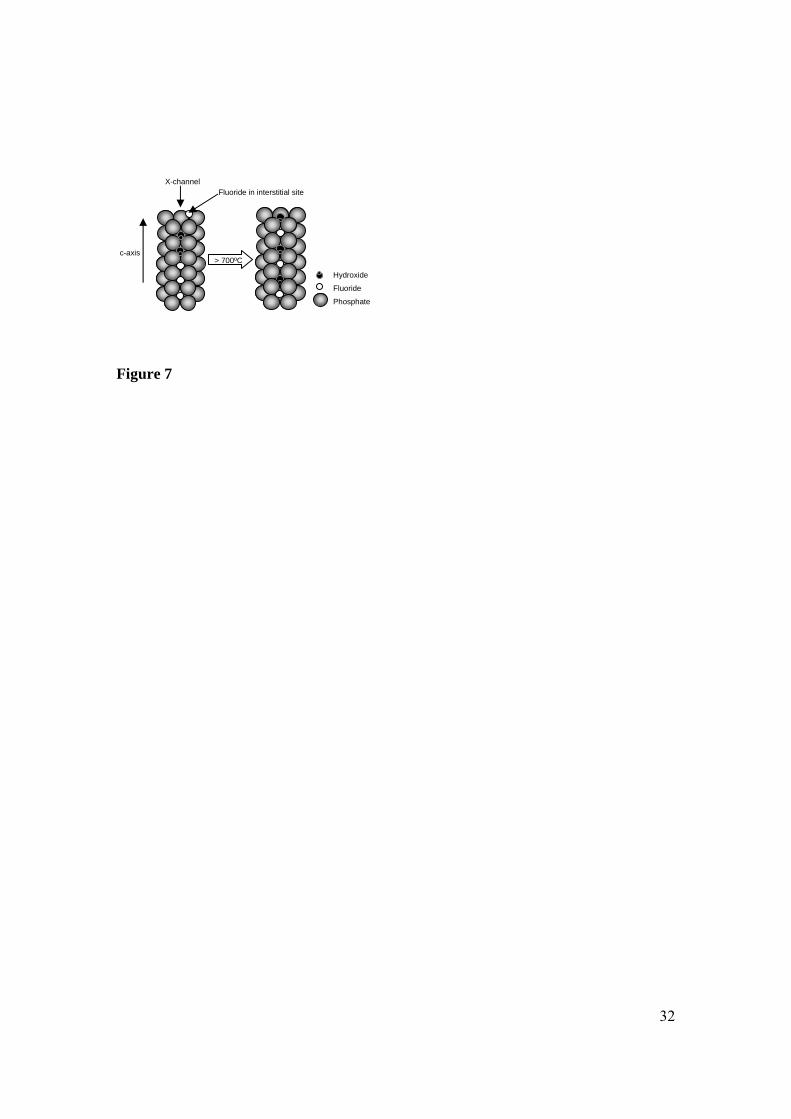
discrepancy in these observations can be explained by the following model (Figure 7). If
the fluoride ions incorporated into the structure at room temperature, sit in the lattice
along the X-channels forming segments of fluoride ion chains rather than being randomly
distributed among the hydroxyl ions, then only very few hydroxyl ions will have a
fluoride ion as a neighbour despite large amounts of fluoride ions being present. This
hypothesis is supported by findings by Pan [31] who used rotational-echo, double-
resonance (Redor) NMR to study the fluoride ion distribution in a FHAp sample prepared
by immersion of HAp in a NaF solution. This study revealed that the fluoride ions were
not randomly distributed throughout the sample, rather, they had replaced the first two to
three layers of the hydroxyl ions along the X-channels which are exposed on the surface
in the a,b-plane. Furthermore, Young, Van der Lugt and Elliott [6] pointed out that the
hydrogen bonding of fluoride to hydroxyl ions reduces the mobility for diffusion of a
hydroxyl ion along the X-channel. Thus, it is likely that fluoride ion diffusion at room
temperature is not very facile. We propose that upon heating of solution prepared FHAp
samples, reorganization of the fluoride ions within the lattice occurs leading ultimately to
a random substitution. The fact that the FHAp spectrum develops over a large
temperature range (independent of the heating rate) rather than as a single phase change
can be attributed to the fluoride ions originating from multiple sites in the lattice. It is
generally accepted that the X-channel provides the easiest diffusion path [1], and thus

18
different temperatures will be needed for the diffusion of fluoride ions originating from
different sites within the lattice which is in support of our model.
FT-IR spectra of FHAp heated to different temperatures
In order to assess the necessary temperature to which an FHAp sample must be heat
treated before random distribution of fluoride ions occurs in the X-channel, a temperature
series of FT-IR spectra were recorded for the FHAp2 sample. Comparison of these FT-IR
spectra with that of the calcined FHAp samples (Figure 4) reveal that, although some
changes in the spectrum have occurred at 400ºC, the spectrum at this temperature does
not resemble that of calc-FHAp2. Although it is difficult to estimate the exact
temperature at which the FT-IR spectrum becomes suitable for %F estimation using
Freund et. al.[4] and Baumer et.al.[5] methods due to the bands being broad when the
heat treatment was less than 800ºC; we estimate from this data that at 700ºC the band
positions are identical to that of calc-FHAp2. This study confirms that the fluoride ions in
the FHAp samples change positions within the lattice over a large temperature range. The
results have serious implications for the use of room temperature FT-IR spectra for
monitoring the degree of reaction in solid state reactions between inorganic salts which
have been heated to various temperatures as has been reported previously.[7,8] Indeed,
based on our findings the conclusion is that FT-IR is an unsuitable tool to follow such
reactions.
Conclusion
19
Our results clearly show that FT-IR spectroscopy is a powerful tool for studying FHAp
samples in that it provides an accessible method for estimating the fluoride content in
samples heat treated to temperatures of 800ºC or above. As demonstrated, it should,
however, not be used to estimate the fluoride ion content in solution-prepared FHAp
samples. Our explanation for the discrepancy in the observed FT-IR spectra of solution-
prepared samples and the fluoride content is the lack of diffusion of fluoride ions in the
X-channels at room temperature. In addition, the FHAp FT-IR spectrum develops over a
large temperature range due to the fluoride ions originating from different positions in the
lattice. The range of papers appearing in the literature where accurate analysis of FHAp
samples is required means that both the strengths and the limitations of FT-IR
spectroscopy as a technique must be recognised.
Acknowledgements
Mr. T. Raftery, X-ray analysis facility QUT, is greatly acknowledged for XRD
measurements and expert assistance in XRD analysis. Dr Wayde Martens is thanked for
helpful discussions.

20
References
[1] J.C. Elliott "Structure and Chemistry of the Apatites and Other Calcium
Orthophosphates" in Studies in Inorganic Chemistry 18 (Elsevier, Amsterdam,
1994).
[2] G. Rizzi, R. Groppetti, L. Salvarani, A. A. Scrivani, Key Eng. Mater. 218-220
(2002) 93.
[3] M. Wei, J.H. Evans, E.Wentrup-Byrne, J. Australasian Ceram. Soc. 36 (2000)
47.
[4] F. Freund and R. M. Knobel, J. Chem. Soc., Dalton Trans. (1977) 1136.
[5] A. Baumer, M. Ganteaume, and W.E. Klee, Bull. Mineral. 108 (1985) 145.
[6] R. A. Young, W. Van der Lugt, J. C. Elliott, Nature, 223 (1969) 729.
[7] G.C. Maiti, Ind. J. Chem., 29A (1990) 402.
[8] G.C. Maiti, Ind. J. Chem., 31A (1992) 276.
[9] L. Gineste, M. Gineste, X. Ranz, A. Ellefterion, A. Guilham, N. Rouguet, P.
Frayssinet, J. Biomed. Mater. Res. (Appl. Biomater.), 48 (1999) 224.
[10] A. Bigi, E. Foresti, A. Ripamonti, N. Roveri, J. Inorg. Biochem., 27 (1986) 31.
[11] A. Krajewski, A. Ravaglioli, N. Roveri, A. Bigi, E. Foresti, J. Mater. Sci., 25
(1990) 3203.
[12] L.J. Jha, S.M. Best, J.C. Knowles; I. Rehman, J.D. Santos, W. Bonfield, J. Mater.
Sci. Mater. Med., 8 (1997) 185.
[13] I. Manjubala, M. Sibakumar, S. Najma Nikkath, J. Mater. Sci., 36 (2001) 5481.
[14] H. Qu, M. Wei, J. Mater. Sci. Mater. Med., 16 (2005) 129.
[15] M. Wei, J. H. Evans, T. Bostrom, L. Grøndahl, J. Mater. Sci. Mater. Med., 14
(2003) 311.
[16] E.J. Duff, Chem. Ind. (1974) 349.
[17] E. J. Duff, J. L. Stuart, Anal. Chim. Acta, 52 (1970) 155.
[18] A. M. Vassallo, P. A. Cole-Clarke, L. S. K. Pang, A. J. Palmisano, Appl.
Spectrosc., 46 (1992) 73.

21
[19] L. Rintoul, H. Panayiotou, S. Kokot, G. George, G. Cash, R. Frost, T. Bui P.
Fredericks, Analyst, 123 (1998) 571.
[20] E. J. Duff, Archs. Oral Biol., 20 (1975) 763.
[21] B.O. Fowler, Inorg. Chem., 13 (1974) 207.
[22] R.A. Young, D.W. Holcomb, Calcif. Tissue Int., 34 (1982) S17.
[23] D.G.A. Nelson, B.E. Williamson, Aust. J. Chem., 35 (1982) 715.
[24] F. Freund, Inorg. Nucl. Chem. Lett., 13 (1977) 57.
[25] F. Freund, “Ceramics and Thermal Transformations of Minerals”, p 465-482 in
“The Infrared Spectra of Minerals” Ed V. V. Farmer, Mineralogical Society,
London (1974).
[26] H. Nishikawa, Mater. Lett., 50 (2001) 354.
[27] K. Tõnsuaadu, M. Peld, V. Beder, J. Therm. Anal. Cal., 72 (2003) 363.
[28] N.W. Cant, J.A.S. Bett, R.W. Geoffrey, W.K. Hall, Spectrochim. Acta, 27A
(1971) 425.
[29] I. Reisner, W.E. Klee, Spectrochim. Acta, 38A (1982) 899.
[30] J. Shi, A. Klocke, M. Zhang, U. Bismayer, Am. Mineralogist, 88 (2003) 1866.
[31] Y. Pan, Phosphorous, Sulfur and Silicon, 144-146 (1999) 413.
22
List of Tables
1. Synthetic conditions for preparation of FHAp samples
2. Characterisation of apatite samples
3. Estimation of F-content from FT-IR spectra in calc-FHAp samples
List of Figures
1. ATR-FT-IR spectra of (A) calc-HAp, (B) FHAp2, and (C) calc-FHAp2
2. Graph of a-axis parameter obtained from XRD versus %F obtained from fluoride
selective electrode measurement; ■ calcined samples, ♦ un-calcined samples
3. Schematic illustration of the different arrangements possible along the X-columns
in FHAp solid solutions. Model adapted from Freund [4, 24]
4. ATR-FT-IR spectra of the 600-800 cm-1 region of (top to bottom) calc-HAp, calc-
FHAp1, calcFHAp2, calc-FHAp3, calc-FHAp4, calc-FHAp5
5. Emission spectra of HAp obtained by heating from 100ºC to 1000ºC and
subsequently cooling to 100ºC. Solid lines for spectra obtained during heating;
dotted lines for spectra obtained during cooling.
6. Emission spectra of FHAp2 obtained by heating from 100ºC to 1000ºC and
subsequently cooling to 100ºC. Solid lines for spectra obtained during heating;
dotted lines for spectra obtained during cooling.
7. Model for changes in fluoride and hydroxyl ion positions for FHAp samples
during heating.
23
Table 1: Synthesis condition for preparation of FHAp samples
Sample Volume of 0.01M NaF
(mL/g of HAp)
Number of pH cycle
FHAp1 25 1
FHAp2 50 3
FHAp3 150 3
FHAp4 250 4
FHAp5 300 4
24
Table 2: Characterization of apatite samples
Sample Ca/P ratioa %F b a-axis (Å)c c-axis (Å)c Other phasec
HAp 1.68 ─ 9.4239(5) 6.883(3)
FHAp1 1.72 12.7 9.4224(9) 6.883(3)
FHAp2 1.69 23.8 9.4137(5) 6.884(2)
FHAp3 1.74 52.5 9.4028(6) 6.889(2)
FHAp4 1.74 56.8 9.4009(7) 6.884(3)
FHAp5 1.75 73.4 9.391(2) 6.885(1)
Calc-HAp 1.71 ─ 9.4224(4) 6.882(2) β-TCP (13%)
Calc-FHAp1 1.72 17.7 9.4104(4) 6.883(2) β-TCP (14%)
Calc-FHAp2 1.71 25.8 9.4013(7) 6.8811(5) β-TCP (10%)
Calc-FHAp3 1.74 57.9 9.3874(3) 6.8836(2)
Calc-FHAp4 1.78 71.9 9.3786(2) 6.8849(2)
Calc-FHAp5 1.73 73.4 9.3804(2) 6.8858(2)
a: Determined by ICP-AES, b: determined by fluoride selective electrode, c: determined by XRD
25
Table 3: Estimation of F-content from FT-IR spectra in calc-FHAp samples
Sample HF/HLa abs
%Fb OHstretch
%Fc OHlibr
%Fd found
calc-HAp − 0 0 0
calc-FHAp1 0.881 10-20 19 18
calc-FHAp2 0.528 20-25 31 26
calc-FHAp3 0.096 50-75 50 58
calc-FHAp4 0.035 50-75 76 72
calc-FHAp5 0.034 50-75 76 73
a: ratio of high frequency (HF) and low frequency (LF) absorption of the OH stretching, b: %fluorine predicted from the ratio of HF and LF absorption by comparing to data in reference 5, c: %fluorine predicted from the spectral signature of the OH libration bands by comparing to data in reference 4, d: %fluorine determined by fluoride selective electrode.

26
Figure 1
27
9.37
9.38
9.39
9.40
9.41
9.42
9.43
0 10 20 30 40 50 60 70 80
% Fluoride ion substitution
a la
ttice
par
amet
er (Å
)
Figure 2.
28
F HO (HO)n HO:OH (OH)n OH F
a: 631 - 647 cm-1
d: 747 cm-1
F HO F
F HO (HO)n HO:OH (OH)n OH F
b: 713 - 720 cm-1
F HO (HO)n HO:OH (OH)n OH Fc: 673 - 680 cm-1
Figure 3.
29
Figure 4.

30
Figure 5

31
Figure 6.
32
Figure 7
c-axis
Phosphate
Fluoride
Hydroxide
> 700ºC
Fluoride in interstitial site X-channel