Embed Size (px)
Citation preview
75% 12
825 %
9 %
16 %
80706050403020100
2011 2013 2016
QUICK GUIDE
ON SOURCES AND USES
OF LABOUR STATISTICS
Copyright © International Labour Organization 2017 First published 2017 Publications of the International Labour Office enjoy copyright under Protocol 2 of the Universal Copyright Convention. Nevertheless, short excerpts from them may be reproduced without authorization, on condition that the source is indicated. For rights of reproduction or translation, application should be made to ILO Publications (Rights and Licensing), International Labour Office, CH-1211 Geneva 22, Switzerland, or by email: [email protected]. The International Labour Office welcomes such applications.
Libraries, institutions and other users registered with a reproduction rights organization may make copies in accordance with the licences issued to them for this purpose. Visit www.ifrro.org to find the reproduction rights organization in your country. ISBN: 978-92-2-130119-6 (web pdf)
978-92-2-130120-2 (epub) 978-92-2-130123-3 (mobi) The designations employed in ILO publications, which are in conformity with United Nations practice, and the presentation of material therein do not imply the expression of any opinion whatsoever on the part of the International Labour Office concerning the legal status of any country, area or territory or of its authorities, or concerning the delimitation of its frontiers.
The responsibility for opinions expressed in signed articles, studies and other contributions rests solely with their authors, and publication does not constitute an endorsement by the International Labour Office of the opinions expressed in them.
Reference to names of firms and commercial products and processes does not imply their endorsement by the International Labour Office, and any failure to mention a particular firm, commercial product or process is not a sign of disapproval.
Information on ILO publications and digital products can be found at: www.ilo.org/publns.
Printed in Switzerland
2
Contents
Acknowledgements ................................................................................................................................. 3
1. Introduction .................................................................................................................................... 4
2. What are labour statistics? ............................................................................................................. 4
2.1. Labour statistics are official statistics ..................................................................................... 5
2.2. Labour statistics refer to productive activities ....................................................................... 5
2.3. Labour statistics are multidimensional ................................................................................... 6
2.4. Scope of labour statistics ........................................................................................................ 7
2.5. Labour statistics and decent work .......................................................................................... 9
2.6. Labour statistics and the Sustainable Development Goals ..................................................... 9
3. What are labour statistics for?........................................................................................................ 9
4. How are labour statistics produced? ............................................................................................ 10
4.1. Population census ................................................................................................................. 11
4.2. Household surveys (including labour force surveys) ............................................................ 11
4.3. Establishment census and surveys ........................................................................................ 12
4.4. Administrative records .......................................................................................................... 12
4.5. National accounts ................................................................................................................. 13
4.6. Big data ................................................................................................................................. 14
4.7. Other sources ........................................................................................................................ 14
4.8. Consolidated labour market information systems ............................................................... 15
5. What are the international standards for labour statistics? ........................................................ 16
5.1. The ILO Department of Statistics .......................................................................................... 16
5.2. Conventions and Recommendations of the International Labour Conference .................... 17
5.3. Resolutions and Guidelines of the International Conference of Labour Statisticians .......... 18
6. How to use and interpret labour statistics effectively? ................................................................ 18
6.1. Scope and meaning of labour statistics determined by their source and methodology ..... 19
6.2. Leading indicators versus lagging indicators ........................................................................ 27
6.3. Units of measurement and central tendency measures ...................................................... 28
6.4. Uncertainty and reliability .................................................................................................... 31
6.5. Seasonal adjustments ........................................................................................................... 32
6.6. Labour indicators as a coherent framework ......................................................................... 34
7. Concluding remarks ...................................................................................................................... 36
8. Annex: Summary information on the sources of labour statistics ............................................... 37
3
Acknowledgements
This quick guide was drafted by Rosina Gammarano of the ILO Department of
Statistics’ Data Production and Analysis Unit, based on her experience in providing
training on labour statistics and dealing with non-advanced data users’ requests. The
quality of the first draft was improved by the editorial work and guidance of Steven
Kapsos, as well as by valuable comments from other colleagues in the Department,
notably Ritash Sarna, Marie-Claire Sodergren, Yves Perardel, Hakki Ozel and Valentina
Stoevska. For some sections of this document, and particularly figure 1, the author drew
inspiration from presentations on labour statistics initially prepared by Monica Castillo.
4
1. Introduction
The term statistics comes from the German “statistic” which referred to the science
dealing with facts of a state and derived from the New Latin “statisticus” (“concerning
state affairs”) and from the Latin “status” (“state”).1 Thus, statistics were originally
intended for government use and to provide data on the state territory and
characteristics.
Labour statistics are a body of official statistics which deals with work, productive
activities, workers, the characteristics of the labour market and the way it operates. They
encompass a wide range of topics and link to many other bodies of official statistics, such
as economic statistics, education statistics and health statistics, to name a few.
Having timely, valid, reliable, and comparable labour statistics is crucial to inform policy
formulation, implementation and evaluation, labour market research and goal setting and
monitoring. Such labour statistics can be derived from a number of different types of
sources, including population censuses, household surveys and establishment surveys.
The quality and meaning of the labour statistics produced depends on the characteristics,
strengths and limitations of the source used. To ensure the comparability and robustness
of labour statistics, the methodology used to produce them should ideally follow
international standards.
The production of labour statistics is never a goal in itself, but it is always a means to an
end (or more accurately, various ends). The true value of labour statistics lies in the
analysis and interpretation made of them, and their ability to support evidence-based
decision and policy-making.
This guide provides an overview of the main characteristics of labour statistics, their
scope and uses. It also describes the types of sources of labour statistics available,
indicating the main advantages and disadvantages of each source, before moving on to
introducing the international standards underlying labour statistics. The guide also seeks
to demonstrate the importance of labour statistics in terms of their analytical potential.
Although the guide is not exhaustive and does not thoroughly describe each possible
specific source of labour statistics and every eventual use of labour statistics, it serves as
an introductory tool to the field of labour statistics. It is addressed to people wishing to
gain a basic understanding of labour statistics so as to apply this in their work or to better
grasp labour market developments. This includes researchers, journalists, students of
various subjects, data users in general and anyone who is eager to learn about the labour
market.
2. What are labour statistics?
Labour statistics are a very relevant and necessary body of official statistics
focusing on the productive activities of workers and eventually deficiencies of the labour
1 Collins English Dictionary, available at: https://www.collinsdictionary.com/dictionary/english
5
market, from many perspectives and covering many dimensions. The following sections
explore in detail these main characteristics of labour statistics, namely their place in
official statistics, their reference to productive activities, their multidimensional nature,
and their scope.
2.1. Labour statistics are official statistics
As mentioned in the introduction, the link between statistics and the government
(state) is embedded even in the etymology of the word statistics, that is, their official
nature is at the heart of their very definition. This is no different for labour statistics.
Official labour statistics are generally produced by the institution in charge of statistics
in a country. This is usually a separate agency: the national statistical office or institute,
but it could also be a unit of another agency (a related ministry, for instance). In particular
for labour statistics, the labour ministry could be in charge of the compilation and
dissemination of data where a national statistical office does not exist or does not have
the relevant mandate or resources.
The institution in charge of labour statistics should be part of the government so as to
ensure the production and dissemination of statistics as a public interest, to inform policy
makers as well as the general public, instead of pursuing private interests (as is the case
of private companies producing statistics for their own purposes).
However, in spite of being part of the government, the institution in charge of statistics
should be independent from the government. Full autonomy is necessary to ensure the
robustness of the methodologies used and the reliability of the figures, untarnished by
political or other concerns.2
The national statistical system includes many different bodies of statistics in addition to
labour statistics, such as national accounts, industrial production statistics, agricultural
statistics, demographic statistics, education statistics, and health statistics. Ideally, all of
these bodies of statistics would be linked together and consolidated through the use of
consistent methods.
2.2. Labour statistics refer to productive activities
Labour statistics refer to the productive activities of workers, and the labour
market deficiencies associated with them. Work comprises any activity performed by
persons of any sex and age to produce goods or to provide services for use by others or
for own use3, and labour statistics potentially cover all forms of work. This includes work
2 For further information on the main principles guiding the production and dissemination of official statistics, refer to the Resolution adopted by the United Nations General Assembly on 29 January 2014, on Fundamental Principles of Official Statistics, available at https://unstats.un.org/unsd/dnss/gp/fundprinciples.aspx 3 As defined in the Resolution concerning statistics of work, employment and labour underutilization, adopted by the Nineteenth International Conference of Labour Statisticians (October 2013), available at http://ilo.org/global/statistics-and-databases/standards-and-guidelines/resolutions-adopted-by-international-conferences-of-labour-statisticians/WCMS_230304/lang--en/index.htm
6
for pay or profit for use by others (employment), work not for pay or profit for use by
others (unpaid trainee work, volunteer work, and other work activities) and work for
own final use (own-use production work).
The need to produce statistics on forms of work other than employment has been
recently recognized officially, with the first definitions for these other forms of work
incorporated in the 2013 Resolution concerning statistics of work, employment and labour
underutilization.4 Thus, labour statistics around the world focus mainly on employment
(as opposed to other forms of work).
Labour statistics also seek to provide a comprehensive picture of the labour market,
informing on both the supply side and the demand side. Statistics on labour supply refer
to data on the population (actually or potentially) providing the labour input needed in
the economy, that is, data on the employed, the unemployed and persons outside the
labour force (which together represent the whole population, or the working-age
population in cases where a lower or upper age limit is used), as well as on their specific
characteristics (sex, age, economic activity, occupation, educational level, etc.). Statistics
on labour demand refer to the users and uses of the labour input, that is, data on the
enterprises creating employment, vacancies, jobs, productivity, etc.
2.3. Labour statistics are multidimensional
In addition to covering productive activities from various perspectives (labour
supply and labour demand, work for pay and profit or not, work for use by others or not),
labour statistics also include data on multiple dimensions.
The various aspects and issues of the labour market covered by labour statistics span
across disciplines such as demography (ratio of working-age-population to total
population, ratio of youth to adults, ratio of seniors to adults, etc.), economics
(productivity, wages, unemployment, etc.) and social studies (labour market
performance according to sex, age, educational level, etc.). Labour statistics are also
closely connected to other statistical areas such as statistics on household income and
expenditure and the consumer price index, since these allow for the assessment of
household living conditions and minimum wage setting, part and parcel of the world of
work.
Labour statistics also provide tools to study labour markets both at the micro and macro
levels. They allow us to investigate and understand decisions, behaviours and labour
market performance of individuals and enterprises (microeconomic perspective), as well
as the labour market performance of the country as a whole (macroeconomic
perspective).
4 The full text of the resolution is available at http://www.ilo.ch/global/statistics-and-databases/standards-and-guidelines/resolutions-adopted-by-international-conferences-of-labour-statisticians/WCMS_230304/lang--en/index.htm
7
Naturally, all of this can (and should) be studied over time, so as to assess fluctuations.
The analysis of short-term and long-term trends is another key part of labour statistics.
Thus, labour statistics present the variety of measures needed to potentially convey a
comprehensive picture of the labour market, covering demographic and socioeconomic
aspects, the labour market performance of individuals, businesses and the economy as a
whole, the characteristics of labour supply and labour demand, all forms of work and all
types of productive activities, and providing the means to study their evolution.
2.4. Scope of labour statistics
As stated above, labour statistics focus on a wide range of labour markets issues
and their variations over time, which means that the scope of labour statistics is vast.
Labour statistics refer both to labour demand and supply. Statistics about labour demand
include data on the number and characteristics of enterprises, jobs, and vacancies as well
as the costs of hiring. Statistics about labour supply deal with the working-age population,
presenting data on its size, structure and characteristics, and more specifically,
information on employment, unemployment, and persons outside the labour force. Some
of the main characteristics of jobs and employment covered by labour statistics include
earnings, working time, economic activity, occupation, status in employment,
establishment size, private/public sector, formal/informal sector, social dialogue,
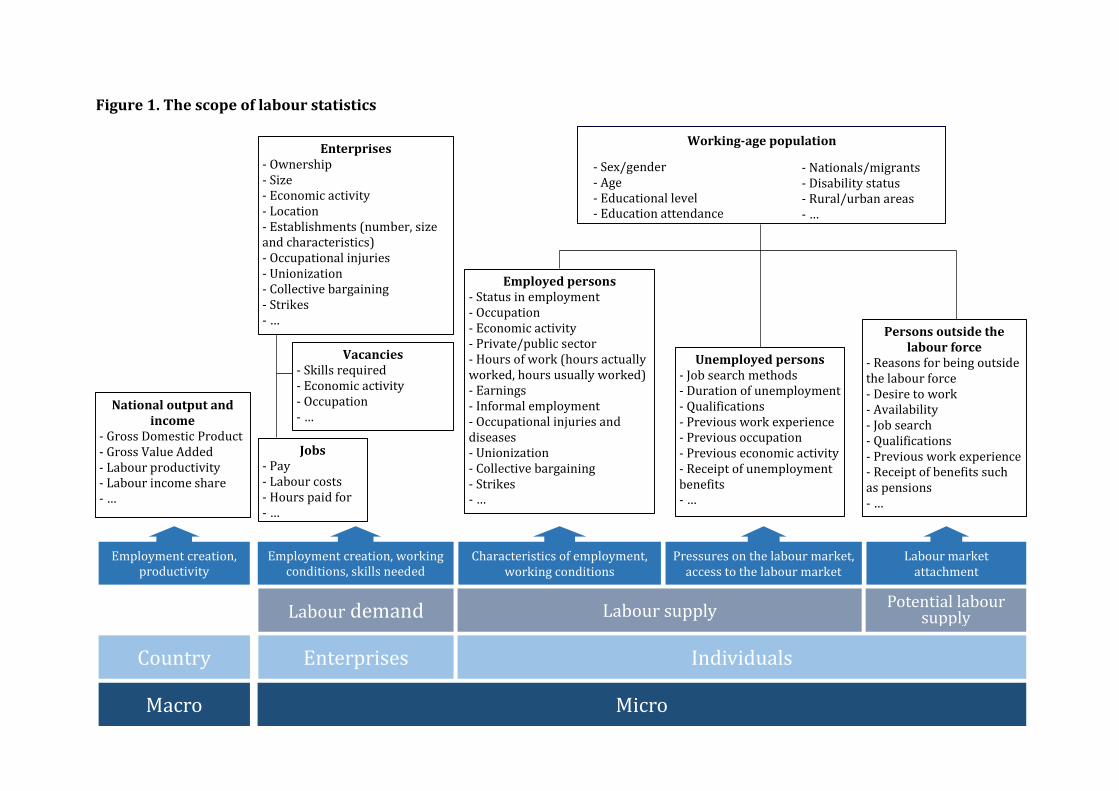
occupational injuries, and social security coverage.5 The figure below summarizes the
items within the scope of labour statistics.
5 For more information, check the ILO webpage on Overview and topics of labour statistics, at http://ilo.org/global/statistics-and-databases/statistics-overview-and-topics/lang--en/index.htm
8
Figure 1. The scope of labour statistics
Enterprises - Ownership - Size - Economic activity - Location - Establishments (number, size and characteristics) - Occupational injuries - Unionization - Collective bargaining - Strikes - …
Vacancies - Skills required - Economic activity - Occupation - …
Jobs - Pay - Labour costs - Hours paid for - …
Employed persons - Status in employment - Occupation - Economic activity - Private/public sector - Hours of work (hours actually worked, hours usually worked) - Earnings - Informal employment - Occupational injuries and diseases - Unionization - Collective bargaining - Strikes - …
Unemployed persons - Job search methods - Duration of unemployment - Qualifications - Previous work experience - Previous occupation - Previous economic activity - Receipt of unemployment benefits - …
Persons outside the labour force
- Reasons for being outside the labour force - Desire to work - Availability - Job search - Qualifications - Previous work experience - Receipt of benefits such as pensions - …
Labour market attachment
Pressures on the labour market, access to the labour market
Characteristics of employment, working conditions
Employment creation, working conditions, skills needed
Macro Micro
Labour demand Labour supply Potential labour
supply
Country Individuals Enterprises
Employment creation, productivity
Working-age population
National output and income
- Gross Domestic Product - Gross Value Added - Labour productivity - Labour income share - …
- Sex/gender - Age - Educational level - Education attendance
- Nationals/migrants - Disability status - Rural/urban areas - …
9
2.5. Labour statistics and decent work
As discussed in the previous sections, labour statistics cover many different
aspects of the world of work, referring to labour supply and demand, and casting light not
only on the quantity of employment but also on its quality. Quality of employment
pertains to the various dimensions of working conditions, including earnings, working
time, status in employment, sector of employment (formal or informal), collective
bargaining coverage, and unionization, to name a few.
This is closely related to the concept of “decent work”6, which represents the ideal of
enough freely-chosen, quality jobs for all men and women who wish to work. Decent
work stands on four main pillars: employment creation, rights at work, social protection
coverage and social dialogue, with gender equality underlying all of them, with a view to
achieving sustainable, inclusive economic growth, and eliminating poverty.
In order to monitor progress made towards the achievement of decent work for all, a
Decent Work Indicators Framework was designed, comprising both statistical and legal
framework indicators, and covering numerous areas of the world of work.7
2.6. Labour statistics and the Sustainable Development Goals
Similarly, labour statistics are also embedded in the Sustainable Development
Goals (SDGs), primarily (but not solely) through Goal 8 - Promote inclusive and
sustainable economic growth, employment and decent work for all. The SDGs are an
encompassing tool and action plan designed and adopted by the international community
to achieve sustainable development throughout the world by 2030.8
In this regard, a global indicator framework has been created to measure progress made
towards the accomplishment of the SDGs, comprising over 230 indicators on a wide array
of topics, including various labour and decent work indicators.9
3. What are labour statistics for?
Healthy labour markets generating decent and productive employment
opportunities are at the heart of the quest for inclusive economic growth and
development. Labour statistics are a valuable means to understanding labour markets.
They can potentially provide a wealth of information on the way labour markets work,
their strengths and shortcomings, and the trends observed and expected.
6 For more information on the concept of Decent Work and the ILO’s Decent Work Agenda, refer to http://www.ilo.org/global/topics/decent-work/lang--en/index.htm 7 For further information refer to the ILO manual Decent Work Indicators - Guidelines for producers and users of statistical and legal framework indicators, available at http://www.ilo.org/stat/Publications/WCMS_223121/lang--en/index.htm 8 For more information on the Sustainable Development Goals (SDGs) and the 2030 Agenda for Sustainable Development, refer to http://www.un.org/sustainabledevelopment/# 9 For more information on the SDG indicators, refer to https://unstats.un.org/sdgs/indicators/indicators-list/
10
Labour statistics are key for macro-economic monitoring. They inform on the economy’s
performance and the impact in terms of employment generation of economic policies.
They allow for the identification of issues within labour markets, and support the
formulation and implementation of policies and programmes to promote Decent Work,
as well as the evaluation of their subsequent results. They are also the basis for goal
setting in terms of labour market performance and for monitoring progress towards the
attainment of such goals.
Labour statistics play an important role in the communication between policy-makers
and decision-makers and the general public, since they promote the understanding of
common labour market problems and the actions undertaken to address them, thus also
contributing to engagement between the general public and policy-makers.
More specifically, labour statistics have a significant part to play in the achievement of
decent work for all, by informing on the formulation, implementation and evaluation of
policies and programmes for job creation, appropriate working conditions, sound
industrial relations, work-life balance, and assistance for vulnerable groups.
4. How are labour statistics produced?
Labour statistics comprise statistics from a wide range of labour-related topics
and can be derived from a variety of sources. The characteristics of the statistical source
determine how reliable, comparable and representative labour statistics and labour
indicators (summary measures representing labour statistics related to a specific topic)
are. Hence, when referring to labour statistics, it is crucial to understand the implications
of the type of source used and to keep in mind its methodology and coverage
(geographical, population, topics, etc.) of the underlying source.
The more traditional sources of labour statistics are population and establishment
censuses, and household and establishment surveys, because these are purposely
designed to produce statistics. However, a wealth of valuable information can also be
derived from sources not initially created for statistical purposes, such as administrative
records and big data.
In any given country, there are typically various sources of official statistics available. A
very developed and integrated system of statistics will involve production of statistics
from all the above-mentioned sources (with the exception perhaps of big data, which has
not yet been widely incorporated into official statistics). National statistical offices are
generally at the core of the national system of official statistics, usually designing and
conducting data collection activities for the purpose of producing statistics (censuses and
surveys), deriving statistics from information available to other agencies (records kept
by other agencies), and coordinating statistical efforts of the various agencies with some
statistical capacity. Regarding labour market statistics specifically, the other agencies
involved in data production (and often also in dissemination) include labour ministries,
social security institutions and employment offices.
11
The following sections give an overview of the main strengths and limitations of each of
the main sources of labour statistics. A synoptic table with summary information on the
main sources of labour statistics is provided in annex.
4.1. Population census
The population census is a key source of information on the population, usually
acting as the basis for a country’s official statistics on households and individuals. It is an
exhaustive exercise, with universal coverage: all households in a country are contacted
in the data collection phase and information on all household members is gathered.
Thanks to this, it can serve as sample frame later on for sample surveys. Its universal
coverage and high representativeness allow for the study of small population groups and
geographical areas.
Nevertheless, because it is such an exhaustive collection, a population census is very
costly and is thus usually conducted infrequently. Generally, countries conduct
population censuses every 10 years.10 Also, a population census tends to collect general
information only, not going into detail for specific topics such as labour, which adversely
affects the quality of the labour statistics obtained from this source.
4.2. Household surveys (including labour force surveys)
One way of overcoming the high cost of population censuses, and enabling the use
of longer questionnaires to gather more in-depth information, is selecting a sample of the
whole population in the census to conduct a survey. Sample survey questionnaires are
typically longer, and designed specifically to collect data on the desired topics. By their
nature, household surveys can cover any topic on which household members provide
information. They are cheaper than censuses, so they can be more frequent, allowing for
the study of short-term trends. Due to the fact that they cover all individuals in the
sampled households, regardless of their labour market status, their occupation, the type
of establishment they work for, etc., household surveys provide a consistent framework
to simultaneously study employment, unemployment and persons outside the labour
force, with many interesting disaggregations. This also means that household surveys
cover workers in the informal sector and/or in informal employment, given that
individuals within the sample are interviewed irrespective of the characteristics of their
employment (as opposed to establishment surveys, which tend to exclude informal sector
enterprises and informal employment, as discussed below).
However, household surveys entail sampling errors, potentially hindering the quality of
the results. In particular, estimates for small groups or areas might have limited reliability
due to their low coverage in the sample. Moreover, the reliability of the results is highly
dependent on the accuracy of the respondents, who might tend to overstate or understate
10 As recommended by the United Nations Statistics Division. Detailed information on when countries around the world conducted population censuses can be found at https://unstats.un.org/unsd/demographic/sources/census/censusdates.htm
12
some particular answers. The use of proxy respondents (one household member
providing the required information on all the members of his or her household) may also
hinder the accuracy of the answers given to the survey questionnaire.
Labour force surveys are the main type of household surveys used to derive labour
statistics, since they are designed specifically for that purpose, and thus, the survey
questionnaires allow to properly investigate the desired labour-related topics with
enough probing questions to ensure the accuracy of the results. However, other
household surveys, such as household income and expenditure surveys or time-use
surveys, can be used as well, provided they include a corresponding labour module.
4.3. Establishment census and surveys
In population censuses and household surveys, the sampling unit is the household,
but statistics can also be collected using the establishment as a sampling unit, particularly
regarding income, working time and employees – that is, topics on which the
establishment or employer holds information. In general, surveying establishments is
less expensive and more cost-effective than surveying households. Here too, there is the
possibility of an exhaustive exercise covering all establishments in a country
(establishment census) or of a collection focusing only on a representative sample of
establishments (establishment survey). Naturally, establishment censuses are more
costly and are typically conducted less frequently than establishment surveys, but they
are more representative.
It is crucial to note that informal sector establishments and small establishments are
rarely covered, and depending on the national context, these might represent a
considerable share of the labour market. Likewise, establishment censuses and surveys
cover only employees, thus excluding the self-employed (employers, own-account
workers, contributing family workers, etc.).
4.4. Administrative records
Administrative records are utilised for administrative purposes such as keeping a
record of the members, activities, staff, etc. of the corresponding agency or institution.
They were not designed for statistical purposes, but they do have a significant underlying
statistical potential, and can be used to produce statistics as a by-product. They are
particularly useful in contexts where there are no regular household or establishment
surveys in place, to serve as an alternative source of statistics.
In any given country, the administrative records found are numerous and varied, and
cover a wide range of topics. Some examples are population registers (population data),
records of tax authorities (income data), registration of students in the educational
system (education data) and medical registration (health statistics). When it comes to
labour statistics, the main administrative records used are records of employment offices
or unemployment benefits (data on registered unemployment), records of workers’
organizations (data on unionization, strikes, etc.), collective agreements (data on
13
collective bargaining, wages, etc.) and labour inspection records (data on occupational
accidents).
Administrative records are a very inexpensive source of statistics, since they are created
and maintained by the corresponding agency and information is readily available, which
means that no further compilation effort is needed. By their nature, administrative
records usually have an exhaustive coverage of all the units in their reference universe.
However, given that the records were created for administrative purposes and not
statistical ones, they have to undergo some statistical processes for the data to actually
become reliable statistics, including the study of definitions, concepts and classifications
used, editing the data to correct any inconsistencies found, coding variables and creating
new ones if need be, and deciding on the imputation method to apply for the treatment
of missing data.
Depending on the incentives and rules associated with the registration process (for
instance whether filling in the administrative form is mandatory or not, or whether any
benefit is subject to the registration in the record), the resulting administrative data will
be more or less affected by issues of miss-counting, double-counting or under-reporting.
Whenever these issues are known or suspected to be significant, thorough procedures
should be put in place to correct the data before presenting it as valid.
Also, the topics covered and the units used will depend solely on the administrative
processes at the root of the creation of the record, and these are not necessarily the ones
data users need statistics on (as opposed to statistics derived from compilations designed
specifically for statistical purposes, where the topics covered, units used and variables
produced are typically the ones desired by data users).
4.5. National accounts
National accounts are a complete, integrated set of accounts created for the
purposes of measuring an economy’s performance. They usually comprise production,
income, expenditure accounts, capital accounts, financial accounts and balance sheets,
and they include information on both flows and stocks. The agencies responsible for their
compilation and maintenance are most commonly national statistical offices or central
banks, but this may differ from country to country.
National accounts are a key source of statistics on macroeconomic indicators, providing
accurate measures of a country’s aggregate economic activity given that they tend to
cover the activities of all economic actors (households, enterprises and the public sector).
Perhaps the most notable indicator derived from the national accounts is GDP (Gross
Domestic Product), but they allow for the calculation of many other useful measures, such
as the labour income share, exports and imports, the government deficit, households’
final consumption expenditure and even employment (which typically differs from
employment estimates derived from household surveys).
14
The quality of the data in national accounts heavily depends on the robustness of the
accounting and recording methods used, and the methodological consistency across the
various sources of information brought together in the accounts. Among the main
drawbacks of national accounts are the difficulties to measure the production of
intangible goods, and the exclusion of unpaid work (not comprised in the calculation of
the GDP or in any account). These issues may be more or less significant depending on
the national context.
When using data from national accounts, it is paramount to verify whether the
information is presented in nominal or real terms (that is, in current prices or adjusted
for inflation), especially when the intention is to calculate growth rates (such as the GDP
growth rate).
Even though the detailed structure and organization of national accounts may vary from
one country to another, the main components tend to be very similar across countries.
The UN System of National Accounts (SNA) represents the internationally-agreed
standard on the compilation and dissemination of aggregate economic measures from
national accounts.11
4.6. Big data
With the advent of technology, mobile devices and ubiquitous internet access, data
sets are growing exponentially both in number and size, with practically every online
transaction and search being recorded. Big data refers to all data sets that are too big to
be analysed using traditional data processing and statistical methods.
Big data can supply a wealth of information on labour statistics, for instance on job
searches, vacancies and skills. Even though there are still no internationally-agreed
methodologies and guidelines on deriving labour statistics from big data, it is rapidly
gaining ground as a statistical source.
Regarding the use of big data as a source of labour statistics, the main challenges are data
curation and triage (finding the portion of data that is actually useful for the purposes at
hand among the enormity of data available), establishing the appropriate concepts and
definitions and the coverage of the statistics (restricted to persons with Internet access,
or having the means to carry out transactions online, etc.).
4.7. Other sources
In the absence of a recent household or establishment survey coupled with a lack
of official procedures to produce reliable statistics from administrative records, other
sources and methods can provide some insight into the labour market. In particular, the
information available, knowledge on the national context and some conscious
assumptions can be used to derive estimated, imputed or modelled labour market data.
11 For more information on the UN System of National Accounts (SNA), please refer to https://unstats.un.org/unsd/nationalaccount/sna.asp
15
The methods used for estimation and imputation must be robust in order to ensure data
quality and the reliability of the results, just as any model used to derive labour statistics
should be thoroughly tested and reviewed.
With a view to meeting the needs in terms of labour statistics of various data users (both
in-house and external), the ILO regularly produces model-based estimates and
projections of labour market indicators. This long-standing effort by the ILO to produce
consistent and comparable data on the main labour indicators through the use of
econometric models provides both country-level estimates and regional and world
aggregates. Among the main ILO econometric models are the Labour Force Estimates and
Projections Model (estimates of the labour force and labour force participation rates), the
Global Employment Trends Model (estimates of unemployment, employment-to-
population ratios, status in employment, employment by sector, employment by
occupation and labour productivity) and the Employment by Class Model (estimates of
working poor and working poverty rates and the distribution of the employed across
economic classes).12 The ILO has also developed models to derive global and regional
estimates for other specific topics related to the labour market, such as wages, social
protection coverage, child labour and forced labour, and continuously works to expand
the topics covered by its modelled data production efforts.
4.8. Consolidated labour market information systems
As explained in the previous sections, each type of source has its advantages,
disadvantages and specificities. No single data source can meet all needs, but rather, the
different source types are complementary. All the main sources mentioned should
contribute to an overall integrated system of national labour statistics. By recognizing the
relative strengths, limitations and complementarities of the various types of sources
available, the spectrum of labour statistics becomes wider and more robust.
There are numerous ways in which different source types can complement and enrich
each other. For instance, census data can be used for benchmarking and to develop
sample frames for surveys, as well as population or business registers. Also, survey data
can provide between-census estimates and be used to monitor short-term trends.
Furthermore, administrative data can complement survey and census data, and at the
same time, survey data can help to offset the problem of under-registration in
administrative records.
However, for this to be possible (that is, to have an integrated statistical system of labour
market information reconciling the various source types available), it is necessary to
ensure the coherence between sources in terms of the methodological guidelines used
(concepts, definitions, classifications, reference periods, etc.). Ideally, this coherence
12 For more detailed information on the ILO’s estimates and projections of labour market indicators, see http://www.ilo.org/empelm/projects/WCMS_114246/lang--en/index.htm and http://www.ilo.org/wcmsp5/groups/public/---dgreports/---inst/documents/publication/wcms_216451.pdf
16
would be obtained by all sources adhering to the relevant international standards on
labour statistics.
5. What are the international standards for labour statistics?
International standards on labour statistics are crucial to ensure the validity,
consistency, accuracy, reliability, timeliness and comparability of labour statistics
produced around the world. There are two main types of internationally-agreed
standards on labour statistics: Conventions and Recommendations adopted by the
International Labour Conference (ILC13) and Resolutions and Guidelines adopted by the
International Conference of Labour Statisticians (ICLS14). The ILO, and in particular its
Department of Statistics, is the reference at the international level for standards on the
compilation and dissemination of labour statistics.
5.1. The ILO Department of Statistics
Acknowledging the essential role played by labour statistics in the ILO’s efforts to
accomplish its mandate and achieve decent work for all, a statistical unit was created
within the ILO since its very inception. This statistical unit (the Department of
Statistics15) represents the core of ILO statistical expertise and activities, by being the
focal point within the ILO for all statistical matters. The ILO Department of Statistics is
also the focal point within the United Nations system for labour statistics.
One of the main activities of the ILO Department of Statistics is the compilation and
dissemination of labour statistics, covering numerous labour-related topics, and ensuring
the relevancy, accuracy, reliability, timeliness and comparability of the data. The
Department’s aim is to provide both internal (ILO) and external data users (students,
researchers, journalists, policy-makers, etc.) with the labour statistics they require. This
is accomplished in the ILO Department of Statistics’ online database, ILOSTAT16, which
puts at the public’s disposal a very comprehensive set of labour-related indicators with
long time-series and country-level data, as well as global and regional aggregates for a
number of key labour market indicators.
The ILO Department of Statistics is also a key actor in the process of setting international
standards of labour statistics to promote the improved measurement of labour issues and
enhance international comparability (see section 5.3 below).
Another major activity of the Department of Statistics is providing technical assistance
and training in labour statistics to ILO constituents, to foster the development of national
statistical systems and labour market information systems in particular.17
13 http://www.ilo.org/ilc 14 http://www.ilo.org/icls 15 http://www.ilo.org/stat/ 16 ILOSTAT, the ILO’s central online database on labour statistics is available at www.ilo.org/ilostat 17 For more detailed information on the ILO Department of Statistics’ mandate and activities, check its webpage at http://ilo.org/stat/lang--en/index.htm
17
5.2. Conventions and Recommendations of the International Labour
Conference
Conventions and Recommendations adopted by the International Labour
Conference are legal instruments that set international labour standards. They are
drafted by ILO constituents (governments, employers and workers of all member states)
and are adopted at the ILO's annual ILC to establish basic principles and rights at work
and to promote sound labour markets. ILC conventions and recommendations are part of
the international labour code.
Conventions are legally binding and may be ratified by member states, while
recommendations are non-binding guidelines and thus do not require ratification. ILO
member States are required under the ILO Constitution to submit labour standards
adopted by the ILC to the national competent authority for consideration (consideration
for ratification in the case of conventions). Countries having ratified a convention are
expected to apply it in national law and practice and report regularly on its application to
the ILO.18 In terms of labour statistics, the existing legal instruments adopted by the ILC
are the Labour Statistics Convention (convention n°160)19 and the Labour Statistics
Recommendation (recommendation n°170)20, both adopted in 1985.
The Labour Statistics Convention lays out the basic framework for the progressive
elaboration of national labour statistics programmes. It covers an array of labour-related
topics, including labour force, employment, unemployment, time-related
underemployment, earnings, working time, wage structure and distribution, labour cost,
consumer price indices, household expenditure, occupational injuries and industrial
disputes. Hence, it covers statistics produced from various sources, including population
censuses, household surveys, establishment surveys and administrative records.
Countries are allowed to ratify selected articles of the convention if they are not ready to
ratify it in full (that is to say, they can ratify the parts pertaining to some topics only).
Ratifying countries (50 to this day)21 commit themselves to regularly collecting,
compiling and disseminating basic statistics on the relevant topics.
The Labour Statistics Convention of 1985 replaced and expanded the 1938 Convention
concerning Statistics of Wages and Hours of Work (convention n° 63).22
18 For more detailed information on international labour standards, see http://www.ilo.org/global/standards/introduction-to-international-labour-standards/lang--en/index.htm 19 The full text of the Labour Statistics Convention, 1985 (No. 160) is available at http://www.ilo.org/dyn/normlex/en/f?p=NORMLEXPUB:12100:0::NO::P12100_INSTRUMENT_ID:312305 20 The full text of the Labour Statistics Recommendation, 1985 (No. 170) is available at http://www.ilo.org/dyn/normlex/en/f?p=1000:12100:::NO:12100:P12100_INSTRUMENT_ID:312508 21 The full list of countries having ratified the Labour Statistics Convention, 1985 (No. 160) is available at http://www.ilo.org/dyn/normlex/en/f?p=1000:11300:0::NO:11300:P11300_INSTRUMENT_ID:312305 22 The full text of the Convention concerning Statistics of Wages and Hours of Work, 1938 (No. 63) is available at http://www.ilo.org/dyn/normlex/en/f?p=NORMLEXPUB:12100:0::NO:12100:P12100_INSTRUMENT_ID:312208:NO and the list of countries having ratified it is available at http://www.ilo.org/dyn/normlex/en/f?p=1000:11300:0::NO:11300:P11300_INSTRUMENT_ID:312208
18
The Labour Statistics Recommendation (recommendation n°170) complements the
Labour Statistics Convention, by providing specifications on the advisable frequency of
data collection and dissemination, the desired data disaggregations and the appropriate
national statistical infrastructure needed.
5.3. Resolutions and Guidelines of the International Conference of
Labour Statisticians
The International Conference of Labour Statisticians is at the heart of the labour
statistics standard-setting process. It is a tripartite meeting (bringing together experts
from governments, mostly from national statistical offices, employers’ and workers’
organizations) has taken place roughly every five years since 1923. It is hosted by the ILO
and organized by the ILO Department of Statistics, which also leads all the preparatory
work needed before each session. The ICLS makes recommendations on selected topics
of labour statistics in the form of resolutions and guidelines, to be approved by the
Governing Body of the ILO before becoming part of the set of international standards on
labour statistics. The resolutions and guidelines put forward by the ICLS are non-binding
instruments seeking to promote international comparability of labour statistics as well
as methodological consistency across topics and sources.
In general, resolutions present conceptual frameworks, operational definitions, and
evaluation methods to produce and disseminate labour statistics while guidelines
provide detailed instructions on very specific items.
There have been resolutions on a vast number of labour market topics and dealing with
different sources23, but they tend to focus more on household surveys, and particularly
labour force surveys, as a source of data.
6. How to use and interpret labour statistics effectively?
A paramount point to keep in mind when working with labour statistics, is that
statistics are never a goal in themselves, but always a means to facilitate the achievement
of goals. That is to say, the collection and compilation of statistics is not done just for the
sake of producing statistics, but because the statistics are needed and will be used for
various purposes. Although the availability of labour statistics is of course a key issue,
and it represents a big challenge to overcome in many contexts, the true value of labour
statistics does not lie in their availability but in the use given to them and in the
interpretation made of them.
Nevertheless, in order to accurately interpret the labour statistics at hand and avoid
misleading conclusions, it is important to have comprehensive information on the
underlying methods applied, to be aware of the context to which the statistics pertain,
23 The list of resolutions adopted by the ICLSs and the full text of each one are available at http://www.ilo.org/global/statistics-and-databases/standards-and-guidelines/resolutions-adopted-by-international-conferences-of-labour-statisticians/lang--en/index.htm
19
and to fully understand the concepts, definitions and units used. The following sections
present some of the major aspects to take into consideration when interpreting labour
statistics.
6.1. Scope and meaning of labour statistics determined by their
source and methodology
The source and methodology used to derive labour statistics will determine what
the statistics actually refer to. More specifically, the coverage of the source (in terms of
which geographical areas, population, economic activities, establishments, etc. are
covered) will determine the scope of the labour statistics produced. Thus, it is crucial to
always analyse labour statistics taking into consideration their coverage, to avoid
erroneous interpretations.
Geographic and population coverage of the source
In conducting analysis using labour statistics, special attention should be paid to the
geographical coverage of the source used. Rural areas tend to have very different labour
market patterns than urban areas, so if the source covers only urban areas or only the
main cities, the statistics are unlikely to be representative of the country as a whole.
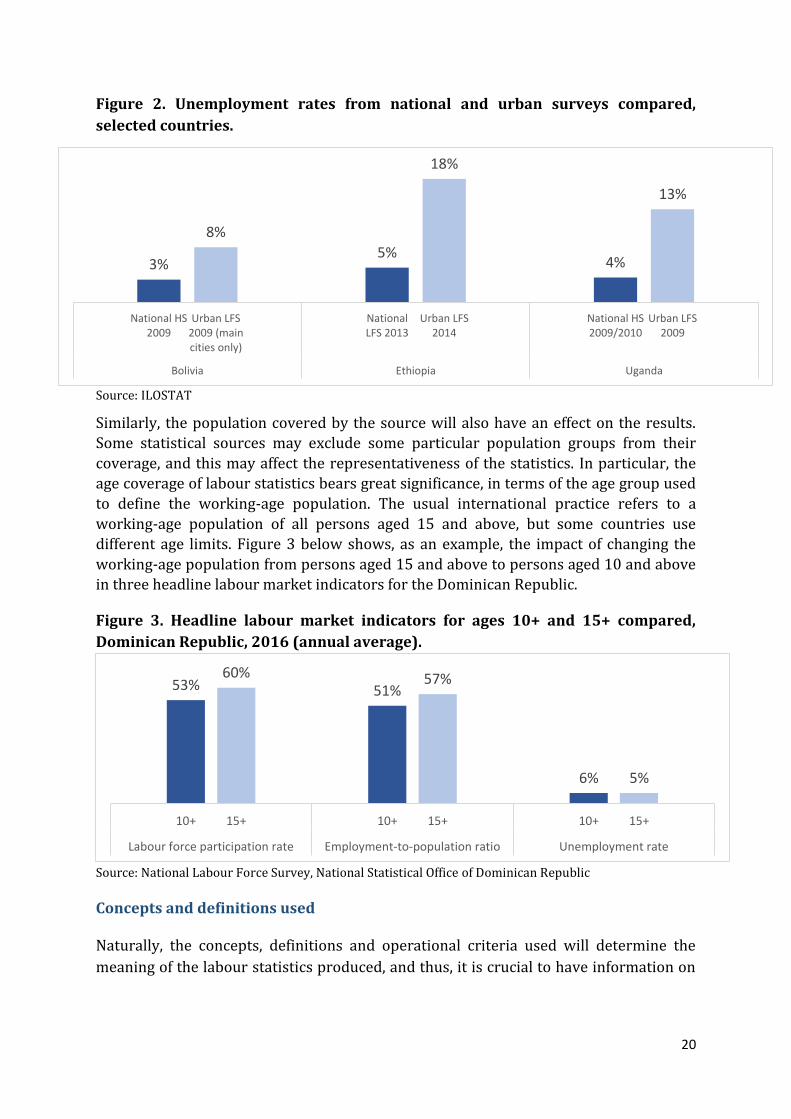
Figure 2 below presents an example of how the geographical coverage of the source
impacts the unemployment rates of selected countries. It is clear that in the three
countries included in the figure with data from both a national and an urban household
survey for the same year or for close years, unemployment rates are considerably higher
in urban areas than in rural areas, highlighting the need for clarity about the geographical
coverage of the statistics. Having this knowledge is also enlightening for identifying
specific labour market issues per area (for instance, it might be interesting for policy-
makers to know that while unemployment is an important issue in urban areas, rural
areas may be facing other challenges hidden behind low unemployment rates, such as
underemployment and informality).
20
Figure 2. Unemployment rates from national and urban surveys compared,
selected countries.
Source: ILOSTAT
Similarly, the population covered by the source will also have an effect on the results.
Some statistical sources may exclude some particular population groups from their
coverage, and this may affect the representativeness of the statistics. In particular, the
age coverage of labour statistics bears great significance, in terms of the age group used
to define the working-age population. The usual international practice refers to a
working-age population of all persons aged 15 and above, but some countries use
different age limits. Figure 3 below shows, as an example, the impact of changing the
working-age population from persons aged 15 and above to persons aged 10 and above
in three headline labour market indicators for the Dominican Republic.
Figure 3. Headline labour market indicators for ages 10+ and 15+ compared,
Dominican Republic, 2016 (annual average).
Source: National Labour Force Survey, National Statistical Office of Dominican Republic
Concepts and definitions used
Naturally, the concepts, definitions and operational criteria used will determine the
meaning of the labour statistics produced, and thus, it is crucial to have information on
3%
8%
5%
18%
4%
13%
National HS2009
Urban LFS2009 (maincities only)
NationalLFS 2013
Urban LFS2014
National HS2009/2010
Urban LFS2009
Bolivia Ethiopia Uganda
53%60%
51%57%
6% 5%
10+ 15+ 10+ 15+ 10+ 15+
Labour force participation rate Employment-to-population ratio Unemployment rate
21
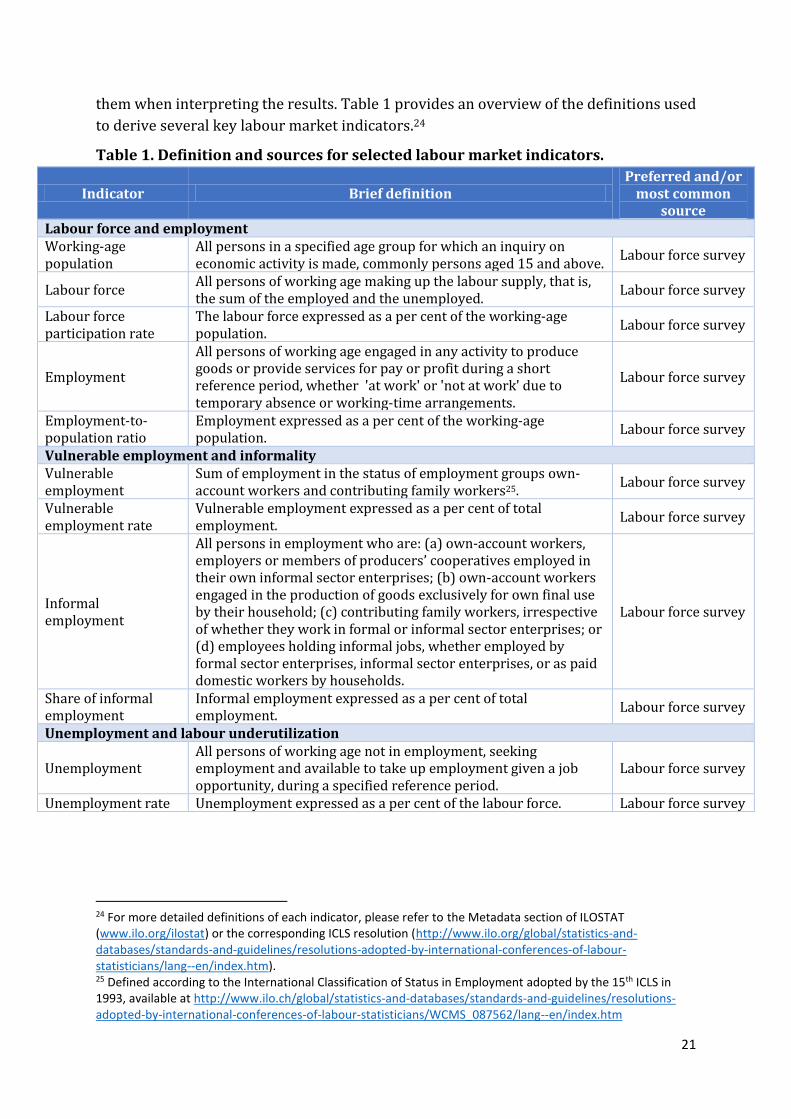
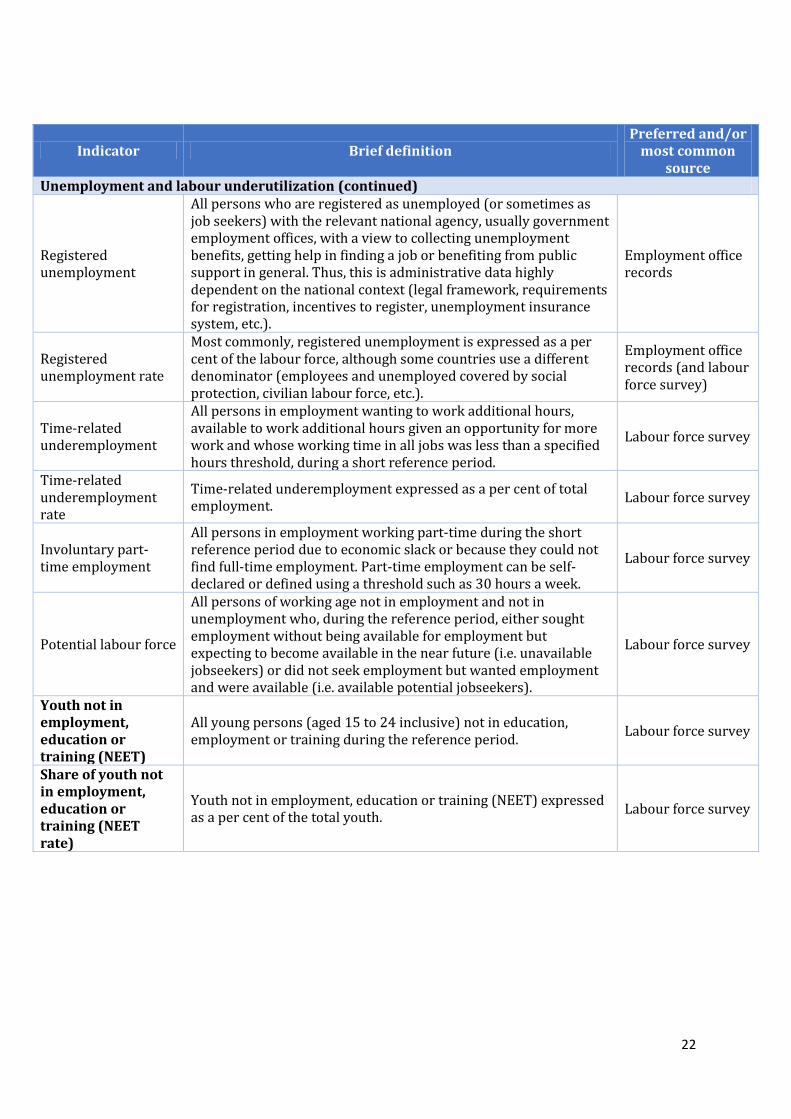
them when interpreting the results. Table 1 provides an overview of the definitions used
to derive several key labour market indicators.24
Table 1. Definition and sources for selected labour market indicators.
24 For more detailed definitions of each indicator, please refer to the Metadata section of ILOSTAT (www.ilo.org/ilostat) or the corresponding ICLS resolution (http://www.ilo.org/global/statistics-and-databases/standards-and-guidelines/resolutions-adopted-by-international-conferences-of-labour-statisticians/lang--en/index.htm). 25 Defined according to the International Classification of Status in Employment adopted by the 15th ICLS in 1993, available at http://www.ilo.ch/global/statistics-and-databases/standards-and-guidelines/resolutions-adopted-by-international-conferences-of-labour-statisticians/WCMS_087562/lang--en/index.htm
Indicator Brief definition Preferred and/or
most common source
Labour force and employment Working-age population
All persons in a specified age group for which an inquiry on economic activity is made, commonly persons aged 15 and above.
Labour force survey
Labour force All persons of working age making up the labour supply, that is, the sum of the employed and the unemployed.
Labour force survey
Labour force participation rate
The labour force expressed as a per cent of the working-age population.
Labour force survey
Employment
All persons of working age engaged in any activity to produce goods or provide services for pay or profit during a short reference period, whether 'at work' or 'not at work' due to temporary absence or working-time arrangements.
Labour force survey
Employment-to-population ratio
Employment expressed as a per cent of the working-age population.
Labour force survey
Vulnerable employment and informality Vulnerable employment
Sum of employment in the status of employment groups own- account workers and contributing family workers25.
Labour force survey
Vulnerable employment rate
Vulnerable employment expressed as a per cent of total employment.
Labour force survey
Informal employment
All persons in employment who are: (a) own-account workers, employers or members of producers’ cooperatives employed in their own informal sector enterprises; (b) own-account workers engaged in the production of goods exclusively for own final use by their household; (c) contributing family workers, irrespective of whether they work in formal or informal sector enterprises; or (d) employees holding informal jobs, whether employed by formal sector enterprises, informal sector enterprises, or as paid domestic workers by households.
Labour force survey
Share of informal employment
Informal employment expressed as a per cent of total employment.
Labour force survey
Unemployment and labour underutilization
Unemployment All persons of working age not in employment, seeking employment and available to take up employment given a job opportunity, during a specified reference period.
Labour force survey
Unemployment rate Unemployment expressed as a per cent of the labour force. Labour force survey
22
Indicator Brief definition Preferred and/or
most common source
Unemployment and labour underutilization (continued)
Registered unemployment
All persons who are registered as unemployed (or sometimes as job seekers) with the relevant national agency, usually government employment offices, with a view to collecting unemployment benefits, getting help in finding a job or benefiting from public support in general. Thus, this is administrative data highly dependent on the national context (legal framework, requirements for registration, incentives to register, unemployment insurance system, etc.).
Employment office records
Registered unemployment rate
Most commonly, registered unemployment is expressed as a per cent of the labour force, although some countries use a different denominator (employees and unemployed covered by social protection, civilian labour force, etc.).
Employment office records (and labour force survey)
Time-related underemployment
All persons in employment wanting to work additional hours, available to work additional hours given an opportunity for more work and whose working time in all jobs was less than a specified hours threshold, during a short reference period.
Labour force survey
Time-related underemployment rate
Time-related underemployment expressed as a per cent of total employment.
Labour force survey
Involuntary part-time employment
All persons in employment working part-time during the short reference period due to economic slack or because they could not find full-time employment. Part-time employment can be self-declared or defined using a threshold such as 30 hours a week.
Labour force survey
Potential labour force
All persons of working age not in employment and not in unemployment who, during the reference period, either sought employment without being available for employment but expecting to become available in the near future (i.e. unavailable jobseekers) or did not seek employment but wanted employment and were available (i.e. available potential jobseekers).
Labour force survey
Youth not in employment, education or training (NEET)
All young persons (aged 15 to 24 inclusive) not in education, employment or training during the reference period.
Labour force survey
Share of youth not in employment, education or training (NEET rate)
Youth not in employment, education or training (NEET) expressed as a per cent of the total youth.
Labour force survey
23
Indicator Brief definition Preferred and/or
most common source
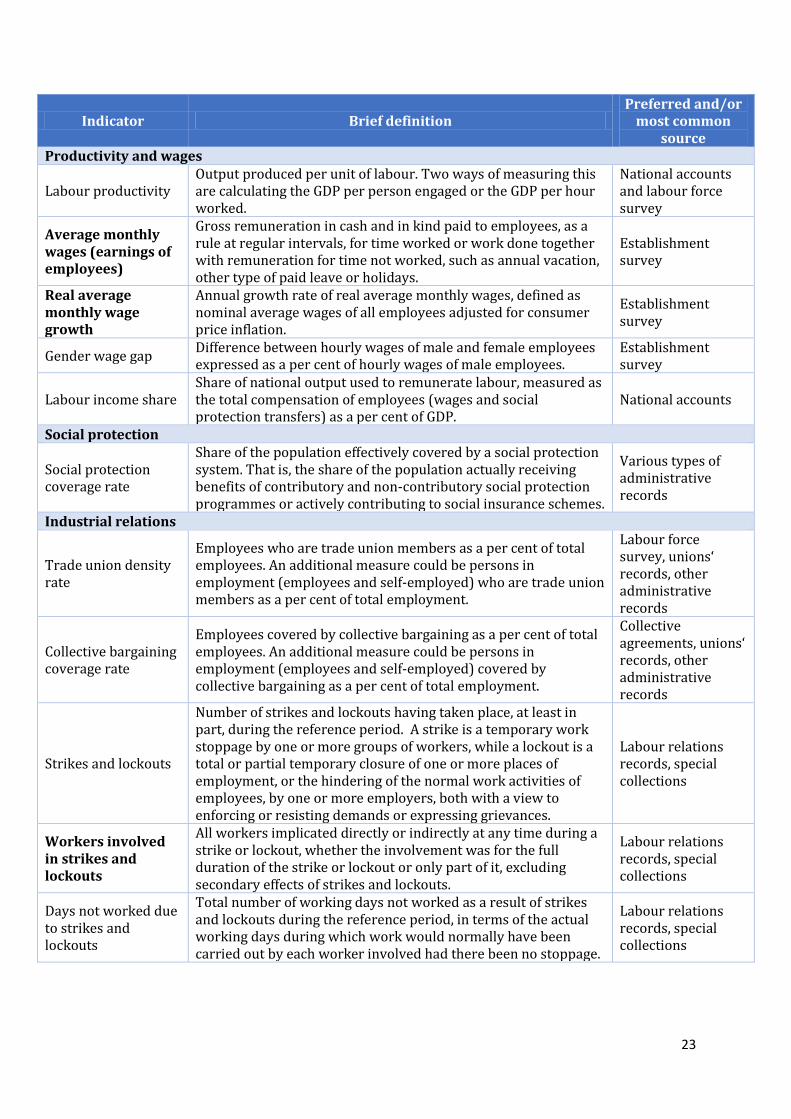
Productivity and wages
Labour productivity Output produced per unit of labour. Two ways of measuring this are calculating the GDP per person engaged or the GDP per hour worked.
National accounts and labour force survey
Average monthly wages (earnings of employees)
Gross remuneration in cash and in kind paid to employees, as a rule at regular intervals, for time worked or work done together with remuneration for time not worked, such as annual vacation, other type of paid leave or holidays.
Establishment survey
Real average monthly wage growth
Annual growth rate of real average monthly wages, defined as nominal average wages of all employees adjusted for consumer price inflation.
Establishment survey
Gender wage gap Difference between hourly wages of male and female employees expressed as a per cent of hourly wages of male employees.
Establishment survey
Labour income share Share of national output used to remunerate labour, measured as the total compensation of employees (wages and social protection transfers) as a per cent of GDP.
National accounts
Social protection
Social protection coverage rate
Share of the population effectively covered by a social protection system. That is, the share of the population actually receiving benefits of contributory and non-contributory social protection programmes or actively contributing to social insurance schemes.
Various types of administrative records
Industrial relations
Trade union density rate
Employees who are trade union members as a per cent of total employees. An additional measure could be persons in employment (employees and self-employed) who are trade union members as a per cent of total employment.
Labour force survey, unions‘ records, other administrative records
Collective bargaining coverage rate
Employees covered by collective bargaining as a per cent of total employees. An additional measure could be persons in employment (employees and self-employed) covered by collective bargaining as a per cent of total employment.
Collective agreements, unions‘ records, other administrative records
Strikes and lockouts
Number of strikes and lockouts having taken place, at least in part, during the reference period. A strike is a temporary work stoppage by one or more groups of workers, while a lockout is a total or partial temporary closure of one or more places of employment, or the hindering of the normal work activities of employees, by one or more employers, both with a view to enforcing or resisting demands or expressing grievances.
Labour relations records, special collections
Workers involved in strikes and lockouts
All workers implicated directly or indirectly at any time during a strike or lockout, whether the involvement was for the full duration of the strike or lockout or only part of it, excluding secondary effects of strikes and lockouts.
Labour relations records, special collections
Days not worked due to strikes and lockouts
Total number of working days not worked as a result of strikes and lockouts during the reference period, in terms of the actual working days during which work would normally have been carried out by each worker involved had there been no stoppage.
Labour relations records, special collections
24
With the definitions presented above in mind, there are a few common misconceptions
or sources of confusion. One example relates to the two very different (and non-
comparable) indicators: the unemployment rate and registered unemployment rate,
which are often quoted indistinctly. These two indicators refer to different concepts and
come from different sources, which means that they convey information on very different
things and are not strictly comparable or interchangeable, but rather complementary.
The unemployment rate conveys the share of persons in the labour force who are not in
employment but available and seeking. The registered unemployment rate conveys the
share of persons in the labour force who are registered at employment offices or other
Indicator Brief definition Preferred and/or
most common source
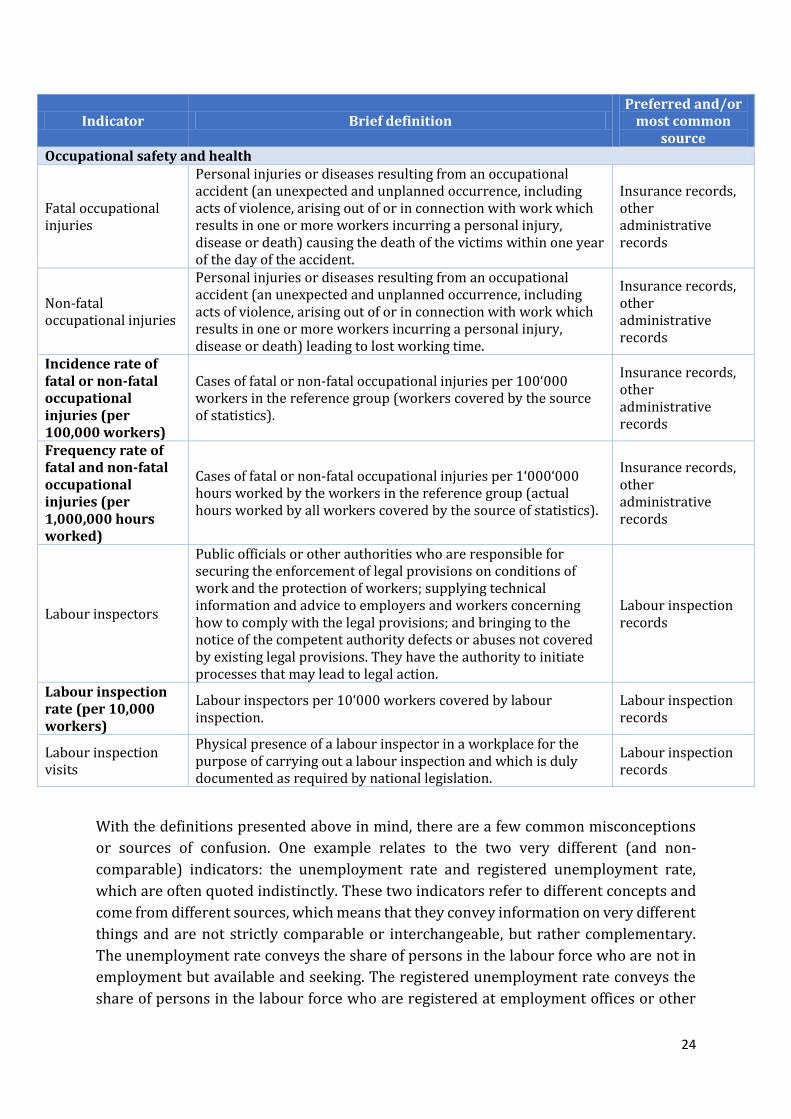
Occupational safety and health
Fatal occupational injuries
Personal injuries or diseases resulting from an occupational accident (an unexpected and unplanned occurrence, including acts of violence, arising out of or in connection with work which results in one or more workers incurring a personal injury, disease or death) causing the death of the victims within one year of the day of the accident.
Insurance records, other administrative records
Non-fatal occupational injuries
Personal injuries or diseases resulting from an occupational accident (an unexpected and unplanned occurrence, including acts of violence, arising out of or in connection with work which results in one or more workers incurring a personal injury, disease or death) leading to lost working time.
Insurance records, other administrative records
Incidence rate of fatal or non-fatal occupational injuries (per 100,000 workers)
Cases of fatal or non-fatal occupational injuries per 100‘000 workers in the reference group (workers covered by the source of statistics).
Insurance records, other administrative records
Frequency rate of fatal and non-fatal occupational injuries (per 1,000,000 hours worked)
Cases of fatal or non-fatal occupational injuries per 1‘000‘000 hours worked by the workers in the reference group (actual hours worked by all workers covered by the source of statistics).
Insurance records, other administrative records
Labour inspectors
Public officials or other authorities who are responsible for securing the enforcement of legal provisions on conditions of work and the protection of workers; supplying technical information and advice to employers and workers concerning how to comply with the legal provisions; and bringing to the notice of the competent authority defects or abuses not covered by existing legal provisions. They have the authority to initiate processes that may lead to legal action.
Labour inspection records
Labour inspection rate (per 10,000 workers)
Labour inspectors per 10‘000 workers covered by labour inspection.
Labour inspection records
Labour inspection visits
Physical presence of a labour inspector in a workplace for the purpose of carrying out a labour inspection and which is duly documented as required by national legislation.
Labour inspection records
25
competent authorities, which may imply that they are receiving unemployment benefits
or not (depending on the national context). The registered unemployment rate is
therefore, in principle, a more restrictive indicator in that it covers only the jobless who
are registered with the relevant authority (and perhaps receiving unemployment
benefits), excluding all other jobless persons. The unemployment rate, in contrast, covers
all jobless persons who are available and seeking employment, regardless of whether
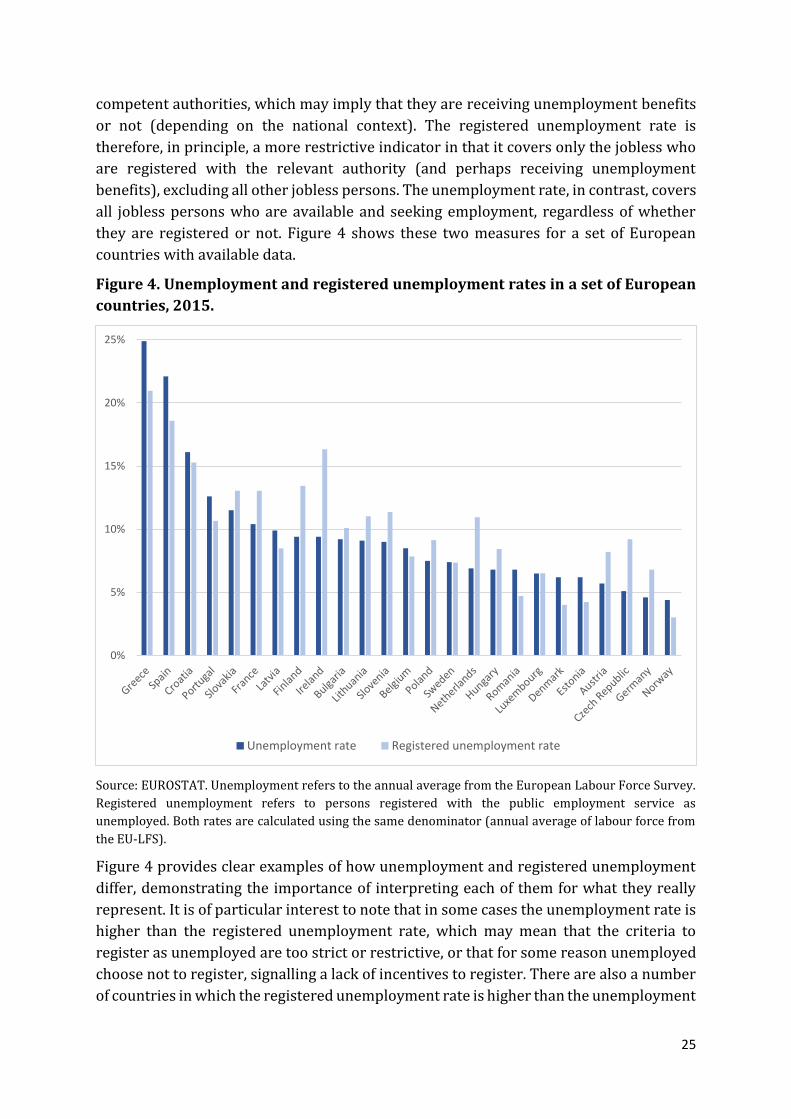
they are registered or not. Figure 4 shows these two measures for a set of European
countries with available data.
Figure 4. Unemployment and registered unemployment rates in a set of European
countries, 2015.
Source: EUROSTAT. Unemployment refers to the annual average from the European Labour Force Survey.
Registered unemployment refers to persons registered with the public employment service as
unemployed. Both rates are calculated using the same denominator (annual average of labour force from
the EU-LFS).
Figure 4 provides clear examples of how unemployment and registered unemployment
differ, demonstrating the importance of interpreting each of them for what they really
represent. It is of particular interest to note that in some cases the unemployment rate is
higher than the registered unemployment rate, which may mean that the criteria to
register as unemployed are too strict or restrictive, or that for some reason unemployed
choose not to register, signalling a lack of incentives to register. There are also a number
of countries in which the registered unemployment rate is higher than the unemployment
0%
5%
10%
15%
20%
25%
Unemployment rate Registered unemployment rate
26
rate, which may imply that persons registered as unemployed are not always actively
seeking employment or available for employment (or perhaps even not strictly jobless –
being jobless for the purposes of the unemployment definition usually corresponds to not
having worked for even one hour during the short reference period).
It may also sometimes be hard to understand the actual meaning of unemployment rates.
For instance, if the unemployment rate for any given population group is lower than that
of any other population group (for example, comparing male/female rates or youth/adult
rates), this means that the share of the labour force not employed but looking for job and
available is lower for one population group. Further information is needed to have a more
in-depth understanding of why: is this population group better off in the labour market
and are there more suitable jobs available for them, or on the contrary, are they so
vulnerable in the labour market that they have to resort to any type of employment or
leave the labour force altogether as soon as they become jobless?
Another example worth mentioning pertains to statistics on monthly earnings (or
monthly wages) by sex. These statistics provide valuable information on male and female
monthly earnings and on how they differ, but that is all. In order to explore the reasons
and extent of the differences, these statistics need to be supplemented with other
indicators. If average monthly earnings are lower for female employees than for male
employees, it does not necessarily imply that women are paid less than men for the same
work. This could certainly be happening, but there could be other issues happening as
well, such as differences in economic activities and/or occupations (is the difference as
significant when comparing male and female earnings for the same economic activity and
the same occupation? Are women less represented in the higher-paid economic activities
and/or occupations?), differences in status of employment (are women more
represented in the status in employment groups associated with vulnerable
employment?) and differences in working time (do women work less hours per month?
If so, is it voluntarily? Are time-related underemployment and/or involuntary part-time
rates higher for women?). The gender wage gap by economic activity and/or occupation
(based on hourly wages) is a great measure to cast light on gender earnings differences
not explained by differences in the economic activity and/or occupation and the working
time.
Comparability assessment for cross-country or time series studies
When doing cross-country analyses and/or analyses over time, it is crucial to ensure that
the statistics are strictly comparable across countries and that time series are robust. Any
major change in the statistical source used or in the methodology applied (including
changes in coverage) will cause a break in series and perhaps hinder international
comparability, and this needs to be accounted for when drawing analytical conclusions.
27
6.2. Leading indicators versus lagging indicators
Whether a given labour market indicator is a leading or lagging indicator must be
taken into account when interpreting the statistics, and especially when doing a trends
analysis. Leading indicators look forward, that is, they signal future events. They provide
information somewhat predicting future events or future trends. Conversely, lagging
indicators are backward-looking, in that they reflect what happened in the previous
period, they follow the event, or show the impact of the event with some delay.
Typically, leading indicators refer more to input measures (measures signalling the state
of the economy by referring to the use of the labour input and/or the capital input and
the resulting production activity, such as measures of manufacturing activity, consumer
confidence, or inventories) whereas lagging indicators refer more to output (measures
reflecting changes in the economy that have already taken place by referring to items
which adjust to the new economic situation, such as revenue, wages and prices). Leading
indicators are easier to influence since they are at the foundation of trends or events, but
they are harder to measure. It is much harder to exert an effect on lagging indicators,
though they are easier to measure, since they confirm an already-occurring pattern.
Lagging indicators refer to results and consequences, whereas leading indicators refer to
the origin of economic trends, their roots and causes.
Both types of indicators provide valuable information, particularly on the labour market,
and should ideally be studied together. When interpreting labour market statistics, it is
crucial to understand before drawing any conclusions whether the indicators analysed
are leading or lagging, so as to accurately grasp the implications on other indicators and
on labour market performance in general.
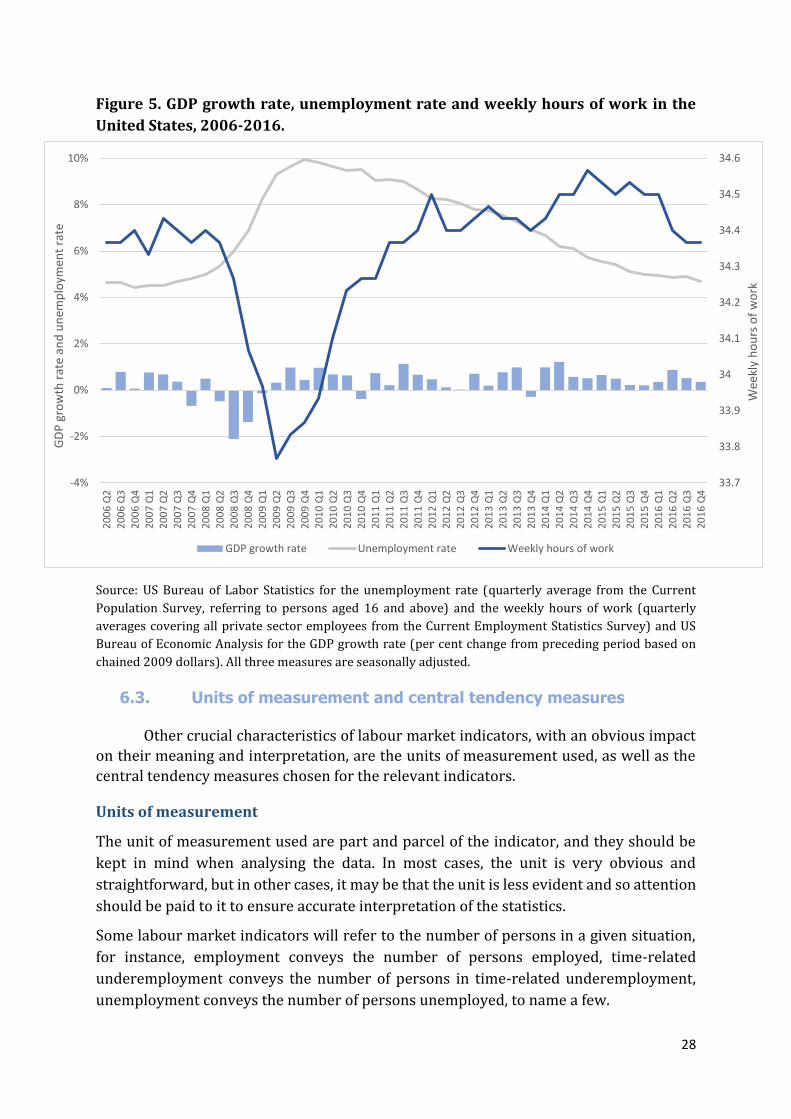
In the field of labour market statistics, leading indicators are harder to find than lagging
indicators, since the labour market generally reacts to what happens in the economy. An
example of a leading labour market indicator are the hours actually worked, given that
employers may react to their predictions of growing or decreasing business by adjusting
the employees’ working time immediately. The unemployment rate is a very well-known
example of a lagging indicator, in that it reflects that the economy did not perform well in
the past and thus, there is increased labour market slack as there is a lack of suitable jobs
for job seekers. Figure 5 below shows an example of how these indicators signal or react
to events: in the United States, the drop in GDP growth observed from 2007 manifests the
start of the economic crisis, which caused the unemployment rate to subsequently rise,
and weekly hours of work to adjust as the economic hardship spread and intensified.
28
Figure 5. GDP growth rate, unemployment rate and weekly hours of work in the
United States, 2006-2016.
Source: US Bureau of Labor Statistics for the unemployment rate (quarterly average from the Current
Population Survey, referring to persons aged 16 and above) and the weekly hours of work (quarterly
averages covering all private sector employees from the Current Employment Statistics Survey) and US
Bureau of Economic Analysis for the GDP growth rate (per cent change from preceding period based on
chained 2009 dollars). All three measures are seasonally adjusted.
6.3. Units of measurement and central tendency measures
Other crucial characteristics of labour market indicators, with an obvious impact
on their meaning and interpretation, are the units of measurement used, as well as the
central tendency measures chosen for the relevant indicators.
Units of measurement
The unit of measurement used are part and parcel of the indicator, and they should be
kept in mind when analysing the data. In most cases, the unit is very obvious and
straightforward, but in other cases, it may be that the unit is less evident and so attention
should be paid to it to ensure accurate interpretation of the statistics.
Some labour market indicators will refer to the number of persons in a given situation,
for instance, employment conveys the number of persons employed, time-related
underemployment conveys the number of persons in time-related underemployment,
unemployment conveys the number of persons unemployed, to name a few.
33.7
33.8
33.9
34
34.1
34.2
34.3
34.4
34.5
34.6
-4%
-2%
0%
2%
4%
6%
8%
10%
20
06
Q2
20
06
Q3
20
06
Q4
20
07
Q1
20
07
Q2
20
07
Q3
20
07
Q4
20
08
Q1
20
08
Q2
20
08
Q3
20
08
Q4
20
09
Q1
20
09
Q2
20
09
Q3
20
09
Q4
20
10
Q1
20
10
Q2
20
10
Q3
20
10
Q4
20
11
Q1
20
11
Q2
20
11
Q3
20
11
Q4
20
12
Q1
20
12
Q2
20
12
Q3
20
12
Q4
20
13
Q1
20
13
Q2
20
13
Q3
20
13
Q4
20
14
Q1
20
14
Q2
20
14
Q3
20
14
Q4
20
15
Q1
20
15
Q2
20
15
Q3
20
15
Q4
20
16
Q1
20
16
Q2
20
16
Q3
20
16
Q4
Wee
kly
ho
urs
of
wo
rk
GD
P g
row
th r
ate
and
un
emp
loym
ent
rate
GDP growth rate Unemployment rate Weekly hours of work
29
Indicators may also relate to items, events or cases, instead of persons. For instance,
statistics on strikes and lockouts refer to the number of work stoppages that occurred,
and statistics on inspection visits refer to the number of times a labour inspector went to
a workplace to conduct an inspection.
It is however difficult to comprehend the trends and significance of large numbers
referring to thousands or millions of persons (or items, cases, etc.) so the units of many
headline labour market indicators are percentages, rates or ratios, which are typically
easier to grasp than absolute numbers. This is the case, perhaps most notably, of the
labour force participation rate, the employment-to-population ratio and the
unemployment rate.
Implications of the data source
The source of data used determines to a great extent the measurement unit of labour
market indicators.
For instance, when it comes to statistics of occupational injuries, insurance records will
most likely provide data on the number of cases of occupational injuries compensated.
That is, the statistics would refer to the number of injuries incurred, and not necessarily
the number of injuries incurred by different people (one worker victim of more than one
occupational injury during the reference period would be counted as many times as the
number of injuries he or she suffered from). However, statistics on occupational injuries
could also potentially be derived from household surveys (where the survey
questionnaire covers this topic) and in this case, they would most likely refer to the
number of persons who incurred one or more occupational injuries during the reference
period (perhaps with information on how many injuries each worker suffered).
Similarly, data on employees from a household survey refers to the number of persons
who are employees, whereas establishment survey data refers to the jobs, not the
persons.
Central tendency measures (mean, median, mode)
For some specific indicators, it is necessary to choose the most appropriate central
tendency measure. That is, a summary measure that would represent the typical value of
a set of numerous different observations, by conveying the centre of the distribution of
that series of single values. The main central tendency measures are the mean, the median
and the mode.
The mean (or more accurately, the arithmetic mean, also known as the average)
corresponds to the sum of all the values in the corresponding dataset divided by the
number of values (or observations) in the dataset. The mean is very susceptible to
outliers, that is to say, unusually low or high observations in the dataset will have a strong
impact on the mean, since in the calculation of the mean each observation has a weight
as strong as its value.
30
The median is determined by sorting all the observations in the dataset in ascending
order: it refers to the value of the observation occupying the middle spot in the sorted
series. In other words, the median corresponds to the value which divides the dataset
into two groups containing the same number of observations (half of the observations
are above the median and half of the observations are below the median). The median is
much less vulnerable to the effect of outliers, since in the calculation of the median every
observation has exactly the same weight, regardless of their value.
Instead of dividing the dataset in ascending order into two halves to obtain the median,
we could also divide it into four fourths to obtain quartiles (the first quartile is the value
below which 25 per cent of observations and above which 75 per cent of observations
are found, the second quartile corresponds to the median, that is, the value below and
above which 50 per cent of observations are found, and the third quartile is the value
below which 75 per cent of observations and above which 25 per cent of observations
are found) or into ten tenths to obtain deciles.
The mode represents the most frequent value appearing in the data series. It is not
necessarily a unique number, since it is possible to have more than one mode for a given
dataset (more than one value share the first place in terms of highest frequency of
observations). The mode, just as the median, is not really affected by outliers.
Regarding labour statistics, the main indicators that call for the use of a central tendency
measure are the indicators pertaining to hours of work and earnings. In these cases, it is
crucial to bear in mind the central tendency measure being used, since it will have a great
impact on the figures and their meaning. In particular, when doing trends or cross-
country studies, it is paramount to ensure that the same central tendency measure is used
throughout the dataset, or else the comparability of the data will be severely hindered,
possibly leading to erroneous conclusions.
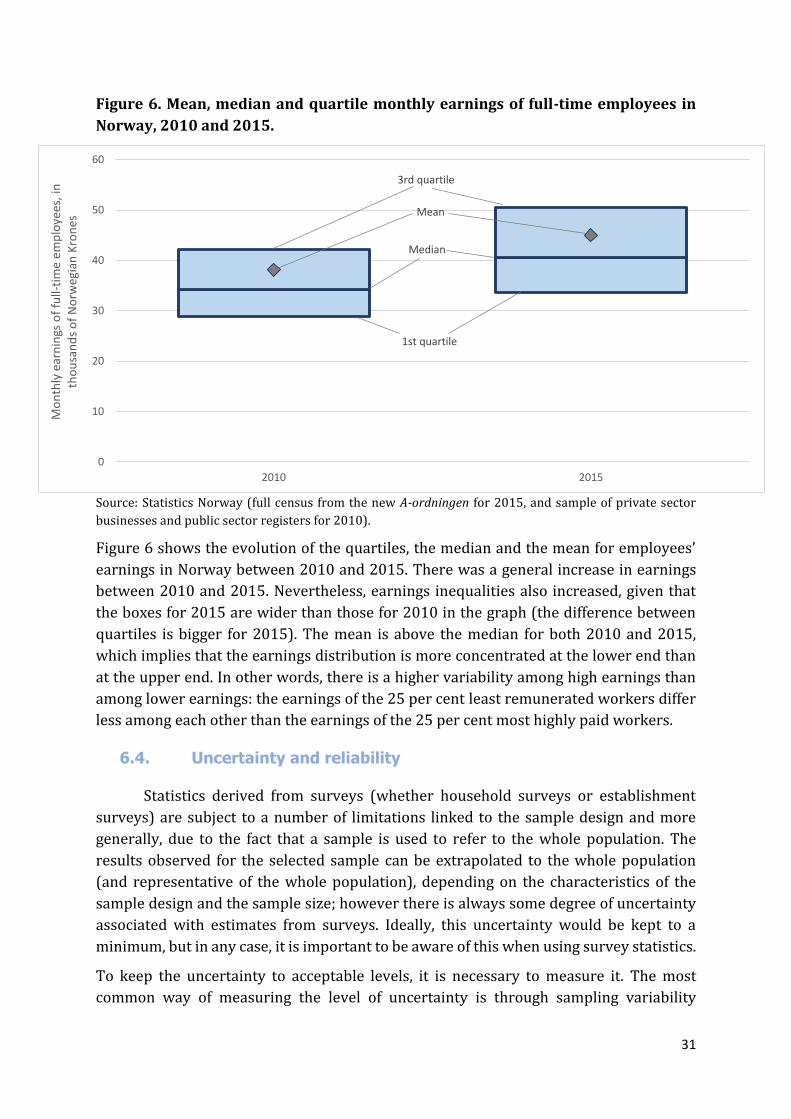
31
Figure 6. Mean, median and quartile monthly earnings of full-time employees in
Norway, 2010 and 2015.
Source: Statistics Norway (full census from the new A-ordningen for 2015, and sample of private sector
businesses and public sector registers for 2010).
Figure 6 shows the evolution of the quartiles, the median and the mean for employees’
earnings in Norway between 2010 and 2015. There was a general increase in earnings
between 2010 and 2015. Nevertheless, earnings inequalities also increased, given that
the boxes for 2015 are wider than those for 2010 in the graph (the difference between
quartiles is bigger for 2015). The mean is above the median for both 2010 and 2015,
which implies that the earnings distribution is more concentrated at the lower end than
at the upper end. In other words, there is a higher variability among high earnings than
among lower earnings: the earnings of the 25 per cent least remunerated workers differ
less among each other than the earnings of the 25 per cent most highly paid workers.
6.4. Uncertainty and reliability
Statistics derived from surveys (whether household surveys or establishment
surveys) are subject to a number of limitations linked to the sample design and more
generally, due to the fact that a sample is used to refer to the whole population. The
results observed for the selected sample can be extrapolated to the whole population
(and representative of the whole population), depending on the characteristics of the
sample design and the sample size; however there is always some degree of uncertainty
associated with estimates from surveys. Ideally, this uncertainty would be kept to a
minimum, but in any case, it is important to be aware of this when using survey statistics.
To keep the uncertainty to acceptable levels, it is necessary to measure it. The most
common way of measuring the level of uncertainty is through sampling variability
1st quartile
Median
3rd quartile
Mean
0
10
20
30
40
50
60
2010 2015
Mo
nth
ly e
arn
ings
of
full-
tim
e em
plo
yees
, in
th
ou
san
ds
of
No
rweg
ian
Kro
nes
32
(variation) and it involves defining a range around each survey estimate (the confidence
interval) within which the real value behind that estimate is likely to be found, with a
quantifiable degree of certainty. This degree of certainty for the confidence interval is
determined based on personal preferences (or institutional rules) by the individuals
manipulating the data. Typically, confidence intervals are calculated to be 95% confident
that the true value lies within that range. Confidence intervals of survey estimates allow
the data user to understand how certain the statistics are, and they are usually
disseminated along with the survey results or in the accompanying methodological
documents. In general, national statistical offices and official agencies in charge of
producing and disseminating statistics only release survey estimates with an acceptable
degree of uncertainty.
Another issue pertaining to the quality of statistics derived from surveys is the fact that
the information comes from the respondents to the survey questionnaire. Thus, the
reliability of the results is determined by the accuracy of the responses to the
questionnaire, and how well respondents understood each question. When questions are
misunderstood or respondents do not know the answer to some questions but respond
nonetheless, this results in random errors. Naturally, the less random error in responses,
the more reliable the question and the resulting estimates. Reliability tends to be low for
questions about topics that people do not usually have much knowledge about, or
sensitive topics. The sample size plays an important role in reliability, since the higher
the number of respondents to each question the higher the chance that more respondents
would have replied accurately (as opposed to randomly). This is another key point to pay
attention to when using survey statistics: to what extent are the survey estimates
reliable? However, here too, data users can usually trust the official statistical agencies to
only disseminate estimates with a satisfactory degree of reliability, or at least to carefully
state it when some estimates are deemed unreliable.
6.5. Seasonal adjustments
When it comes to studying short-term trends (based on monthly or quarterly
statistics) it is crucial to note that the labour market (like the economy) is probably
affected by seasonal factors. That is, periodic patterns, shifts in indicators that take place
around the same time every year (for example, people finishing school and newly
entering the labour market at the end of the school year, agricultural activities following
the weather cycle, increased touristic activities in the holidays season, etc.).
In order to account for shifts in the labour market beyond seasonal patterns, that is, to
assess the variations not due to seasonal factors, one possibility is to compare data
referring to the same reference period every year. However, this only allows for the study
of year-to-year changes, and not short-term patterns.
To assess short-term variations excluding the effects of seasonal factors, data can be
seasonally adjusted to remove the seasonal components. There are different possible
methodologies of seasonal adjustment, and the robustness of the seasonally-adjusted
33
estimates will depend on the adjustment method used. Many statistical offices in charge
of disseminating short-term labour statistics will release seasonally-adjusted series as
well as the corresponding unadjusted ones. It is recommended to refer to seasonally-
adjusted statistics for analysis of labour market trends within the year not explained by
changes in seasons.
This does not mean that non-seasonally adjusted short-term statistics are never useful.
In fact, in some cases it may be interesting to study precisely the seasonal trends to learn
more about the seasonal labour market patterns and inform labour market actors and
policy-makers on this. What is crucial is to always know whether the series at hand are
seasonally-adjusted or not, and to interpret them keeping this in mind.
Figure 7 below shows, as an example, how the seasonal adjustment of the series affects
three headline labour market indicators (the labour force participation rate, the
employment-to-population ratio and the unemployment rate) in Canada. This figure
makes it very visible that the seasonal adjustment has a smoothing effect on the series.
The non-seasonally adjusted series are much more volatile, due to the impact of the
seasonal factors.
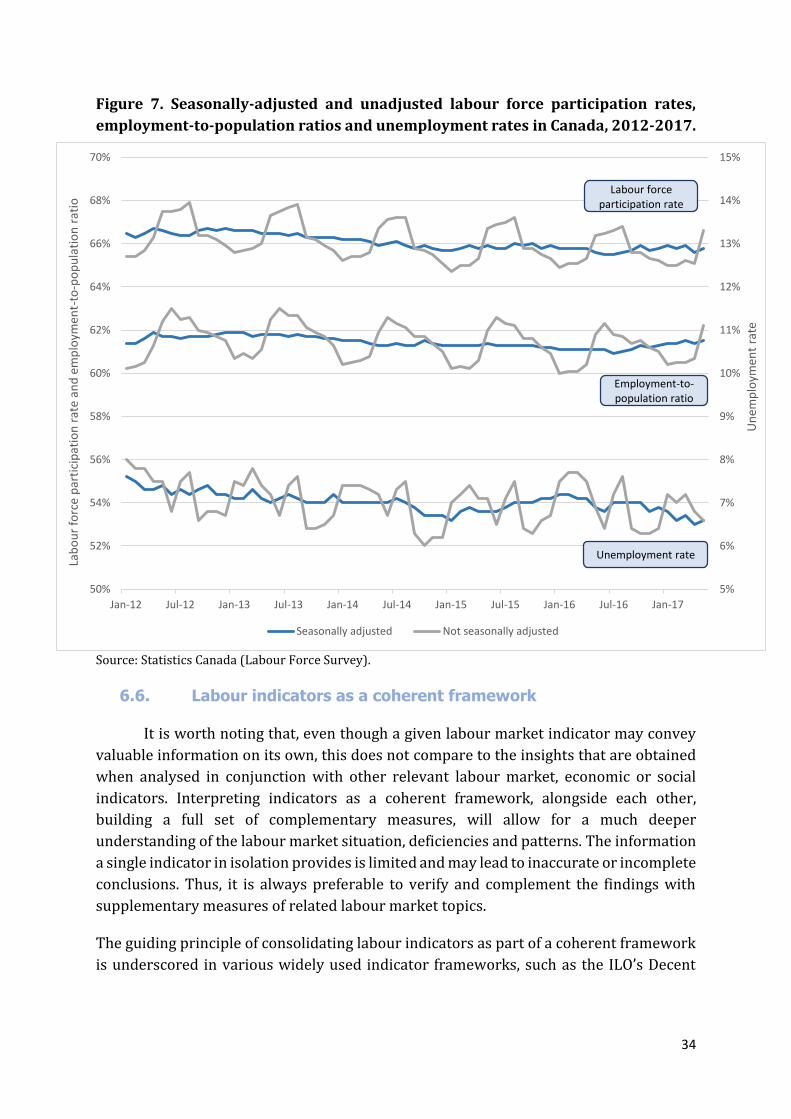
34
Figure 7. Seasonally-adjusted and unadjusted labour force participation rates,
employment-to-population ratios and unemployment rates in Canada, 2012-2017.
Source: Statistics Canada (Labour Force Survey).
6.6. Labour indicators as a coherent framework
It is worth noting that, even though a given labour market indicator may convey
valuable information on its own, this does not compare to the insights that are obtained
when analysed in conjunction with other relevant labour market, economic or social
indicators. Interpreting indicators as a coherent framework, alongside each other,
building a full set of complementary measures, will allow for a much deeper
understanding of the labour market situation, deficiencies and patterns. The information
a single indicator in isolation provides is limited and may lead to inaccurate or incomplete
conclusions. Thus, it is always preferable to verify and complement the findings with
supplementary measures of related labour market topics.
The guiding principle of consolidating labour indicators as part of a coherent framework
is underscored in various widely used indicator frameworks, such as the ILO’s Decent
5%
6%
7%
8%
9%
10%
11%
12%
13%
14%
15%
50%
52%
54%
56%
58%
60%
62%
64%
66%
68%
70%
Jan-12 Jul-12 Jan-13 Jul-13 Jan-14 Jul-14 Jan-15 Jul-15 Jan-16 Jul-16 Jan-17
Un
emp
loym
ent
rate
Lab
ou
r fo
rce
par
tici
pat
ion
rat
e an
d e
mp
loym
ent-
to-p
op
ula
tio
n r
atio
Seasonally adjusted Not seasonally adjusted
Unemployment rate
Employment-to-population ratio
Labour forceparticipation rate
35
Work Indicators26 (mentioned in section 2.5), the United Nations Economic Commission
for Europe’s Quality of Employment Statistical Framework27 and the United Nations
Statistics Division’s Minimum Set of Gender Indicators.28
As an example of the importance of complementary measures, we can refer again to the
statistics on employees’ earnings disaggregated by sex mentioned in section 6.1. Viewed
in isolation, any differences in male and female earnings may be hard to interpret and
misleading even: one could (perhaps incorrectly) assume that the difference is solely due
to earnings inequalities for the same amount and type of work. However, complementary
measures on actual hours of work by sex, usual hours of work by sex, the employment
distribution by sex and occupation (and/or economic activity), time-related
underemployment rates by sex, involuntary part time employment by sex, and the gender
pay gap (based on hourly earnings) will provide a more accurate and comprehensive
picture of gender segregation and gender-based inequities in the labour market, allowing
to gauge the extent to which earnings differences are due to differences in working time,
skill levels, hourly earnings, and so on.
Similarly, and to further illustrate this point, data on the share of youth not in
employment, education or training (also known as the NEET rate) casts light on the
proportion of the youth population who are not in the educational system while also
being unemployed or outside the labour force, which is insightful. Nonetheless, to apprise
of the situation of youth in the labour market with a holistic approach, the analysis of
NEET rates should be coupled with other labour market indicators pertaining to youth,
such as the youth unemployment rate, the youth labour force participation rate, and
indicators on the characteristics of youth employment (distribution of youth employment
by status in employment, economic activity and occupation, youth working time, youth
earnings, youth time-related underemployment rate, youth informality rate, etc.).
In many cases, depending on the subject of analysis, it may be preferable or necessary to
complement the labour market measures with economic, social or demographic
indicators. For instance, when studying the evolution of wages, it can be informative to
supplement wage growth figures with economic statistics on GDP growth, the labour
income share and labour productivity growth, with a view to understanding to what
extent workers have benefitted from economic growth and gains in productivity.
Also, when trying to make labour market projections to predict future trends of
employment and the labour force, it is crucial to take into consideration socio-
demographic aspects conveyed by indicators such as life expectancy and the fertility rate.
Likewise, in studying the educational patterns of the labour force and the skill level of
persons employed, it is important to put the findings into context by analysing also
26 For further information refer to the ILO manual Decent Work Indicators - Guidelines for producers and users of statistical and legal framework indicators, available at http://www.ilo.org/stat/Publications/WCMS_223121/lang--en/index.htm 27 For further information refer to the UNECE’s Handbook on Measuring Quality of Employment, available at https://www.unece.org/stats/publications/stat_qua_emp.html 28 For further information refer to https://genderstats.un.org/#/home
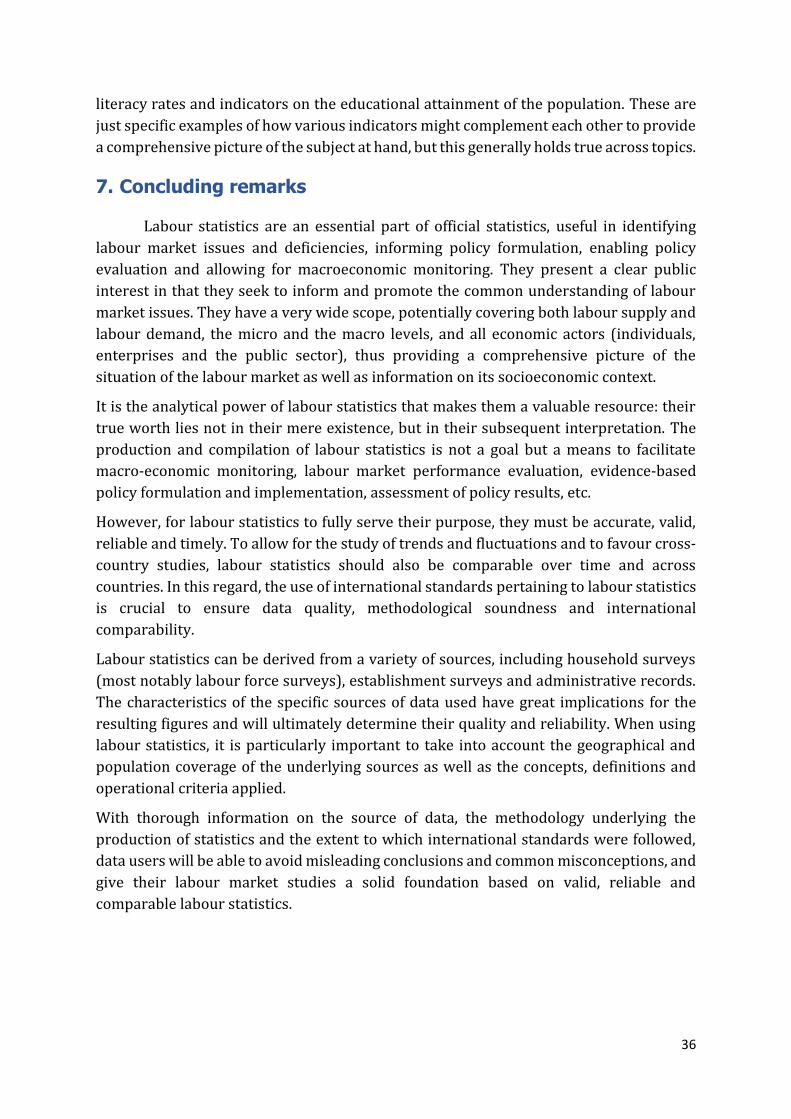
36
literacy rates and indicators on the educational attainment of the population. These are
just specific examples of how various indicators might complement each other to provide
a comprehensive picture of the subject at hand, but this generally holds true across topics.
7. Concluding remarks
Labour statistics are an essential part of official statistics, useful in identifying
labour market issues and deficiencies, informing policy formulation, enabling policy
evaluation and allowing for macroeconomic monitoring. They present a clear public
interest in that they seek to inform and promote the common understanding of labour
market issues. They have a very wide scope, potentially covering both labour supply and
labour demand, the micro and the macro levels, and all economic actors (individuals,
enterprises and the public sector), thus providing a comprehensive picture of the
situation of the labour market as well as information on its socioeconomic context.
It is the analytical power of labour statistics that makes them a valuable resource: their
true worth lies not in their mere existence, but in their subsequent interpretation. The
production and compilation of labour statistics is not a goal but a means to facilitate
macro-economic monitoring, labour market performance evaluation, evidence-based
policy formulation and implementation, assessment of policy results, etc.
However, for labour statistics to fully serve their purpose, they must be accurate, valid,
reliable and timely. To allow for the study of trends and fluctuations and to favour cross-
country studies, labour statistics should also be comparable over time and across
countries. In this regard, the use of international standards pertaining to labour statistics
is crucial to ensure data quality, methodological soundness and international
comparability.
Labour statistics can be derived from a variety of sources, including household surveys
(most notably labour force surveys), establishment surveys and administrative records.
The characteristics of the specific sources of data used have great implications for the
resulting figures and will ultimately determine their quality and reliability. When using
labour statistics, it is particularly important to take into account the geographical and
population coverage of the underlying sources as well as the concepts, definitions and
operational criteria applied.
With thorough information on the source of data, the methodology underlying the
production of statistics and the extent to which international standards were followed,
data users will be able to avoid misleading conclusions and common misconceptions, and
give their labour market studies a solid foundation based on valid, reliable and
comparable labour statistics.
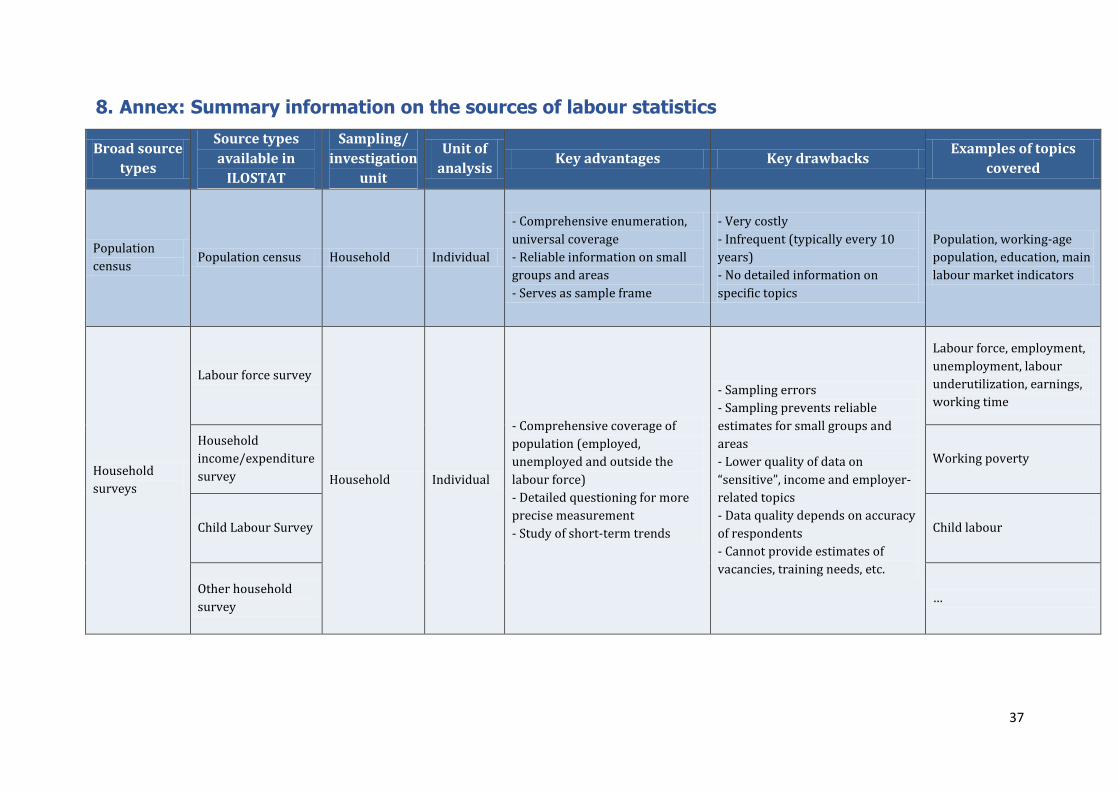
37
8. Annex: Summary information on the sources of labour statistics
Broad source
types
Source types
available in
ILOSTAT
Sampling/
investigation
unit
Unit of
analysis Key advantages Key drawbacks
Examples of topics
covered
Population
census Population census Household Individual
- Comprehensive enumeration,
universal coverage
- Reliable information on small
groups and areas
- Serves as sample frame
- Very costly
- Infrequent (typically every 10
years)
- No detailed information on
specific topics
Population, working-age
population, education, main
labour market indicators
Household
surveys
Labour force survey
Household Individual
- Comprehensive coverage of
population (employed,
unemployed and outside the
labour force)
- Detailed questioning for more
precise measurement
- Study of short-term trends
- Sampling errors
- Sampling prevents reliable
estimates for small groups and
areas
- Lower quality of data on
“sensitive”, income and employer-
related topics
- Data quality depends on accuracy
of respondents
- Cannot provide estimates of
vacancies, training needs, etc.
Labour force, employment,
unemployment, labour
underutilization, earnings,
working time
Household
income/expenditure
survey
Working poverty
Child Labour Survey Child labour
Other household
survey …
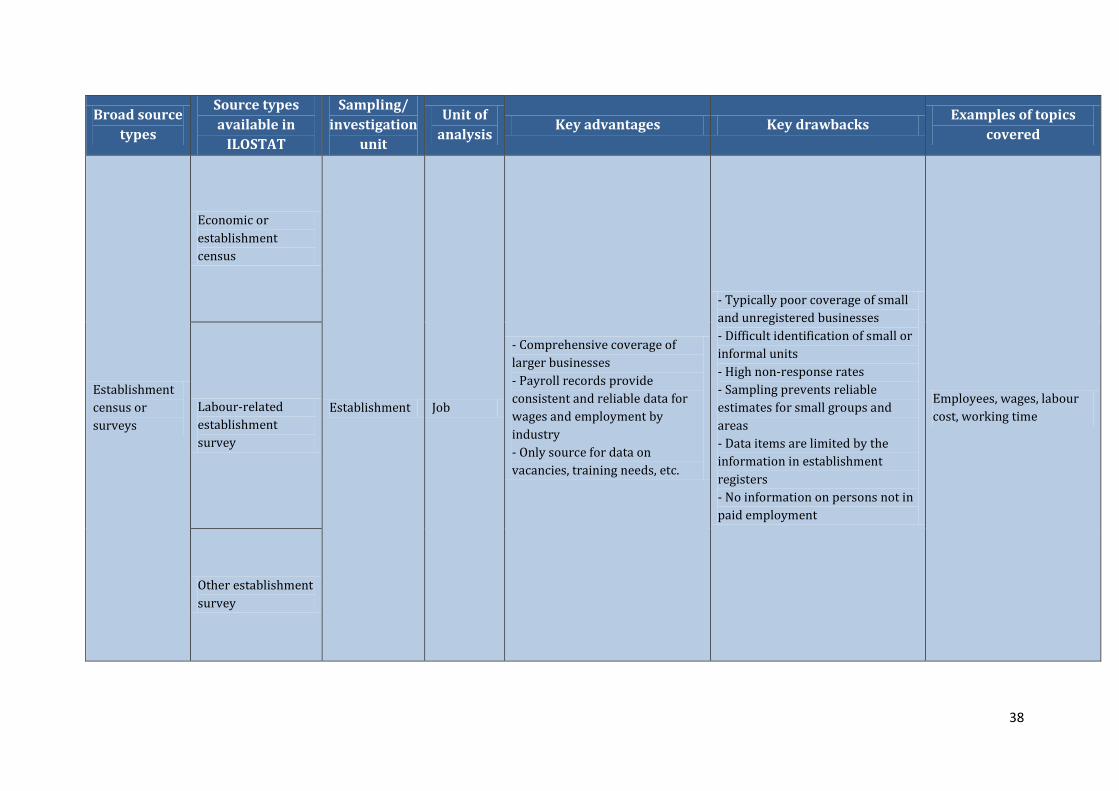
38
Broad source
types
Source types
available in
ILOSTAT
Sampling/
investigation
unit
Unit of
analysis Key advantages Key drawbacks
Examples of topics
covered
Establishment
census or
surveys
Economic or
establishment
census
Establishment Job
- Comprehensive coverage of
larger businesses
- Payroll records provide
consistent and reliable data for
wages and employment by
industry
- Only source for data on
vacancies, training needs, etc.
- Typically poor coverage of small
and unregistered businesses
- Difficult identification of small or
informal units
- High non-response rates
- Sampling prevents reliable
estimates for small groups and
areas
- Data items are limited by the
information in establishment
registers
- No information on persons not in
paid employment
Employees, wages, labour
cost, working time Labour-related
establishment
survey
Other establishment
survey
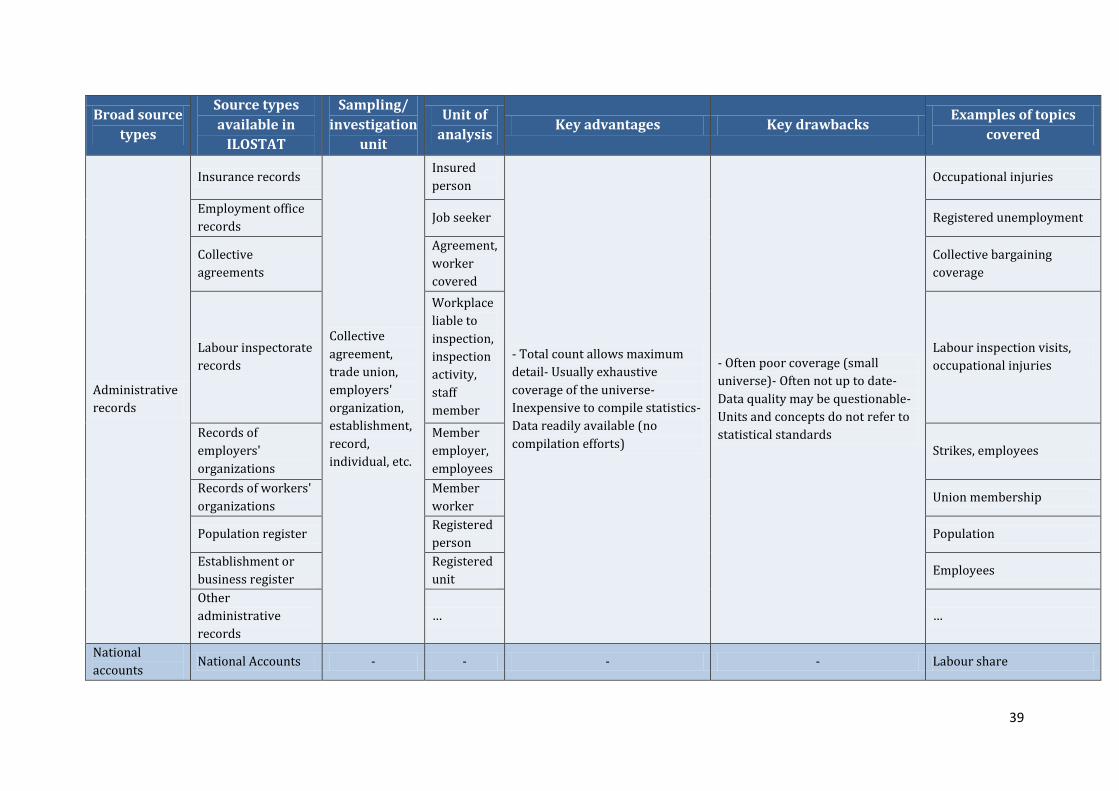
39
Broad source
types
Source types
available in
ILOSTAT
Sampling/
investigation
unit
Unit of
analysis Key advantages Key drawbacks
Examples of topics
covered
Administrative
records
Insurance records
Collective
agreement,
trade union,
employers'
organization,
establishment,
record,
individual, etc.
Insured
person
- Total count allows maximum
detail- Usually exhaustive
coverage of the universe-
Inexpensive to compile statistics-
Data readily available (no
compilation efforts)
- Often poor coverage (small
universe)- Often not up to date-
Data quality may be questionable-
Units and concepts do not refer to
statistical standards
Occupational injuries
Employment office
records Job seeker Registered unemployment
Collective
agreements
Agreement,
worker
covered
Collective bargaining
coverage
Labour inspectorate
records
Workplace
liable to
inspection,
inspection
activity,
staff
member
Labour inspection visits,
occupational injuries
Records of
employers'
organizations
Member
employer,
employees
Strikes, employees
Records of workers'
organizations
Member
worker Union membership
Population register Registered
person Population
Establishment or
business register
Registered
unit Employees
Other
administrative
records
… …
National
accounts National Accounts - - - - Labour share