Embed Size (px)
Citation preview

Questioni di Economia e Finanza(Occasional Papers)
Wages and prices in Italy during the crisis: the firms’ perspective
by Francesco D’Amuri, Silvia Fabiani, Roberto Sabbatini, Raffaele Tartaglia Polcini, Fabrizio Venditti, Eliana Viviano and Roberta Zizza
Num
ber 289S
epte
mb
er 2
015


Questioni di Economia e Finanza(Occasional papers)
Number 289 – September 2015
Wages and prices in Italy during the crisis: the firms’ perspective
by Francesco D’Amuri, Silvia Fabiani, Roberto Sabbatini, Raffaele Tartaglia Polcini, Fabrizio Venditti, Eliana Viviano and Roberta Zizza
The series Occasional Papers presents studies and documents on issues pertaining to
the institutional tasks of the Bank of Italy and the Eurosystem. The Occasional Papers appear
alongside the Working Papers series which are specifically aimed at providing original contributions
to economic research.
The Occasional Papers include studies conducted within the Bank of Italy, sometimes
in cooperation with the Eurosystem or other institutions. The views expressed in the studies are those of
the authors and do not involve the responsibility of the institutions to which they belong.
The series is available online at www.bancaditalia.it .
ISSN 1972-6627 (print)ISSN 1972-6643 (online)
Printed by the Printing and Publishing Division of the Bank of Italy
WAGES AND PRICES IN ITALY DURING THE CRISIS: THE FIRMS’ PERSPECTIVE
by Francesco D’Amuri, Silvia Fabiani, Roberto Sabbatini, Raffaele Tartaglia Polcini,
Fabrizio Venditti, Eliana Viviano and Roberta Zizza*
Abstract
Following the two surveys carried out in 2007 and 2009 on firms’ price and wage setting practices, in June 2013 the ESCB’s Wage Dynamics Network (WDN) conducted a third survey aimed at assessing, through a harmonised questionnaire, the most important transformations under way in the national labour markets. This paper documents the results of the survey carried out in Italy. The sovereign debt crisis severely hit the Italian economy, causing a collapse in demand, increased uncertainty and difficulties in accessing external finance. Firms responded by decreasing labour input (adjusting both the intensive and the extensive margins) more often than wages. However, wage-setting practices were also affected by the new economic landscape: the percentage of workers employed in firms enacting wage freezes or cuts has steadily increased since 2010, reaching 17% of the total workforce in the sectors considered in 2013. Furthermore, a large share of companies have adapted their pricing strategy to the new economic environment; the frequency of price adjustments has increased, mainly as a reaction to stronger competition.
JEL Classifications: E31, J23, J30, J31.
Keywords: labour cost adjustments, pricing strategies.
Contents
1. Introduction…………………………………………………………………………….... 52. The Italian labour market: recent developments and reforms…………………………… 63. The survey and the questionnaire………………………………………………………... 104. Source and size of shocks………………………………………………………………... 105. Firm level adjustment: labour input and wages………………………...……………….. 146. Price setting and price adjustment………………………………………………………. 227. Conclusions…………………………………………………………………………….... 27Appendix 1 – The Italian questionnaire……………………………………………………. 29Appendix 2 – The recent reforms of the Italian labour market….…………………………. 35Appendix 3 – The Italian WDN surveys………………………………………………….... 37Appendix 4 – Other tables ……………………………………………………..................... 39References…..……………………………………………………........................................ 53
____________________________________________________ * Bank of Italy, Directorate General for Economics, Statistics and Research.

5
1. Introduction1
In 2007 and in 2009 the ESCB research project Wage Dynamics Network (WDN) carried out two surveys on European firms’ wage and price setting practices. The former (WDN1) was
conducted by 17 national central banks (NCBs) between the end of 2007 and the first half of 2008 and collected information from over 17,000 companies. It mainly focused on how firms “typically”
set and adjust wages and labour input, as well as on the relationship between these practices and price behaviour. Successively, in the midst of the global financial crisis in the summer of 2009, a subgroup of the same NCBs (10, including Italy; see Fabiani and Sabbatini, 2011) carried out a shorter and narrower in scope follow-up survey (WDN2) devoted to understanding the reaction of firms, in terms of employment and wage adjustment, to the exceptional economic downturn (about 5,700 firms were interviewed).
In the Eurozone the recession set off by the financial crisis was aggravated by the eruption in 2011 of the sovereign debt crisis, which severely strained economic conditions in a number of countries. In the presence of an unusually protracted and exceptionally severe economic downturn, several European countries, including Italy, implemented major labour market reforms aimed at enhancing flexibility and facilitating firms’ adjustment to the new economic landscape. For this reason in June 2013 the ESCB launched a third wave of the WDN survey (WDN3), aimed at assessing at the national level, through an harmonised questionnaire (see Appendix 1) and using a common approach, the most important aspects of the ongoing transformations, their country specificity and possible implications. The questionnaire included core qualitative questions to be asked in all countries and, eventually, non-core ones to be asked on a voluntary basis. Twenty six ESCB countries participated in WDN3 and most of them collected data during 2014.
More specifically, the mandate of the new project was to: (i) evaluate the main changes in the economic environment in which firms operate and the main shocks they actually faced; (ii) assess the reforms to wage bargaining institutions and employment protection legislation implemented in several countries, focusing on their potential effects on wage setting, on the workforce (number of employees and composition) and on the use of different adjustment margins at the firm level; (iii) collect fresh information on price setting and on the frequency of price changes and explore some of the factors that could have motivated changes in pricing strategies.
In many occasions firms had to report an explicit assessment of the changes that occurred in 2010-13 (broadly corresponding to the period when the effects of the sovereign debt crises unfolded) with respect to the situation prevailing before 2008 (generally considered as “normal” times).
1 We thank Mario Izquierdo and Jan van Ours for helpful comments and Marco Chiurato and Stefano Marucci for their research assistance. The views expressed in this paper are the ones of the authors and do not necessarily reflect those of the Bank of Italy. All the remaining errors are ours.
6
In the European context, Italy stands out as a particularly interesting case, as the Italian labour market institutions underwent a major overhaul. The reform effort is still ongoing, as confirmed by the launch in 2014 of a further comprehensive labour market reform, the so-called “Jobs Act”. The
main results of the Italian survey can be summarized as follows:
i) Several kinds of shocks hit firms during the sovereign debt crisis. Companies perceived the level and volatility of demand as the most disruptive. Domestic demand decreased for 60 per cent of firms, one fourth recorded also a fall in foreign sales. Access to credit was more of a concern for smaller firms.
ii) 70 per cent of firms cut profit margins. Four companies out of ten cut prices on their domestic markets in the period 2010-13; a reduction in both costs and profit margins lies behind this choice.
iii) On the labour cost side, the adjustment took place more often on labour input than on wages. Nevertheless, there is evidence that the share of firms freezing or cutting wages has been increasing over time. Firms state that firing individual workers has become easier after the Fornero reform, while more stringent rules for hiring on a temporary basis made hiring more difficult.
iv) The survey confirms the presence of a relevant degree of price stickiness in all sectors; however, a large share of companies adapted their pricing strategies to the profound changes in the economic landscape in the last few years, in the direction of a higher flexibility.
The structure of the paper is the following. Section 2 provides background information on the economic framework in which the Italian survey was carried out; in particular, it summarizes the developments of the Italian labour market during the crisis and the main reforms introduced over the reference period of the survey (2010-13). Section 3 describes the questionnaire and the survey. Section 4 gathers information on the main sources of shocks faced by companies; this information is propaedeutic to the assessment of the reaction of firms’ labour input/costs and prices, which is the focus of, respectively, Sections 5 and 6. Section 7 concludes.
2. The Italian labour market: recent developments and reforms
2.1 Main developments in the Italian labour market during the crisis
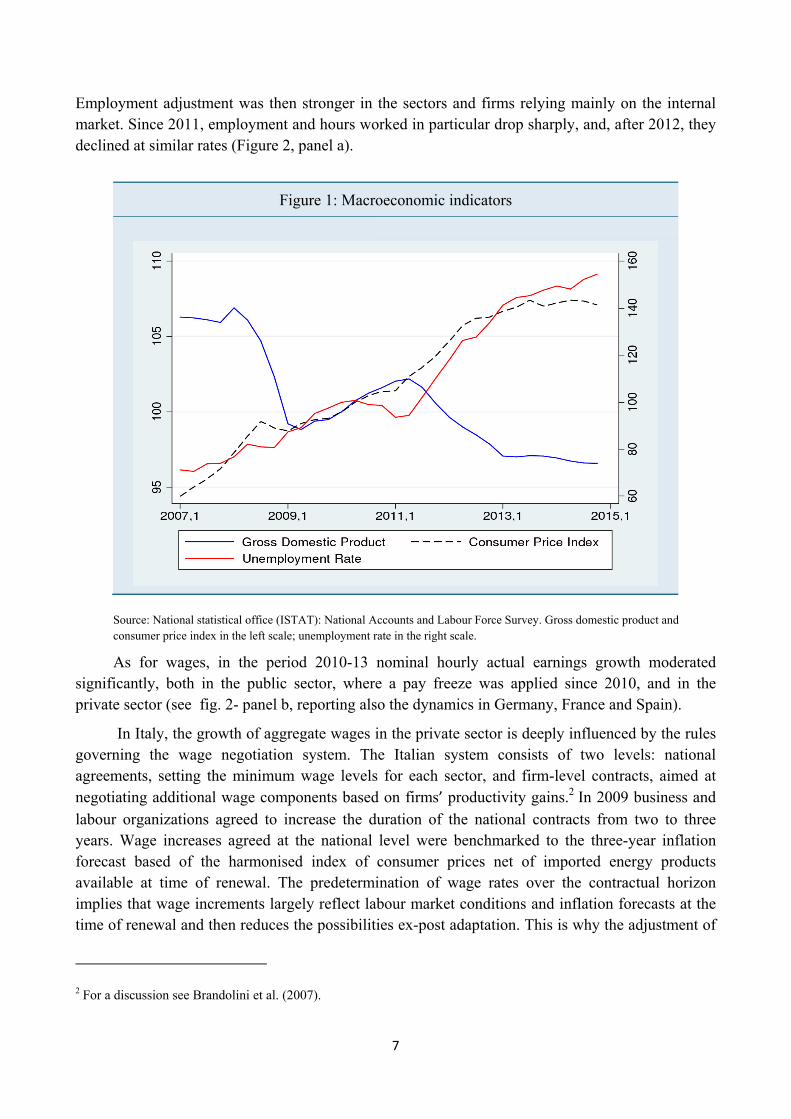
The Italian economy reached a cyclical peak at the end of 2007, after posting the poorest economic growth of the post-war period in the previous decade (Figure 1). The encouraging signals of an ongoing adjustment in the structure of the economy since the mid-nineties (Brandolini and Bugamelli, 2009) were abruptly interrupted by the global crisis, which led to a double-dip recession (fig. 1). Overall, between 2008 and 2014, economic activity contracted by 9.4%, while unemployment increased by 6 percentage points.
Compared with the size of the shock, employment remained rather resilient immediately after the Global financial crisis. The impact of the recession was larger for workers in the industrial sector, more affected by the abrupt global trade collapse. The consequences of the sudden stop in foreign demand were mitigated, however, by a reduction of per-capita hours worked. Differently from 2008 recession, the sovereign debt crisis that started in the summer of 2011 has been the result of the collapse in domestic demand that followed significant credit and fiscal restrictions.
7
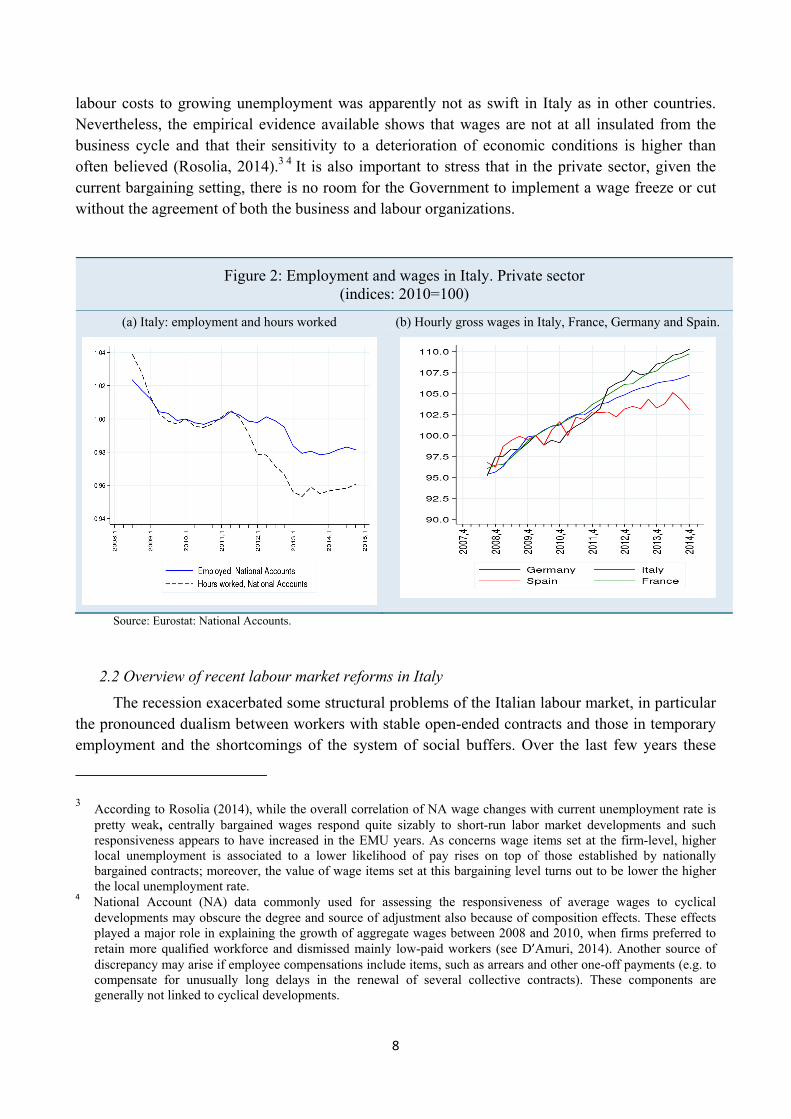
Employment adjustment was then stronger in the sectors and firms relying mainly on the internal market. Since 2011, employment and hours worked in particular drop sharply, and, after 2012, they declined at similar rates (Figure 2, panel a).
Figure 1: Macroeconomic indicators
Source: National statistical office (ISTAT): National Accounts and Labour Force Survey. Gross domestic product and consumer price index in the left scale; unemployment rate in the right scale.
As for wages, in the period 2010-13 nominal hourly actual earnings growth moderated significantly, both in the public sector, where a pay freeze was applied since 2010, and in the private sector (see fig. 2- panel b, reporting also the dynamics in Germany, France and Spain).
In Italy, the growth of aggregate wages in the private sector is deeply influenced by the rules governing the wage negotiation system. The Italian system consists of two levels: national agreements, setting the minimum wage levels for each sector, and firm-level contracts, aimed at negotiating additional wage components based on firms’ productivity gains.2 In 2009 business and
labour organizations agreed to increase the duration of the national contracts from two to three years. Wage increases agreed at the national level were benchmarked to the three-year inflation forecast based of the harmonised index of consumer prices net of imported energy products available at time of renewal. The predetermination of wage rates over the contractual horizon implies that wage increments largely reflect labour market conditions and inflation forecasts at the time of renewal and then reduces the possibilities ex-post adaptation. This is why the adjustment of
2 For a discussion see Brandolini et al. (2007).
8
labour costs to growing unemployment was apparently not as swift in Italy as in other countries. Nevertheless, the empirical evidence available shows that wages are not at all insulated from the business cycle and that their sensitivity to a deterioration of economic conditions is higher than often believed (Rosolia, 2014).3 4 It is also important to stress that in the private sector, given the current bargaining setting, there is no room for the Government to implement a wage freeze or cut without the agreement of both the business and labour organizations.
Figure 2: Employment and wages in Italy. Private sector (indices: 2010=100)
(a) Italy: employment and hours worked (b) Hourly gross wages in Italy, France, Germany and Spain.
Source: Eurostat: National Accounts.
2.2 Overview of recent labour market reforms in Italy
The recession exacerbated some structural problems of the Italian labour market, in particular the pronounced dualism between workers with stable open-ended contracts and those in temporary employment and the shortcomings of the system of social buffers. Over the last few years these
3 According to Rosolia (2014), while the overall correlation of NA wage changes with current unemployment rate is pretty weak, centrally bargained wages respond quite sizably to short-run labor market developments and such responsiveness appears to have increased in the EMU years. As concerns wage items set at the firm-level, higher local unemployment is associated to a lower likelihood of pay rises on top of those established by nationally bargained contracts; moreover, the value of wage items set at this bargaining level turns out to be lower the higher the local unemployment rate.
4 National Account (NA) data commonly used for assessing the responsiveness of average wages to cyclical developments may obscure the degree and source of adjustment also because of composition effects. These effects played a major role in explaining the growth of aggregate wages between 2008 and 2010, when firms preferred to retain more qualified workforce and dismissed mainly low-paid workers (see D’Amuri, 2014). Another source of discrepancy may arise if employee compensations include items, such as arrears and other one-off payments (e.g. to compensate for unusually long delays in the renewal of several collective contracts). These components are generally not linked to cyclical developments.
9
weaknesses have been tackled through important reforms aimed at overhauling the main labour market institutions. Here we provide a summary of the salient features of such reforms, focusing mainly on those taking place during the survey reference period (2010-13) and referring the reader to Appendix 2 for details. It is worth remarking that when the Italian survey was carried out the “Jobs Act”, i.e. the most recent labour market reform the started to be implemented in 2015, was
only sketched; hence, in principle respondents should have not taken into consideration the debate on the new rules and the effect of the incentives, although we cannot exclude that in answering to the questionnaire they were affected to some extent.5
Employment protection legislation and contractual arrangements. In July 2012 the so called “Fornero reform” (Law 92/2012) entered into force with the aim of rebalancing the degree of
protection among the various types of contracts, thereby reducing segmentation while preserving the requisite margins of flexibility in the use of labour. More precisely, the reform: (1) set an upper bound for firing costs and limited the possibility of reinstatement to cases in which the reasons behind the laid off are unproven (disciplinary dismissal) or non-existent (economic dismissal); firms continue to have no obligations in case of fair dismissals; (2) set new rules for renewals of temporary job contracts to avoid abuses, while streamlining activation procedures for the first year; (3) the Fornero reform also reduced the fragmentation of social buffers, and improved the generosity of ordinary unemployment benefits to counterbalance the reduction of firing costs.
Because of the severity of the recession, subsequent governments passed new legislation (Decree Laws 76/2013 and 34/2014) to relax the legal restrictions introduced by the “Fornero
reform” to the use of the most flexible types of contracts, which had been perceived as very onerous
by employers.
Wage-setting rules and the development of the second level of wage negotiation. As already mentioned in the previous section the major reform of the wage bargaining framework took place in 2009 and raised from two to three years the duration of both the economic and the work-rules parts of the national, sector specific, contracts. The new framework remains based on two levels, with the second level having the possibility to introduce additional pay rises and variations in work organization if this is foreseen by the national level. Starting with 2011, actions have been undertaken by social partners in order to favour decentralization, without altering the relative importance of different levels of bargaining. This process culminated in the Inter-sectoral Agreement of June 2011, while the January 2014 Consolidated Act on Representation unified and harmonized existing rules. The general purpose of the agreements was to enhance the certainty of the rules, by setting the framework for stipulating majority endorsement for both industry-wide and company-level agreements as well as for their effective enforceability. Nevertheless, many of these measures have not been implemented so far, among other things because, owing to their contractual rather than legislative nature, they only bind the contracting parties (D’Amuri and Giorgiantonio, 2015). Meanwhile, also the government tried to incentivize decentralized bargaining by introducing
5 For a detailed description of the labour market reforms introduced since the end of 2014 (Jobs Act), see Bank of Italy (2015).
10
social security and tax concessions for the portion of wage negotiated at local level, and the possibility of signing local agreements in derogation of the law and of the national work contracts.
At the end of this reform process the Italian labour market is now characterized by firing costs remarkably lower than in the past and very flexible rules for temporary work arrangements. The unemployment benefit system covers now almost all employees. Steps in the direction of favoring the diffusion of decentralized bargaining have been undertaken by social partners and the legislator, but the process is still incomplete.
3. The survey and the questionnaire
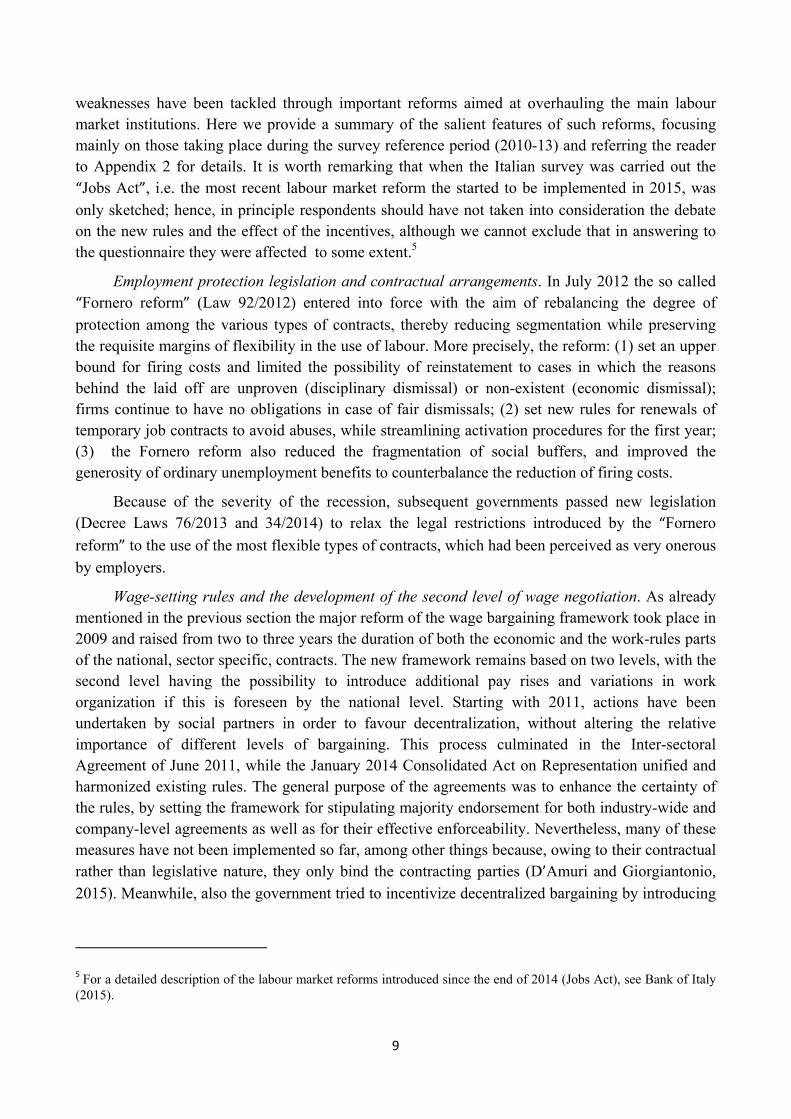
The Italian survey was conducted between July and September 2014 on 1,102 firms of the manufacturing and service sectors with at least 20 employees. The questionnaire consists almost exclusively of qualitative questions - the few quantitative questions request percentages - and includes three types of questions: (i) core harmonised questions, uniformly administered throughout the different countries to allow for international comparison; (ii) non-core questions (also harmonised across countries, but optional); (iii) local questions, administered only at the country level. The Italian questionnaire includes all the WDN3 core questions, most of the non-core questions and three local questions, as shown in Table 1 below. More details on the survey design and the questionnaire can be found in Appendix 3.
Table 1 – Structure of the Italian WDN3 questionnaire (A/B; A=number of questions administered; B= number of WDN3 questions)
Section C N L
1 Information about the firm 7/7 0/0 0/0
2 Changes in the economic environment 6/6 2/3 0/0
3 Labour force adjustments 5/5 1/3 0/0
4 Wage adjustments 8/8 1/1 2/0
5 Price setting and price changes 0/0 8/8 1/0
Notes: C=core questions; N=non-core questions; L=local questions.
4. Source and size of shocks
This Section describes the main shocks affecting companies between 2010 and 2013 and provides a first view on their reaction, paving the way to a more in-depth analysis on the adjustment of employment, wages and prices carried out in the remaining Sections.
Although the sovereign debt crisis is not explicitly mentioned in the survey, the questions on the sources of the shocks are designed to shed some light on how its unfolding impacted on firms’ demand, costs, access to financing opportunities, prices, wages and employment.
Four years after its eruption in 2011, the narrative of the sovereign crisis is relatively well understood. A fiscal crisis in Greece unveiled some fundamental flaws in the design of the
11
European Monetary Union. This translated into worries about the sustainability of public debts in countries trapped in low growth, mainly Italy and Portugal, or where the collapse of a property bubble had ended up weighing on public finances, like Ireland and Spain. As investors fled from these countries, financing conditions tightened sharply, domestic demand plummeted, unemployment rose to historical peaks and inflation decreased sharply. The peculiar elements of the crisis (falling aggregate demand, tightening credit conditions for both firms and consumers) are the central elements of the questions.
The first aspect we focus on is the effect on firms’ activity of the following five factors:6 (i)
the level of demand; (ii) volatility/uncertainty about the level of demand; (iii) access to external finance through the usual financial channels; (iv) customers’ ability to pay and meet contractual
terms; (v) availability of supplies from the usual suppliers. Respondents were given five options for each of these factors: strongly negative, moderately negative, none, positive, strongly positive.
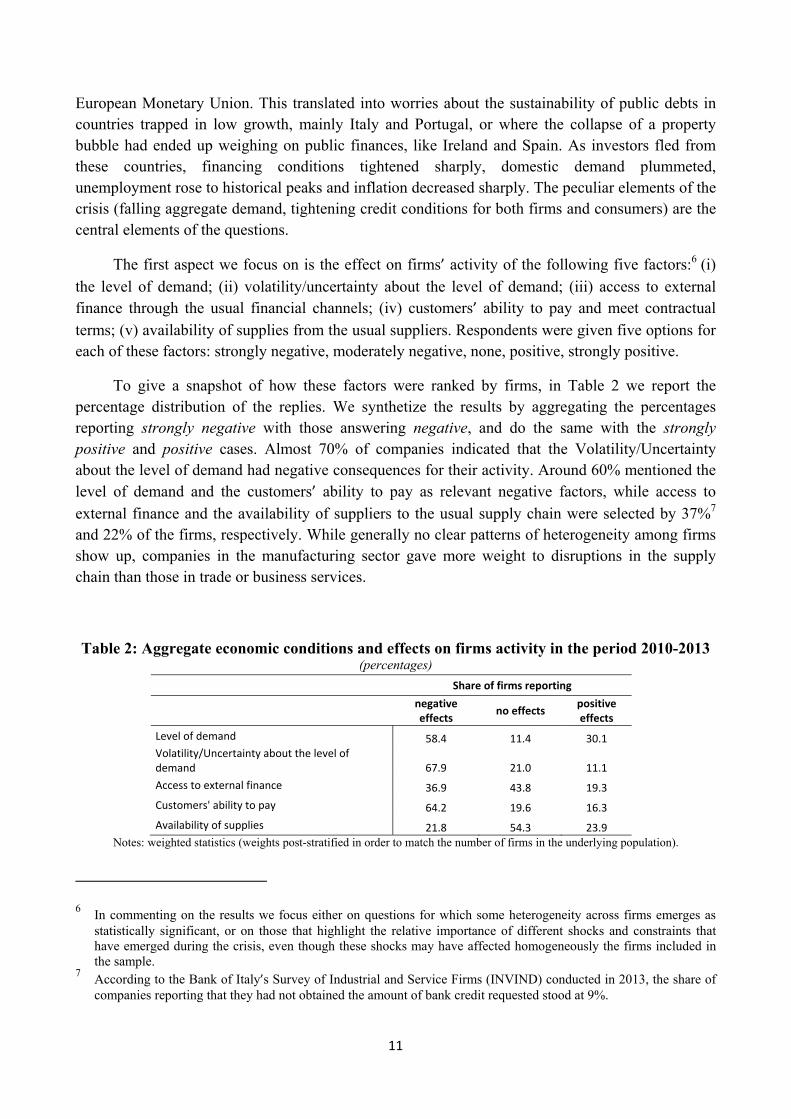
To give a snapshot of how these factors were ranked by firms, in Table 2 we report the percentage distribution of the replies. We synthetize the results by aggregating the percentages reporting strongly negative with those answering negative, and do the same with the strongly positive and positive cases. Almost 70% of companies indicated that the Volatility/Uncertainty about the level of demand had negative consequences for their activity. Around 60% mentioned the level of demand and the customers’ ability to pay as relevant negative factors, while access to
external finance and the availability of suppliers to the usual supply chain were selected by 37%7 and 22% of the firms, respectively. While generally no clear patterns of heterogeneity among firms show up, companies in the manufacturing sector gave more weight to disruptions in the supply chain than those in trade or business services.
Table 2: Aggregate economic conditions and effects on firms activity in the period 2010-2013 (percentages)
Share of firms reporting
negative effects no effects positive
effects Level of demand 58.4 11.4 30.1 Volatility/Uncertainty about the level of demand 67.9 21.0 11.1 Access to external finance 36.9 43.8 19.3 Customers' ability to pay 64.2 19.6 16.3 Availability of supplies 21.8 54.3 23.9
Notes: weighted statistics (weights post-stratified in order to match the number of firms in the underlying population).
6 In commenting on the results we focus either on questions for which some heterogeneity across firms emerges as statistically significant, or on those that highlight the relative importance of different shocks and constraints that have emerged during the crisis, even though these shocks may have affected homogeneously the firms included in the sample.
7 According to the Bank of Italy’s Survey of Industrial and Service Firms (INVIND) conducted in 2013, the share of companies reporting that they had not obtained the amount of bank credit requested stood at 9%.
12
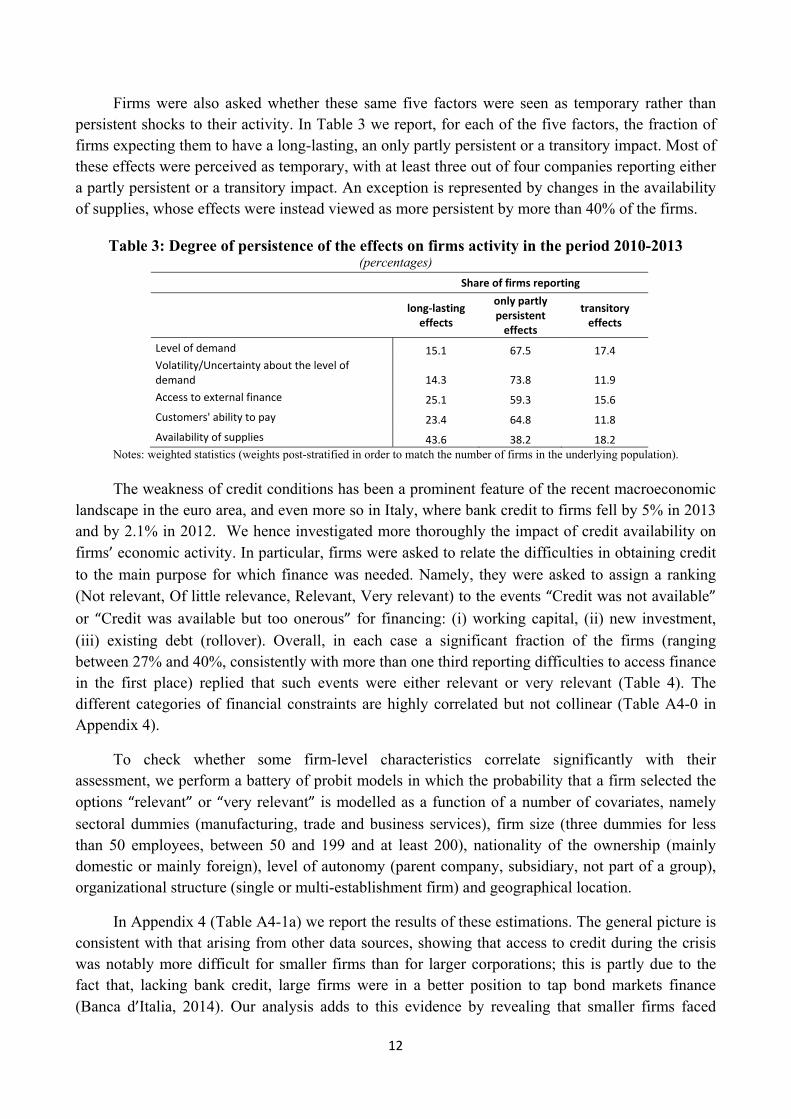
Firms were also asked whether these same five factors were seen as temporary rather than persistent shocks to their activity. In Table 3 we report, for each of the five factors, the fraction of firms expecting them to have a long-lasting, an only partly persistent or a transitory impact. Most of these effects were perceived as temporary, with at least three out of four companies reporting either a partly persistent or a transitory impact. An exception is represented by changes in the availability of supplies, whose effects were instead viewed as more persistent by more than 40% of the firms.
Table 3: Degree of persistence of the effects on firms activity in the period 2010-2013 (percentages)
Share of firms reporting
long-lasting effects
only partly persistent
effects
transitory effects
Level of demand 15.1 67.5 17.4 Volatility/Uncertainty about the level of demand 14.3 73.8 11.9 Access to external finance 25.1 59.3 15.6 Customers' ability to pay 23.4 64.8 11.8 Availability of supplies 43.6 38.2 18.2
Notes: weighted statistics (weights post-stratified in order to match the number of firms in the underlying population).
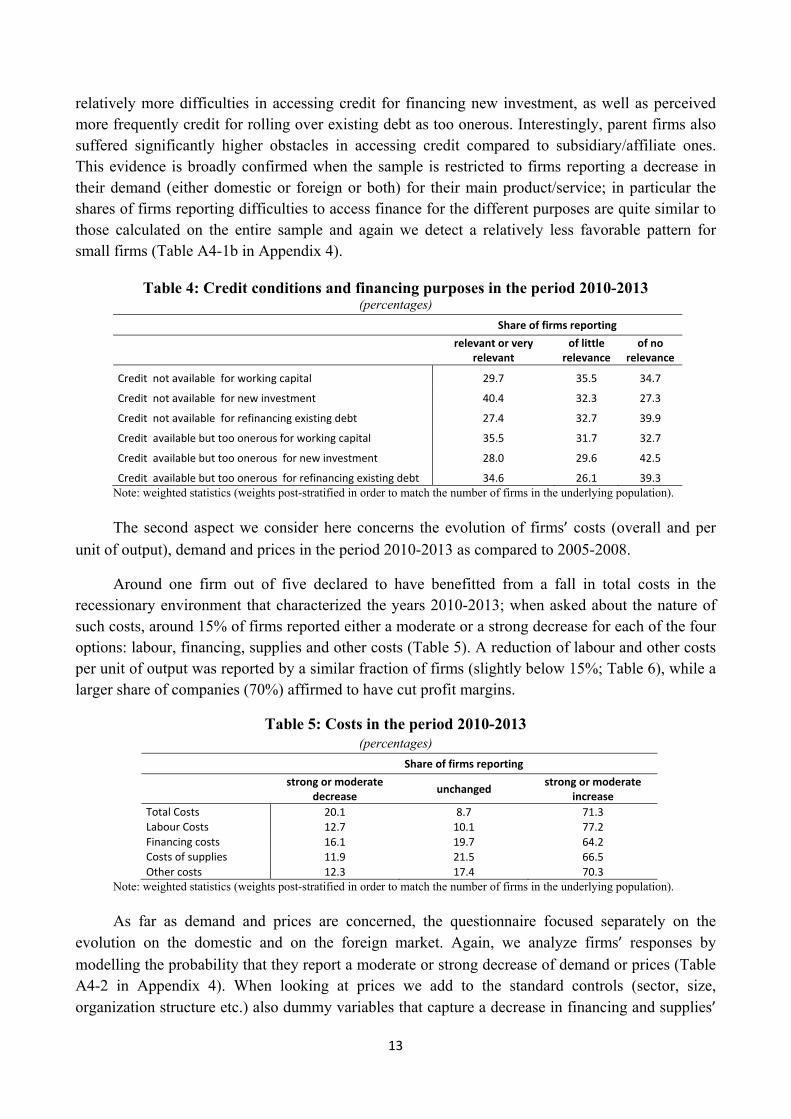
The weakness of credit conditions has been a prominent feature of the recent macroeconomic landscape in the euro area, and even more so in Italy, where bank credit to firms fell by 5% in 2013 and by 2.1% in 2012. We hence investigated more thoroughly the impact of credit availability on firms’ economic activity. In particular, firms were asked to relate the difficulties in obtaining credit to the main purpose for which finance was needed. Namely, they were asked to assign a ranking (Not relevant, Of little relevance, Relevant, Very relevant) to the events “Credit was not available”
or “Credit was available but too onerous” for financing: (i) working capital, (ii) new investment, (iii) existing debt (rollover). Overall, in each case a significant fraction of the firms (ranging between 27% and 40%, consistently with more than one third reporting difficulties to access finance in the first place) replied that such events were either relevant or very relevant (Table 4). The different categories of financial constraints are highly correlated but not collinear (Table A4-0 in Appendix 4).
To check whether some firm-level characteristics correlate significantly with their assessment, we perform a battery of probit models in which the probability that a firm selected the options “relevant” or “very relevant” is modelled as a function of a number of covariates, namely sectoral dummies (manufacturing, trade and business services), firm size (three dummies for less than 50 employees, between 50 and 199 and at least 200), nationality of the ownership (mainly domestic or mainly foreign), level of autonomy (parent company, subsidiary, not part of a group), organizational structure (single or multi-establishment firm) and geographical location.
In Appendix 4 (Table A4-1a) we report the results of these estimations. The general picture is consistent with that arising from other data sources, showing that access to credit during the crisis was notably more difficult for smaller firms than for larger corporations; this is partly due to the fact that, lacking bank credit, large firms were in a better position to tap bond markets finance (Banca d’Italia, 2014). Our analysis adds to this evidence by revealing that smaller firms faced
13
relatively more difficulties in accessing credit for financing new investment, as well as perceived more frequently credit for rolling over existing debt as too onerous. Interestingly, parent firms also suffered significantly higher obstacles in accessing credit compared to subsidiary/affiliate ones. This evidence is broadly confirmed when the sample is restricted to firms reporting a decrease in their demand (either domestic or foreign or both) for their main product/service; in particular the shares of firms reporting difficulties to access finance for the different purposes are quite similar to those calculated on the entire sample and again we detect a relatively less favorable pattern for small firms (Table A4-1b in Appendix 4).
Table 4: Credit conditions and financing purposes in the period 2010-2013 (percentages)
Share of firms reporting
relevant or very
relevant of little
relevance of no
relevance
Credit not available for working capital 29.7 35.5 34.7
Credit not available for new investment 40.4 32.3 27.3
Credit not available for refinancing existing debt 27.4 32.7 39.9
Credit available but too onerous for working capital 35.5 31.7 32.7
Credit available but too onerous for new investment 28.0 29.6 42.5
Credit available but too onerous for refinancing existing debt 34.6 26.1 39.3 Note: weighted statistics (weights post-stratified in order to match the number of firms in the underlying population).
The second aspect we consider here concerns the evolution of firms’ costs (overall and per
unit of output), demand and prices in the period 2010-2013 as compared to 2005-2008.
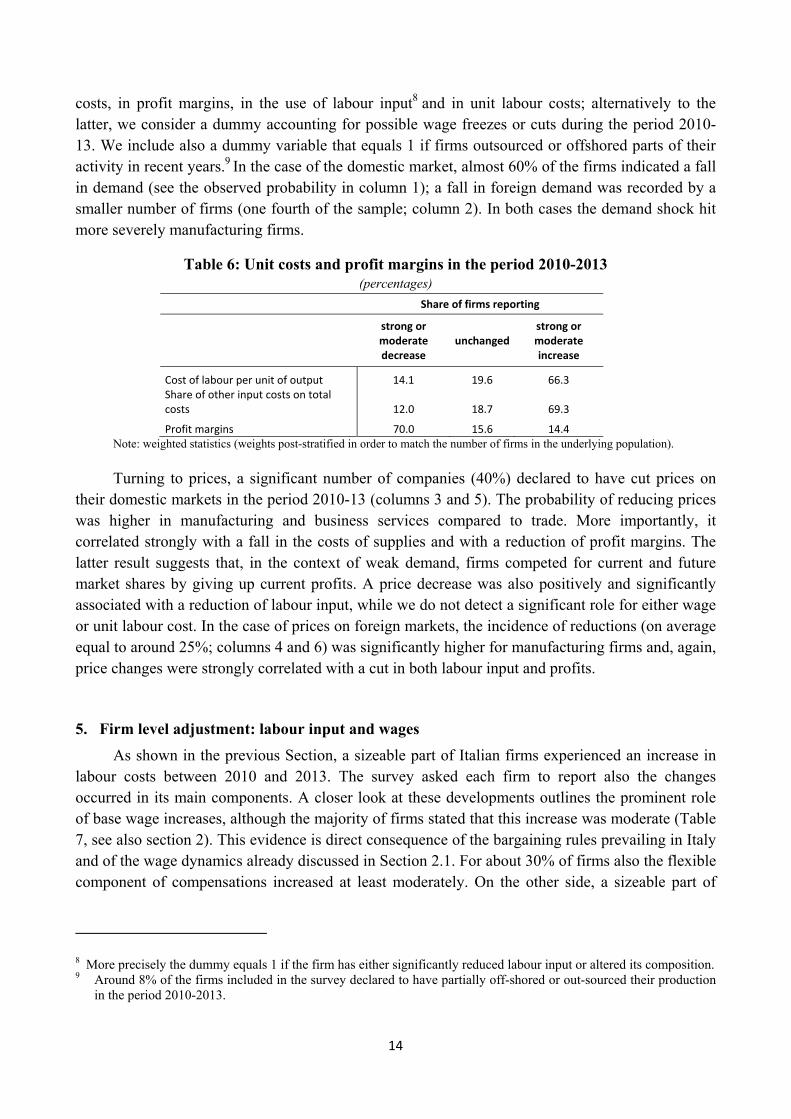
Around one firm out of five declared to have benefitted from a fall in total costs in the recessionary environment that characterized the years 2010-2013; when asked about the nature of such costs, around 15% of firms reported either a moderate or a strong decrease for each of the four options: labour, financing, supplies and other costs (Table 5). A reduction of labour and other costs per unit of output was reported by a similar fraction of firms (slightly below 15%; Table 6), while a larger share of companies (70%) affirmed to have cut profit margins.
Table 5: Costs in the period 2010-2013 (percentages)
Share of firms reporting
strong or moderate
decrease unchanged strong or moderate increase
Total Costs 20.1 8.7 71.3 Labour Costs 12.7 10.1 77.2 Financing costs 16.1 19.7 64.2 Costs of supplies 11.9 21.5 66.5 Other costs 12.3 17.4 70.3
Note: weighted statistics (weights post-stratified in order to match the number of firms in the underlying population).
As far as demand and prices are concerned, the questionnaire focused separately on the evolution on the domestic and on the foreign market. Again, we analyze firms’ responses by
modelling the probability that they report a moderate or strong decrease of demand or prices (Table A4-2 in Appendix 4). When looking at prices we add to the standard controls (sector, size, organization structure etc.) also dummy variables that capture a decrease in financing and supplies’
14
costs, in profit margins, in the use of labour input8 and in unit labour costs; alternatively to the latter, we consider a dummy accounting for possible wage freezes or cuts during the period 2010-13. We include also a dummy variable that equals 1 if firms outsourced or offshored parts of their activity in recent years.9 In the case of the domestic market, almost 60% of the firms indicated a fall in demand (see the observed probability in column 1); a fall in foreign demand was recorded by a smaller number of firms (one fourth of the sample; column 2). In both cases the demand shock hit more severely manufacturing firms.
Table 6: Unit costs and profit margins in the period 2010-2013 (percentages)
Share of firms reporting
strong or moderate decrease
unchangedstrong or moderate increase
Cost of labour per unit of output 14.1 19.6 66.3 Share of other input costs on total costs 12.0 18.7 69.3
Profit margins 70.0 15.6 14.4 Note: weighted statistics (weights post-stratified in order to match the number of firms in the underlying population).
Turning to prices, a significant number of companies (40%) declared to have cut prices on their domestic markets in the period 2010-13 (columns 3 and 5). The probability of reducing prices was higher in manufacturing and business services compared to trade. More importantly, it correlated strongly with a fall in the costs of supplies and with a reduction of profit margins. The latter result suggests that, in the context of weak demand, firms competed for current and future market shares by giving up current profits. A price decrease was also positively and significantly associated with a reduction of labour input, while we do not detect a significant role for either wage or unit labour cost. In the case of prices on foreign markets, the incidence of reductions (on average equal to around 25%; columns 4 and 6) was significantly higher for manufacturing firms and, again, price changes were strongly correlated with a cut in both labour input and profits.
5. Firm level adjustment: labour input and wages
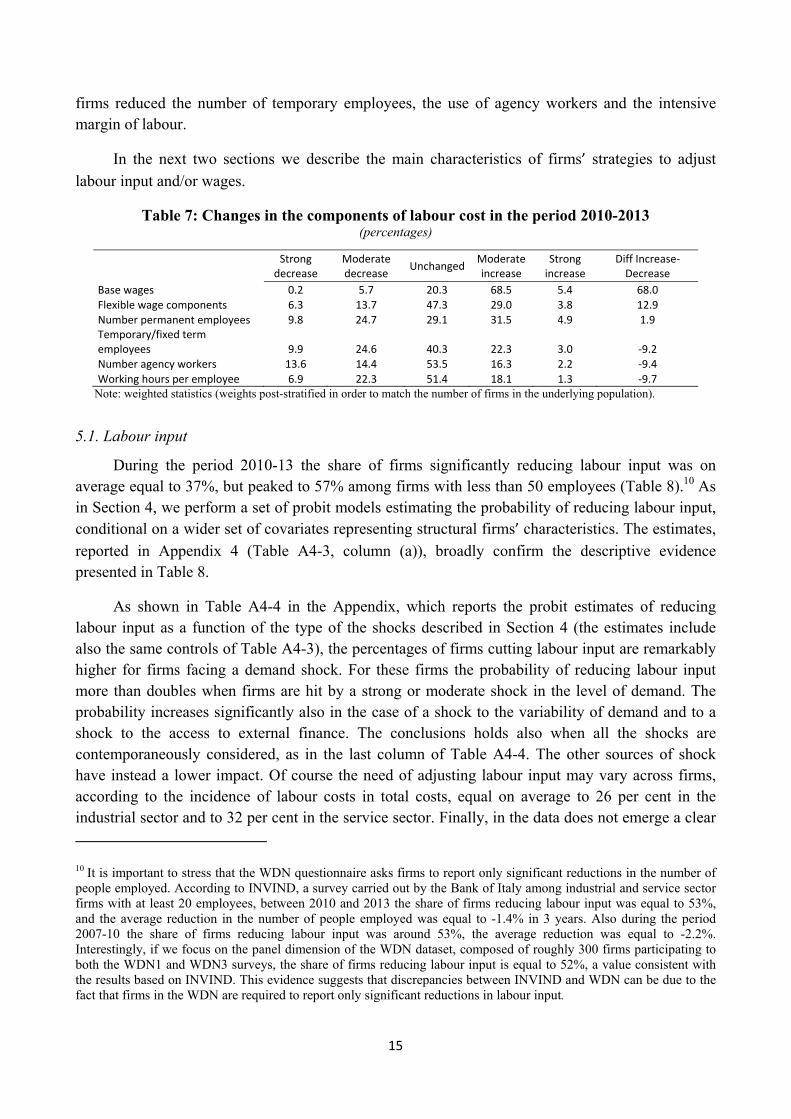
As shown in the previous Section, a sizeable part of Italian firms experienced an increase in labour costs between 2010 and 2013. The survey asked each firm to report also the changes occurred in its main components. A closer look at these developments outlines the prominent role of base wage increases, although the majority of firms stated that this increase was moderate (Table 7, see also section 2). This evidence is direct consequence of the bargaining rules prevailing in Italy and of the wage dynamics already discussed in Section 2.1. For about 30% of firms also the flexible component of compensations increased at least moderately. On the other side, a sizeable part of
8 More precisely the dummy equals 1 if the firm has either significantly reduced labour input or altered its composition. 9 Around 8% of the firms included in the survey declared to have partially off-shored or out-sourced their production
in the period 2010-2013.
15
firms reduced the number of temporary employees, the use of agency workers and the intensive margin of labour.
In the next two sections we describe the main characteristics of firms’ strategies to adjust
labour input and/or wages.
Table 7: Changes in the components of labour cost in the period 2010-2013 (percentages)
Strong
decrease Moderate decrease Unchanged Moderate
increase Strong
increase Diff Increase-
Decrease Base wages 0.2 5.7 20.3 68.5 5.4 68.0 Flexible wage components 6.3 13.7 47.3 29.0 3.8 12.9 Number permanent employees 9.8 24.7 29.1 31.5 4.9 1.9 Temporary/fixed term employees 9.9 24.6 40.3 22.3 3.0 -9.2 Number agency workers 13.6 14.4 53.5 16.3 2.2 -9.4 Working hours per employee 6.9 22.3 51.4 18.1 1.3 -9.7
Note: weighted statistics (weights post-stratified in order to match the number of firms in the underlying population).
5.1. Labour input
During the period 2010-13 the share of firms significantly reducing labour input was on average equal to 37%, but peaked to 57% among firms with less than 50 employees (Table 8).10 As in Section 4, we perform a set of probit models estimating the probability of reducing labour input, conditional on a wider set of covariates representing structural firms’ characteristics. The estimates,
reported in Appendix 4 (Table A4-3, column (a)), broadly confirm the descriptive evidence presented in Table 8.
As shown in Table A4-4 in the Appendix, which reports the probit estimates of reducing labour input as a function of the type of the shocks described in Section 4 (the estimates include also the same controls of Table A4-3), the percentages of firms cutting labour input are remarkably higher for firms facing a demand shock. For these firms the probability of reducing labour input more than doubles when firms are hit by a strong or moderate shock in the level of demand. The probability increases significantly also in the case of a shock to the variability of demand and to a shock to the access to external finance. The conclusions holds also when all the shocks are contemporaneously considered, as in the last column of Table A4-4. The other sources of shock have instead a lower impact. Of course the need of adjusting labour input may vary across firms, according to the incidence of labour costs in total costs, equal on average to 26 per cent in the industrial sector and to 32 per cent in the service sector. Finally, in the data does not emerge a clear
10 It is important to stress that the WDN questionnaire asks firms to report only significant reductions in the number of people employed. According to INVIND, a survey carried out by the Bank of Italy among industrial and service sector firms with at least 20 employees, between 2010 and 2013 the share of firms reducing labour input was equal to 53%, and the average reduction in the number of people employed was equal to -1.4% in 3 years. Also during the period 2007-10 the share of firms reducing labour input was around 53%, the average reduction was equal to -2.2%. Interestingly, if we focus on the panel dimension of the WDN dataset, composed of roughly 300 firms participating to both the WDN1 and WDN3 surveys, the share of firms reducing labour input is equal to 52%, a value consistent with the results based on INVIND. This evidence suggests that discrepancies between INVIND and WDN can be due to the fact that firms in the WDN are required to report only significant reductions in labour input.
16
pattern between the perceived degree of persistence of the shock and the probability to adjust labour input.
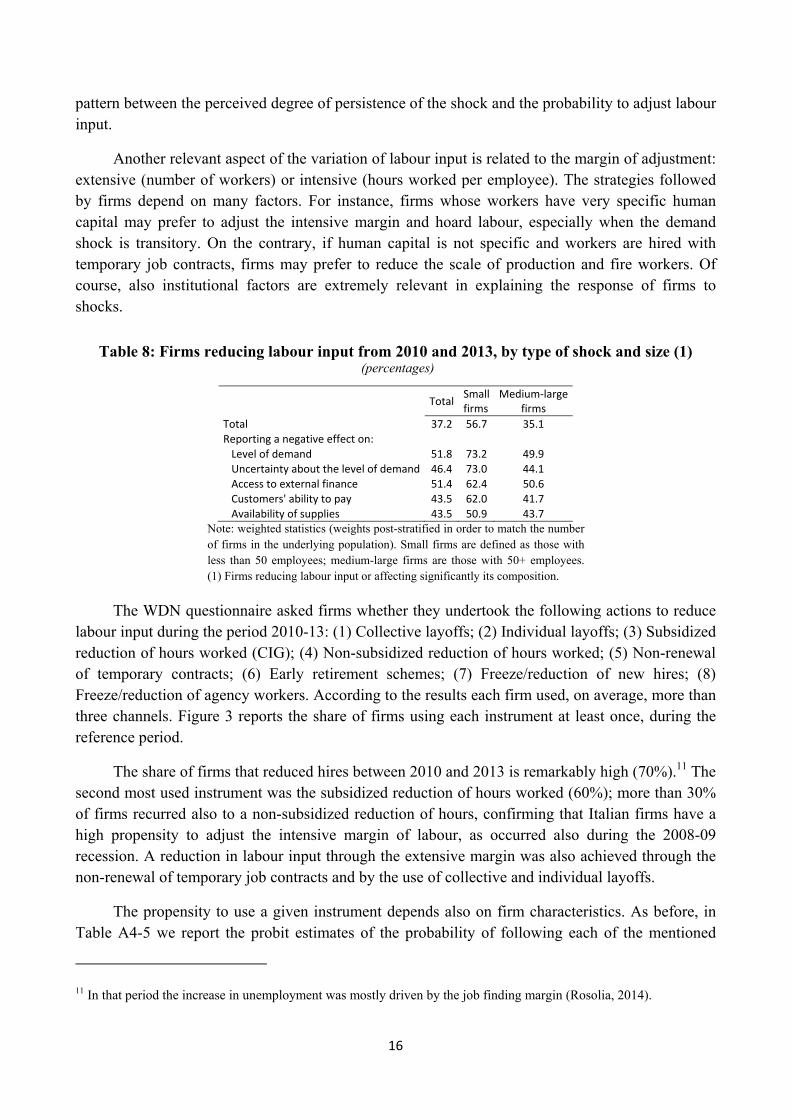
Another relevant aspect of the variation of labour input is related to the margin of adjustment: extensive (number of workers) or intensive (hours worked per employee). The strategies followed by firms depend on many factors. For instance, firms whose workers have very specific human capital may prefer to adjust the intensive margin and hoard labour, especially when the demand shock is transitory. On the contrary, if human capital is not specific and workers are hired with temporary job contracts, firms may prefer to reduce the scale of production and fire workers. Of course, also institutional factors are extremely relevant in explaining the response of firms to shocks.
Table 8: Firms reducing labour input from 2010 and 2013, by type of shock and size (1) (percentages)
Total Small firms
Medium-large firms
Total 37.2 56.7 35.1 Reporting a negative effect on: Level of demand 51.8 73.2 49.9 Uncertainty about the level of demand 46.4 73.0 44.1 Access to external finance 51.4 62.4 50.6 Customers' ability to pay 43.5 62.0 41.7 Availability of supplies 43.5 50.9 43.7
Note: weighted statistics (weights post-stratified in order to match the number of firms in the underlying population). Small firms are defined as those with less than 50 employees; medium-large firms are those with 50+ employees. (1) Firms reducing labour input or affecting significantly its composition.
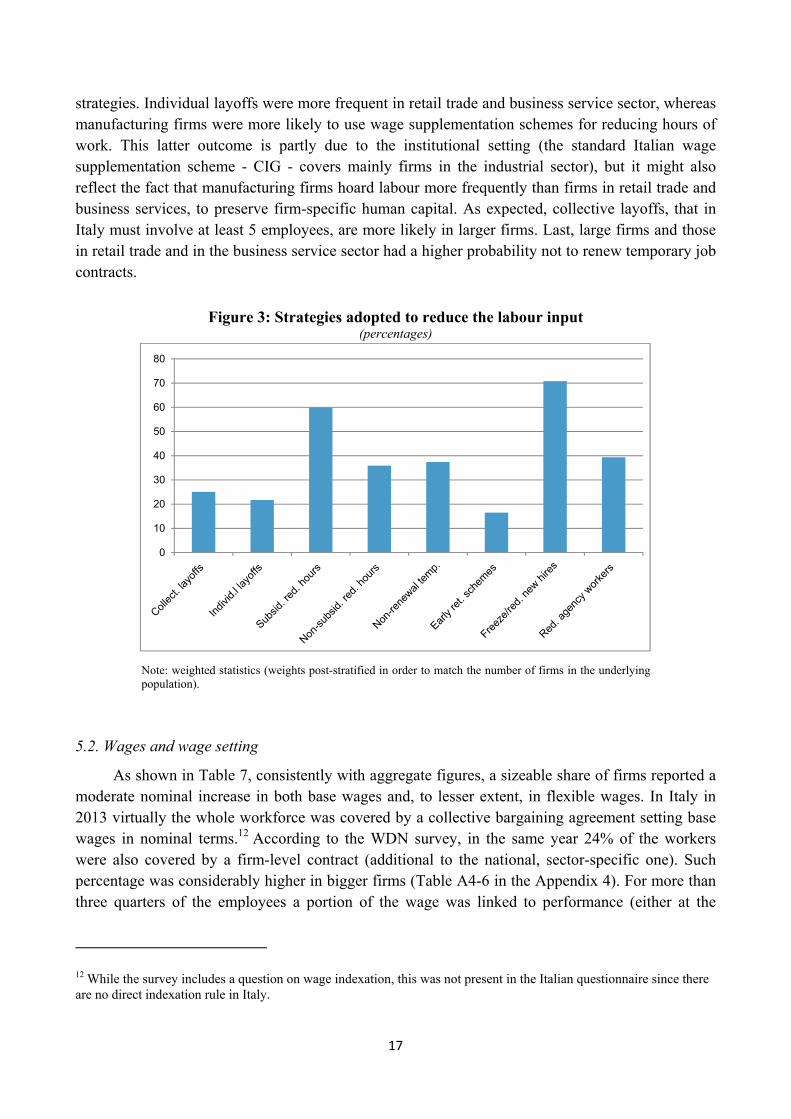
The WDN questionnaire asked firms whether they undertook the following actions to reduce labour input during the period 2010-13: (1) Collective layoffs; (2) Individual layoffs; (3) Subsidized reduction of hours worked (CIG); (4) Non-subsidized reduction of hours worked; (5) Non-renewal of temporary contracts; (6) Early retirement schemes; (7) Freeze/reduction of new hires; (8) Freeze/reduction of agency workers. According to the results each firm used, on average, more than three channels. Figure 3 reports the share of firms using each instrument at least once, during the reference period.
The share of firms that reduced hires between 2010 and 2013 is remarkably high (70%).11 The second most used instrument was the subsidized reduction of hours worked (60%); more than 30% of firms recurred also to a non-subsidized reduction of hours, confirming that Italian firms have a high propensity to adjust the intensive margin of labour, as occurred also during the 2008-09 recession. A reduction in labour input through the extensive margin was also achieved through the non-renewal of temporary job contracts and by the use of collective and individual layoffs.
The propensity to use a given instrument depends also on firm characteristics. As before, in Table A4-5 we report the probit estimates of the probability of following each of the mentioned
11 In that period the increase in unemployment was mostly driven by the job finding margin (Rosolia, 2014).
17
strategies. Individual layoffs were more frequent in retail trade and business service sector, whereas manufacturing firms were more likely to use wage supplementation schemes for reducing hours of work. This latter outcome is partly due to the institutional setting (the standard Italian wage supplementation scheme - CIG - covers mainly firms in the industrial sector), but it might also reflect the fact that manufacturing firms hoard labour more frequently than firms in retail trade and business services, to preserve firm-specific human capital. As expected, collective layoffs, that in Italy must involve at least 5 employees, are more likely in larger firms. Last, large firms and those in retail trade and in the business service sector had a higher probability not to renew temporary job contracts.
Figure 3: Strategies adopted to reduce the labour input (percentages)
Note: weighted statistics (weights post-stratified in order to match the number of firms in the underlying population).
5.2. Wages and wage setting
As shown in Table 7, consistently with aggregate figures, a sizeable share of firms reported a moderate nominal increase in both base wages and, to lesser extent, in flexible wages. In Italy in 2013 virtually the whole workforce was covered by a collective bargaining agreement setting base wages in nominal terms.12 According to the WDN survey, in the same year 24% of the workers were also covered by a firm-level contract (additional to the national, sector-specific one). Such percentage was considerably higher in bigger firms (Table A4-6 in the Appendix 4). For more than three quarters of the employees a portion of the wage was linked to performance (either at the
12 While the survey includes a question on wage indexation, this was not present in the Italian questionnaire since there are no direct indexation rule in Italy.
0
10
20
30
40
50
60
70
80
18
individual or at the firm level). Among them, the incidence of performance related pay over total pay was nevertheless low: slightly above 7% of total wage.
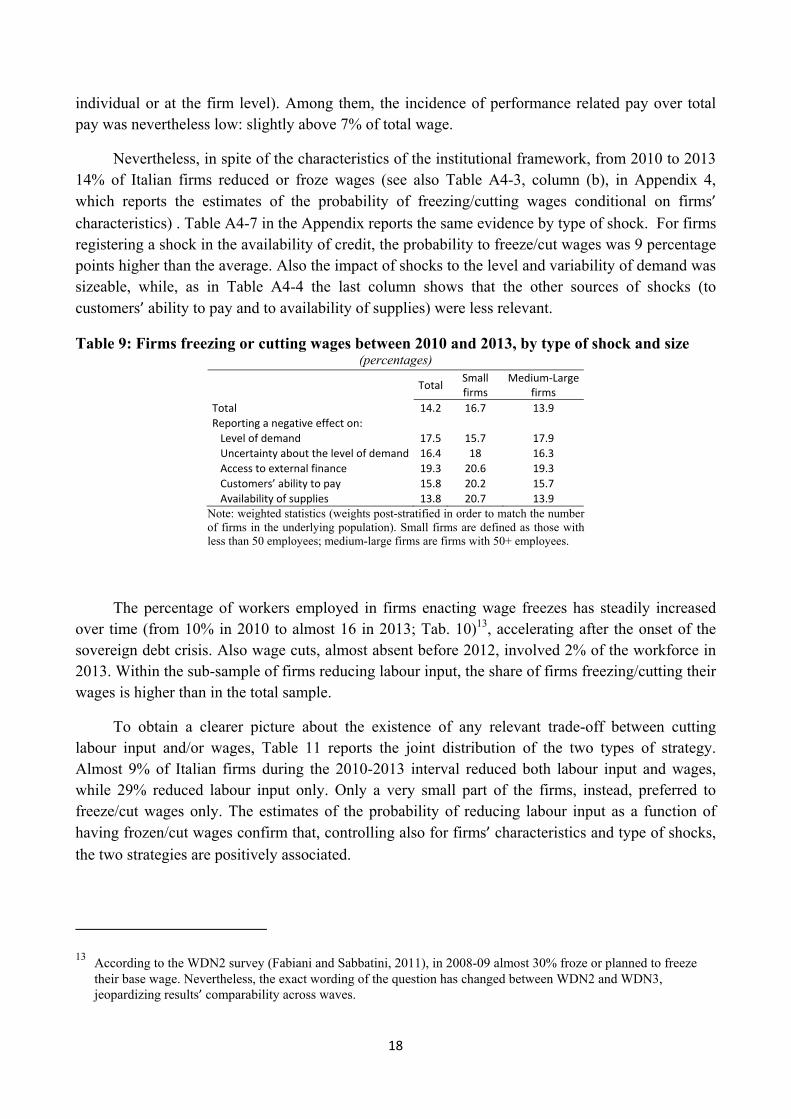
Nevertheless, in spite of the characteristics of the institutional framework, from 2010 to 2013 14% of Italian firms reduced or froze wages (see also Table A4-3, column (b), in Appendix 4, which reports the estimates of the probability of freezing/cutting wages conditional on firms’ characteristics) . Table A4-7 in the Appendix reports the same evidence by type of shock. For firms registering a shock in the availability of credit, the probability to freeze/cut wages was 9 percentage points higher than the average. Also the impact of shocks to the level and variability of demand was sizeable, while, as in Table A4-4 the last column shows that the other sources of shocks (to customers’ ability to pay and to availability of supplies) were less relevant.
Table 9: Firms freezing or cutting wages between 2010 and 2013, by type of shock and size (percentages)
Total Small firms
Medium-Large firms
Total 14.2 16.7 13.9 Reporting a negative effect on: Level of demand 17.5 15.7 17.9 Uncertainty about the level of demand 16.4 18 16.3 Access to external finance 19.3 20.6 19.3 Customers’ ability to pay 15.8 20.2 15.7 Availability of supplies 13.8 20.7 13.9
Note: weighted statistics (weights post-stratified in order to match the number of firms in the underlying population). Small firms are defined as those with less than 50 employees; medium-large firms are firms with 50+ employees.
The percentage of workers employed in firms enacting wage freezes has steadily increased over time (from 10% in 2010 to almost 16 in 2013; Tab. 10)13, accelerating after the onset of the sovereign debt crisis. Also wage cuts, almost absent before 2012, involved 2% of the workforce in 2013. Within the sub-sample of firms reducing labour input, the share of firms freezing/cutting their wages is higher than in the total sample.
To obtain a clearer picture about the existence of any relevant trade-off between cutting labour input and/or wages, Table 11 reports the joint distribution of the two types of strategy. Almost 9% of Italian firms during the 2010-2013 interval reduced both labour input and wages, while 29% reduced labour input only. Only a very small part of the firms, instead, preferred to freeze/cut wages only. The estimates of the probability of reducing labour input as a function of having frozen/cut wages confirm that, controlling also for firms’ characteristics and type of shocks,
the two strategies are positively associated.
13 According to the WDN2 survey (Fabiani and Sabbatini, 2011), in 2008-09 almost 30% froze or planned to freeze their base wage. Nevertheless, the exact wording of the question has changed between WDN2 and WDN3, jeopardizing results’ comparability across waves.
19
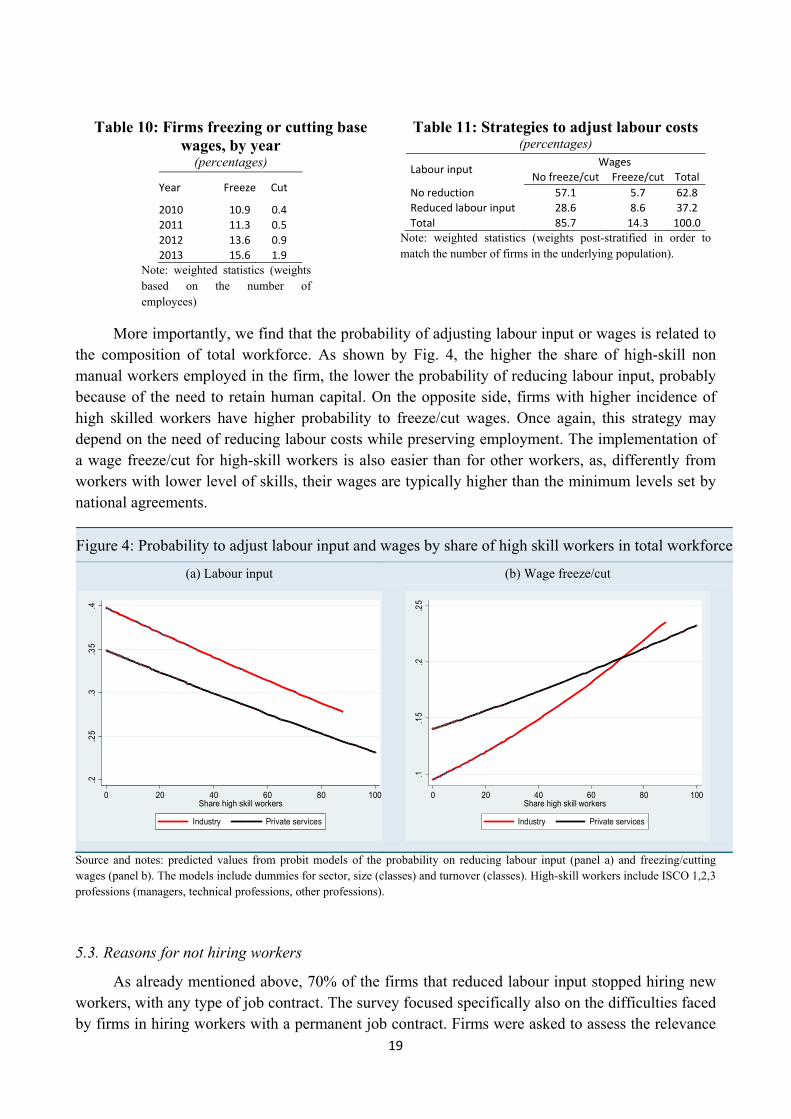
Table 10: Firms freezing or cutting base wages, by year
(percentages)
Year Freeze Cut
2010 10.9 0.4 2011 11.3 0.5 2012 13.6 0.9 2013 15.6 1.9
Note: weighted statistics (weights based on the number of employees)
Table 11: Strategies to adjust labour costs (percentages)
Labour input Wages No freeze/cut Freeze/cut Total
No reduction 57.1 5.7 62.8 Reduced labour input 28.6 8.6 37.2 Total 85.7 14.3 100.0
Note: weighted statistics (weights post-stratified in order to match the number of firms in the underlying population).
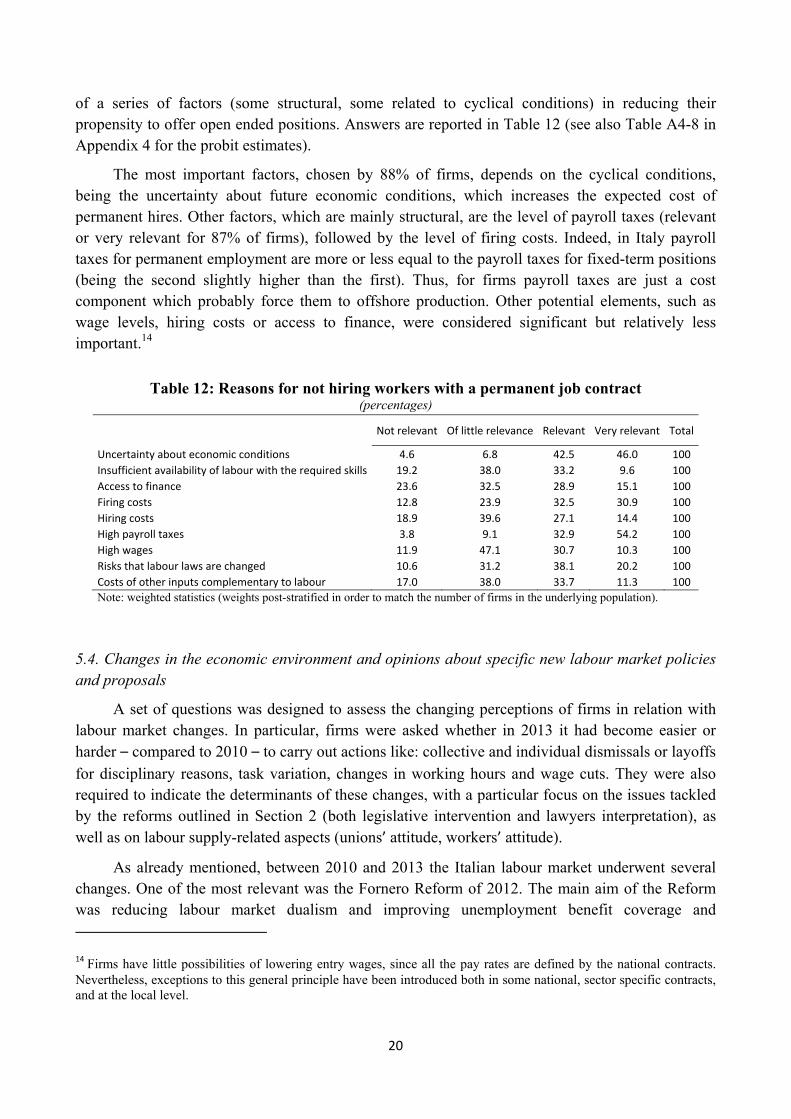
More importantly, we find that the probability of adjusting labour input or wages is related to the composition of total workforce. As shown by Fig. 4, the higher the share of high-skill non manual workers employed in the firm, the lower the probability of reducing labour input, probably because of the need to retain human capital. On the opposite side, firms with higher incidence of high skilled workers have higher probability to freeze/cut wages. Once again, this strategy may depend on the need of reducing labour costs while preserving employment. The implementation of a wage freeze/cut for high-skill workers is also easier than for other workers, as, differently from workers with lower level of skills, their wages are typically higher than the minimum levels set by national agreements.
Figure 4: Probability to adjust labour input and wages by share of high skill workers in total workforce
(a) Labour input (b) Wage freeze/cut
Source and notes: predicted values from probit models of the probability on reducing labour input (panel a) and freezing/cutting wages (panel b). The models include dummies for sector, size (classes) and turnover (classes). High-skill workers include ISCO 1,2,3 professions (managers, technical professions, other professions).
5.3. Reasons for not hiring workers
As already mentioned above, 70% of the firms that reduced labour input stopped hiring new workers, with any type of job contract. The survey focused specifically also on the difficulties faced by firms in hiring workers with a permanent job contract. Firms were asked to assess the relevance
.2.2
5.3
.35
.4
0 20 40 60 80 100Share high skill workers
Industry Private services
.1.1
5.2
.25
0 20 40 60 80 100Share high skill workers
Industry Private services
20
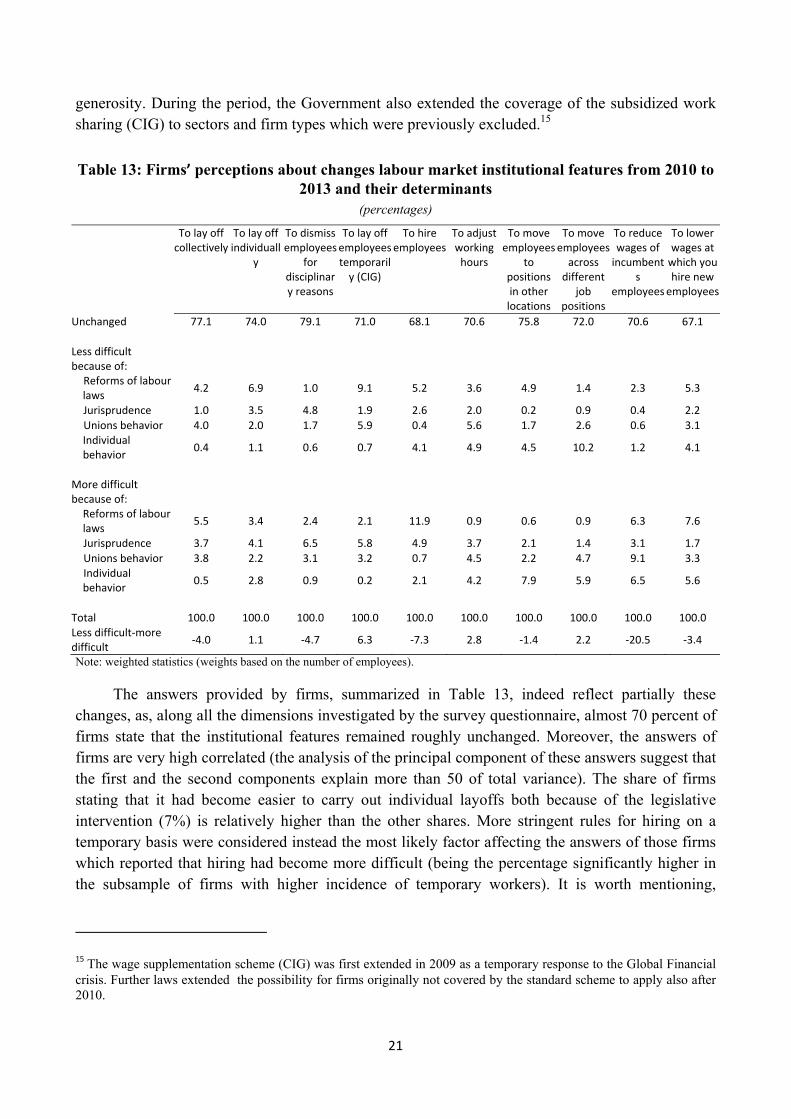
of a series of factors (some structural, some related to cyclical conditions) in reducing their propensity to offer open ended positions. Answers are reported in Table 12 (see also Table A4-8 in Appendix 4 for the probit estimates).
The most important factors, chosen by 88% of firms, depends on the cyclical conditions, being the uncertainty about future economic conditions, which increases the expected cost of permanent hires. Other factors, which are mainly structural, are the level of payroll taxes (relevant or very relevant for 87% of firms), followed by the level of firing costs. Indeed, in Italy payroll taxes for permanent employment are more or less equal to the payroll taxes for fixed-term positions (being the second slightly higher than the first). Thus, for firms payroll taxes are just a cost component which probably force them to offshore production. Other potential elements, such as wage levels, hiring costs or access to finance, were considered significant but relatively less important.14
Table 12: Reasons for not hiring workers with a permanent job contract (percentages)
Not relevant Of little relevance Relevant Very relevant Total
Uncertainty about economic conditions 4.6 6.8 42.5 46.0 100 Insufficient availability of labour with the required skills 19.2 38.0 33.2 9.6 100 Access to finance 23.6 32.5 28.9 15.1 100 Firing costs 12.8 23.9 32.5 30.9 100 Hiring costs 18.9 39.6 27.1 14.4 100 High payroll taxes 3.8 9.1 32.9 54.2 100 High wages 11.9 47.1 30.7 10.3 100 Risks that labour laws are changed 10.6 31.2 38.1 20.2 100 Costs of other inputs complementary to labour 17.0 38.0 33.7 11.3 100
Note: weighted statistics (weights post-stratified in order to match the number of firms in the underlying population).
5.4. Changes in the economic environment and opinions about specific new labour market policies and proposals
A set of questions was designed to assess the changing perceptions of firms in relation with labour market changes. In particular, firms were asked whether in 2013 it had become easier or harder – compared to 2010 – to carry out actions like: collective and individual dismissals or layoffs
for disciplinary reasons, task variation, changes in working hours and wage cuts. They were also required to indicate the determinants of these changes, with a particular focus on the issues tackled by the reforms outlined in Section 2 (both legislative intervention and lawyers interpretation), as well as on labour supply-related aspects (unions’ attitude, workers’ attitude).
As already mentioned, between 2010 and 2013 the Italian labour market underwent several changes. One of the most relevant was the Fornero Reform of 2012. The main aim of the Reform was reducing labour market dualism and improving unemployment benefit coverage and
14 Firms have little possibilities of lowering entry wages, since all the pay rates are defined by the national contracts. Nevertheless, exceptions to this general principle have been introduced both in some national, sector specific contracts, and at the local level.
21
generosity. During the period, the Government also extended the coverage of the subsidized work sharing (CIG) to sectors and firm types which were previously excluded.15
Table 13: Firms’ perceptions about changes labour market institutional features from 2010 to 2013 and their determinants
(percentages)
To lay off collectively
To lay off individuall
y
To dismiss employees
for disciplinary reasons
To lay off employees temporaril
y (CIG)
To hire employees
To adjust working
hours
To move employees
to positions in other
locations
To move employees
across different
job positions
To reduce wages of
incumbents
employees
To lower wages at
which you hire new
employees
Unchanged 77.1 74.0 79.1 71.0 68.1 70.6 75.8 72.0 70.6 67.1 Less difficult because of:
Reforms of labour laws 4.2 6.9 1.0 9.1 5.2 3.6 4.9 1.4 2.3 5.3
Jurisprudence 1.0 3.5 4.8 1.9 2.6 2.0 0.2 0.9 0.4 2.2 Unions behavior 4.0 2.0 1.7 5.9 0.4 5.6 1.7 2.6 0.6 3.1 Individual behavior 0.4 1.1 0.6 0.7 4.1 4.9 4.5 10.2 1.2 4.1
More difficult because of:
Reforms of labour laws 5.5 3.4 2.4 2.1 11.9 0.9 0.6 0.9 6.3 7.6
Jurisprudence 3.7 4.1 6.5 5.8 4.9 3.7 2.1 1.4 3.1 1.7 Unions behavior 3.8 2.2 3.1 3.2 0.7 4.5 2.2 4.7 9.1 3.3 Individual behavior 0.5 2.8 0.9 0.2 2.1 4.2 7.9 5.9 6.5 5.6
Total 100.0 100.0 100.0 100.0 100.0 100.0 100.0 100.0 100.0 100.0 Less difficult-more difficult -4.0 1.1 -4.7 6.3 -7.3 2.8 -1.4 2.2 -20.5 -3.4
Note: weighted statistics (weights based on the number of employees).
The answers provided by firms, summarized in Table 13, indeed reflect partially these changes, as, along all the dimensions investigated by the survey questionnaire, almost 70 percent of firms state that the institutional features remained roughly unchanged. Moreover, the answers of firms are very high correlated (the analysis of the principal component of these answers suggest that the first and the second components explain more than 50 of total variance). The share of firms stating that it had become easier to carry out individual layoffs both because of the legislative intervention (7%) is relatively higher than the other shares. More stringent rules for hiring on a temporary basis were considered instead the most likely factor affecting the answers of those firms which reported that hiring had become more difficult (being the percentage significantly higher in the subsample of firms with higher incidence of temporary workers). It is worth mentioning,
15 The wage supplementation scheme (CIG) was first extended in 2009 as a temporary response to the Global Financial crisis. Further laws extended the possibility for firms originally not covered by the standard scheme to apply also after 2010.
22
however, that the curb in the rules on temporary hiring introduced by the Fornero Reform was subsequently relaxed in 2013 (Law 99/2013) and in 2014 (Law 78/2014).
Also the use of CIG and other actions to reduce working hours had become easier according to firms, also because of a higher propensity of unions and workers to accept them. A great change in perceptions relates to the increase in the possibilities of moving workers across different job tasks, attributable to the reduction in workers’ opposition compared to the past. In Italy, at the time
of the interview assigning workers to lower tasks is in general forbidden by the law, but de facto permitted when this is the only way to preserve the employment relationship.16 . Last, Italian firms confirmed the difficulties in adjusting wages, mainly because of the opposition of unions.
The assessment on the evolution of the Italian labour market institutional features does not show systematic patterns across firms with different characteristics (see Table A4-9 in Appendix 4).
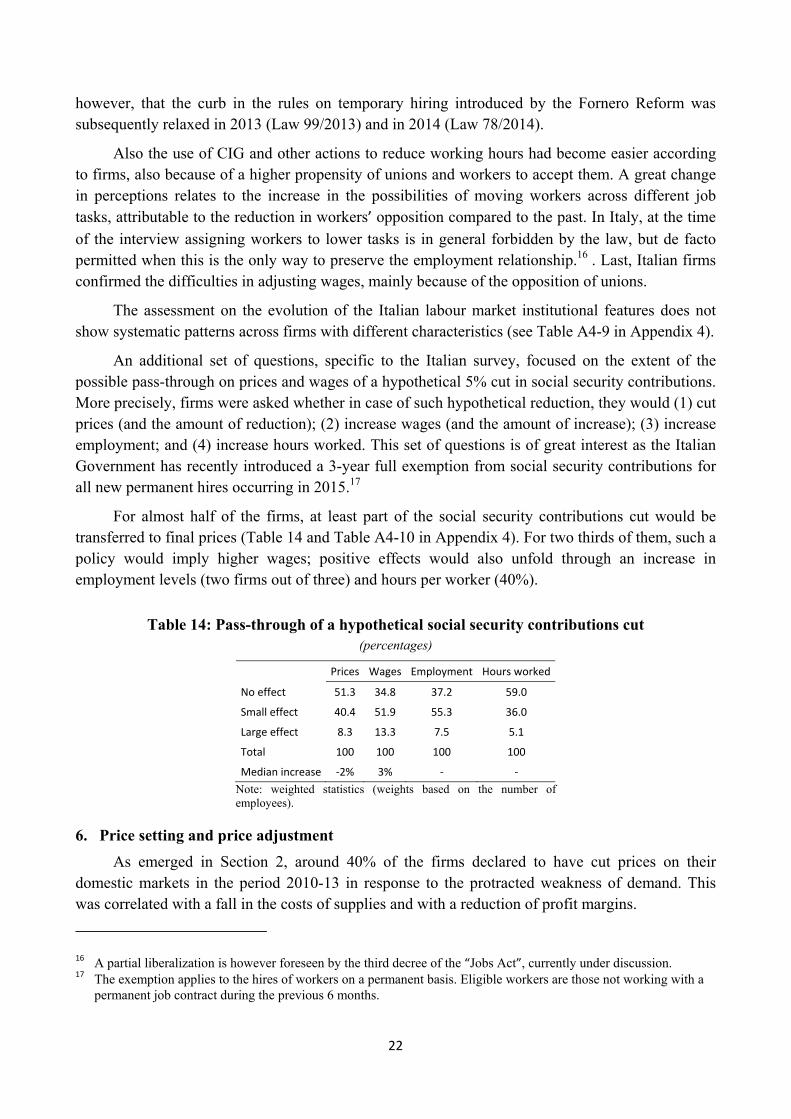
An additional set of questions, specific to the Italian survey, focused on the extent of the possible pass-through on prices and wages of a hypothetical 5% cut in social security contributions. More precisely, firms were asked whether in case of such hypothetical reduction, they would (1) cut prices (and the amount of reduction); (2) increase wages (and the amount of increase); (3) increase employment; and (4) increase hours worked. This set of questions is of great interest as the Italian Government has recently introduced a 3-year full exemption from social security contributions for all new permanent hires occurring in 2015.17
For almost half of the firms, at least part of the social security contributions cut would be transferred to final prices (Table 14 and Table A4-10 in Appendix 4). For two thirds of them, such a policy would imply higher wages; positive effects would also unfold through an increase in employment levels (two firms out of three) and hours per worker (40%).
Table 14: Pass-through of a hypothetical social security contributions cut (percentages)
Prices Wages Employment Hours worked
No effect 51.3 34.8 37.2 59.0
Small effect 40.4 51.9 55.3 36.0
Large effect 8.3 13.3 7.5 5.1
Total 100 100 100 100
Median increase -2% 3% - - Note: weighted statistics (weights based on the number of employees).
6. Price setting and price adjustment
As emerged in Section 2, around 40% of the firms declared to have cut prices on their domestic markets in the period 2010-13 in response to the protracted weakness of demand. This was correlated with a fall in the costs of supplies and with a reduction of profit margins.
16 A partial liberalization is however foreseen by the third decree of the “Jobs Act”, currently under discussion. 17 The exemption applies to the hires of workers on a permanent basis. Eligible workers are those not working with a
permanent job contract during the previous 6 months.
23
The final section of the Italian questionnaire addresses more in depth the issue of pricing, collecting specific information on how prices are set and, in particular, how price adjustment has been affected in the context of the new economic environment generated by the crisis. The objective is to gauge the main reasons underlying such changes. A few quantitative questions, despite non negligible differences in formulation, try to preserve the continuity with the previous Eurosystem surveys. More specifically, the main issues concern: (i) the rule according to which the price of the main product or service is typically set; (ii) the frequency with which prices are adjusted and whether this has changed compared to the years before the crisis.
6.1 Price setting
Companies were asked to indicate how they set the price of their main product or service, defined as the one that generated the highest turnover in the period 2010-13. A distinction is made between firms that do not/cannot follow an independent policy, and those that decide their prices autonomously. The first category includes entities whose price for the main product is either set by a parent firm, or regulated, or determined by the main customers. For companies in the second category the questionnaire identifies three distinct strategies: they could (i) be price followers of their main competitors, (ii) decide prices according to a mark-up on their marginal costs, (iii) negotiate prices with individual customers.
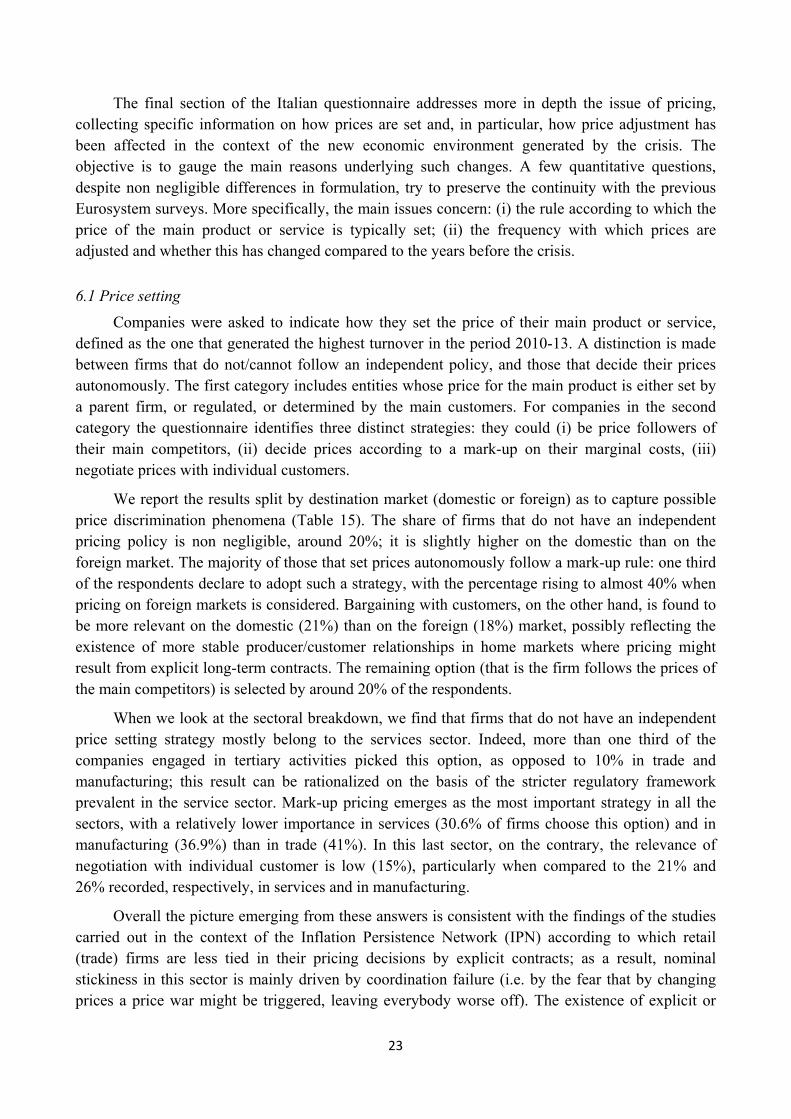
We report the results split by destination market (domestic or foreign) as to capture possible price discrimination phenomena (Table 15). The share of firms that do not have an independent pricing policy is non negligible, around 20%; it is slightly higher on the domestic than on the foreign market. The majority of those that set prices autonomously follow a mark-up rule: one third of the respondents declare to adopt such a strategy, with the percentage rising to almost 40% when pricing on foreign markets is considered. Bargaining with customers, on the other hand, is found to be more relevant on the domestic (21%) than on the foreign (18%) market, possibly reflecting the existence of more stable producer/customer relationships in home markets where pricing might result from explicit long-term contracts. The remaining option (that is the firm follows the prices of the main competitors) is selected by around 20% of the respondents.
When we look at the sectoral breakdown, we find that firms that do not have an independent price setting strategy mostly belong to the services sector. Indeed, more than one third of the companies engaged in tertiary activities picked this option, as opposed to 10% in trade and manufacturing; this result can be rationalized on the basis of the stricter regulatory framework prevalent in the service sector. Mark-up pricing emerges as the most important strategy in all the sectors, with a relatively lower importance in services (30.6% of firms choose this option) and in manufacturing (36.9%) than in trade (41%). In this last sector, on the contrary, the relevance of negotiation with individual customer is low (15%), particularly when compared to the 21% and 26% recorded, respectively, in services and in manufacturing.
Overall the picture emerging from these answers is consistent with the findings of the studies carried out in the context of the Inflation Persistence Network (IPN) according to which retail (trade) firms are less tied in their pricing decisions by explicit contracts; as a result, nominal stickiness in this sector is mainly driven by coordination failure (i.e. by the fear that by changing prices a price war might be triggered, leaving everybody worse off). The existence of explicit or
24
implicit nominal contracts, on the other hand, is the prevailing factor behind price stickiness in the other sectors.18
Table 15: Price setting rule for the main product or service by destination market (percentages)
Domestic market
Foreign market
Main market
There is no autonomous price setting policy (parent group, regulated, main customer(s)) 21.0 15.8 20.0
The price is set following the main competitors 19.4 21.8 18.9
The price is set fully according to costs and a completely self-determined profit margin 33.7 39.6 35.0
Negotiated with individual customers 21.2 17.8 21.4 Other 4.8 5.0 4.7
Note: weighted statistics (weights post-stratified in order to match the number of firms in the underlying population).
6.2 Price adjustment
Turning to the frequency of price adjustment and whether it changed compared to the pre-2008 years, firms were first asked to indicate how often they actually adjusted the price of their main product between 2010 and 2013.19 Then, they had to compare their behavior in such a period to that prevailing before 2008; in case they reported significant differences, they had to select the most relevant explanation among a set of proposed options. At the end of the section we will investigate this issue from a different perspective, by directly comparing the answers to those collected in the first wave of the WDN survey.
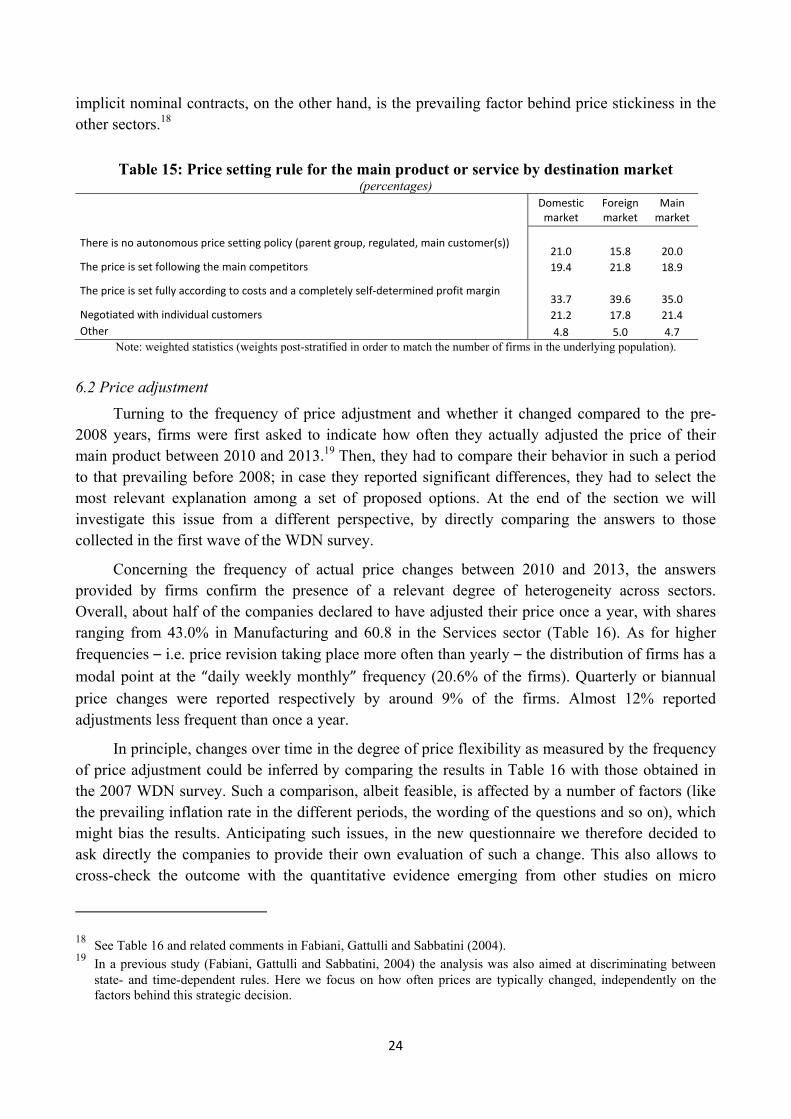
Concerning the frequency of actual price changes between 2010 and 2013, the answers provided by firms confirm the presence of a relevant degree of heterogeneity across sectors. Overall, about half of the companies declared to have adjusted their price once a year, with shares ranging from 43.0% in Manufacturing and 60.8 in the Services sector (Table 16). As for higher frequencies – i.e. price revision taking place more often than yearly – the distribution of firms has a
modal point at the “daily weekly monthly” frequency (20.6% of the firms). Quarterly or biannual
price changes were reported respectively by around 9% of the firms. Almost 12% reported adjustments less frequent than once a year.
In principle, changes over time in the degree of price flexibility as measured by the frequency of price adjustment could be inferred by comparing the results in Table 16 with those obtained in the 2007 WDN survey. Such a comparison, albeit feasible, is affected by a number of factors (like the prevailing inflation rate in the different periods, the wording of the questions and so on), which might bias the results. Anticipating such issues, in the new questionnaire we therefore decided to ask directly the companies to provide their own evaluation of such a change. This also allows to cross-check the outcome with the quantitative evidence emerging from other studies on micro
18 See Table 16 and related comments in Fabiani, Gattulli and Sabbatini (2004). 19 In a previous study (Fabiani, Gattulli and Sabbatini, 2004) the analysis was also aimed at discriminating between
state- and time-dependent rules. Here we focus on how often prices are typically changed, independently on the factors behind this strategic decision.
25
(Fabiani and Porqueddu, 2015) and macro (Riggi and Venditti, 2015) data, that consistently indicate an increase in price flexibility in Italy in recent years, related to the prolonged and severe economic downturn since 2009.
Table 16: Frequency of price changes in 2010-2013 by sector (percentages)
Share of firms reporting
Manufacturing Trade Services Total
daily weekly monthly 21.7 16.7 21.6 20.6 quarterly 12.7 7.4 6.7 8.9 biannually 6.8 10.0 9.5 8.7 yearly 43.0 60.8 50.0 49.9 less than yearly 15.9 5.1 12.1 11.9
Note: weighted statistics (weights post-stratified in order to match the number of firms in the underlying population).
The firms’ answers confirm that indeed a large share of companies have adapted their pricing strategy to the profound changes in the economic landscape in the last few years (Table 17), as half of them reported to have changed the timing of their pricing decisions. Among these, 70% increased the frequency of price adjustment, while 30% reduced it. Differences across sectors are sizeable. While the behavior in trade is relatively stable (with 64% of the firms reporting unchanged frequency), in services over 40% of the companies reset prices more frequently than in the period before the crisis. Considering the large share that services prices have in the consumer price index, this outcome resonates with the analysis on core (net of food and energy) inflation in Riggi and Venditti (2014).20
Table 17: Change in frequency of price adjustment (2010-13 compared with the pre-2008 period; percentages)
Share of firms reporting:
Manufacturing Trade Services Total
Yes, more frequently 32.5 29.2 41.2 35.6
Yes, less frequently 14.5 7.1 16.2 13.6
No 53.0 63.7 42.6 50.8 Note: weighted statistics (weights post-stratified in order to match the number of firms in the underlying population).
These results are broadly consistent with those emerging from the direct comparison of the answers provided by a common subset of firms to the same question submitted in 2007 (WDN1 survey) and in 2014 (WDN3 survey). In particular, there is evidence of a strong increase in the
20 Riggi and Venditti (2014) find that in Italy, following the Sovereign debt crisis, core inflation has become significantly more sensitive to the output gap. Using a general equilibrium model featuring nominal rigidities they show that this empirical evidence can be rationalized by an increase in the frequency of price adjustment.
26
typical frequency of price adjustment by manufacturing and services firms (see Table A4-11 in Appendix 4).21
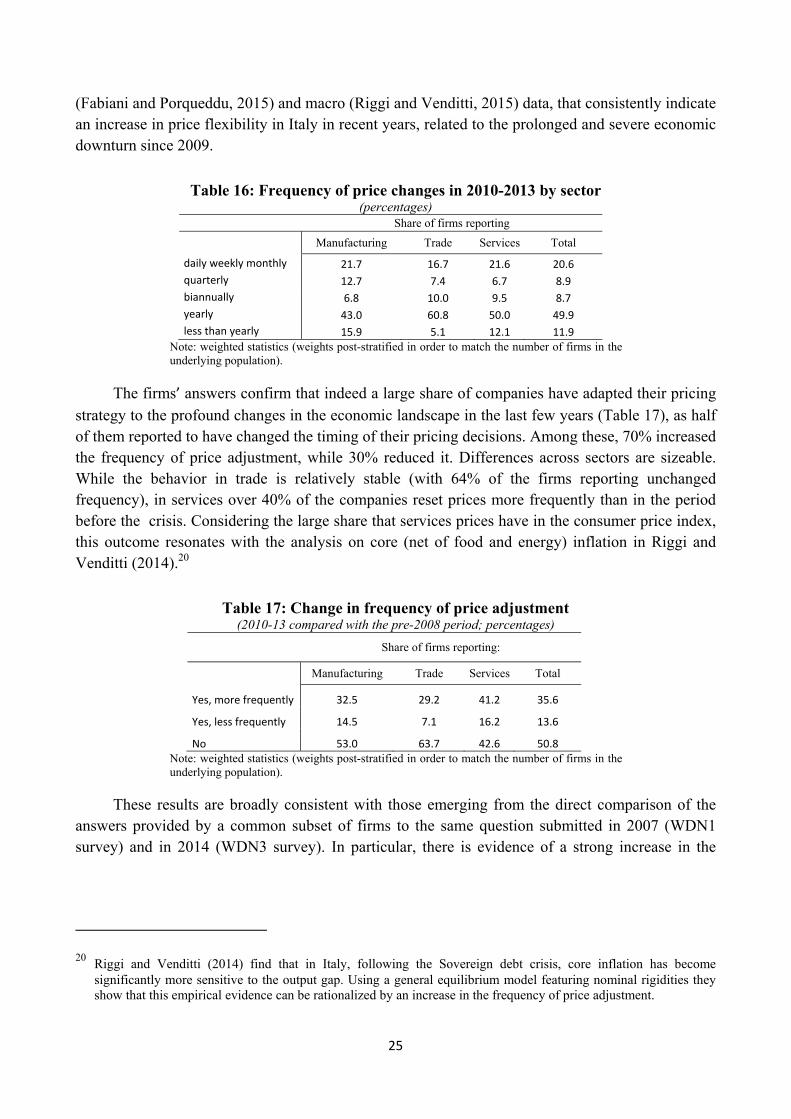
In order to discriminate among possible explanations for the differences in firms behavior in recent years, companies that declared to have changed the frequency of their price adjustment were also asked to rank a number of factors that drove such changes, that is: “more (less) volatile
demand”, “more (less) frequent changes in labour costs”, “more (less) frequent changes in other
input costs”, “stronger (weaker) competition in the main product market”, “more (less) frequent
price changes by main competitors” (Table 18). For companies that reported to have reviewed their
prices more often than in the past, this is due mainly to a more competitive environment (both “stronger competition in the main product market” and “more frequent price changes by the main
competitors” rank the highest); instead, factors related to the frequency of change of input costs are
ranked the lowest. On the contrary, stickier input costs are key for firms that reported a lower frequency of price changes.
Table 18: Reasons behind a change in the frequency of price adjustment (percentages)
Higher frequency Mean scores Lower frequency Mean scores
More volatile demand 3.2 Less volatile demand 2.7
More frequent changes in labour costs 2.5 Less frequent changes in labour costs 3.1
More frequent changes in other input costs 2.8 Less frequent changes in other input costs 3.5 Stronger competition in the main product market 3.6 Weaker competition in the main product
market 3.2
More frequent price changes by main competitors 3.6 Less frequent price changes by main
competitors 2.9
Note: weighted statistics (weights post-stratified in order to match the number of firms in the underlying population).
Probit estimates that model the probability of an increase in the frequency of price changes in 2010-13 as compared to the pre-2008 period as a function of individual characteristics, the increase in competitive pressures, wage developments and the intensity of exogenous shocks at the firm level confirm a positive correlation between more frequent price changes and a stronger competition on the domestic market; firms that froze wages, reduced their profit margins, suffered particularly severe difficulties in accessing external finance and in obtaining supplies were also more likely to adjust prices more often (Table A4-11 in Appendix 4).
Taken together, these explanations speak directly to the roots of the disinflation process observed in Italy after the Sovereign debt crisis. On the one hand, we find a set of firms that are pressed by the increased competition induced by the crisis and for which keeping prices unchanged has become relatively more costly (in terms of market shares) than in the past. They therefore have
21 This comparison has to be interpreted with caution since the percentages reported in Table A do not take into account sampling weights. We chose to compare un-weighted percentages because sampling weights do not capture the probability that a given firm took part to both surveys. This comparison is made between unweighted percentages, because sampling weights do not capture the probability that a given firm took part to both surveys.
27
higher incentives to change their prices more frequently (possibly downward), in light of the stronger competitive pressure.22 On the other hand, there are firms that have benefitted from relatively stable commodity prices (also due to the appreciation of the euro). The prices of these firms have adjusted less frequently than in 2008 when they had probably often felt the upward pressure exercised by commodity prices right before the crisis.
7. Conclusions
This paper summarizes the most important transformations in the Italian labour market occurred in the years 2010-13 both in wage bargaining institutions and in employment protection legislation as a reaction to the exceptional deterioration of the economic outlook; it also assesses how they impacted on the workforce and on the use of different adjustment margins at the firm level. Finally, the paper explores whether and how pricing strategies were affected.
The empirical analysis relies on survey evidence collected in the summer of 2014 from 1,102 firms of the manufacturing and service sectors with at least 20 employees, through a questionnaire harmonized at the European level. This analysis follows two similar exercises carried out at the end of 2007 and in the first half of 2009.
The sovereign debt crisis hit severely the Italian economy, entailing a collapse in demand, which firms reported as the most disruptive shock, increased uncertainty and higher difficulties in the access to credit, in particular for smaller firms. As a reaction, in the 2010-13 period most of the Italian firms adopted a combination of strategies aimed at both freezing or cutting wages and, more frequently, at reducing labour input. The latter objective was pursued by acting on the number of workers (also through a reduction of hirings) as well as of hours worked (mostly subsidized). This confirms the high propensity to adjust the intensive margin of labour found in the previous surveys. The probability of adjusting the labour input or wages is related to the composition of the workforce: the higher the share of high-skill non manual workers employed in the firm, the lower the probability of reducing the labour input, probably because of the need to retain human capital, and the higher that of freezing or cutting wages.
According to firms, as a consequence of the main labour market reforms (the Fornero Reform of 2012 and the extension of the coverage of the subsidized work sharing) individual layoffs and the reduction of working hours have become easier. Despite the fact that assigning workers to lower tasks was at the time of the survey not allowed by law, firms acknowledged an increased ability to move employees across different job tasks, as it was perceived by workers as the only way to preserve the employment relationship.
The survey evidence is consistent with the moderate nominal wage increase shown by official statistics for the years 2010-13. The firm-level information provided by the three WDN surveys
22 The questionnaire included also a specific question on the changes occurred in the competitive environment between 2010 and 2013. A vast majority of firms (72.8%) reported stronger competitive pressures on the domestic market; the percentage shrinks to 56.7% on the foreign market.

28
indicates, in addition, that the share of firms which froze or cut nominal wages increased over time: the percentage of workers employed in firms enacting wage freezes rose to almost 16% in 2013 compared to 10% in 2010; wage cuts, almost absent before 2012, involved 2% of the workforce in 2013.
Finally, the survey shows that a large share of companies adapted their pricing strategies to the profound changes in the economic landscape, in the direction of a higher flexibility. According to firms this was mainly due to the more competitive environment and the protracted weakness of demand. The probability of adjusting prices correlates strongly with a fall in the costs of supplies and with a reduction of profit margins, suggesting that, in the context of weak demand, firms competed for current and future market shares by giving up current profits.
29
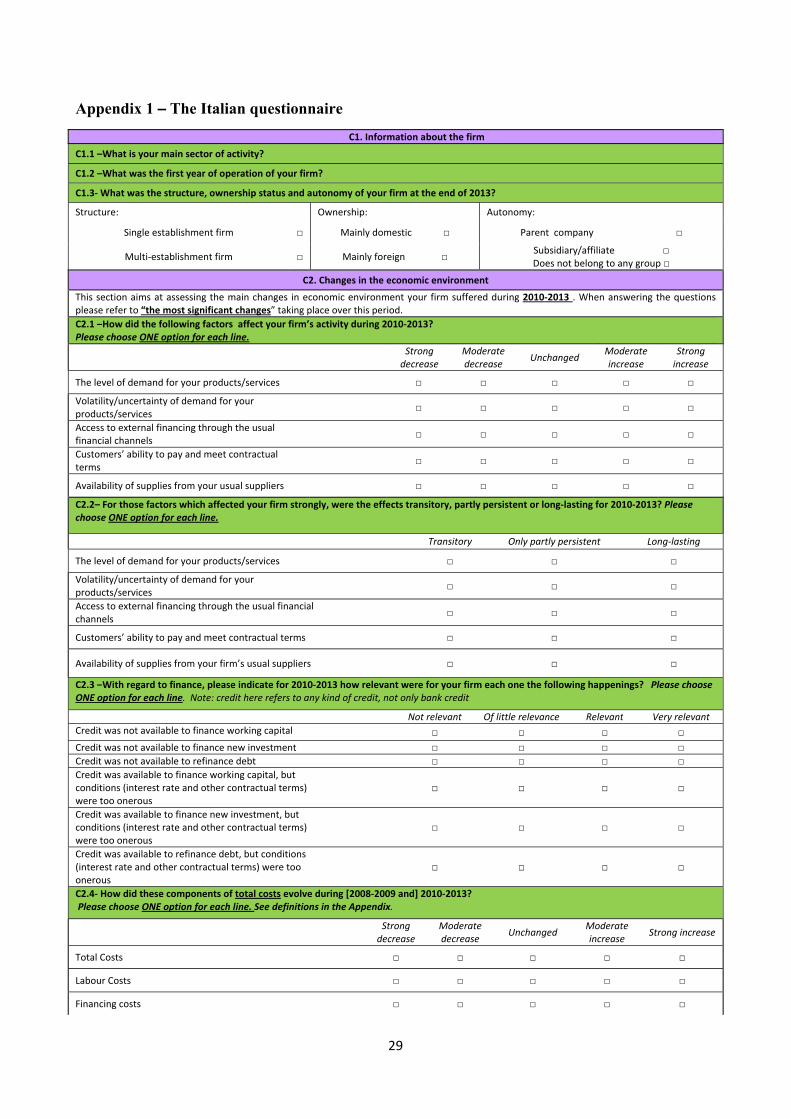
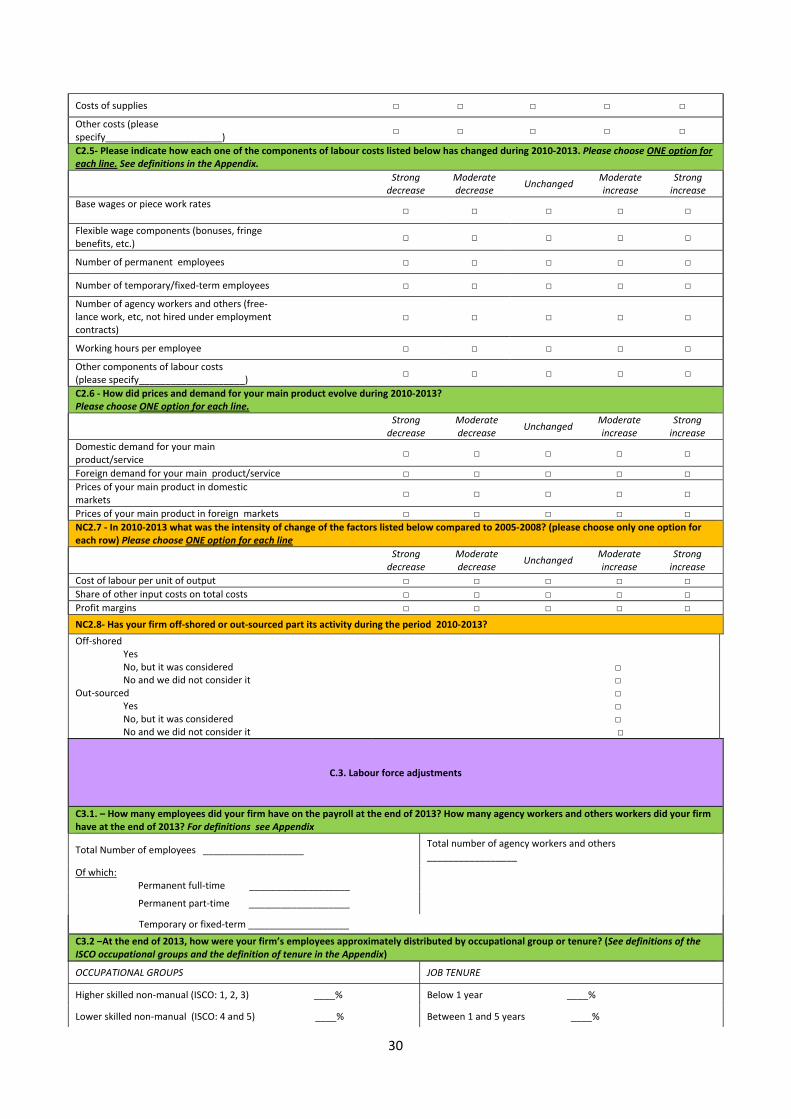
Appendix 1 – The Italian questionnaire
C1. Information about the firmC1.1 –What is your main sector of activity?
C1.2 –What was the first year of operation of your firm?
C1.3- What was the structure, ownership status and autonomy of your firm at the end of 2013?
Structure: Ownership: Autonomy:
Single establishment firm □ Mainly domestic □ Parent company □
Multi-establishment firm □ Mainly foreign □ Subsidiary/affiliate □Does not belong to any group □
C2. Changes in the economic environment This section aims at assessing the main changes in economic environment your firm suffered during 2010-2013 . When answering the questions please refer to “the most significant changes” taking place over this period. C2.1 –How did the following factors affect your firm’s activity during 2010-2013? Please choose ONE option for each line.
Strong decrease
Moderate decrease Unchanged Moderate
increase Strong
increase
The level of demand for your products/services □ □ □ □ □
Volatility/uncertainty of demand for your products/services □ □ □ □ □
Access to external financing through the usual financial channels □ □ □ □ □
Customers’ ability to pay and meet contractual terms □ □ □ □ □
Availability of supplies from your usual suppliers □ □ □ □ □
C2.2– For those factors which affected your firm strongly, were the effects transitory, partly persistent or long-lasting for 2010-2013? Please choose ONE option for each line.
Transitory Only partly persistent Long-lasting
The level of demand for your products/services □ □ □
Volatility/uncertainty of demand for your products/services □ □ □
Access to external financing through the usual financial channels □ □ □
Customers’ ability to pay and meet contractual terms □ □ □
Availability of supplies from your firm’s usual suppliers □ □ □
C2.3 –With regard to finance, please indicate for 2010-2013 how relevant were for your firm each one the following happenings? Please choose ONE option for each line. Note: credit here refers to any kind of credit, not only bank credit
Not relevant Of little relevance Relevant Very relevantCredit was not available to finance working capital □ □ □ □ Credit was not available to finance new investment □ □ □ □Credit was not available to refinance debt □ □ □ □Credit was available to finance working capital, but conditions (interest rate and other contractual terms) were too onerous
□ □ □ □
Credit was available to finance new investment, but conditions (interest rate and other contractual terms) were too onerous
□ □ □ □
Credit was available to refinance debt, but conditions (interest rate and other contractual terms) were too onerous
□ □ □ □
C2.4- How did these components of total costs evolve during [2008-2009 and] 2010-2013? Please choose ONE option for each line. See definitions in the Appendix.
Strong decrease
Moderate decrease Unchanged Moderate
increase Strong increase
Total Costs □ □ □ □ □
Labour Costs □ □ □ □ □
Financing costs □ □ □ □ □
30
Costs of supplies □ □ □ □ □
Other costs (please specify______________________) □ □ □ □ □
C2.5- Please indicate how each one of the components of labour costs listed below has changed during 2010-2013. Please choose ONE option for each line. See definitions in the Appendix.
Strong decrease
Moderate decrease Unchanged Moderate
increase Strong
increase Base wages or piece work rates □ □ □ □ □
Flexible wage components (bonuses, fringe benefits, etc.) □ □ □ □ □
Number of permanent employees □ □ □ □ □
Number of temporary/fixed-term employees □ □ □ □ □
Number of agency workers and others (free-lance work, etc, not hired under employment contracts)
□ □ □ □ □
Working hours per employee □ □ □ □ □
Other components of labour costs (please specify____________________) □ □ □ □ □
C2.6 - How did prices and demand for your main product evolve during 2010-2013? Please choose ONE option for each line.
Strong decrease
Moderate decrease Unchanged Moderate
increase Strong
increase Domestic demand for your main product/service □ □ □ □ □
Foreign demand for your main product/service □ □ □ □ □Prices of your main product in domestic markets □ □ □ □ □
Prices of your main product in foreign markets □ □ □ □ □NC2.7 - In 2010-2013 what was the intensity of change of the factors listed below compared to 2005-2008? (please choose only one option for each row) Please choose ONE option for each line
Strong decrease
Moderate decrease Unchanged Moderate
increase Strong
increase Cost of labour per unit of output □ □ □ □ □Share of other input costs on total costs □ □ □ □ □Profit margins □ □ □ □ □NC2.8- Has your firm off-shored or out-sourced part its activity during the period 2010-2013? Off-shored
Yes No, but it was considered No and we did not consider it
Out-sourced Yes No, but it was considered No and we did not consider it
□ □ □ □ □
□
C.3. Labour force adjustments
C3.1. – How many employees did your firm have on the payroll at the end of 2013? How many agency workers and others workers did your firm have at the end of 2013? For definitions see Appendix
Total Number of employees ___________________ Total number of agency workers and others _________________
Of which: Permanent full-time ___________________
Permanent part-time ___________________
Temporary or fixed-term ___________________
C3.2 –At the end of 2013, how were your firm’s employees approximately distributed by occupational group or tenure? (See definitions of the ISCO occupational groups and the definition of tenure in the Appendix)
OCCUPATIONAL GROUPS JOB TENURE
Higher skilled non-manual (ISCO: 1, 2, 3) ____% Below 1 year ____%
Lower skilled non-manual (ISCO: 4 and 5) ____% Between 1 and 5 years ____%
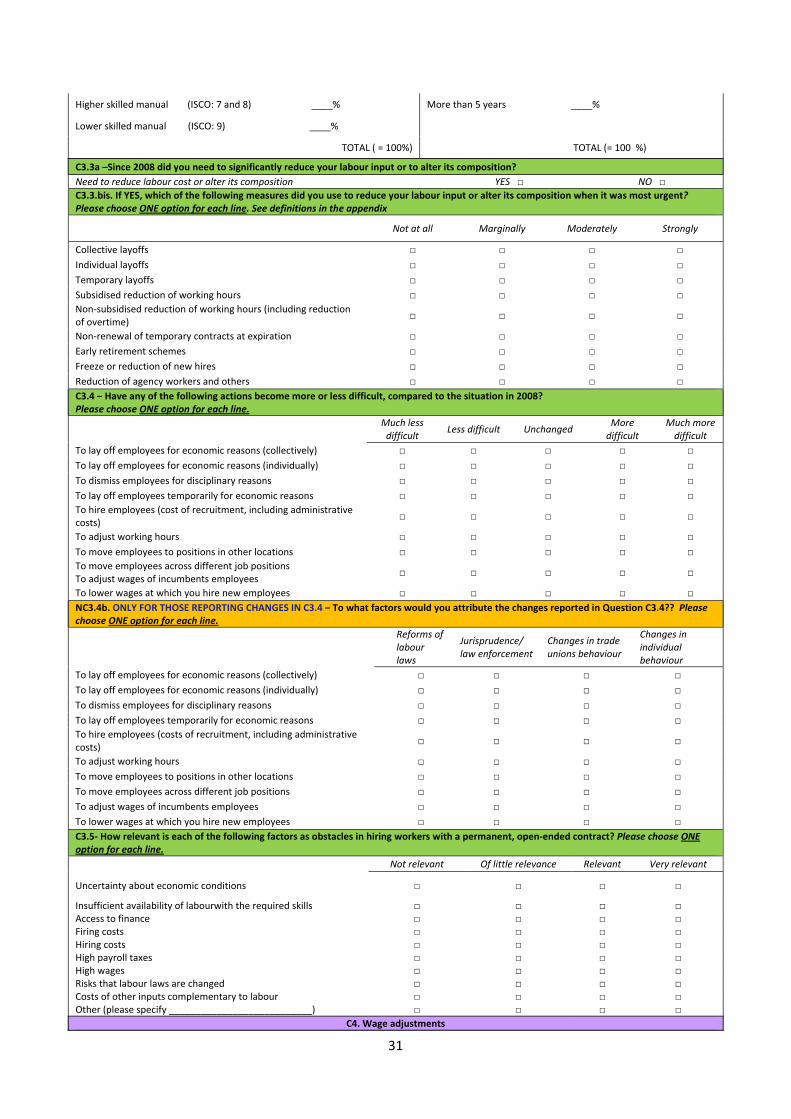
31
Higher skilled manual (ISCO: 7 and 8) ____% More than 5 years ____%
Lower skilled manual (ISCO: 9) ____%
TOTAL ( = 100%) TOTAL (= 100 %)
C3.3a –Since 2008 did you need to significantly reduce your labour input or to alter its composition? Need to reduce labour cost or alter its composition YES □ NO □C3.3.bis. If YES, which of the following measures did you use to reduce your labour input or alter its composition when it was most urgent? Please choose ONE option for each line. See definitions in the appendix Not at all Marginally Moderately Strongly
Collective layoffs □ □ □ □ Individual layoffs □ □ □ □ Temporary layoffs □ □ □ □ Subsidised reduction of working hours □ □ □ □ Non-subsidised reduction of working hours (including reduction of overtime) □ □ □ □
Non-renewal of temporary contracts at expiration □ □ □ □ Early retirement schemes □ □ □ □ Freeze or reduction of new hires □ □ □ □ Reduction of agency workers and others □ □ □ □ C3.4 – Have any of the following actions become more or less difficult, compared to the situation in 2008?Please choose ONE option for each line.
Much less difficult Less difficult Unchanged More
difficult Much more
difficult To lay off employees for economic reasons (collectively) □ □ □ □ □ To lay off employees for economic reasons (individually) □ □ □ □ □ To dismiss employees for disciplinary reasons □ □ □ □ □ To lay off employees temporarily for economic reasons □ □ □ □ □ To hire employees (cost of recruitment, including administrative costs) □ □ □ □ □
To adjust working hours □ □ □ □ □ To move employees to positions in other locations □ □ □ □ □ To move employees across different job positions To adjust wages of incumbents employees □ □ □ □ □
To lower wages at which you hire new employees □ □ □ □ □ NC3.4b. ONLY FOR THOSE REPORTING CHANGES IN C3.4 – To what factors would you attribute the changes reported in Question C3.4?? Please choose ONE option for each line.
Reforms of labour laws
Jurisprudence/ law enforcement
Changes in trade unions behaviour
Changes in individual behaviour
To lay off employees for economic reasons (collectively) □ □ □ □ To lay off employees for economic reasons (individually) □ □ □ □ To dismiss employees for disciplinary reasons □ □ □ □ To lay off employees temporarily for economic reasons □ □ □ □ To hire employees (costs of recruitment, including administrative costs) □ □ □ □
To adjust working hours □ □ □ □ To move employees to positions in other locations □ □ □ □ To move employees across different job positions □ □ □ □ To adjust wages of incumbents employees □ □ □ □ To lower wages at which you hire new employees □ □ □ □ C3.5- How relevant is each of the following factors as obstacles in hiring workers with a permanent, open-ended contract? Please choose ONE option for each line. Not relevant Of little relevance Relevant Very relevant
Uncertainty about economic conditions □ □ □ □
Insufficient availability of labourwith the required skills □ □ □ □Access to finance □ □ □ □Firing costs □ □ □ □Hiring costs □ □ □ □High payroll taxes □ □ □ □High wages □ □ □ □Risks that labour laws are changed □ □ □ □Costs of other inputs complementary to labour □ □ □ □Other (please specify ___________________________) □ □ □ □
C4. Wage adjustments
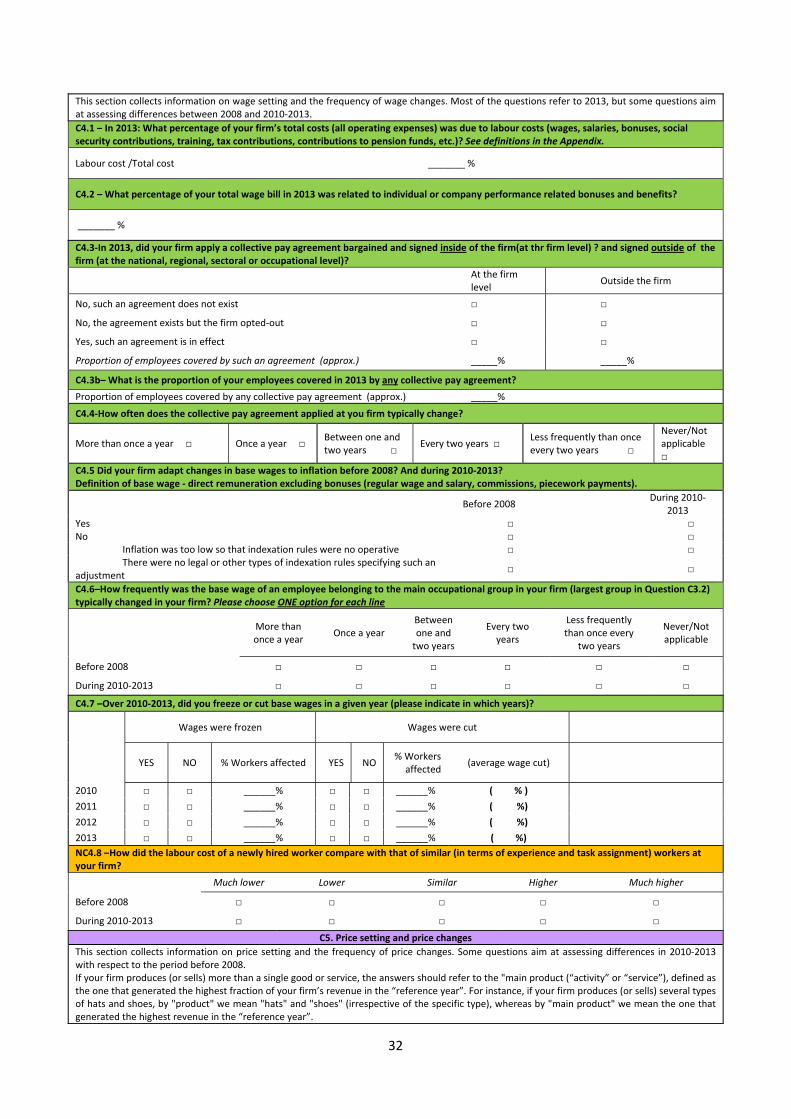
32
This section collects information on wage setting and the frequency of wage changes. Most of the questions refer to 2013, but some questions aim at assessing differences between 2008 and 2010-2013. C4.1 – In 2013: What percentage of your firm’s total costs (all operating expenses) was due to labour costs (wages, salaries, bonuses, social security contributions, training, tax contributions, contributions to pension funds, etc.)? See definitions in the Appendix.
Labour cost /Total cost _______ %
C4.2 – What percentage of your total wage bill in 2013 was related to individual or company performance related bonuses and benefits?
_______ %
C4.3-In 2013, did your firm apply a collective pay agreement bargained and signed inside of the firm(at thr firm level) ? and signed outside of the firm (at the national, regional, sectoral or occupational level)?
At the firm level Outside the firm
No, such an agreement does not exist □ □
No, the agreement exists but the firm opted-out □ □
Yes, such an agreement is in effect □ □
Proportion of employees covered by such an agreement (approx.) _____% _____%
C4.3b– What is the proportion of your employees covered in 2013 by any collective pay agreement? Proportion of employees covered by any collective pay agreement (approx.) _____%
C4.4-How often does the collective pay agreement applied at you firm typically change?
More than once a year □ Once a year □ Between one and two years □ Every two years □ Less frequently than once
every two years □
Never/Not applicable □
C4.5 Did your firm adapt changes in base wages to inflation before 2008? And during 2010-2013?Definition of base wage - direct remuneration excluding bonuses (regular wage and salary, commissions, piecework payments).
Before 2008 During 2010-2013
Yes □ □No □ □ Inflation was too low so that indexation rules were no operative □ □ There were no legal or other types of indexation rules specifying such an adjustment □ □
C4.6–How frequently was the base wage of an employee belonging to the main occupational group in your firm (largest group in Question C3.2) typically changed in your firm? Please choose ONE option for each line
More than once a year Once a year
Between one and
two years
Every two years
Less frequently than once every
two years
Never/Not applicable
Before 2008 □ □ □ □ □ □
During 2010-2013 □ □ □ □ □ □
C4.7 –Over 2010-2013, did you freeze or cut base wages in a given year (please indicate in which years)?
Wages were frozen Wages were cut
YES NO % Workers affected YES NO % Workers affected (average wage cut)
2010 □ □ ______% □ □ ______% ( % )
2011 □ □ ______% □ □ ______% ( %) 2012 □ □ ______% □ □ ______% ( %) 2013 □ □ ______% □ □ ______% ( %) NC4.8 –How did the labour cost of a newly hired worker compare with that of similar (in terms of experience and task assignment) workers at your firm? Much lower Lower Similar Higher Much higher
Before 2008 □ □ □ □ □
During 2010-2013 □ □ □ □ □
C5. Price setting and price changesThis section collects information on price setting and the frequency of price changes. Some questions aim at assessing differences in 2010-2013 with respect to the period before 2008. If your firm produces (or sells) more than a single good or service, the answers should refer to the "main product (“activity” or “service”), defined as the one that generated the highest fraction of your firm’s revenue in the “reference year”. For instance, if your firm produces (or sells) several types of hats and shoes, by "product" we mean "hats" and "shoes" (irrespective of the specific type), whereas by "main product" we mean the one that generated the highest revenue in the “reference year”.
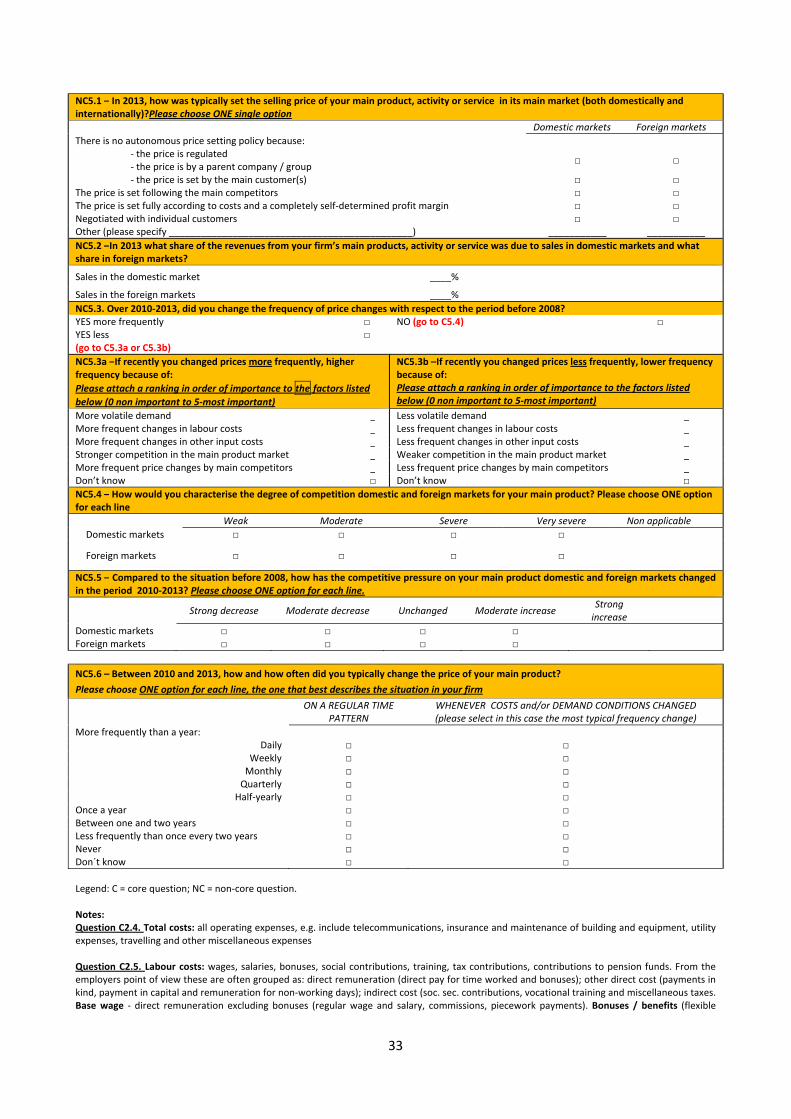
33
NC5.1 – In 2013, how was typically set the selling price of your main product, activity or service in its main market (both domestically and internationally)?Please choose ONE single option Domestic markets Foreign marketsThere is no autonomous price setting policy because: - the price is regulated - the price is by a parent company / group □ □
- the price is set by the main customer(s) □ □The price is set following the main competitors □ □The price is set fully according to costs and a completely self-determined profit margin □ □Negotiated with individual customers □ □Other (please specify ______________________________________________) ___________ ___________NC5.2 –In 2013 what share of the revenues from your firm’s main products, activity or service was due to sales in domestic markets and what share in foreign markets?
Sales in the domestic market ____%
Sales in the foreign markets ____% NC5.3. Over 2010-2013, did you change the frequency of price changes with respect to the period before 2008? YES more frequently YES less (go to C5.3a or C5.3b)
□□
NO (go to C5.4) □
NC5.3a –If recently you changed prices more frequently, higher frequency because of: Please attach a ranking in order of importance to the factors listed below (0 non important to 5-most important)
NC5.3b –If recently you changed prices less frequently, lower frequency because of: Please attach a ranking in order of importance to the factors listed below (0 non important to 5-most important)
More volatile demand _ Less volatile demand _More frequent changes in labour costs _ Less frequent changes in labour costs _More frequent changes in other input costs _ Less frequent changes in other input costs _Stronger competition in the main product market _ Weaker competition in the main product market _More frequent price changes by main competitors _ Less frequent price changes by main competitors _Don’t know □ Don’t know □NC5.4 – How would you characterise the degree of competition domestic and foreign markets for your main product? Please choose ONE option for each line
Weak Moderate Severe Very severe Non applicableDomestic markets □ □ □ □
Foreign markets □ □ □ □
NC5.5 – Compared to the situation before 2008, how has the competitive pressure on your main product domestic and foreign markets changed in the period 2010-2013? Please choose ONE option for each line.
Strong decrease Moderate decrease Unchanged Moderate increase Strong increase
Domestic markets □ □ □ □ Foreign markets □ □ □ □ NC5.6 – Between 2010 and 2013, how and how often did you typically change the price of your main product? Please choose ONE option for each line, the one that best describes the situation in your firm
ON A REGULAR TIME PATTERN
WHENEVER COSTS and/or DEMAND CONDITIONS CHANGED (please select in this case the most typical frequency change)
More frequently than a year: Daily □ □
Weekly □ □ Monthly □ □
Quarterly □ □ Half-yearly □ □
Once a year □ □ Between one and two years □ □ Less frequently than once every two years □ □ Never □ □ Don´t know □ □
Legend: C = core question; NC = non-core question. Notes: Question C2.4. Total costs: all operating expenses, e.g. include telecommunications, insurance and maintenance of building and equipment, utility expenses, travelling and other miscellaneous expenses Question C2.5. Labour costs: wages, salaries, bonuses, social contributions, training, tax contributions, contributions to pension funds. From the employers point of view these are often grouped as: direct remuneration (direct pay for time worked and bonuses); other direct cost (payments in kind, payment in capital and remuneration for non-working days); indirect cost (soc. sec. contributions, vocational training and miscellaneous taxes. Base wage - direct remuneration excluding bonuses (regular wage and salary, commissions, piecework payments). Bonuses / benefits (flexible
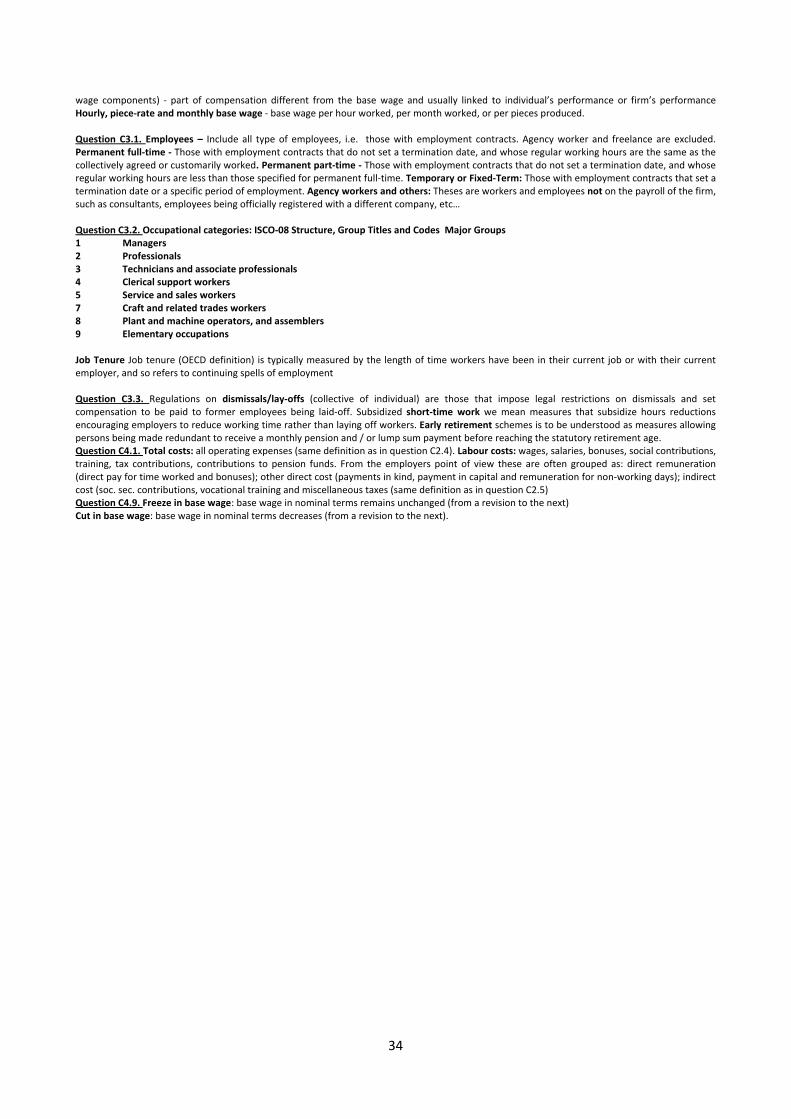
34
wage components) - part of compensation different from the base wage and usually linked to individual’s performance or firm’s performance Hourly, piece-rate and monthly base wage - base wage per hour worked, per month worked, or per pieces produced. Question C3.1. Employees – Include all type of employees, i.e. those with employment contracts. Agency worker and freelance are excluded. Permanent full-time - Those with employment contracts that do not set a termination date, and whose regular working hours are the same as the collectively agreed or customarily worked. Permanent part-time - Those with employment contracts that do not set a termination date, and whose regular working hours are less than those specified for permanent full-time. Temporary or Fixed-Term: Those with employment contracts that set a termination date or a specific period of employment. Agency workers and others: Theses are workers and employees not on the payroll of the firm, such as consultants, employees being officially registered with a different company, etc… Question C3.2. Occupational categories: ISCO-08 Structure, Group Titles and Codes Major Groups 1 Managers 2 Professionals 3 Technicians and associate professionals 4 Clerical support workers 5 Service and sales workers 7 Craft and related trades workers 8 Plant and machine operators, and assemblers 9 Elementary occupations Job Tenure Job tenure (OECD definition) is typically measured by the length of time workers have been in their current job or with their current employer, and so refers to continuing spells of employment Question C3.3. Regulations on dismissals/lay-offs (collective of individual) are those that impose legal restrictions on dismissals and set compensation to be paid to former employees being laid-off. Subsidized short-time work we mean measures that subsidize hours reductions encouraging employers to reduce working time rather than laying off workers. Early retirement schemes is to be understood as measures allowing persons being made redundant to receive a monthly pension and / or lump sum payment before reaching the statutory retirement age. Question C4.1. Total costs: all operating expenses (same definition as in question C2.4). Labour costs: wages, salaries, bonuses, social contributions, training, tax contributions, contributions to pension funds. From the employers point of view these are often grouped as: direct remuneration (direct pay for time worked and bonuses); other direct cost (payments in kind, payment in capital and remuneration for non-working days); indirect cost (soc. sec. contributions, vocational training and miscellaneous taxes (same definition as in question C2.5) Question C4.9. Freeze in base wage: base wage in nominal terms remains unchanged (from a revision to the next) Cut in base wage: base wage in nominal terms decreases (from a revision to the next).
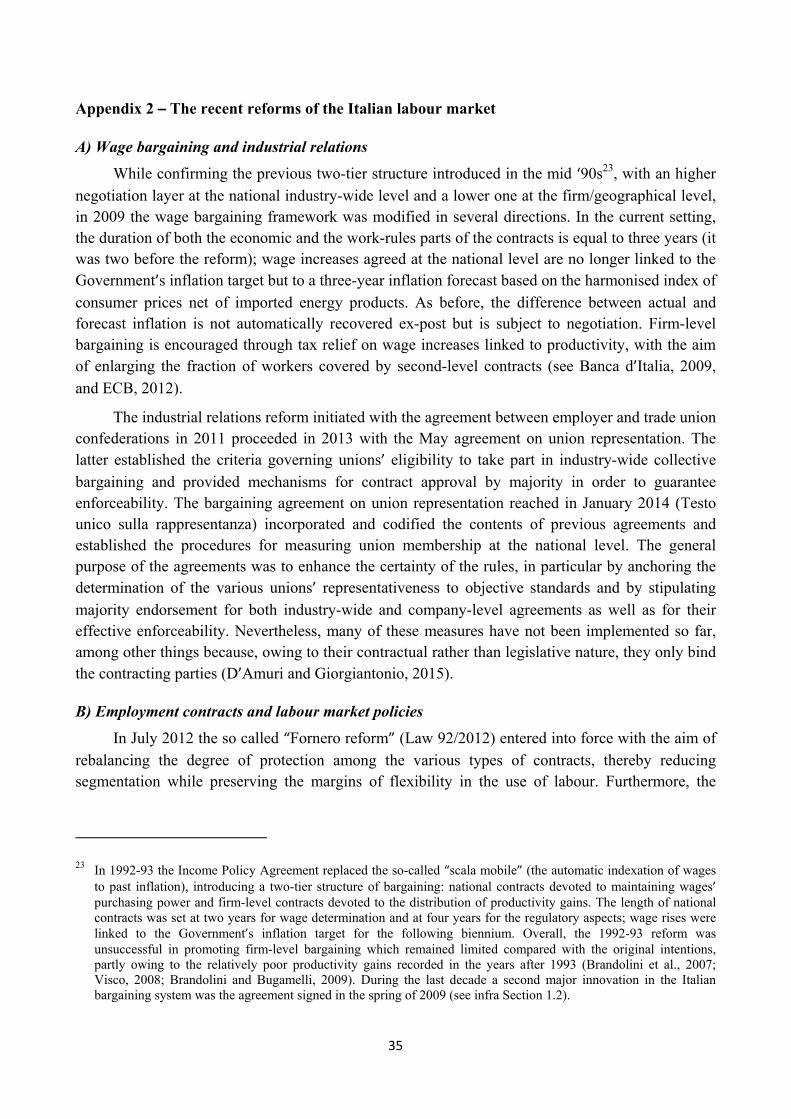
35
Appendix 2 – The recent reforms of the Italian labour market
A) Wage bargaining and industrial relations While confirming the previous two-tier structure introduced in the mid ‘90s23, with an higher
negotiation layer at the national industry-wide level and a lower one at the firm/geographical level, in 2009 the wage bargaining framework was modified in several directions. In the current setting, the duration of both the economic and the work-rules parts of the contracts is equal to three years (it was two before the reform); wage increases agreed at the national level are no longer linked to the Government’s inflation target but to a three-year inflation forecast based on the harmonised index of
consumer prices net of imported energy products. As before, the difference between actual and forecast inflation is not automatically recovered ex-post but is subject to negotiation. Firm-level bargaining is encouraged through tax relief on wage increases linked to productivity, with the aim of enlarging the fraction of workers covered by second-level contracts (see Banca d’Italia, 2009,
and ECB, 2012).
The industrial relations reform initiated with the agreement between employer and trade union confederations in 2011 proceeded in 2013 with the May agreement on union representation. The latter established the criteria governing unions’ eligibility to take part in industry-wide collective
bargaining and provided mechanisms for contract approval by majority in order to guarantee enforceability. The bargaining agreement on union representation reached in January 2014 (Testo unico sulla rappresentanza) incorporated and codified the contents of previous agreements and established the procedures for measuring union membership at the national level. The general purpose of the agreements was to enhance the certainty of the rules, in particular by anchoring the determination of the various unions’ representativeness to objective standards and by stipulating
majority endorsement for both industry-wide and company-level agreements as well as for their effective enforceability. Nevertheless, many of these measures have not been implemented so far, among other things because, owing to their contractual rather than legislative nature, they only bind the contracting parties (D’Amuri and Giorgiantonio, 2015).
B) Employment contracts and labour market policies In July 2012 the so called “Fornero reform” (Law 92/2012) entered into force with the aim of
rebalancing the degree of protection among the various types of contracts, thereby reducing segmentation while preserving the margins of flexibility in the use of labour. Furthermore, the
23 In 1992-93 the Income Policy Agreement replaced the so-called “scala mobile” (the automatic indexation of wages to past inflation), introducing a two-tier structure of bargaining: national contracts devoted to maintaining wages’ purchasing power and firm-level contracts devoted to the distribution of productivity gains. The length of national contracts was set at two years for wage determination and at four years for the regulatory aspects; wage rises were linked to the Government’s inflation target for the following biennium. Overall, the 1992-93 reform was unsuccessful in promoting firm-level bargaining which remained limited compared with the original intentions, partly owing to the relatively poor productivity gains recorded in the years after 1993 (Brandolini et al., 2007; Visco, 2008; Brandolini and Bugamelli, 2009). During the last decade a second major innovation in the Italian bargaining system was the agreement signed in the spring of 2009 (see infra Section 1.2).
36
reform reduced fragmentation of social buffers and increased the generosity of ordinary unemployment benefits.
The measures intervened on the following aspects. First, the recourse to “atypical”
employment contracts was limited in order to prevent their use where inappropriate or as a means to avoid the tax and social security contribution obligations existing for payroll employment. Second, for fixed-term contracts the reform increased the social security contribution with a surcharge on employers earmarked to finance social buffers; the additional cost, which modifies the convenience of fixed-term relative to permanent contracts, is partly refunded if the employment relationship is stabilized. Third, while restricting the use of more flexible contracts, the reform intervened on the discipline regulating apprenticeship to promote the formation of stable worker-firm relationships. Fourth, it relaxed the rules on individual dismissals, narrowing the scope of workers’ reinstatement
for unfair dismissal and setting a limit to the payable compensation; it also introduced a prior conciliation procedure and a speedier judicial process. Finally, the safety net both for workers who lose their job and for those whose working hours are reduced was rationalized and the coverage was widened to previously excluded sectors; a new system of unemployment insurance (Assicurazione Sociale per l’Impiego, ASpI) was introduced (see also Banca d’Italia, 2013). The weakest measures were related to active labour market policies, due to the difficulty of coordinating the various levels of government in charge.
Subsequent governments passed new legislation (Decree Laws 76/2013 and 34/2014) to relax the legal restrictions introduced by the “Fornero reform” to the use of the most flexible types of
contracts, which had been perceived as very onerous by employers. The new measures substantially liberalized the use of fixed-term contracts lasting up to 36 months (raised from the 12 months originally envisaged by the “Fornero reform”), by eliminating the requirement to specify the
motivation to opt for such contract and raising from 1 to 5 the number of possible renewals within the three-year validity period; at the same time, a ceiling on the recourse to these contracts (20% of the employer’s full-time permanent employees) was set. As for the heavily subsidized
apprenticeships contracts, the new norms also simplified the training requirements inherent in those contracts (and entrusted to regional initiatives that were not always of high quality) and limited the obligation to permanently hire a share24 of the apprentices – introduced by the Fornero reform – to
firms with more than 50 employees. Some restrictions on jobs on call, occasional work, and continuous collaboration contracts were also abolished. Overall, these measures aimed at reducing the administrative restrictions on the use of such contracts.
In 2014, the Stability law envisaged several measures to narrow the tax wedge on labour, notably a three-year rebate of social security contributions to subsidize hiring with open-ended contracts and a 10% cut in the rate of the regional tax on productive activities (IRAP), as well as cuts in personal income tax (IRPEF) for low-to-medium-wage employees (see Signorini, 2014).
24 This share was also lowered from 50 to 20%.
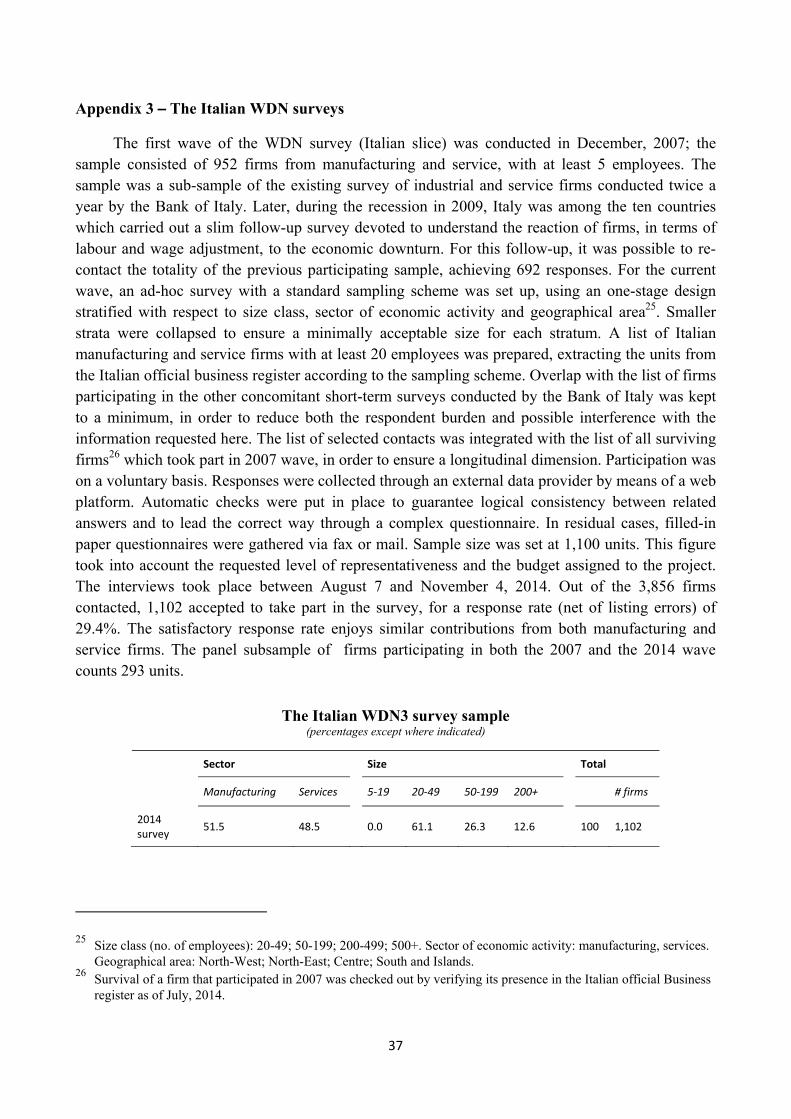
37
Appendix 3 – The Italian WDN surveys
The first wave of the WDN survey (Italian slice) was conducted in December, 2007; the sample consisted of 952 firms from manufacturing and service, with at least 5 employees. The sample was a sub-sample of the existing survey of industrial and service firms conducted twice a year by the Bank of Italy. Later, during the recession in 2009, Italy was among the ten countries which carried out a slim follow-up survey devoted to understand the reaction of firms, in terms of labour and wage adjustment, to the economic downturn. For this follow-up, it was possible to re-contact the totality of the previous participating sample, achieving 692 responses. For the current wave, an ad-hoc survey with a standard sampling scheme was set up, using an one-stage design stratified with respect to size class, sector of economic activity and geographical area25. Smaller strata were collapsed to ensure a minimally acceptable size for each stratum. A list of Italian manufacturing and service firms with at least 20 employees was prepared, extracting the units from the Italian official business register according to the sampling scheme. Overlap with the list of firms participating in the other concomitant short-term surveys conducted by the Bank of Italy was kept to a minimum, in order to reduce both the respondent burden and possible interference with the information requested here. The list of selected contacts was integrated with the list of all surviving firms26 which took part in 2007 wave, in order to ensure a longitudinal dimension. Participation was on a voluntary basis. Responses were collected through an external data provider by means of a web platform. Automatic checks were put in place to guarantee logical consistency between related answers and to lead the correct way through a complex questionnaire. In residual cases, filled-in paper questionnaires were gathered via fax or mail. Sample size was set at 1,100 units. This figure took into account the requested level of representativeness and the budget assigned to the project. The interviews took place between August 7 and November 4, 2014. Out of the 3,856 firms contacted, 1,102 accepted to take part in the survey, for a response rate (net of listing errors) of 29.4%. The satisfactory response rate enjoys similar contributions from both manufacturing and service firms. The panel subsample of firms participating in both the 2007 and the 2014 wave counts 293 units.
The Italian WDN3 survey sample (percentages except where indicated)
Sector Size Total
Manufacturing Services 5-19 20-49 50-199 200+ # firms
2014 survey 51.5 48.5 0.0 61.1 26.3 12.6 100 1,102
25 Size class (no. of employees): 20-49; 50-199; 200-499; 500+. Sector of economic activity: manufacturing, services. Geographical area: North-West; North-East; Centre; South and Islands.
26 Survival of a firm that participated in 2007 was checked out by verifying its presence in the Italian official Business register as of July, 2014.
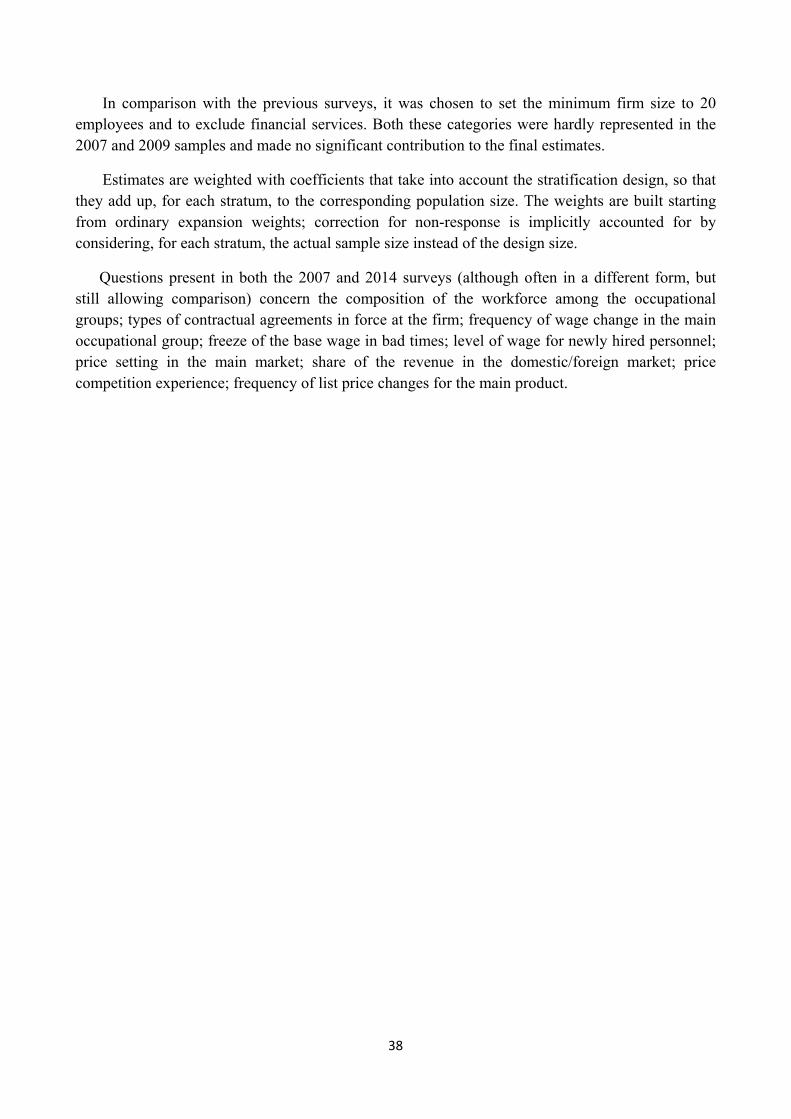
38
In comparison with the previous surveys, it was chosen to set the minimum firm size to 20 employees and to exclude financial services. Both these categories were hardly represented in the 2007 and 2009 samples and made no significant contribution to the final estimates.
Estimates are weighted with coefficients that take into account the stratification design, so that they add up, for each stratum, to the corresponding population size. The weights are built starting from ordinary expansion weights; correction for non-response is implicitly accounted for by considering, for each stratum, the actual sample size instead of the design size.
Questions present in both the 2007 and 2014 surveys (although often in a different form, but still allowing comparison) concern the composition of the workforce among the occupational groups; types of contractual agreements in force at the firm; frequency of wage change in the main occupational group; freeze of the base wage in bad times; level of wage for newly hired personnel; price setting in the main market; share of the revenue in the domestic/foreign market; price competition experience; frequency of list price changes for the main product.
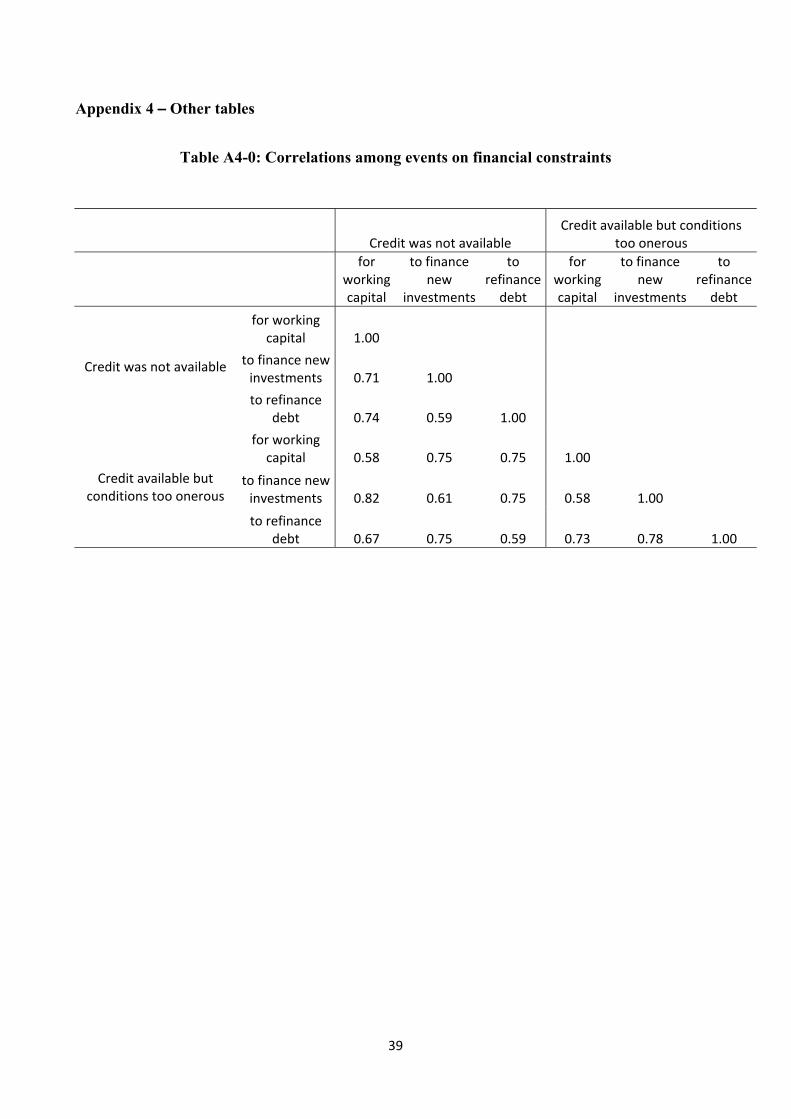
39
Appendix 4 – Other tables
Table A4-0: Correlations among events on financial constraints
Credit was not available Credit available but conditions
too onerous
for working capital
to finance new
investments
to refinance
debt
for working capital
to finance new
investments
to refinance
debt
Credit was not available
for working capital 1.00
to finance new investments 0.71 1.00 to refinance
debt 0.74 0.59 1.00
Credit available but conditions too onerous
for working capital 0.58 0.75 0.75 1.00
to finance new investments 0.82 0.61 0.75 0.58 1.00 to refinance
debt 0.67 0.75 0.59 0.73 0.78 1.00
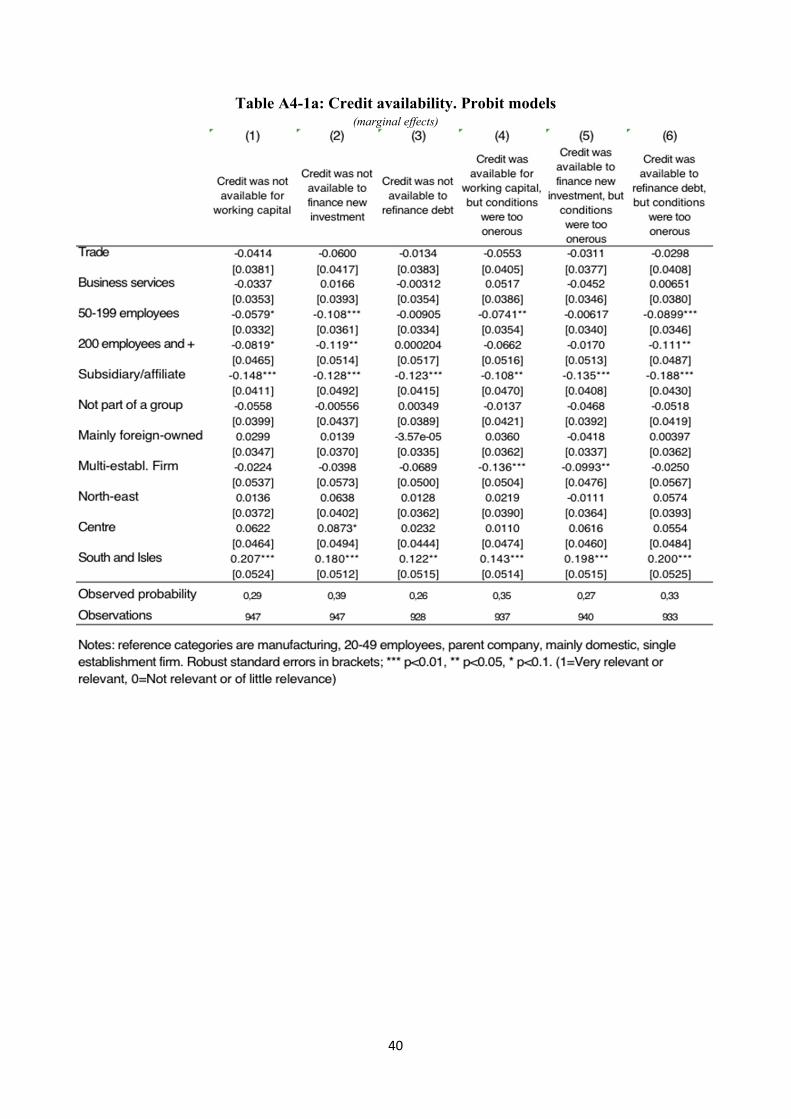
40
Table A4-1a: Credit availability. Probit models (marginal effects)
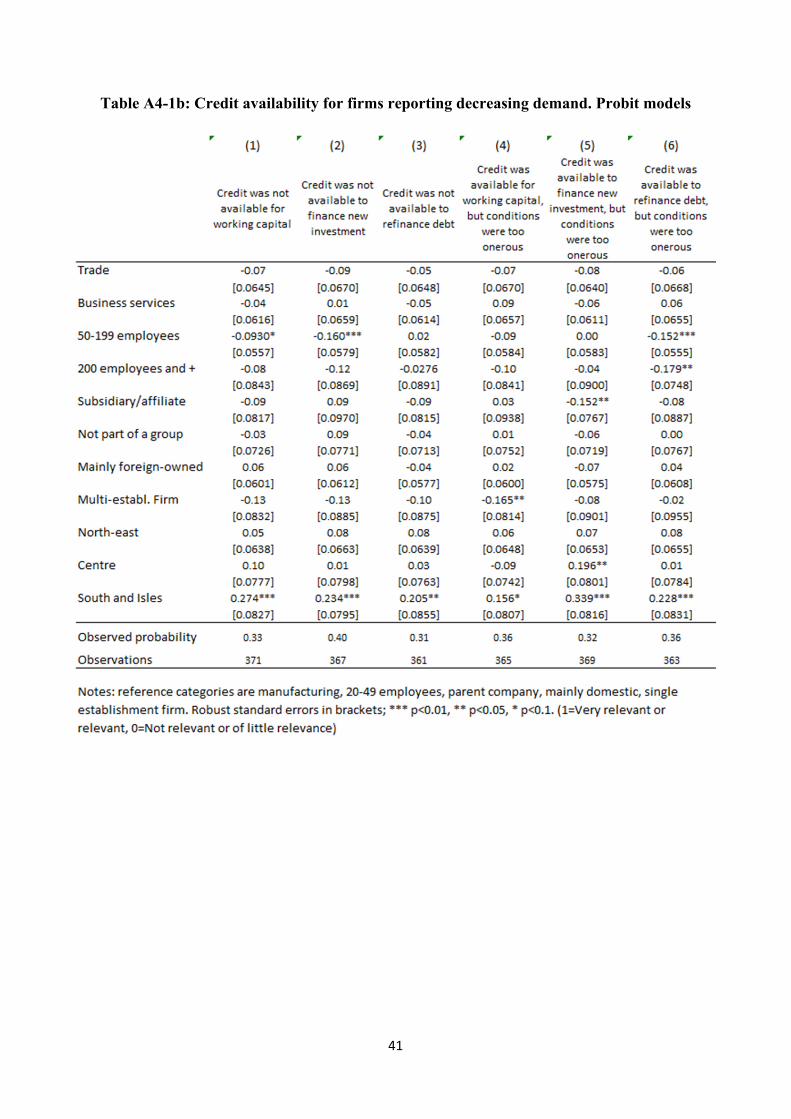
41
Table A4-1b: Credit availability for firms reporting decreasing demand. Probit models
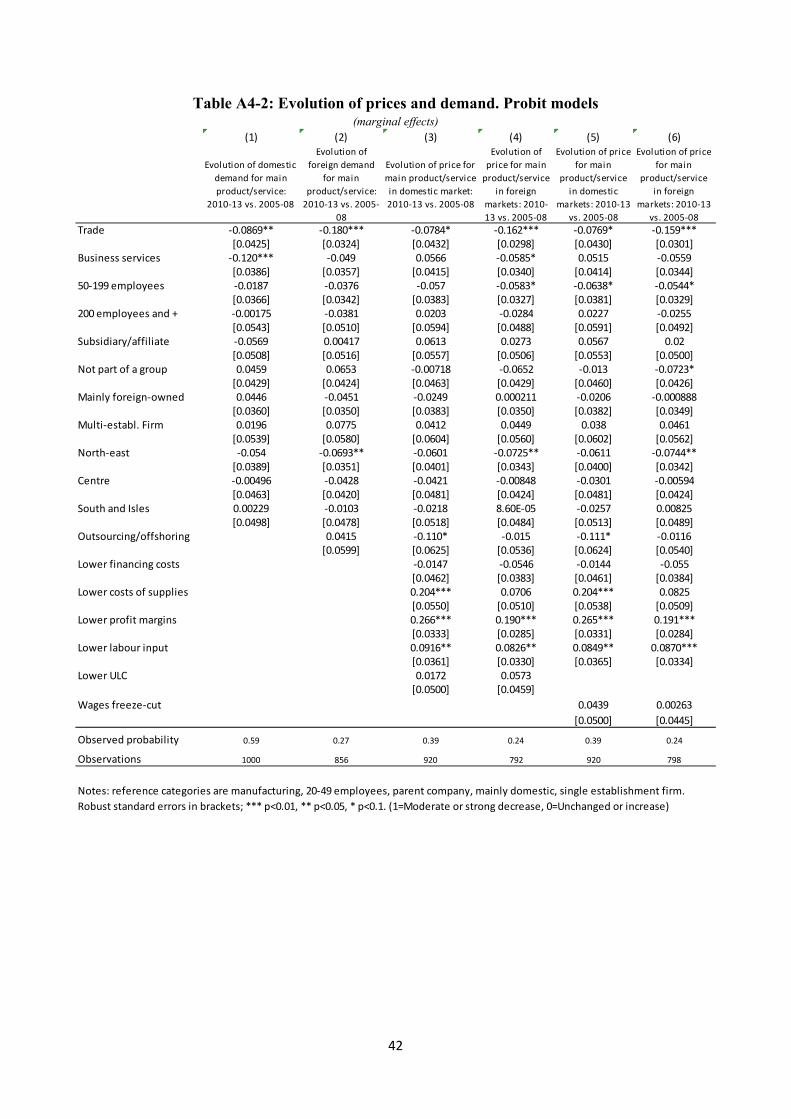
42
Table A4-2: Evolution of prices and demand. Probit models (marginal effects)
(1) (2) (3) (4) (5) (6)
Evolution of domestic demand for main product/service:
2010-13 vs. 2005-08
Evolution of foreign demand
for main product/service:
2010-13 vs. 2005-08
Evolution of price for main product/service in domestic market: 2010-13 vs. 2005-08
Evolution of price for main
product/service in foreign
markets: 2010-13 vs. 2005-08
Evolution of price for main
product/service in domestic
markets: 2010-13 vs. 2005-08
Evolution of price for main
product/service in foreign
markets: 2010-13 vs. 2005-08
Trade -0.0869** -0.180*** -0.0784* -0.162*** -0.0769* -0.159***[0.0425] [0.0324] [0.0432] [0.0298] [0.0430] [0.0301]
Business services -0.120*** -0.049 0.0566 -0.0585* 0.0515 -0.0559[0.0386] [0.0357] [0.0415] [0.0340] [0.0414] [0.0344]
50-199 employees -0.0187 -0.0376 -0.057 -0.0583* -0.0638* -0.0544*[0.0366] [0.0342] [0.0383] [0.0327] [0.0381] [0.0329]
200 employees and + -0.00175 -0.0381 0.0203 -0.0284 0.0227 -0.0255[0.0543] [0.0510] [0.0594] [0.0488] [0.0591] [0.0492]
Subsidiary/affiliate -0.0569 0.00417 0.0613 0.0273 0.0567 0.02[0.0508] [0.0516] [0.0557] [0.0506] [0.0553] [0.0500]
Not part of a group 0.0459 0.0653 -0.00718 -0.0652 -0.013 -0.0723*[0.0429] [0.0424] [0.0463] [0.0429] [0.0460] [0.0426]
Mainly foreign-owned 0.0446 -0.0451 -0.0249 0.000211 -0.0206 -0.000888[0.0360] [0.0350] [0.0383] [0.0350] [0.0382] [0.0349]
Multi-establ. Firm 0.0196 0.0775 0.0412 0.0449 0.038 0.0461[0.0539] [0.0580] [0.0604] [0.0560] [0.0602] [0.0562]
North-east -0.054 -0.0693** -0.0601 -0.0725** -0.0611 -0.0744**[0.0389] [0.0351] [0.0401] [0.0343] [0.0400] [0.0342]
Centre -0.00496 -0.0428 -0.0421 -0.00848 -0.0301 -0.00594[0.0463] [0.0420] [0.0481] [0.0424] [0.0481] [0.0424]
South and Isles 0.00229 -0.0103 -0.0218 8.60E-05 -0.0257 0.00825[0.0498] [0.0478] [0.0518] [0.0484] [0.0513] [0.0489]
Outsourcing/offshoring 0.0415 -0.110* -0.015 -0.111* -0.0116[0.0599] [0.0625] [0.0536] [0.0624] [0.0540]
Lower financing costs -0.0147 -0.0546 -0.0144 -0.055[0.0462] [0.0383] [0.0461] [0.0384]
Lower costs of supplies 0.204*** 0.0706 0.204*** 0.0825[0.0550] [0.0510] [0.0538] [0.0509]
Lower profit margins 0.266*** 0.190*** 0.265*** 0.191***[0.0333] [0.0285] [0.0331] [0.0284]
Lower labour input 0.0916** 0.0826** 0.0849** 0.0870***[0.0361] [0.0330] [0.0365] [0.0334]
Lower ULC 0.0172 0.0573[0.0500] [0.0459]
Wages freeze-cut 0.0439 0.00263[0.0500] [0.0445]
Observed probability 0.59 0.27 0.39 0.24 0.39 0.24
Observations 1000 856 920 792 920 798
Notes: reference categories are manufacturing, 20-49 employees, parent company, mainly domestic, single establishment firm. Robust standard errors in brackets; *** p<0.01, ** p<0.05, * p<0.1. (1=Moderate or strong decrease, 0=Unchanged or increase)
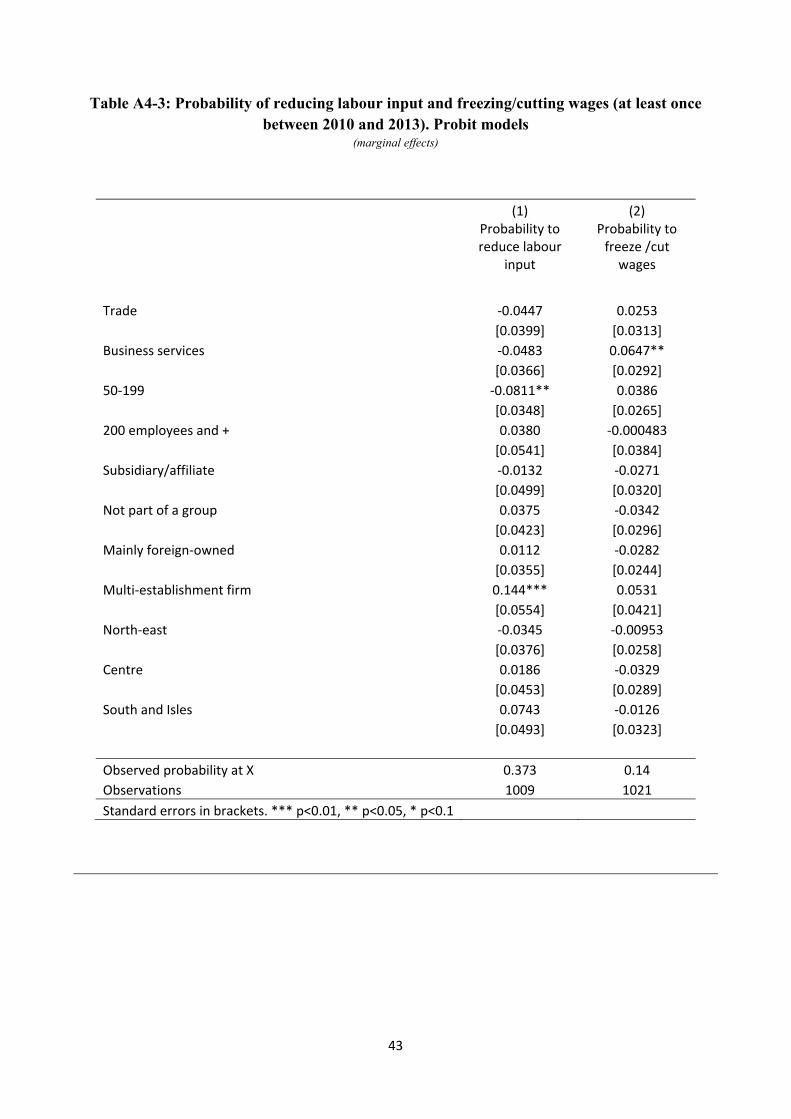
43
Table A4-3: Probability of reducing labour input and freezing/cutting wages (at least once between 2010 and 2013). Probit models
(marginal effects)
(1) (2) Probability to reduce labour
input
Probability to freeze /cut
wages
Trade -0.0447 0.0253 [0.0399] [0.0313]
Business services -0.0483 0.0647** [0.0366] [0.0292]
50-199 -0.0811** 0.0386 [0.0348] [0.0265]
200 employees and + 0.0380 -0.000483 [0.0541] [0.0384]
Subsidiary/affiliate -0.0132 -0.0271 [0.0499] [0.0320]
Not part of a group 0.0375 -0.0342 [0.0423] [0.0296]
Mainly foreign-owned 0.0112 -0.0282 [0.0355] [0.0244]
Multi-establishment firm 0.144*** 0.0531 [0.0554] [0.0421]
North-east -0.0345 -0.00953 [0.0376] [0.0258]
Centre 0.0186 -0.0329 [0.0453] [0.0289]
South and Isles 0.0743 -0.0126 [0.0493] [0.0323]
Observed probability at X 0.373 0.14 Observations 1009 1021 Standard errors in brackets. *** p<0.01, ** p<0.05, * p<0.1
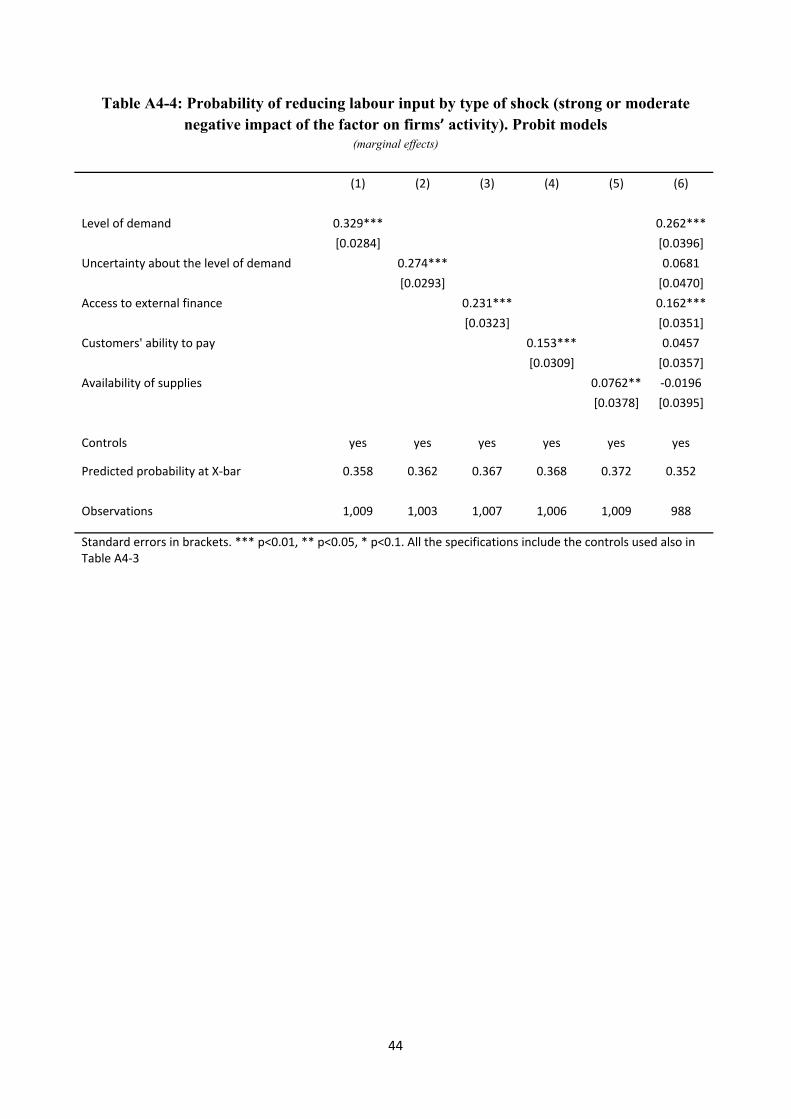
44
Table A4-4: Probability of reducing labour input by type of shock (strong or moderate negative impact of the factor on firms’ activity). Probit models
(marginal effects)
(1) (2) (3) (4) (5) (6)
Level of demand 0.329*** 0.262*** [0.0284] [0.0396]
Uncertainty about the level of demand 0.274*** 0.0681 [0.0293] [0.0470]
Access to external finance 0.231*** 0.162*** [0.0323] [0.0351]
Customers' ability to pay 0.153*** 0.0457 [0.0309] [0.0357]
Availability of supplies 0.0762** -0.0196 [0.0378] [0.0395]
Controls yes yes yes yes yes yes
Predicted probability at X-bar 0.358 0.362 0.367 0.368 0.372 0.352
Observations 1,009 1,003 1,007 1,006 1,009 988
Standard errors in brackets. *** p<0.01, ** p<0.05, * p<0.1. All the specifications include the controls used also in Table A4-3
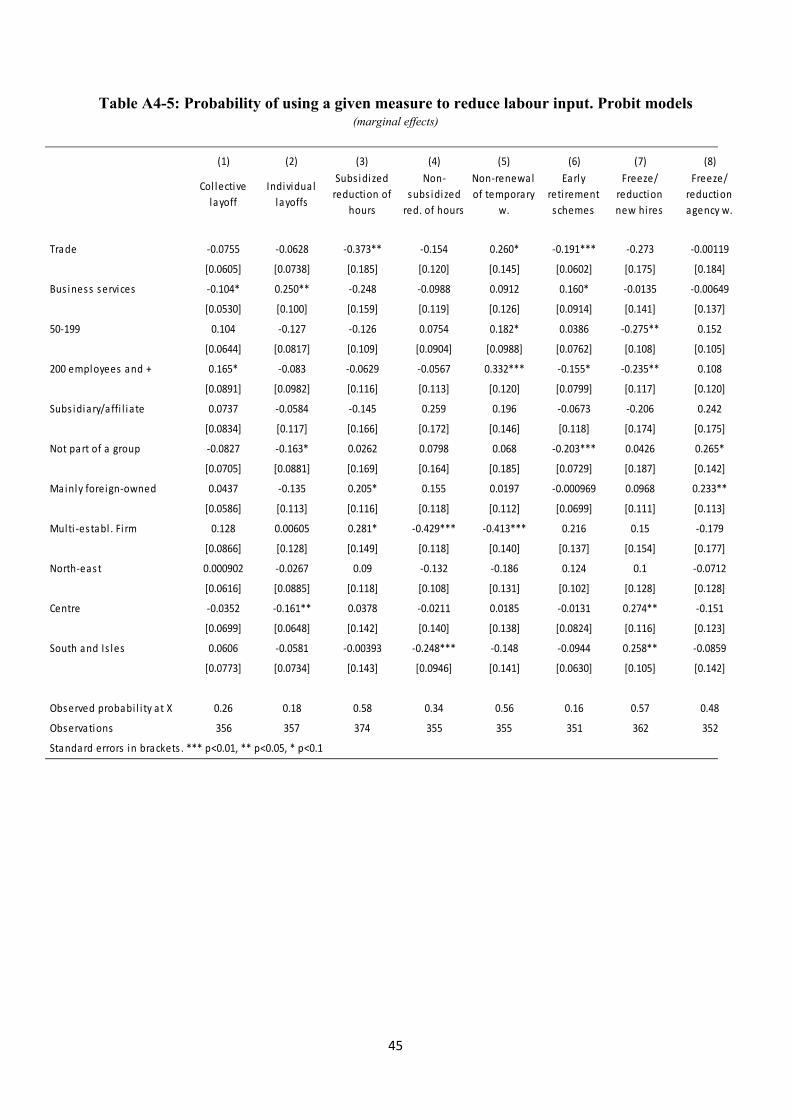
45
Table A4-5: Probability of using a given measure to reduce labour input. Probit models (marginal effects)
(1) (2) (3) (4) (5) (6) (7) (8)
Col lective layoff
Individual layoffs
Subs idized reduction of
hours
Non-subs idized
red. of hours
Non-renewal of temporary
w.
Early reti rement schemes
Freeze/ reduction new hires
Freeze/ reduction agency w.
Trade -0.0755 -0.0628 -0.373** -0.154 0.260* -0.191*** -0.273 -0.00119
[0.0605] [0.0738] [0.185] [0.120] [0.145] [0.0602] [0.175] [0.184]
Bus iness services -0.104* 0.250** -0.248 -0.0988 0.0912 0.160* -0.0135 -0.00649
[0.0530] [0.100] [0.159] [0.119] [0.126] [0.0914] [0.141] [0.137]
50-199 0.104 -0.127 -0.126 0.0754 0.182* 0.0386 -0.275** 0.152
[0.0644] [0.0817] [0.109] [0.0904] [0.0988] [0.0762] [0.108] [0.105]
200 employees and + 0.165* -0.083 -0.0629 -0.0567 0.332*** -0.155* -0.235** 0.108
[0.0891] [0.0982] [0.116] [0.113] [0.120] [0.0799] [0.117] [0.120]
Subs idiary/affi l iate 0.0737 -0.0584 -0.145 0.259 0.196 -0.0673 -0.206 0.242
[0.0834] [0.117] [0.166] [0.172] [0.146] [0.118] [0.174] [0.175]
Not part of a group -0.0827 -0.163* 0.0262 0.0798 0.068 -0.203*** 0.0426 0.265*
[0.0705] [0.0881] [0.169] [0.164] [0.185] [0.0729] [0.187] [0.142]
Mainly foreign-owned 0.0437 -0.135 0.205* 0.155 0.0197 -0.000969 0.0968 0.233**
[0.0586] [0.113] [0.116] [0.118] [0.112] [0.0699] [0.111] [0.113]
Multi -establ . Fi rm 0.128 0.00605 0.281* -0.429*** -0.413*** 0.216 0.15 -0.179
[0.0866] [0.128] [0.149] [0.118] [0.140] [0.137] [0.154] [0.177]
North-eas t 0.000902 -0.0267 0.09 -0.132 -0.186 0.124 0.1 -0.0712
[0.0616] [0.0885] [0.118] [0.108] [0.131] [0.102] [0.128] [0.128]
Centre -0.0352 -0.161** 0.0378 -0.0211 0.0185 -0.0131 0.274** -0.151
[0.0699] [0.0648] [0.142] [0.140] [0.138] [0.0824] [0.116] [0.123]
South and Is les 0.0606 -0.0581 -0.00393 -0.248*** -0.148 -0.0944 0.258** -0.0859
[0.0773] [0.0734] [0.143] [0.0946] [0.141] [0.0630] [0.105] [0.142]
Observed probabi l i ty at X 0.26 0.18 0.58 0.34 0.56 0.16 0.57 0.48
Observations 356 357 374 355 355 351 362 352
Standard errors in brackets . *** p<0.01, ** p<0.05, * p<0.1
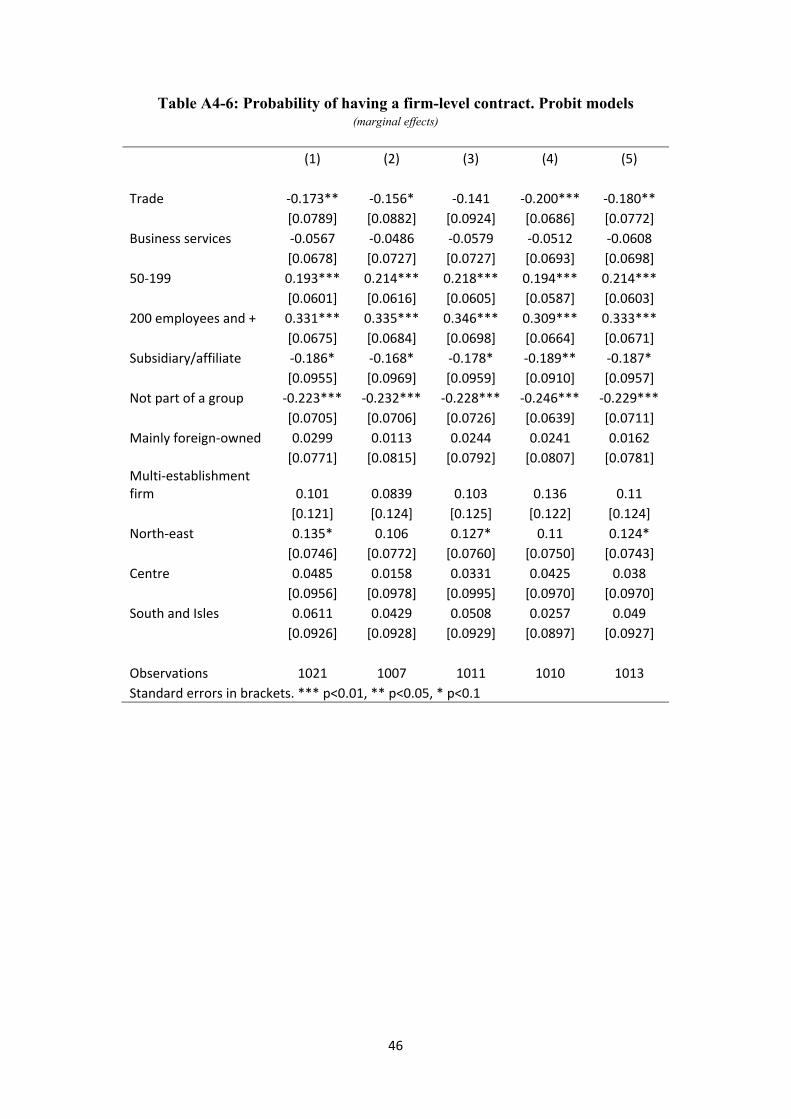
46
Table A4-6: Probability of having a firm-level contract. Probit models (marginal effects)
(1) (2) (3) (4) (5)
Trade -0.173** -0.156* -0.141 -0.200*** -0.180** [0.0789] [0.0882] [0.0924] [0.0686] [0.0772]
Business services -0.0567 -0.0486 -0.0579 -0.0512 -0.0608 [0.0678] [0.0727] [0.0727] [0.0693] [0.0698]
50-199 0.193*** 0.214*** 0.218*** 0.194*** 0.214*** [0.0601] [0.0616] [0.0605] [0.0587] [0.0603]
200 employees and + 0.331*** 0.335*** 0.346*** 0.309*** 0.333*** [0.0675] [0.0684] [0.0698] [0.0664] [0.0671]
Subsidiary/affiliate -0.186* -0.168* -0.178* -0.189** -0.187* [0.0955] [0.0969] [0.0959] [0.0910] [0.0957]
Not part of a group -0.223*** -0.232*** -0.228*** -0.246*** -0.229*** [0.0705] [0.0706] [0.0726] [0.0639] [0.0711]
Mainly foreign-owned 0.0299 0.0113 0.0244 0.0241 0.0162 [0.0771] [0.0815] [0.0792] [0.0807] [0.0781]
Multi-establishment firm 0.101 0.0839 0.103 0.136 0.11
[0.121] [0.124] [0.125] [0.122] [0.124] North-east 0.135* 0.106 0.127* 0.11 0.124*
[0.0746] [0.0772] [0.0760] [0.0750] [0.0743] Centre 0.0485 0.0158 0.0331 0.0425 0.038
[0.0956] [0.0978] [0.0995] [0.0970] [0.0970] South and Isles 0.0611 0.0429 0.0508 0.0257 0.049
[0.0926] [0.0928] [0.0929] [0.0897] [0.0927]
Observations 1021 1007 1011 1010 1013 Standard errors in brackets. *** p<0.01, ** p<0.05, * p<0.1
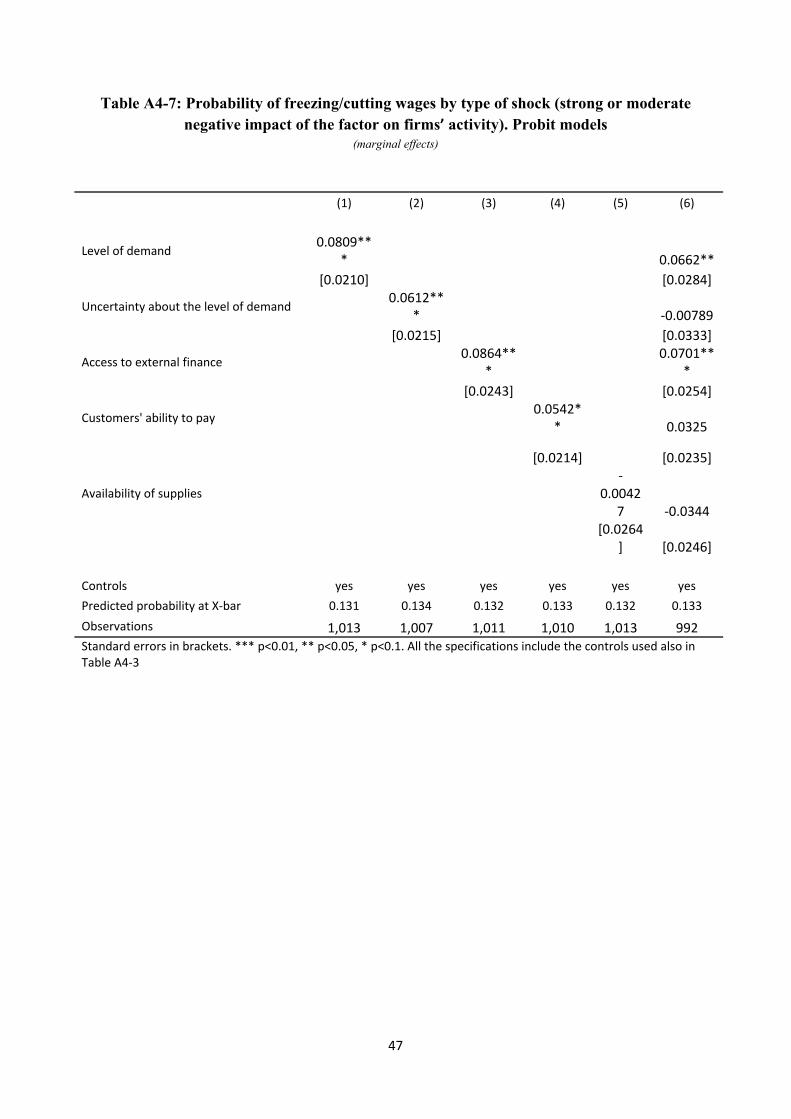
47
Table A4-7: Probability of freezing/cutting wages by type of shock (strong or moderate negative impact of the factor on firms’ activity). Probit models
(marginal effects)
(1) (2) (3) (4) (5) (6)
Level of demand 0.0809*** 0.0662**
[0.0210] [0.0284]
Uncertainty about the level of demand 0.0612*** -0.00789
[0.0215] [0.0333]
Access to external finance 0.0864***
0.0701***
[0.0243] [0.0254]
Customers' ability to pay 0.0542** 0.0325
[0.0214] [0.0235]
Availability of supplies -
0.00427 -0.0344
[0.0264
] [0.0246]
Controls yes yes yes yes yes yes Predicted probability at X-bar 0.131 0.134 0.132 0.133 0.132 0.133 Observations 1,013 1,007 1,011 1,010 1,013 992 Standard errors in brackets. *** p<0.01, ** p<0.05, * p<0.1. All the specifications include the controls used also in Table A4-3
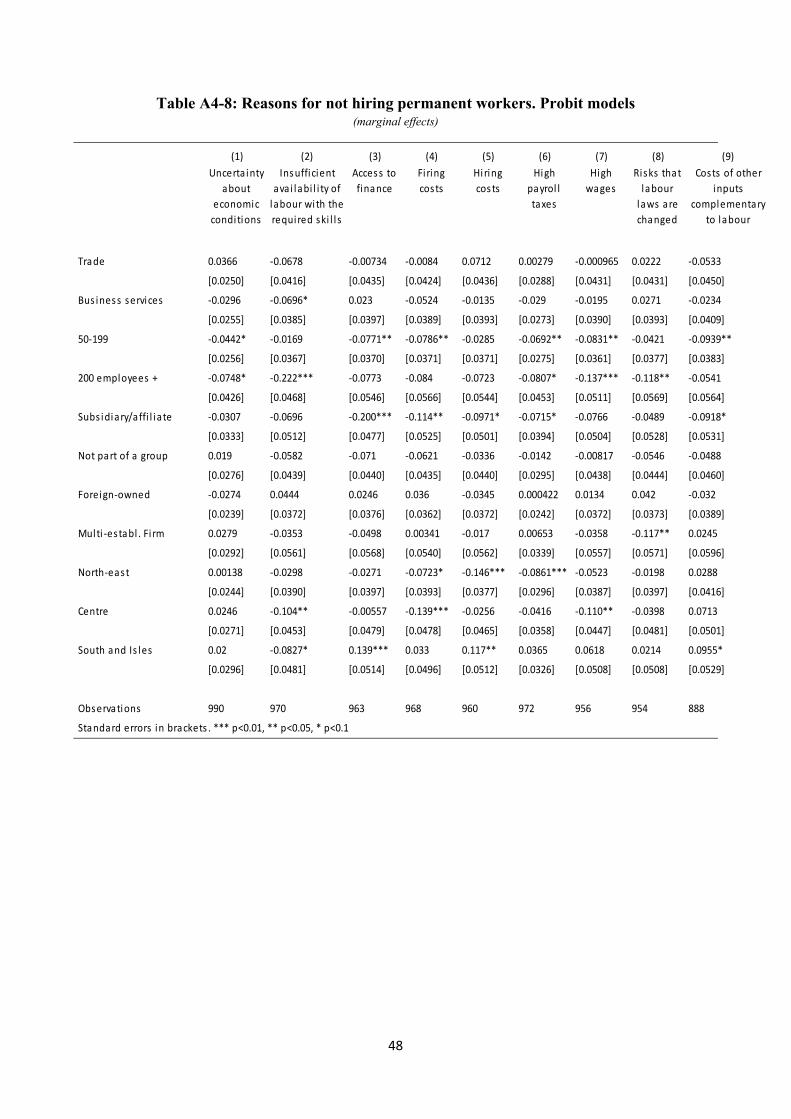
48
Table A4-8: Reasons for not hiring permanent workers. Probit models (marginal effects)
(1) (2) (3) (4) (5) (6) (7) (8) (9)Uncerta inty
about economic
conditions
Ins ufficient avai labi l i ty of
labour wi th the required ski l l s
Acces s to finance
Fi ring costs
Hi ring cos ts
High payrol l taxes
High wages
Risks that labour
laws are changed
Costs of other inputs
complementary to labour
Trade 0.0366 -0.0678 -0.00734 -0.0084 0.0712 0.00279 -0.000965 0.0222 -0.0533
[0.0250] [0.0416] [0.0435] [0.0424] [0.0436] [0.0288] [0.0431] [0.0431] [0.0450]
Bus ines s services -0.0296 -0.0696* 0.023 -0.0524 -0.0135 -0.029 -0.0195 0.0271 -0.0234
[0.0255] [0.0385] [0.0397] [0.0389] [0.0393] [0.0273] [0.0390] [0.0393] [0.0409]
50-199 -0.0442* -0.0169 -0.0771** -0.0786** -0.0285 -0.0692** -0.0831** -0.0421 -0.0939**
[0.0256] [0.0367] [0.0370] [0.0371] [0.0371] [0.0275] [0.0361] [0.0377] [0.0383]
200 employees + -0.0748* -0.222*** -0.0773 -0.084 -0.0723 -0.0807* -0.137*** -0.118** -0.0541
[0.0426] [0.0468] [0.0546] [0.0566] [0.0544] [0.0453] [0.0511] [0.0569] [0.0564]
Subs idiary/affi l i ate -0.0307 -0.0696 -0.200*** -0.114** -0.0971* -0.0715* -0.0766 -0.0489 -0.0918*
[0.0333] [0.0512] [0.0477] [0.0525] [0.0501] [0.0394] [0.0504] [0.0528] [0.0531]
Not part of a group 0.019 -0.0582 -0.071 -0.0621 -0.0336 -0.0142 -0.00817 -0.0546 -0.0488
[0.0276] [0.0439] [0.0440] [0.0435] [0.0440] [0.0295] [0.0438] [0.0444] [0.0460]
Foreign-owned -0.0274 0.0444 0.0246 0.036 -0.0345 0.000422 0.0134 0.042 -0.032
[0.0239] [0.0372] [0.0376] [0.0362] [0.0372] [0.0242] [0.0372] [0.0373] [0.0389]
Multi -establ . Fi rm 0.0279 -0.0353 -0.0498 0.00341 -0.017 0.00653 -0.0358 -0.117** 0.0245
[0.0292] [0.0561] [0.0568] [0.0540] [0.0562] [0.0339] [0.0557] [0.0571] [0.0596]
North-eas t 0.00138 -0.0298 -0.0271 -0.0723* -0.146*** -0.0861*** -0.0523 -0.0198 0.0288
[0.0244] [0.0390] [0.0397] [0.0393] [0.0377] [0.0296] [0.0387] [0.0397] [0.0416]
Centre 0.0246 -0.104** -0.00557 -0.139*** -0.0256 -0.0416 -0.110** -0.0398 0.0713
[0.0271] [0.0453] [0.0479] [0.0478] [0.0465] [0.0358] [0.0447] [0.0481] [0.0501]
South and Is les 0.02 -0.0827* 0.139*** 0.033 0.117** 0.0365 0.0618 0.0214 0.0955*
[0.0296] [0.0481] [0.0514] [0.0496] [0.0512] [0.0326] [0.0508] [0.0508] [0.0529]
Observations 990 970 963 968 960 972 956 954 888
Standard errors in brackets . *** p<0.01, ** p<0.05, * p<0.1
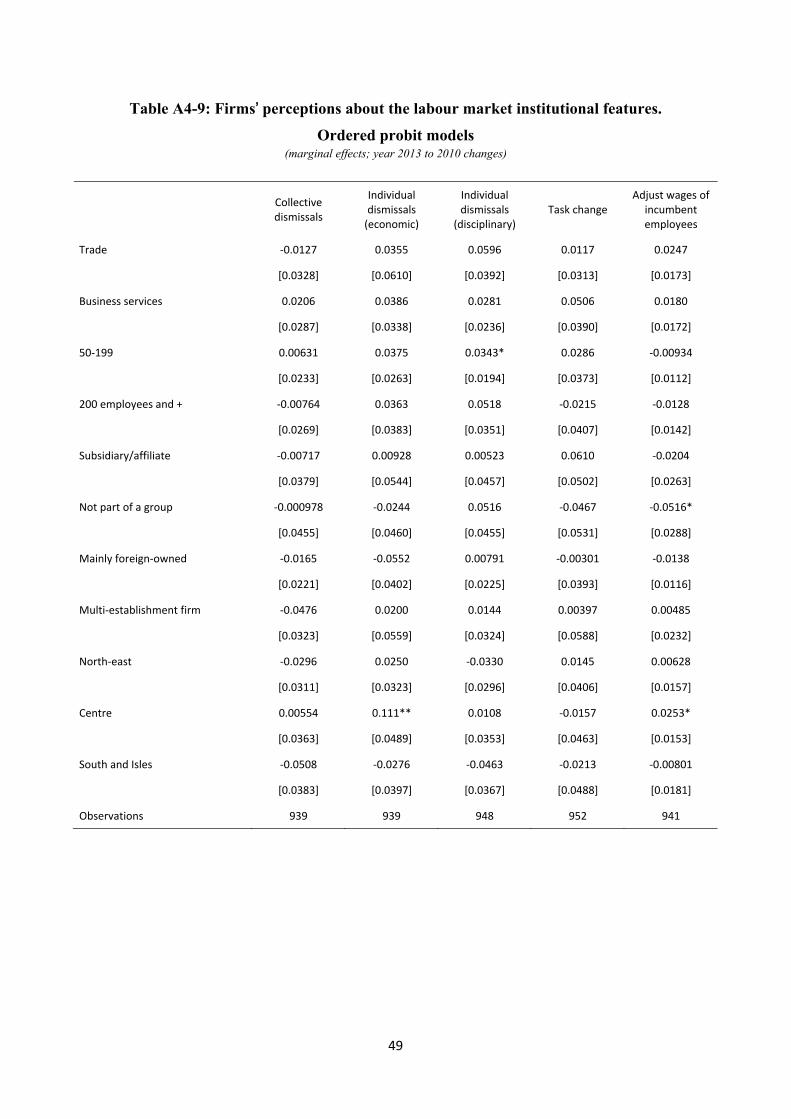
49
Table A4-9: Firms’ perceptions about the labour market institutional features.
Ordered probit models (marginal effects; year 2013 to 2010 changes)
Collective dismissals
Individual dismissals
(economic)
Individual dismissals
(disciplinary) Task change
Adjust wages of incumbent employees
Trade -0.0127 0.0355 0.0596 0.0117 0.0247
[0.0328] [0.0610] [0.0392] [0.0313] [0.0173]
Business services 0.0206 0.0386 0.0281 0.0506 0.0180
[0.0287] [0.0338] [0.0236] [0.0390] [0.0172]
50-199 0.00631 0.0375 0.0343* 0.0286 -0.00934
[0.0233] [0.0263] [0.0194] [0.0373] [0.0112]
200 employees and + -0.00764 0.0363 0.0518 -0.0215 -0.0128
[0.0269] [0.0383] [0.0351] [0.0407] [0.0142]
Subsidiary/affiliate -0.00717 0.00928 0.00523 0.0610 -0.0204
[0.0379] [0.0544] [0.0457] [0.0502] [0.0263]
Not part of a group -0.000978 -0.0244 0.0516 -0.0467 -0.0516*
[0.0455] [0.0460] [0.0455] [0.0531] [0.0288]
Mainly foreign-owned -0.0165 -0.0552 0.00791 -0.00301 -0.0138
[0.0221] [0.0402] [0.0225] [0.0393] [0.0116]
Multi-establishment firm -0.0476 0.0200 0.0144 0.00397 0.00485
[0.0323] [0.0559] [0.0324] [0.0588] [0.0232]
North-east -0.0296 0.0250 -0.0330 0.0145 0.00628
[0.0311] [0.0323] [0.0296] [0.0406] [0.0157]
Centre 0.00554 0.111** 0.0108 -0.0157 0.0253*
[0.0363] [0.0489] [0.0353] [0.0463] [0.0153]
South and Isles -0.0508 -0.0276 -0.0463 -0.0213 -0.00801
[0.0383] [0.0397] [0.0367] [0.0488] [0.0181]
Observations 939 939 948 952 941
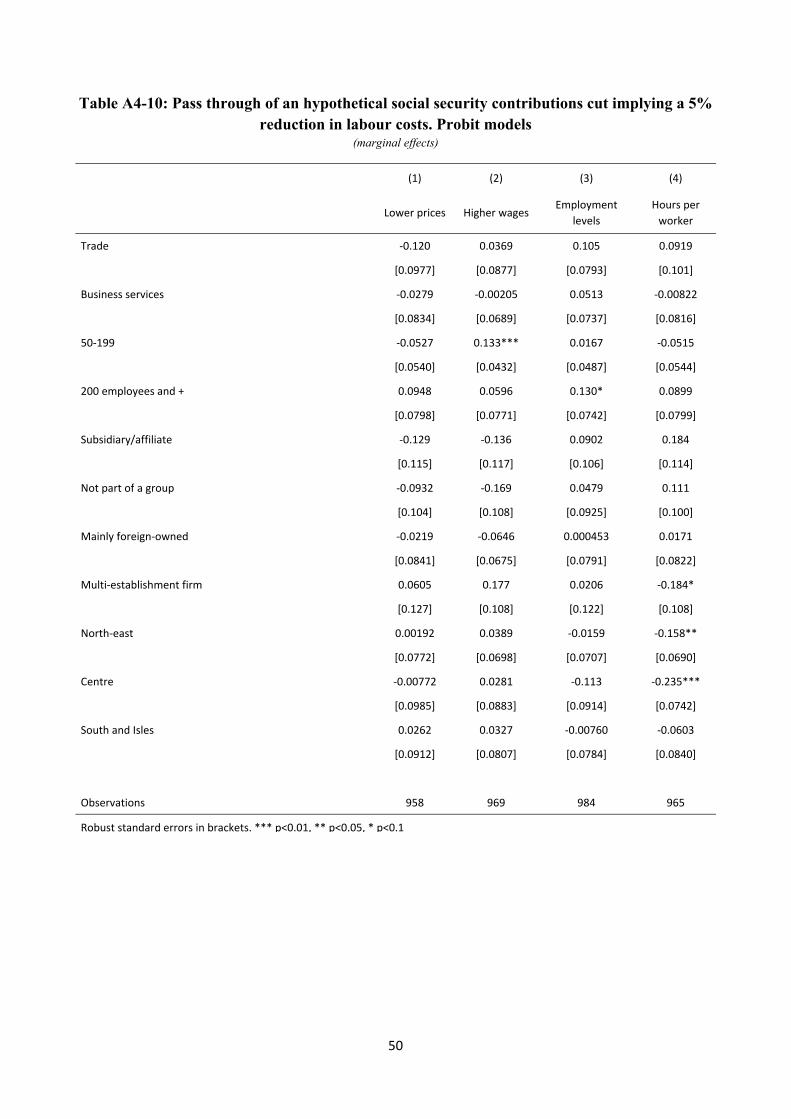
50
Table A4-10: Pass through of an hypothetical social security contributions cut implying a 5% reduction in labour costs. Probit models
(marginal effects)
(1) (2) (3) (4)
Lower prices Higher wages Employment
levels Hours per
worker
Trade -0.120 0.0369 0.105 0.0919
[0.0977] [0.0877] [0.0793] [0.101]
Business services -0.0279 -0.00205 0.0513 -0.00822
[0.0834] [0.0689] [0.0737] [0.0816]
50-199 -0.0527 0.133*** 0.0167 -0.0515
[0.0540] [0.0432] [0.0487] [0.0544]
200 employees and + 0.0948 0.0596 0.130* 0.0899
[0.0798] [0.0771] [0.0742] [0.0799]
Subsidiary/affiliate -0.129 -0.136 0.0902 0.184
[0.115] [0.117] [0.106] [0.114]
Not part of a group -0.0932 -0.169 0.0479 0.111
[0.104] [0.108] [0.0925] [0.100]
Mainly foreign-owned -0.0219 -0.0646 0.000453 0.0171
[0.0841] [0.0675] [0.0791] [0.0822]
Multi-establishment firm 0.0605 0.177 0.0206 -0.184*
[0.127] [0.108] [0.122] [0.108]
North-east 0.00192 0.0389 -0.0159 -0.158**
[0.0772] [0.0698] [0.0707] [0.0690]
Centre -0.00772 0.0281 -0.113 -0.235***
[0.0985] [0.0883] [0.0914] [0.0742]
South and Isles 0.0262 0.0327 -0.00760 -0.0603
[0.0912] [0.0807] [0.0784] [0.0840]
Observations 958 969 984 965
Robust standard errors in brackets. *** p<0.01, ** p<0.05, * p<0.1
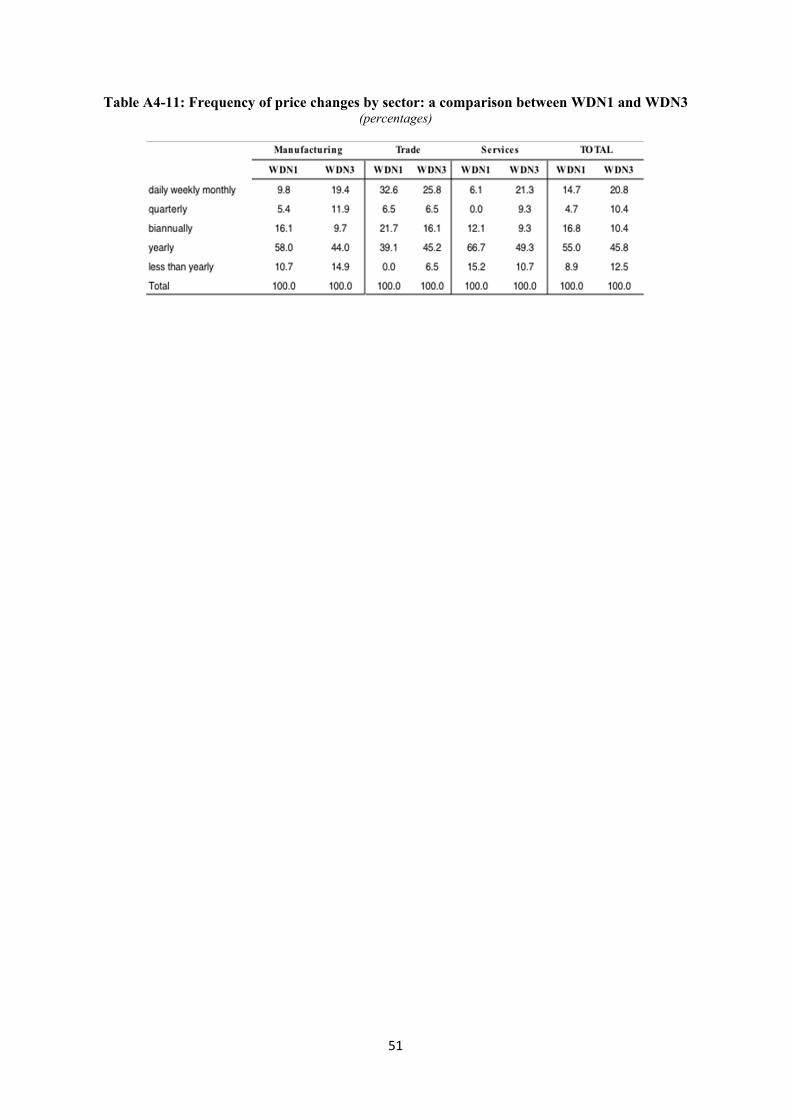
51
Table A4-11: Frequency of price changes by sector: a comparison between WDN1 and WDN3 (percentages)
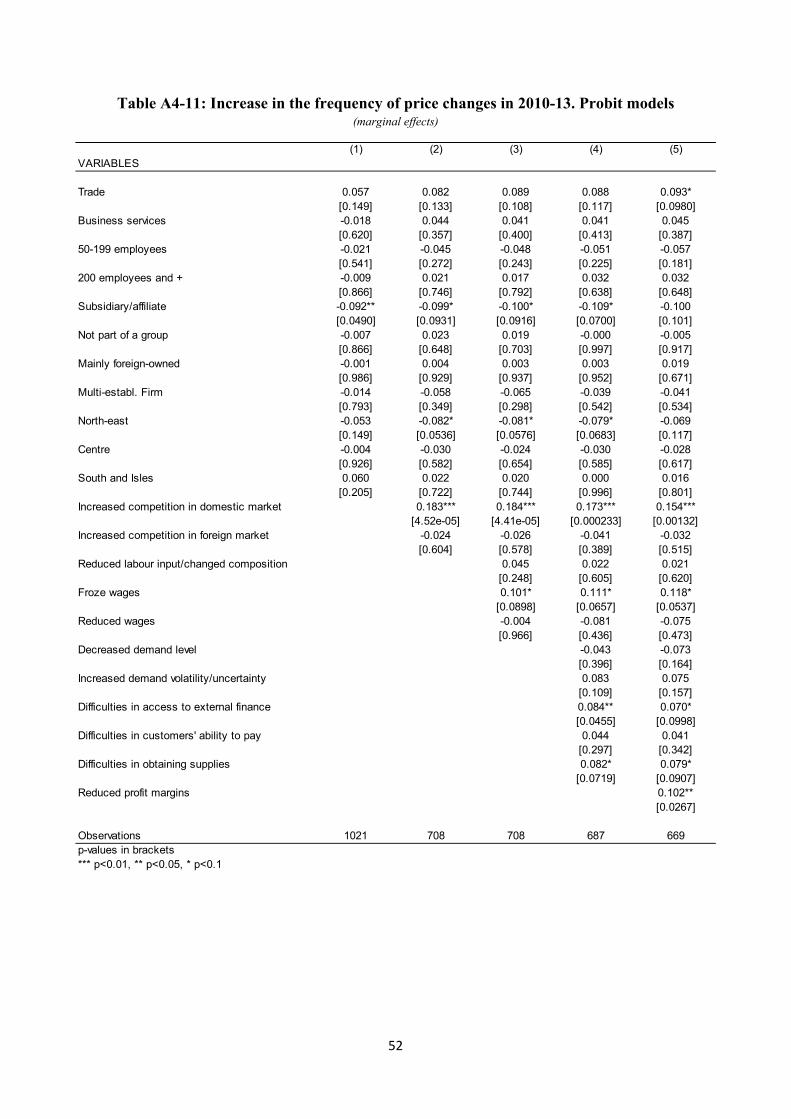
52
Table A4-11: Increase in the frequency of price changes in 2010-13. Probit models (marginal effects)
(1) (2) (3) (4) (5)VARIABLES
Trade 0.057 0.082 0.089 0.088 0.093*[0.149] [0.133] [0.108] [0.117] [0.0980]
Business services -0.018 0.044 0.041 0.041 0.045[0.620] [0.357] [0.400] [0.413] [0.387]
50-199 employees -0.021 -0.045 -0.048 -0.051 -0.057[0.541] [0.272] [0.243] [0.225] [0.181]
200 employees and + -0.009 0.021 0.017 0.032 0.032[0.866] [0.746] [0.792] [0.638] [0.648]
Subsidiary/affiliate -0.092** -0.099* -0.100* -0.109* -0.100[0.0490] [0.0931] [0.0916] [0.0700] [0.101]
Not part of a group -0.007 0.023 0.019 -0.000 -0.005[0.866] [0.648] [0.703] [0.997] [0.917]
Mainly foreign-owned -0.001 0.004 0.003 0.003 0.019[0.986] [0.929] [0.937] [0.952] [0.671]
Multi-establ. Firm -0.014 -0.058 -0.065 -0.039 -0.041[0.793] [0.349] [0.298] [0.542] [0.534]
North-east -0.053 -0.082* -0.081* -0.079* -0.069[0.149] [0.0536] [0.0576] [0.0683] [0.117]
Centre -0.004 -0.030 -0.024 -0.030 -0.028[0.926] [0.582] [0.654] [0.585] [0.617]
South and Isles 0.060 0.022 0.020 0.000 0.016[0.205] [0.722] [0.744] [0.996] [0.801]
Increased competition in domestic market 0.183*** 0.184*** 0.173*** 0.154***[4.52e-05] [4.41e-05] [0.000233] [0.00132]
Increased competition in foreign market -0.024 -0.026 -0.041 -0.032[0.604] [0.578] [0.389] [0.515]
Reduced labour input/changed composition 0.045 0.022 0.021[0.248] [0.605] [0.620]
Froze wages 0.101* 0.111* 0.118*[0.0898] [0.0657] [0.0537]
Reduced wages -0.004 -0.081 -0.075[0.966] [0.436] [0.473]
Decreased demand level -0.043 -0.073[0.396] [0.164]
Increased demand volatility/uncertainty 0.083 0.075[0.109] [0.157]
Difficulties in access to external finance 0.084** 0.070*[0.0455] [0.0998]
Difficulties in customers' ability to pay 0.044 0.041[0.297] [0.342]
Difficulties in obtaining supplies 0.082* 0.079*[0.0719] [0.0907]
Reduced profit margins 0.102**[0.0267]
Observations 1021 708 708 687 669p-values in brackets*** p<0.01, ** p<0.05, * p<0.1
53
References
Banca d’Italia (2009), Annual Report for 2008, May 2009.
Banca d’Italia (2013), Annual Report for 2012, May 2013.
Banca d’Italia (2014), Financial Stability Report, No.1 – 2014.
Banca d’Italia (2015), Annual Report for 2014, May 2015.
Bassanetti, A., Bugamelli, M., Momigliano, S., Sabbatini, R. and F. Zollino (2014), The policy response to macroeconomic and fiscal imbalances in Italy in the last fifteen years, PSL Quarterly Review, 67, pp. 55-103.
Brandolini, A., Casadio, P., Cipollone, P., Magnani, M. and A. Rosolia (2007), “Employment Growth in Italy in the 1990s: Institutional Arrangements and Market Forces,” AIEL Series in Labour Economics, in: Nicola Acocella & Riccardo Leoni (ed.), Social Pacts, Employment and Growth. A Reappraisal of Ezio Tarantelli’s Thought, edition 1, chapter 4, pages 31-68 AIEL - Associazione Italiana Economisti del Lavoro.
Brandolini, A. and M. Bugamelli (2009), Rapporto sulle tendenze nel sistema produttivo italiano, Questioni di economia e finanza, No. 45.
Busetti F. and P. Cova (2013), L’impatto macroeconomico della crisi del debito sovrano: un’analisi controfattuale per l’economia italiana, Banca d’Italia, Questioni di economia e finanza, No. 201.
D’Amuri, F. (2014), Composition effects and average wage dynamics in Italy, 2009-13, Banca d’Italia, mimeo.
D’Amuri, F. and C. Giorgiantonio (2015), The Institutional and Economic Limits to Bargaining Decentralization in Italy, IZA Policy Paper, 98.
ECB (2012), Euro area labour markets and the crisis, Task Force of the Monetary Policy Committee of the European System of Central Banks, ECB Occasional Paper Series, No. 138.
Fabiani, S., Gattulli, A. and R. Sabbatini (2004), The pricing behaviour of Italian firms: new survey evidence on price stickiness, ECB Working Paper, No. 333.
Fabiani, S. and M. Porqueddu (2015), Changing prices ... changing times: evidence for Italy, Banca d’Italia, Questioni di economia e finanza, No. 275.
Fabiani, S. and R. Sabbatini (2011), Wage adjustment by Italian firms: any difference during the crisis? A survey-based analysis, Banca d’Italia, Questioni di Economia e Finanza, No. 94.
Riggi, M. and F. Venditti (2015), Surprise! Euro-area inflation has fallen, Banca d’Italia, Questioni di economia e finanza, No. 237.
Rosolia, A. (2014), The Italian labor market after the Great crisis, in M. Bugamelli, A. Locarno, R. Sabbatini e F. Zollino (edited by), Gli effetti della crisi sul potenziale produttivo e sulla spesa delle famiglie in Italia, Banca d’Italia, Seminari e convegni, 2014.
Signorini, L.F. (2014), Audizione preliminare all’esame dei documenti di bilancio per il triennio 2015-2017, Camera dei Deputati, Rome, November.
Visco, I. (2008), Indagine conoscitiva sull’assetto delle relazioni industriali e sulle prospettive di riforma della contrattazione collettiva, Commissione 11ª (Lavoro pubblico e privato) della Camera dei Deputati.