Embed Size (px)
Citation preview

Questioni di Economia e Finanza(Occasional Papers)
The price of cyber (in)security: evidence from the Italian private sector
by Claudia Biancotti
Num
ber 407N
ovem
ber
201
7


Questioni di Economia e Finanza(Occasional papers)
Number 407 – November 2017
The price of cyber (in)security: evidence from the Italian private sector
by Claudia Biancotti
The series Occasional Papers presents studies and documents on issues pertaining to
the institutional tasks of the Bank of Italy and the Eurosystem. The Occasional Papers appear
alongside the Working Papers series which are specifically aimed at providing original contributions
to economic research.
The Occasional Papers include studies conducted within the Bank of Italy, sometimes
in cooperation with the Eurosystem or other institutions. The views expressed in the studies are those of
the authors and do not involve the responsibility of the institutions to which they belong.
The series is available online at www.bancaditalia.it .
ISSN 1972-6627 (print)ISSN 1972-6643 (online)
Printed by the Printing and Publishing Division of the Bank of Italy
THE PRICE OF CYBER (IN)SECURITY: EVIDENCE FROM THE ITALIAN PRIVATE SECTOR
by Claudia Biancotti*
Abstract
This paper presents evidence on the economic dimension of cyber risk in the Italian private non-financial sector, based on Bank of Italy survey data. In 2016, the median amount spent on preventing cyber attacks was a modest €4,530, i.e. 15 per cent of a typical worker’s annual gross wages. A wide variation exists across sectors and size classes, reflecting differences in how appealing a target a firm is to attackers and firms’ awareness of threats: median values range from €3,120 for small firms to €19,080 in the ICT sector and €44,590 for large firms. The market for cyber defence in our reference universe is worth at least €570 million. Having been attacked in the past proves to be a strong incentive to invest in security. The majority of breached firms suffered damages worth less than €10,000; 0.1 per cent reported costs of at least €200,000. Neither the sampling design nor the questionnaire were geared towards the measurement of tail events: underestimation of large incidents is likely. More information is needed before the economy-wide cost can be estimated.
JEL Classification: F50, L60, L80, C83. Keywords: cyber attacks, cybersecurity, cyber risk.
Contents
1. Motivation ........................................................................................................................... 5
2. The data ................................................................................................................................ 7
3. Descriptive results ................................................................................................................ 8
4. Cluster analysis .................................................................................................................. 21
5. Robust estimation of expenditure ....................................................................................... 24
6. Comparison with the UK Cyber Security Breaches Survey .............................................. 28
7. Conclusions ........................................................................................................................ 29
Appendix .................................................................................................................................. 31
References ................................................................................................................................ 42
________________________
* Bank of Italy, Directorate General for Economics, Statistics and Research.


1. Motivation1
As the threat posed by cyber attacks increases, so does the need for statistically sound data on the
subject. In May 2017, the G7 finance ministers and central bank governors declared that “no point of
cyberspace can be absolutely secure as long as cyber threats persist in the surrounding environment; our
drive to strengthen the financial system against cyber attacks can achieve maximum results only if
accompanied by measures that reduce the level of insecurity in cyberspace as a whole. In turn, economy-
wide policies must be based on reliable, impartial, comprehensive and widely accessible data” (G7, 2017).
Not only is lack of such data an obstacle to policy design (Biancotti et al., 2017); it also has a direct
negative impact on the private sector. Corporate decision-makers often have to choose how much to invest in
cybersecurity based on information provided by commercial entities with an incentive to overstate the
economic impact of breaches. Estimates of damage from cyber attacks based on the UK Government’s
Cyber Security Breaches Survey (CSBS in the following; United Kingdom Department for Culture, Media
and Sport, 2017), a rare example of official statistics in this area, are markedly lower compared to some
widely quoted commercial figures. Low-quality data hinder the growth of a market for cyber insurance and,
as a consequence, the efficient management and transfer of cyber risk; the Organization for Economic Co-
operation and Development (OECD, 2016) points out that insurers have a hard time designing cyber policies
in the absence of reliable historical information on the prevalence of attacks and related losses.
A previous paper (Biancotti, 2017) made a first attempt at addressing the data gap for Italy by estimating
the incidence of cyber attacks in the private non-financial sector, based on the business surveys carried out in
2016 by the Bank of Italy. The study proved that firms can provide informative data on cybersecurity in the
context of a multi-purpose economic survey; however, as it was a preliminary step, questions did not cover
the relationship between expenditure on cyber defence and firm-level vulnerability, nor the impact of cyber
breaches. This paper fills the gap, drawing on specific questions that were added to the surveys in 2017.
We find that in 2016 the median firm spent a modest €4,530 to prevent cyber attacks, roughly 15 per cent
of median gross annual wages for a representative worker, or 2.5 per cent of median firm-level gross
domestic fixed investment. In this case, however, economy-wide indicators have limited relevance, as
variation across categories is very high. Median defensive expenditure ranged from €3,240 in low-tech
sectors to €19,080 euro in the ICT sector ; technologically advanced firms handle large quantities of valuable
data, hence attracting attackers, and they can count on decision-makers who understand the threat.
Size matters, too: the median firm with 500 employees and over spent €44,590, vis-à-vis the €3,120 of its
counterpart with less than 50 employees. Large firms have more connected devices to protect, more staff
that need to be trained to use them securely, and more potential entry points for attackers. They are also more
1 I would like to thank Pietro Catte, Paolo Ciocca, Riccardo Cristadoro, Antonino Fazio, and Giovanni Veronese for their comments. The Sample Surveys Division at the Bank of Italy and the cybersecurity community of the Italian government provided substantial help with the survey questions. All remaining mistakes and omissions are mine. The views here expressed are those of the author and should not be attributed to the Bank of Italy.
5

li kely than small ones to have a dedicated IT department which can assess risk levels properly, and they can
benefit from economies of scale for certain protective measures.
As expected, differences also emerge between exporters and non-exporters, on account of the former’s
greater exposure to cross-border attacks compared to firms that are only known locally.
Expenditure is also markedly lower in Southern Italy, with a median value of €2,700, against over €5,000
for Northern regions. This is partly explained by composition effects: the share of small and low-tech firms
is higher in the South compared to the rest of the country, and the share of exporters is lower. However, a
statistically significant difference remains even after controlling for these factors: it may reflect unobserved
characteristics of the context, both on the demand side (e.g. less frequent use of connected devices, lower
threat awareness) and the supply side (e.g. a smaller market for cybersecurity services).
Based on our data, the market for cyber protection in 2016 was worth at least €570 million; the ICT sector,
which employs 5 per cent of the labour force in the reference universe, accounted for 11 per cent of total
expenditure in cyber defense.
Among defensive measures, anti-malware software was nearly ubiquitous, although the survey does not
probe whether it was regularly updated. Cybersecurity training for employees was offered by two thirds of
firms; analysis of vulnerabilities and encryption were less common. Having been attacked in the past proved
a strong incentive to security investment: most firms that reported a breach in 2016 experienced business
disruption and/or needed extra working hours for recovery, and 81 per cent upgraded their defences as a
consequence.
Informative estimates on the monetary damage caused by attacks are more complex to obtain. More than
90 per cent of firms report having sustained a direct cost below €10,000; only about one per cent reported
damages in excess of €50,000, with 0.1 per cent above €200,000. We know from several sources that large-
scale incidents exist, and they are a core component of the cybersecurity story; however, they are nearly
absent from our sample. More data on tail events, along with correction models for under-reporting, will be
needed before the total cost of attacks for the economy can be estimated; this could be achieved via
oversampling of high-value targets, combined with auxiliary information from other datasets (e.g. breach
notifications sent to the national data protection authority).
Despite differences in the reference universe and in the definitions of some variables, our estimates are
broadly in line with those obtained from the UK CSBS. Average expenditure is in the thousands of
euros/British pounds2 for small firms, in the tens of thousands for medium ones, in the hundreds of thousands
for large ones; its distribution is highly skewed, and the ICT sector consistently stands out from the rest on
all defence metrics. Reported costs from attacks are generally small, mostly in the thousands, but the
complete picture is hard to gauge given the asymmetry of the distribution and the limitations of the sample.
2 At the time of writing, the exchange rate was 1 British pound to 1.10 euros.
6

The paper is structured as follows. Section 2 describes the data; Section 3 presents key descriptive
findings on cybersecurity expenditure at the firm level, the frequency of cyber attacks, and their economic
impact; Section 4 looks jointly at all these dimensions so as to identify clusters of firms that are
homogeneous with respect to cybersecurity; Section 5 proposes models for robust estimation of expenditure;
Section 6 compares our results with those of the UK CSBS; Section 7 concludes. The Appendix provides
further statistical details.
2. The data
Every year, the Bank of Italy carries out two surveys of Italian private sector firms, covering industrial
and non-financial services firms with at least 20 employees. The sample is randomly selected according to a
stratified design; the results are statistically representative by macro-region, size class and certain
aggregations of NACE Rev.2 sectors (see Banca d’Italia, various years for methodological documentation).
Between January and May of each year, the main quantitative descriptors of a firm’s economic activity
(employment, investment, turnover) are measured. Between September and October, a qualitative follow-up
records changes in those variables.3 Questionnaires also include time-varying monographic questions, driven
by contingent informational needs. Respondents are typically executives or administrative staff with a broad
knowledge of the business, who sometimes consult with field specialists – e.g. IT personnel – to answer
some of the more technical questions.
In 2017, the quantitative survey featured a section on cybersecurity, structured into six questions:
Q1. Does your firm adopt the following cybersecurity measures (Yes/No)? Please also consider measures that are outsourced.
(i) Use of defensive hardware/software (e.g. anti-virus, firewall etc.) (ii) Training for employees on the secure use of IT devices (iii) Data encryption, even if only applied to a part of the data (iv) Analysis and management of vulnerabilities in the firm’s IT systems
Q2. In 2016, approximately how much did you spend to defend yourself against the risk of cyber attacks? Please consider all the activities indicated above and any other activity aimed at attack prevention, either handled internally or outsourced (e.g.: salaries of employees and/or external consultants working on cybersecurity; price of defensive software or hardware; cost of training). Express your answer in thousands of euros.
Q3. In 2016, was your firm hit by a cyber attack? (Yes/No) Only consider the attacks that had consequences, no matter how limited and/or short-lived and/or easily reversible, on the functioning of the firms’ systems and/or on the integrity and confidentiality of data therein stored.
[End of section for firms that reported no attacks]
Q4. Did any of these attacks cause… (Yes/No)
(i) An interruption or a slowdown of ordinary work activities (ii) Extra working hours (of employees or external consultants) to repair technical damages, communicate with
clients and/or suppliers and/or shareholders concerning the attack etc. (iii) Theft or loss of data, including intellectual property
3 The dataset is not a full panel due to attrition; the overlap between adjacent surveys is at around 80 per cent.
7
Q5. In 2016, approximately how much damage did these attacks cause? Consider all the items indicated above and any other monetary cost caused by the attacks (e.g. compensation given to clients or suppliers, legal costs, fines from regulatory entities). Express your answer in thousands of euros.
Q6. Did you strengthen your security measures after the attacks? (Yes/No)
For Q2 and Q5, respondents were given the option of either providing a point value or choosing one of the
following options: (i) No expenditure/damage; (ii) Less than € 10,000; (iii) Between € 10,000 and € 49,999; (iv)
Between € 50,000 and € 199,999; (v) € 200,000 and over.
In order for the questionnaire to be considered valid by the Bank of Italy, a set of core items on
employment, turnover, and investment have to be answered: all the rest are optional. In the 2017 wave, the
optional sections covered, among other themes, cybersecurity, hydrogeological risk, skill shortages, and the
uptake of certain public incentives to investment. Of the 4,209 firms interviewed in the survey, 8.4 per cent
did not answer any of the optional questions. We chose to exclude such firms from our analysis, so as to
preserve the information that we can extract from section-specific non-response patterns. Sometimes the
absence of an answer can be informative per se, as shown in Biancotti (2017). Non-response limited to
individual cybersecurity questions, or even the whole section, might be correlated with the existence of a
data breach: firms that have not been attacked have no reason to hide anything, while firms that have been hit
may choose to skip the question to avoid reputational damage. However, this should not be conflated with
non-response to a large set of optional questions related to heterogeneous topics: firms that only provided
values for the core variables were probably pressed for time, rather than reluctant to report a cyber attack.
Our final sample comprises 3,824 firms (Appendix Table A1).
3. Descriptive results
3.1 Cyber defence
Data on cyber defence measures adopted by firms conveys two main messages. First, large firms and
companies operating in the ICT sector are significantly more invested in cybersecurity. Second, having been
attacked is a key motivation for spending on defence, possibly indicating a lack of risk awareness prior to
being hit.
3.1.1 Defensive measures
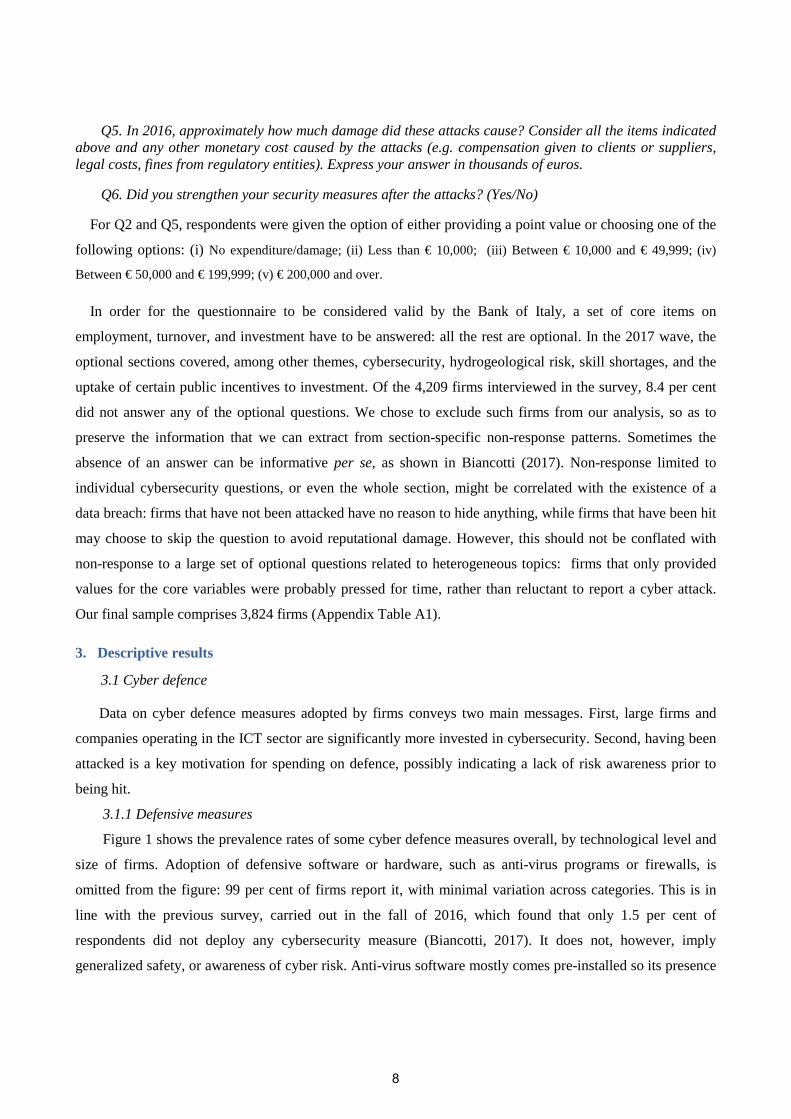
Figure 1 shows the prevalence rates of some cyber defence measures overall, by technological level and
size of firms. Adoption of defensive software or hardware, such as anti-virus programs or firewalls, is
omitted from the figure: 99 per cent of firms report it, with minimal variation across categories. This is in
line with the previous survey, carried out in the fall of 2016, which found that only 1.5 per cent of
respondents did not deploy any cybersecurity measure (Biancotti, 2017). It does not, however, imply
generalized safety, or awareness of cyber risk. Anti-virus software mostly comes pre-installed so its presence
8
does not necessarily reflect a deliberate choice of the system manager. We do not know whether the software
is updated whenever needed and the hardware is appropriately configured.4
Cybersecurity training for employees is quite widespread, at 65 per cent of firms; analysis and
management of vulnerabilities follows, at 56.9 per cent; encryption is only adopted by 32.7 per cent.
Proportions are very variable according to size and technological maturity, but the ordering remains the
same.
Figure 1
Cyber defence measures adopted by firms, 2016 (percentages of firms)
a. overall and by technological level(*)
b. by number of employees
(*) ICT sector: OECD classification. High-tech non-ICT: non-ICT manufacturing firms with high or medium-high technological intensity, and non-ICT service firms with high knowledge intensity, according to OECD/Eurostat classification. Low-tech: all other firms. Firms in the energy sector, not covered by the original classification, are reclassified as non-ICT high-tech.
The relative unpopularity of encryption is puzzling at first glance. Of the measures surveyed, it is the
cheapest one: military-grade encryption algorithms are freely available in the public domain, and they can be
applied with almost no effort to some type of data, such as business emails. Large-scale encryption has a cost
in terms of working hours, it can result in cumbersome operation of some devices, and data may be lost if
4 More generally, quality is not measured for any of the defensive measures surveyed; while the questionnaire offered definitions, there is no guarantee that all firms took the same words to mean the same activity.
0% 20% 40% 60% 80% 100%
Data encryption
Analysis of vulnerabilities
Cybersecurity training
Overall Low-tech High-tech non-ICT ICT
0% 20% 40% 60% 80% 100%
Data encryption
Analysis of vulnerabilities
Cybersecurity training
20-49 50-199 200-499 500 and over
9
encryption keys are not properly managed; however, it is still likely to be less expensive compared to
training or analysis of vulnerabilities. So why do firms spend on these two measures, but forego a low-cost
way to protect the confidentiality of their data?5
The vendor-driven nature of the market for cybersecurity (Anderson, 2001) is a prime suspect.
Asymmetric information is an issue: most consumers of defensive products are unlikely to fully understand
the nature of the threat, and the effectiveness of each proposed solution. Vendors have an incentive to
suggest whatever maximizes their own profit, rather than what is appropriate for the client6,7. From their
perspective, security training and toolkits/services of vulnerability analysis are a safer bet compared to
encryption, where the competition of free solutions is strong8. On the demand side, data theft might just not
be enough of a concern for firms to trigger the use of encryption (see Subsection 3.2 for further details).
Simple frequency estimates already reveal some key patterns (Appendix Table A2). The ICT sector has
near-ubiquitous security training and network analysis, with 77 per cent of firms encrypting at least some of
their data9; low-tech firms have prevalence rates for training, network analysis and encryption around 60 per
cent, 50 per cent and slightly less than 30 per cent respectively. ICT firms are attractive to attackers, because
they store large quantities of valuable data in electronic form; they can also count on decision-makers who
understand the threat, including that of data theft. These two factors combine to yield an intensive use of
various protection systems.
Larger firms also deploy more defences compared to smaller ones; the prevalence of all measures increases
monotonically with size. They have more connected devices to protect, more staff that needs to be trained to
use them securely, more entry points even for unsophisticated, untargeted attacks. As shown by works in
game theory applied to cybersecurity (see Fielder, 2014 for a review), in some cases hackers only need to
find one weak link in their target’s IT systems to succeed, whereas defenders have to cover all bases (“attack
anywhere/defend everywhere” model). Large firms are also more likely than small ones to have a dedicated
IT department which can assess risk levels properly, with its own budget; they can benefit from economies
of scale for certain protective measures.
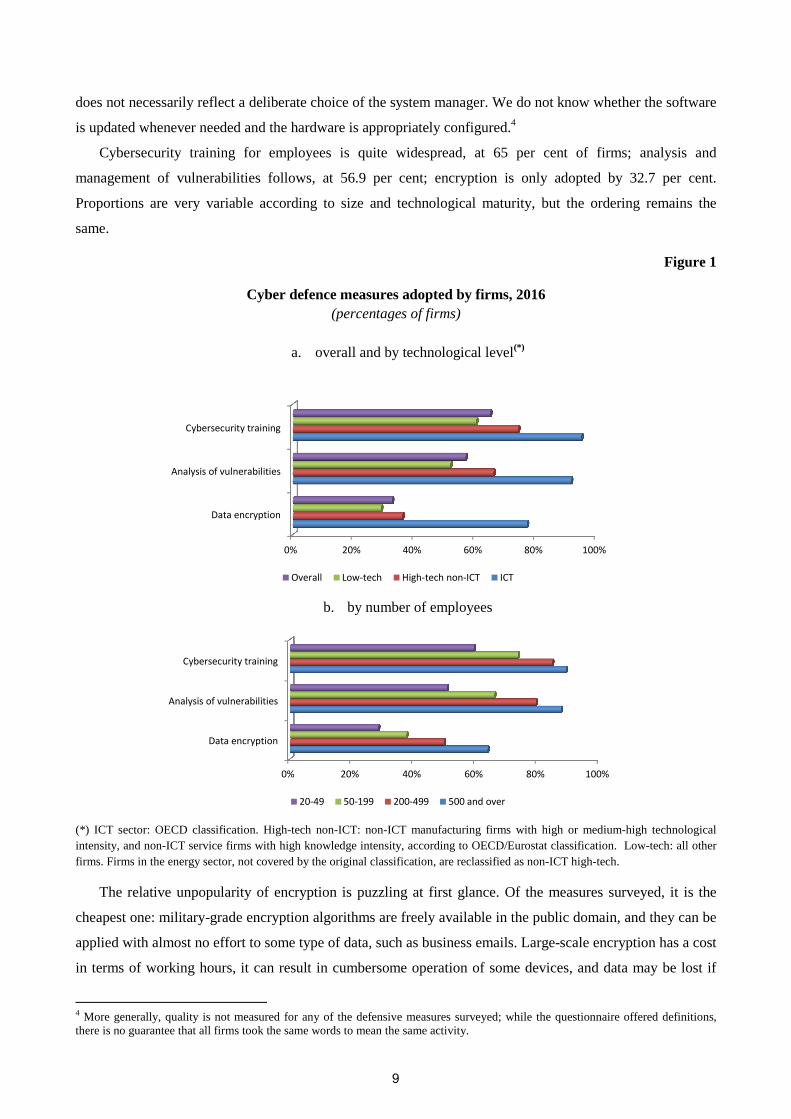
The data suggest that falling victim to an attack is a strong incentive to cybersecurity investment. Indeed,
the overwhelming majority of firms that reported a breach strengthened their defences in the aftermath
(Figure 2).
5 Response error might lead to some underestimation of the prevalence of encryption. Some routine encryption/decryption procedures might run in the background on a firm’s IT systems, and they might not be reported because only a handful of specialists are aware of their existence.6 In the wake of the WannaCry ransomware crisis in May 2016, one senior security expert in the UK government pointed out in a newspaper interview that this in itself contributes to cyber insecurity, as firms are pushed towards expensive solutions that are nonetheless not sufficient to keep them safe (Kaminska, 2017). 7 A survey by the Australian government shows that companies with a high degree of cyber resilience are more likely than the rest to look to official sources for security guidance, as opposed to the private sector (Australian Cyber Security Centre, 2016). 8 According to a recent survey, more than 40 per cent of encryption products available on the internet are free, and 34 per cent are
open-source, allowing anyone to check their validity (Schneider et al., 2016). 9 Note that the figures for the ICT sector appear not to have a significant impact on the general mean. The ICT sector as defined in this paper only accounts for about 4 per cent of firms in the reference universe; the differences with other sectors are statistically significant in most cases, but the incidence of the sector on the total economy is limited, especially when only weighting for the number of firms.
10

Figure 2
Upgrade of defences after attacks, 2016 (percentages of firms that reported attacks)
Regression analysis confirms that size, technological maturity and attack status have an impact on
defensive choices (Table 1; the dependent variable is the number of defensive measures reported by a
firm10). An ICT firm deploys 1.15 measures more than its low-tech counterparts; firms that were attacked
and upgraded their defences have 0.41 more than those that were not attacked11. Belonging to the smallest
size class has roughly the same effect, with the opposite sign.
A few other dimensions emerge as significant. Firms located in the South of Italy have a slightly lower
level of protection (-0.14 measures) compared to the rest of the country, even after controlling for the higher
prevalence of small and low-tech firms in the region. This may reflect unobserved characteristics of the
context, such as less intensive use of connected devices, and a smaller market for cybersecurity services.
Exporters and firms that operate infrastructures, such as ports or water distribution systems, have more
defences; both results are expected. Firms with an international dimension are more likely to have experience
in conducting business online, resulting in higher threat awareness, and they are more exposed to cross-
border attacks. Infrastructure is a high-value target for hackers, because it allows them to jeopardize all
activities that rely on it with a single stroke; cyber defence has become a priority for infrastructure operators
long before it was a matter of general interest, especially in sectors where an attack could threaten public
safety.
Interestingly, manufacturing fares worse than services, after technological content is controlled for; this is
probably because some services that fall in the low-tech category according to the OECD/Eurostat
classification used in this paper, such as trade and hospitality, are more likely to have an online presence,
however small, compared to low-tech manufacturing. While the explanatory power of the regression is
limited, suggesting that unobserved idiosyncratic characteristics play a large role in explaining defensive
10 The same results also obtain for different specifications, and for three separate logistic regressions where the dependent variables indicate, respectively, whether a firm provides cybersecurity training, performs analysis of vulnerabilities, and uses encryption. 11 The difference with firms that were attacked but did not upgrade their defences has the expected sign, but it is not significant. Results on this group of firms generally lack robustness, because the group is small and concentrated in the bottom size class.
0%
20%
40%
60%
80%
100%
20 - 49 50 - 199 200 - 499 500 and over
Firm upgraded defenses Firm did not upgrade defenses
11
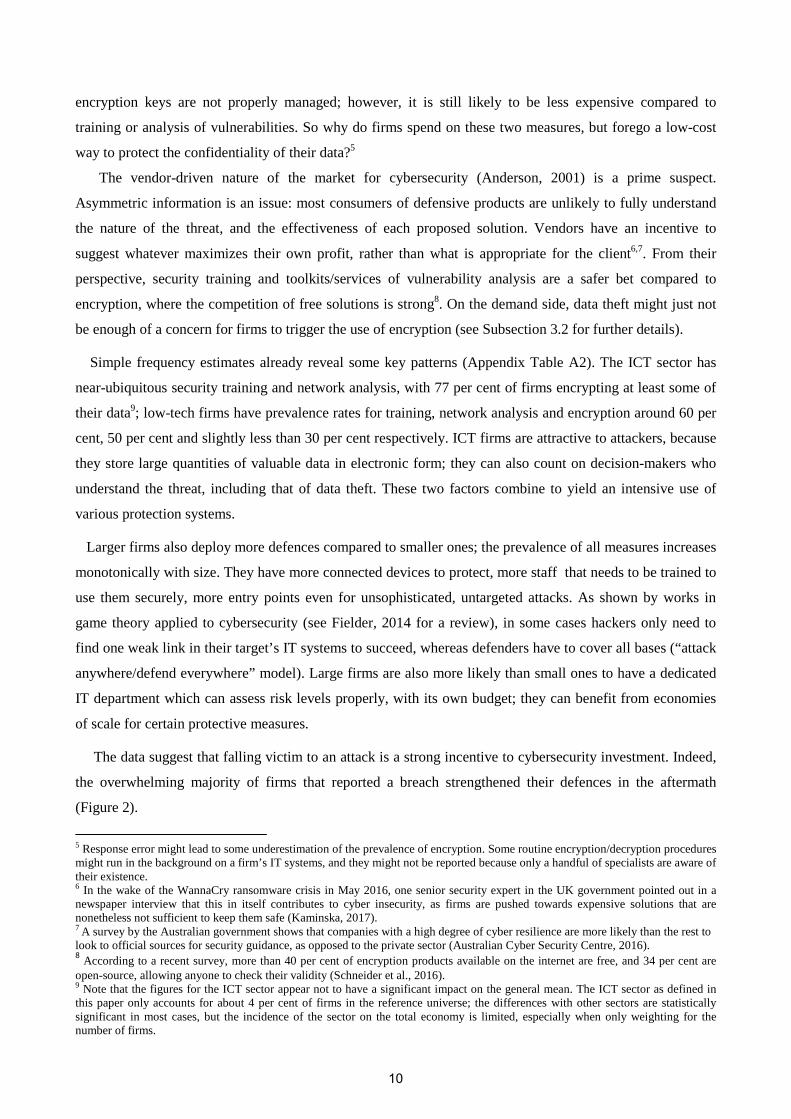
choices, effects are significant and have the expected sign (for definitions of covariates, see Appendix Table
A3).
Table 1
Determinants of the adoption of defensive measures, 2016 (linear regression)
Intercept 2.910 ***
(0.054)
Small -0.409 ***
(0.038)
South -0.140 **
(0.046)
ICT 1.147 ***
(0.090)
High-tech non-ICT 0.312 ***
(0.043)
Manufacturing -0.334 ***
(0.038)
Export share: less than 1/3 -0.175 ***
(0.044)
Infrastructure 0.315 **
(0.129)
Attacked, upgraded defences 0.409 ***
(0.044)
Attacked, did not upgrade defences -0.102
(0.085)
N 3,456
R20.14
Levels of statistical significance of coefficients : *** 1% ** 5% *10%
3.1.2 Expenditure on cyber defence
39 per cent of the sample provided a point estimate for expenditure on cyber defence; 50 per cent
provided an interval estimate, and the rest declined to answer the question. As point estimates can readily be
turned into intervals but not vice versa, in this Section we only present results by intervals. In Section 5 we
return to this issue using model-based estimates of point values. Obvious material response errors in point
values were rectified before turning them into intervals12.
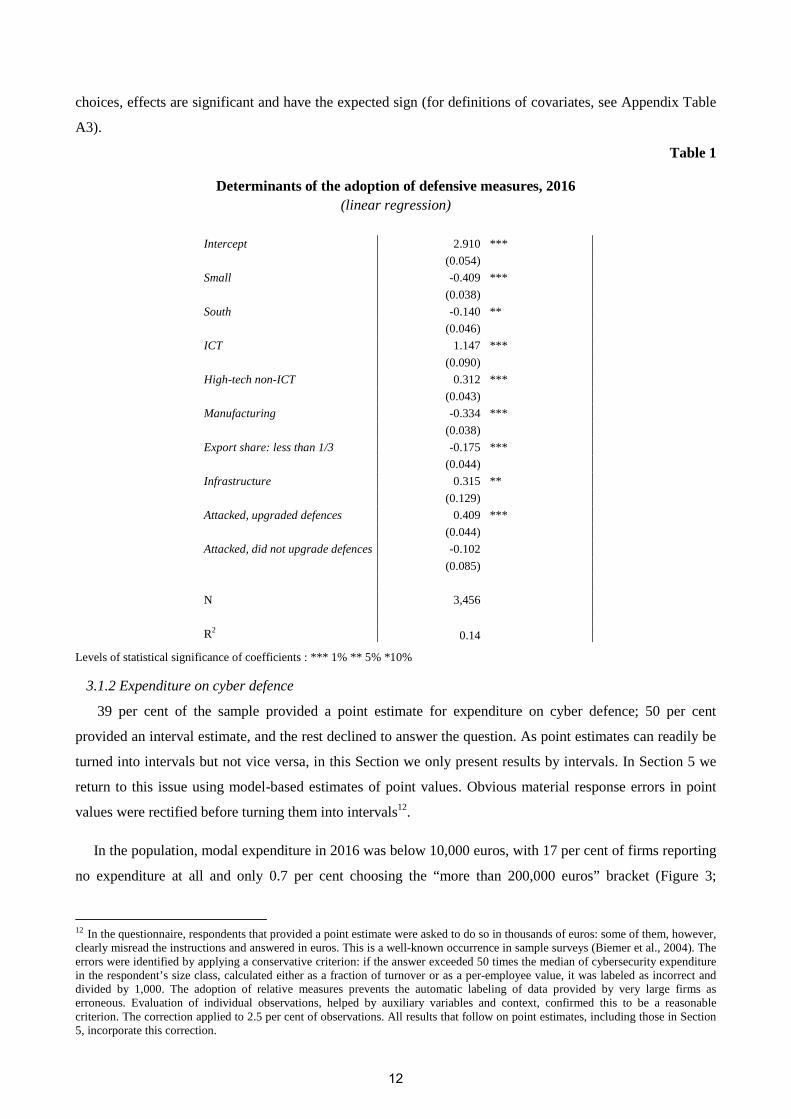
In the population, modal expenditure in 2016 was below 10,000 euros, with 17 per cent of firms reporting
no expenditure at all and only 0.7 per cent choosing the “more than 200,000 euros” bracket (Figure 3;
12 In the questionnaire, respondents that provided a point estimate were asked to do so in thousands of euros: some of them, however, clearly misread the instructions and answered in euros. This is a well-known occurrence in sample surveys (Biemer et al., 2004). The errors were identified by applying a conservative criterion: if the answer exceeded 50 times the median of cybersecurity expenditure in the respondent’s size class, calculated either as a fraction of turnover or as a per-employee value, it was labeled as incorrect and divided by 1,000. The adoption of relative measures prevents the automatic labeling of data provided by very large firms as erroneous. Evaluation of individual observations, helped by auxiliary variables and context, confirmed this to be a reasonable criterion. The correction applied to 2.5 per cent of observations. All results that follow on point estimates, including those in Section 5, incorporate this correction.
12
Appendix Table A4). The firm-level median gross annual wages for an average employee amounted to
29,700€ in 2016: the majority of firms did not spend enough in cybersecurity to cover the cost of a
representative full-time resource. In the questionnaire, respondents are explicitly instructed to include in their
estimate the cost of personnel, whether internal or external, e.g. contractors and consultants; barring very
pervasive response error, the data indicate that most firms do not employ specialists, and only allocate a
modest share of their generic IT human resources to cybersecurity.
The distribution is shifted to the right for larger firms, high-tech and internationally exposed ones, to the
left for small and low-tech firms. More than 30 per cent of firms with 500 employees and over invested at
least 50,000 euros for cybersecurity in 2016, and 15 per cent invested more than 200,00013. Attacks matter
here, too: those who reported a breach indicated zero expenditure only in 5.2 per cent of cases, against 22.4
per cent for those who didn’t. This suggests that for many firms an attack is the watershed between not
considering cybersecurity an issue at all and starting to look at it as a component of risk management.
Figure 3
Firms’ expenditure on cyber defence, 2016 (percentages of firms; expenditure brackets in euros)
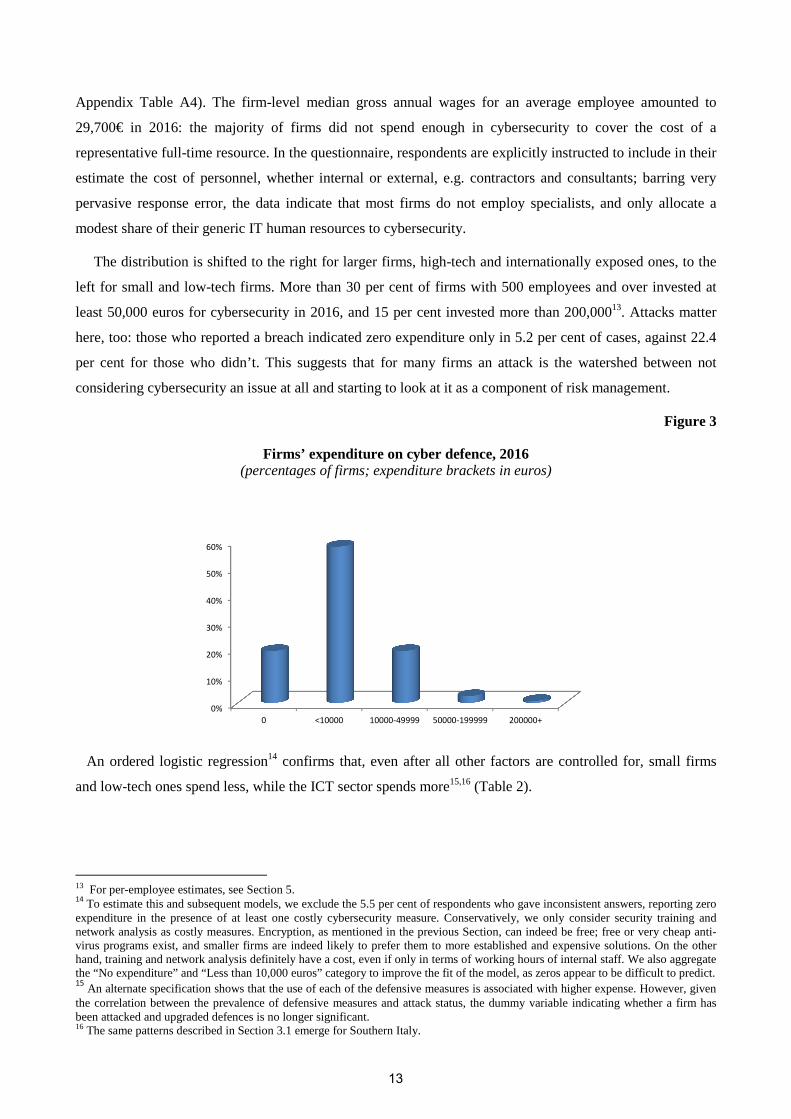
An ordered logistic regression14 confirms that, even after all other factors are controlled for, small firms
and low-tech ones spend less, while the ICT sector spends more15,16 (Table 2).
13 For per-employee estimates, see Section 5.14 To estimate this and subsequent models, we exclude the 5.5 per cent of respondents who gave inconsistent answers, reporting zero expenditure in the presence of at least one costly cybersecurity measure. Conservatively, we only consider security training and network analysis as costly measures. Encryption, as mentioned in the previous Section, can indeed be free; free or very cheap anti-virus programs exist, and smaller firms are indeed likely to prefer them to more established and expensive solutions. On the other hand, training and network analysis definitely have a cost, even if only in terms of working hours of internal staff. We also aggregate the “No expenditure” and “Less than 10,000 euros” category to improve the fit of the model, as zeros appear to be difficult to predict. 15
An alternate specification shows that the use of each of the defensive measures is associated with higher expense. However, given the correlation between the prevalence of defensive measures and attack status, the dummy variable indicating whether a firm has been attacked and upgraded defences is no longer significant. 16 The same patterns described in Section 3.1 emerge for Southern Italy.
0%
10%
20%
30%
40%
50%
60%
0 <10000 10000-49999 50000-199999 200000+
13
Table 2
Determinants of expenditure on cyber defence at the firm level, by intervals, 2016 (ordered logistic regression)
Small -3.635 ***
(0.070)
Medium (low) -2.527 ***
(0.070)
Medium (high) -1.531 ***
(0.079)
South -0.434 ***
(0.034)
ICT 2.313 ***
(0.050)
High-tech non-ICT 0.539 ***
(0.028)
Manufacturing -0.228 ***
(0.026)
Infrastructure 0.870 ***
(0.073)
Attacked, upgraded defences 0.311 ***
(0.027)
Attacked, did not upgrade defences -0.460 *** (0.064)
Turnover per employee 5.38*10-4 ***
(2.20*10-5)
Turnover per employee squared -1.23*10-8 ***
(6.44*10-10)
Export share: less than 1/3 -0.280 ***
(0.029)
Intercept: 200,000+ -2.379 ***
(0.082)
Intercept: 50,000-199,999 -0.700 ***
(0.072) Intercept: 10,000-49,999
1.887 ***
(0.074)
N 3,005
Levels of statistical significance of coefficients : *** 1% ** 5% *10%
The predictive fit of the model is strongly differentiated across expenditure classes, as shown in
Appendix Table 5. More than 89 per cent of firms that spend up to 10,000 euros are correctly classified, and
all of the misclassification occurs in the adjacent class. Conversely, almost none of the firms that spend
between 50,000 and 199,999€ is classified correctly, although most errors are small; only 14 per cent of top
spenders are correctly predicted, with several large discrepancies. This depends on the small number of
(highly heterogeneous) observations in the upper classes, from issues with the attack indicators that are
discussed below, and it is also likely to reflect unobserved factors: for example, outside of sectors where it is
now commonplace to be concerned with cybersecurity, subjective attitudes of board members can make the
difference.
14
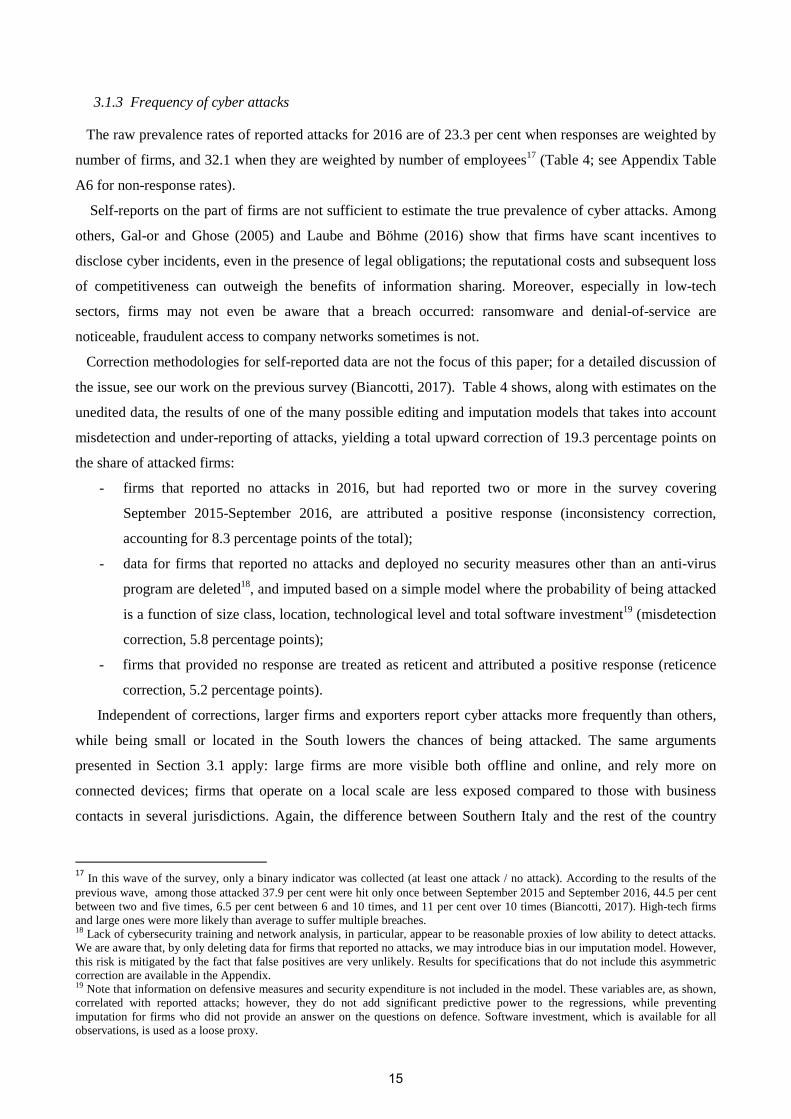
3.1.3 Frequency of cyber attacks
The raw prevalence rates of reported attacks for 2016 are of 23.3 per cent when responses are weighted by
number of firms, and 32.1 when they are weighted by number of employees17 (Table 4; see Appendix Table
A6 for non-response rates).
Self-reports on the part of firms are not sufficient to estimate the true prevalence of cyber attacks. Among
others, Gal-or and Ghose (2005) and Laube and Böhme (2016) show that firms have scant incentives to
disclose cyber incidents, even in the presence of legal obligations; the reputational costs and subsequent loss
of competitiveness can outweigh the benefits of information sharing. Moreover, especially in low-tech
sectors, firms may not even be aware that a breach occurred: ransomware and denial-of-service are
noticeable, fraudulent access to company networks sometimes is not.
Correction methodologies for self-reported data are not the focus of this paper; for a detailed discussion of
the issue, see our work on the previous survey (Biancotti, 2017). Table 4 shows, along with estimates on the
unedited data, the results of one of the many possible editing and imputation models that takes into account
misdetection and under-reporting of attacks, yielding a total upward correction of 19.3 percentage points on
the share of attacked firms:
- firms that reported no attacks in 2016, but had reported two or more in the survey covering
September 2015-September 2016, are attributed a positive response (inconsistency correction,
accounting for 8.3 percentage points of the total);
- data for firms that reported no attacks and deployed no security measures other than an anti-virus
program are deleted18, and imputed based on a simple model where the probability of being attacked
is a function of size class, location, technological level and total software investment19 (misdetection
correction, 5.8 percentage points);
- firms that provided no response are treated as reticent and attributed a positive response (reticence
correction, 5.2 percentage points).
Independent of corrections, larger firms and exporters report cyber attacks more frequently than others,
while being small or located in the South lowers the chances of being attacked. The same arguments
presented in Section 3.1 apply: large firms are more visible both offline and online, and rely more on
connected devices; firms that operate on a local scale are less exposed compared to those with business
contacts in several jurisdictions. Again, the difference between Southern Italy and the rest of the country
17 In this wave of the survey, only a binary indicator was collected (at least one attack / no attack). According to the results of the
previous wave, among those attacked 37.9 per cent were hit only once between September 2015 and September 2016, 44.5 per cent between two and five times, 6.5 per cent between 6 and 10 times, and 11 per cent over 10 times (Biancotti, 2017). High-tech firms and large ones were more likely than average to suffer multiple breaches. 18 Lack of cybersecurity training and network analysis, in particular, appear to be reasonable proxies of low ability to detect attacks. We are aware that, by only deleting data for firms that reported no attacks, we may introduce bias in our imputation model. However, this risk is mitigated by the fact that false positives are very unlikely. Results for specifications that do not include this asymmetric correction are available in the Appendix. 19 Note that information on defensive measures and security expenditure is not included in the model. These variables are, as shown, correlated with reported attacks; however, they do not add significant predictive power to the regressions, while preventing imputation for firms who did not provide an answer on the questions on defence. Software investment, which is available for all observations, is used as a loose proxy.
15

partly depends on composition effects; however, it is still statistically significant, although smaller, after
controlling for size, sector and internationalisation (see Biancotti, 2017 for regression analysis showing this).
Table 3
Firms hit by at least one cyber attack, unedited and corrected data (percentages; estimates on full sample)
Share of firms,
unedited
Share of firms,
corrected
Total correction (points)
Inconsistency correction (points)
Misdetection correction (points)
Reticence correction (points)
Share of employees, unedited
Share of employees, corrected
Geographical area North-West 22.6 42.0 19.4 8.8 4.6 6.0 30.1 49.2
North-East 27.4 46.8 19.4 9.1 4.4 5.9 34.0 51.9
Centre 21.8 43.3 21.5 9.1 8.4 4.0 37.4 55.6
South and Islands 20.0 36.6 16.6 5.2 7.2 4.2 24.5 40.3
Number of employees 20 – 49 21.3 40.8 19.5 8.0 6.6 4.9 21.4 41.7
50 – 199 26.1 45.4 19.3 8.6 5.1 5.6 26.4 44.8
200 – 499 31.6 49.2 17.6 10.1 1.0 6.5 31.4 48.7
500 and over 34.4 51.3 16.9 8.0 0.7 8.2 41.6 58.7
Tech / knowledge intensity of sector
ICT 26.4 39.8 13.4 6.0 2.0 5.4 41.4 49.7
High-tech, non-ICT
26.2 42.9 16.7 7.4 4.0 5.3 36.1 52.6
Low-tech 22.2 42.7 20.5 8.7 6.5 5.2 29.4 49.2
Exports as share of turnover
Less than 1/3 21.9 41.5 19.6 8.6 6.0 5.0 29.6 48.5
Over 1/3 27.3 45.7 18.4 7.3 5.2 5.9 38.0 54.5
Total 23.3 42.6 19.3 8.3 5.8 5.2 32.1 50.2
After corrections, the share of breached firms climbs to 42.6 per cent (representing 50.2 per cent of
employees) overall, peaking at 51.3 per cent (58.7) for large firms, with a minimum of 36.6 per cent (40.3) in
the South. Note that in this particular specification the aggregate adjustment is stronger for low-tech and
smaller firms, more likely to have scarce detection abilities compared to the rest. Corrected hit rates for low-
tech and non-ICT high-tech firms are the same, and they are marginally higher compared to the ICT sector,
whereas in the unedited data ICT and other high-tech firms were slightly more likely to report an attack than
low-tech ones. This inversion is not unrealistic. The probability of being hit is a function of both
attractiveness and defence abilities; it may well be the case that, on balance, weak defence-low appeal
combinations result in roughly the same breach rates as strong defence-high appeal.
Based on the ranking of firm types by prevalence of attacks, the distribution of defensive expenditure
appears to be consistent with rational choice; from a purely private perspective, low-risk groups such as
16

small or Southern firms are justified in spending less compared to high-risk groups. Note that this may well
result in a socially suboptimal level of private investment, on account of the negative externalities produced
by cyber vulnerabilities (Anderson and Moore, 2011).
Figure 4 shows the prevalence of attacks by expenditure class; it confirms that suffering a breach is a
strong incentive to cybersecurity expenditure.
Figure 4
Firms hit by at least one cyber attack, unedited data, by expenditure class, 2016 (percentages)
No single estimate in Table 4 should be taken at face value. While probably much closer to the truth
than the unedited data, different but equally reasonable specifications for corrections yield estimates of the
prevalence of cyber attacks that range between one third and one half of firms (see Appendix Tables A7-A8
for a summary of results across alternate specifications): the message that should be extracted from the data
is therefore not a “best point estimate” but a reliable range of values that gives a ballpark estimate.
3.2 Economic impact of cyber attacks
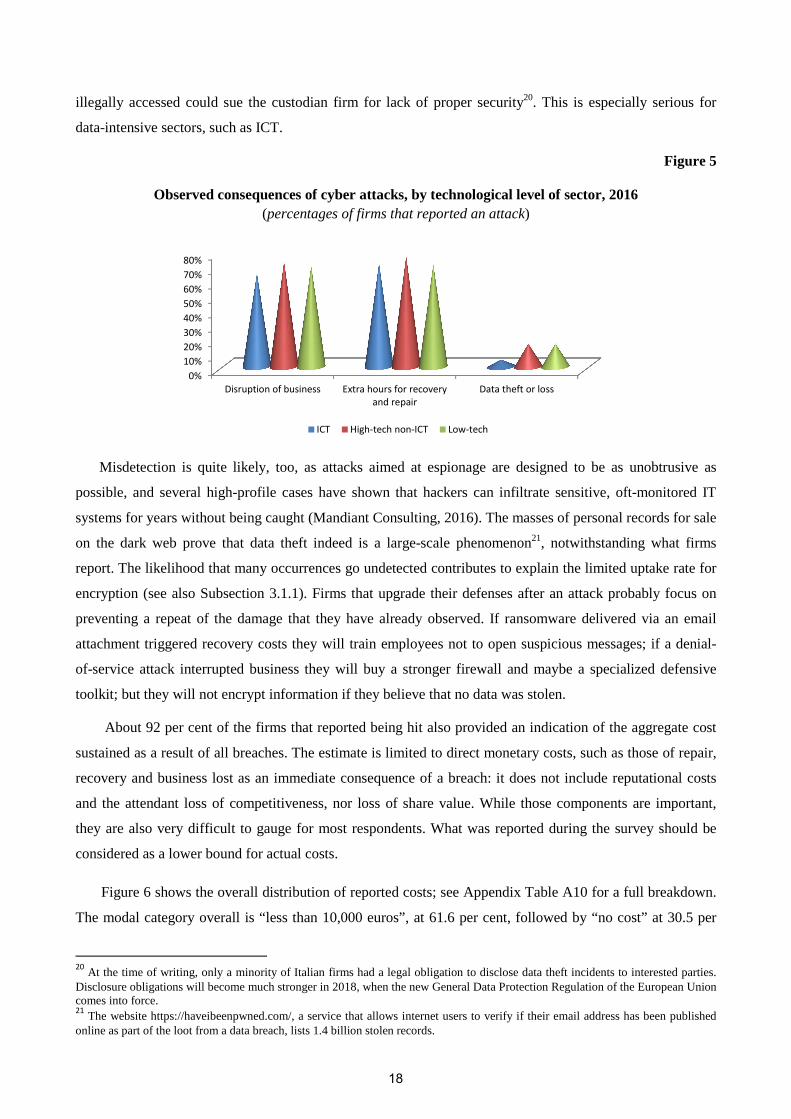
Disruption of ordinary business and extra working hours employed for recovery and repair were reported
by about 70 per cent of breached respondents, with negligible differences across sectors and size classes
(Figure 5; see Appendix Table A9 for a full breakdown). Data theft or loss was an uncommonly observed
occurrence, at 16 per cent of victims in the non-ICT economy, and 5 per cent in the ICT sector. It was
reported with lower frequency in Northern regions.
Data theft reports suffer from the same drawbacks described for attack reports, only to a greater extent.
Among the consequences of an attack, data theft is the one with more relevant legal ramifications, and
accordingly also more likely to be under-reported. Third parties – customers, suppliers etc. – whose data are
0%
10%
20%
30%
40%
50%
60%
70%
80%
90%
100%
0 <10000 10000-49999 50000-199999 200000+
Attack No attack
17
il legally accessed could sue the custodian firm for lack of proper security20. This is especially serious for
data-intensive sectors, such as ICT.
Figure 5
Observed consequences of cyber attacks, by technological level of sector, 2016 (percentages of firms that reported an attack)
Misdetection is quite likely, too, as attacks aimed at espionage are designed to be as unobtrusive as
possible, and several high-profile cases have shown that hackers can infiltrate sensitive, oft-monitored IT
systems for years without being caught (Mandiant Consulting, 2016). The masses of personal records for sale
on the dark web prove that data theft indeed is a large-scale phenomenon21, notwithstanding what firms
report. The likelihood that many occurrences go undetected contributes to explain the limited uptake rate for
encryption (see also Subsection 3.1.1). Firms that upgrade their defenses after an attack probably focus on
preventing a repeat of the damage that they have already observed. If ransomware delivered via an email
attachment triggered recovery costs they will train employees not to open suspicious messages; if a denial-
of-service attack interrupted business they will buy a stronger firewall and maybe a specialized defensive
toolkit; but they will not encrypt information if they believe that no data was stolen.
About 92 per cent of the firms that reported being hit also provided an indication of the aggregate cost
sustained as a result of all breaches. The estimate is limited to direct monetary costs, such as those of repair,
recovery and business lost as an immediate consequence of a breach: it does not include reputational costs
and the attendant loss of competitiveness, nor loss of share value. While those components are important,
they are also very difficult to gauge for most respondents. What was reported during the survey should be
considered as a lower bound for actual costs.
Figure 6 shows the overall distribution of reported costs; see Appendix Table A10 for a full breakdown.
The modal category overall is “less than 10,000 euros”, at 61.6 per cent, followed by “no cost” at 30.5 per
20 At the time of writing, only a minority of Italian firms had a legal obligation to disclose data theft incidents to interested parties.
Disclosure obligations will become much stronger in 2018, when the new General Data Protection Regulation of the European Union comes into force. 21
The website https://haveibeenpwned.com/, a service that allows internet users to verify if their email address has been published online as part of the loot from a data breach, lists 1.4 billion stolen records.
0%
10%
20%
30%
40%
50%
60%
70%
80%
Disruption of business Extra hours for recovery
and repair
Data theft or loss
ICT High-tech non-ICT Low-tech
18
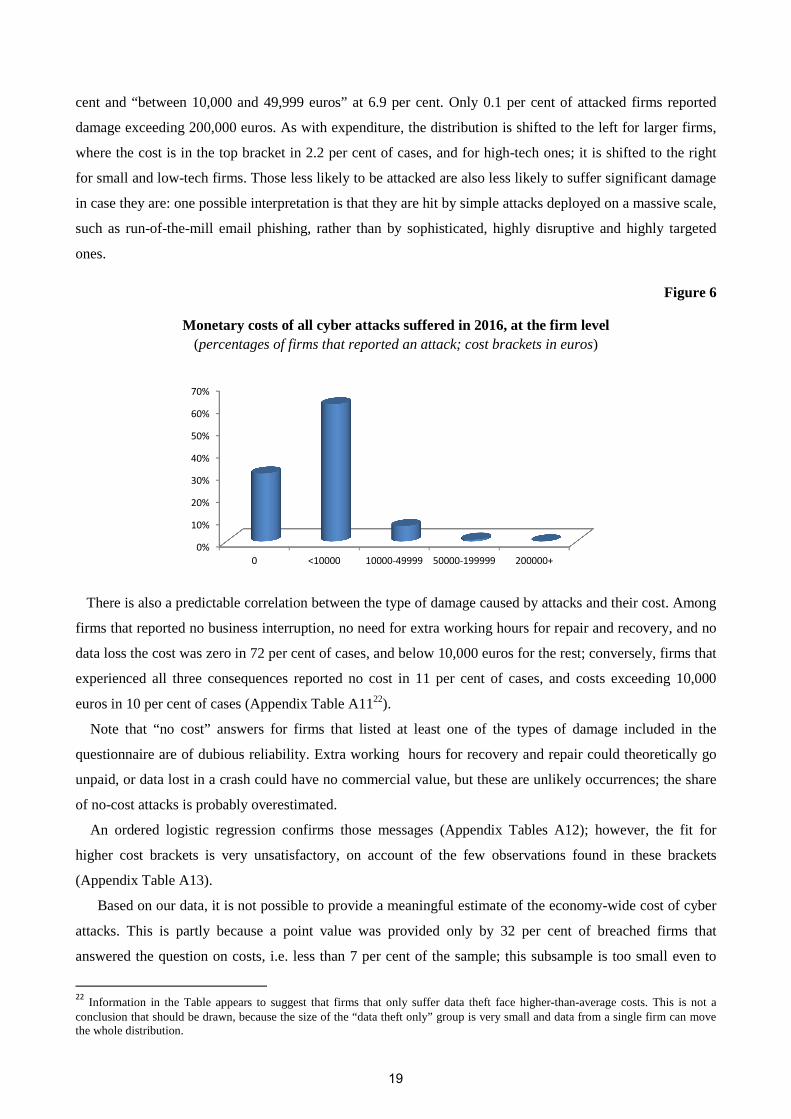
cent and “between 10,000 and 49,999 euros” at 6.9 per cent. Only 0.1 per cent of attacked firms reported
damage exceeding 200,000 euros. As with expenditure, the distribution is shifted to the left for larger firms,
where the cost is in the top bracket in 2.2 per cent of cases, and for high-tech ones; it is shifted to the right
for small and low-tech firms. Those less likely to be attacked are also less likely to suffer significant damage
in case they are: one possible interpretation is that they are hit by simple attacks deployed on a massive scale,
such as run-of-the-mill email phishing, rather than by sophisticated, highly disruptive and highly targeted
ones.
Figure 6
Monetary costs of all cyber attacks suffered in 2016, at the firm level (percentages of firms that reported an attack; cost brackets in euros)
There is also a predictable correlation between the type of damage caused by attacks and their cost. Among
firms that reported no business interruption, no need for extra working hours for repair and recovery, and no
data loss the cost was zero in 72 per cent of cases, and below 10,000 euros for the rest; conversely, firms that
experienced all three consequences reported no cost in 11 per cent of cases, and costs exceeding 10,000
euros in 10 per cent of cases (Appendix Table A1122).
Note that “no cost” answers for firms that listed at least one of the types of damage included in the
questionnaire are of dubious reliability. Extra working hours for recovery and repair could theoretically go
unpaid, or data lost in a crash could have no commercial value, but these are unlikely occurrences; the share
of no-cost attacks is probably overestimated.
An ordered logistic regression confirms those messages (Appendix Tables A12); however, the fit for
higher cost brackets is very unsatisfactory, on account of the few observations found in these brackets
(Appendix Table A13).
Based on our data, it is not possible to provide a meaningful estimate of the economy-wide cost of cyber
attacks. This is partly because a point value was provided only by 32 per cent of breached firms that
answered the question on costs, i.e. less than 7 per cent of the sample; this subsample is too small even to
22 Information in the Table appears to suggest that firms that only suffer data theft face higher-than-average costs. This is not a
conclusion that should be drawn, because the size of the “data theft only” group is very small and data from a single firm can move the whole distribution.
0%
10%
20%
30%
40%
50%
60%
70%
0 <10000 10000-49999 50000-199999 200000+
19
form a basis for the estimation of exact position measures such as means and medians. There is also a
significant methodological issue, which would remain even if we had more responses: the distribution of
costs in the reference universe, besides being skewed, is also likely to have a long right tail. Information on
tail events is not necessary to get a feeling for the impact that a typical firm should expect; robust position
measures suffice. However, it is essential when attempting to estimate the total cost for the economy.
While most attacks appear to cause limited damage, a handful of mega-breaches exist with documented
costs in the millions or even, occasionally, in the hundreds of millions (see, for example, the cases of Target
and Yahoo!). In the United States this is well-known, because class action lawsuits of customers whose
personal data have been stolen have a significant impact; it is likely that serious damage also happens
elsewhere, and remains mostly unknown because there is either no legal obligation to disclose it, less media
attention on the subject, and/or a smaller constituency of potentially affected individuals. Sometimes, these
cases may surface in surveys: in the first wave of the UK CSBS, a £3 million incident was reported; in the
second, a single attack caused £0.5 millions in repair and recovery costs alone. Sparse points are, however,
not enough for general conclusions. This problem is compounded by the fact that, as we mentioned before,
the impact of industrial espionage is likely to be severely underestimated.
The literature on survey methodology puts forward several ways to measure a skewed, long-tailed variable
where under-reporting and non-response are significantly higher on the right tail compared to the rest of the
distribution. One preferred option is oversampling of the right tail. The problem is how to identify a universe
of firms potentially located on it, considering that the survey gives no information on the matter; information
from other sources must be exploited. For example, in the field of household wealth measurement, it is
useful to oversample the very rich, who are unlikely to answer surveys and likely to under-report their assets
when they do (OECD, 2013); lists from which to draw an extra sample of affluent households can be
compiled based on public records of ownership of luxury property or vehicles. In the field of cybersecurity,
firm types that are at risk for large-scale incidents could be identified based on lists of major cyber events
such as the one compiled by the Center for Strategic and International Studies (2017), or breach notifications
sent to national data protection authorities, or indicators of a firm’s strategic relevance (e.g. firms operating
in sectors where the Committee for Foreign Investment in the United States, which has the power to block
foreign investment in American companies based on national security considerations, has most often chosen
to open a statutory investigation as opposed to granting immediate approval). Detailed information on the
type of damage caused by incidents, such as that collected in the CSBS, would definitely help in terms of
modeling costs.
Independent of which technical solution may work best, we believe that the evidence from surveys and
other sources is now enough to build a strong case for the development of appropriate sampling and
measurement techniques for this specific phenomenon23. So far we can only conclude that the direct
23 An understanding of how the distribution looks helps to explain the very large difference between our estimates and those found in some widely quoted commercial sources, according to which the average firm-level annual loss caused by cyber incidents in the world is in the millions of dollars, pounds or euros. This could be a technically legitimate
20
monetary cost of cyber attacks, net of any undetected consequences, has been modest for the representative
firm in the Italian private non-financial sector, and serious for a very small percentage.
4. Cluster analysis
Univariate conditional distributions of answers to survey questions are not enough to gain an
understanding of the state of cybersecurity in the Italian private non-financial sector. The results described so
far suggest that the interplay between variables is highly complex. When we observe a “yes” response to the
question on attacks, we may be dealing with a large, technologically advanced firm that, despite good
defences being in place, looked attractive to competent hackers. The same response could come from a low-
value firm, protected very poorly, or anything in between. The same ambiguity applies for a “no” answer. In
the same vein, high expenditure could reflect a long-standing concern with cybersecurity, accompanied by
successful defence; it could also be the result of recent adjustments made in the wake of a painful breach.
Drawing on results shown so far, technological level, size and degree of internationalisation predict both
expenditure and the probability of being attacked. Experiencing an attack affects defensive choices, and
some firms are more reliable than others when reporting breaches. We need to look at all of these
components simultaneously.
As a first step, we perform multiple correspondence analysis (MCA) on all relevant variables. MCA is
dimensionality-reduction technique equivalent to principal component analysis for categorical variables
(Greenacre, 1984): it transforms a set of n variables into a set of m<n principal factors, i.e. linear
combinations of the original variables that can be interpreted as latent dimensions explaining all variables
jointly.
The fit of MCA on our data is satisfactory, with the first two principal factors explaining about 93 per cent
of variation in the original variables. Appendix Table A14 shows the signs of factor loadings for response
categories of selected variables. Factor loadings can be interpreted as regression coefficients, where the
latent factor is the dependent variable, and dummies for response categories of the original variables are the
covariates. Each coefficient has to be considered jointly with how much the response category weighs in
explaining the variance of a factor.
Both latent factors increase with firm size, technological content, number of defensive measures
deployed, and security expenditure. There are, however, two key differences. One, reporting an attack
followed by an upgrade of defences contributes positively to the first factor, negatively to the second. Two,
structural characteristics of firms and defensive profile have a significant weight in explaining the variability
of the first factor, while reporting an attack and upgrading defenses afterwards outweigh everything else by
far in explaining the variability of the second.
The first factor can be loosely interpreted as a measure for attractiveness of a firm in the eyes of attackers,
assessed on the basis of structural variables and on the revealed preferences of the attackers themselves, i.e.
attack status. The second factor does not lend itself to interpretation as easily: it can be read as a broad
result on a sample of large ICT firms where a single mega-breach with six-figure costs happened; it is, however, not representative of the economy as a whole.
21
measure of defensive adequacy, but for breached firms that upgraded their defenses after an attack it
approximates a measure of the strength of pre-breach defenses, not observed ones. Such firms can
simultaneously have high observed cybersecurity expenditure, several defensive measures in place, and a
low score on the second factor: if defensive adequacy is gauged by the fact that the attacker was successful,
maybe pre-breach, pre-upgrade defenses were not strong. This cannot by any means be read as a rigorous
measure, but it still teases out a very important unobserved dimension.
A large ICT firm that was not attacked on account of its good defenses will attain a high score on the first
factor, and a high score on the second one. The same firm, if hit by especially canny attackers despite the
good defenses, will score even more on the first factor, but will score low on the second. Conversely, a small
low-tech firm with poor defenses that was not attacked because of its low appeal will score low on the first
factor, but high on the second. If attacked, the first factor will be higher, the second lower.
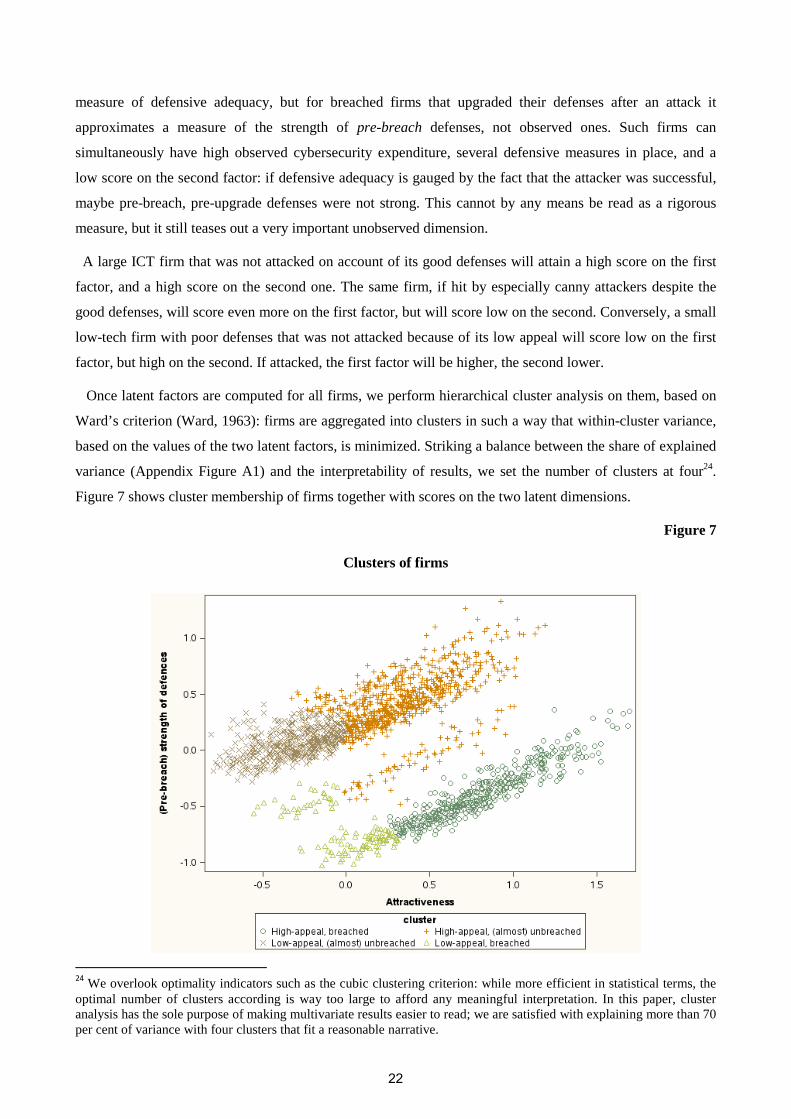
Once latent factors are computed for all firms, we perform hierarchical cluster analysis on them, based on
Ward’s criterion (Ward, 1963): firms are aggregated into clusters in such a way that within-cluster variance,
based on the values of the two latent factors, is minimized. Striking a balance between the share of explained
variance (Appendix Figure A1) and the interpretability of results, we set the number of clusters at four24.
Figure 7 shows cluster membership of firms together with scores on the two latent dimensions.
Figure 7
Clusters of firms
24 We overlook optimality indicators such as the cubic clustering criterion: while more efficient in statistical terms, the optimal number of clusters according is way too large to afford any meaningful interpretation. In this paper, cluster analysis has the sole purpose of making multivariate results easier to read; we are satisfied with explaining more than 70 per cent of variance with four clusters that fit a reasonable narrative.
22
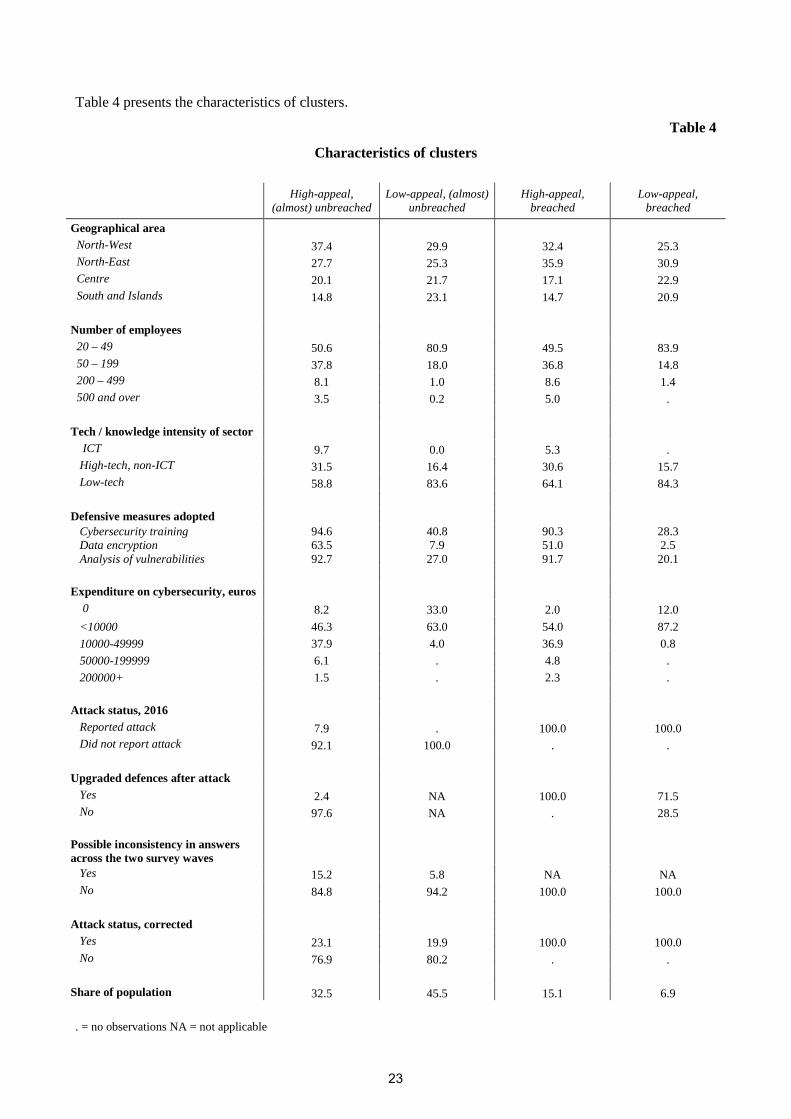
Table 4 presents the characteristics of clusters.
Table 4
Characteristics of clusters
High-appeal, (almost) unbreached
Low-appeal, (almost) unbreached
High-appeal, breached
Low-appeal, breached
Geographical area North-West 37.4 29.9 32.4 25.3 North-East 27.7 25.3 35.9 30.9 Centre 20.1 21.7 17.1 22.9 South and Islands 14.8 23.1 14.7 20.9
Number of employees 20 – 49 50.6 80.9 49.5 83.9 50 – 199 37.8 18.0 36.8 14.8 200 – 499 8.1 1.0 8.6 1.4 500 and over 3.5 0.2 5.0 .
Tech / knowledge intensity of sector ICT 9.7 0.0 5.3 . High-tech, non-ICT 31.5 16.4 30.6 15.7 Low-tech 58.8 83.6 64.1 84.3
Defensive measures adopted Cybersecurity training 94.6 40.8 90.3 28.3 Data encryption 63.5 7.9 51.0 2.5 Analysis of vulnerabilities 92.7 27.0 91.7 20.1
Expenditure on cybersecurity, euros 0 8.2 33.0 2.0 12.0
<10000 46.3 63.0 54.0 87.2
10000-49999 37.9 4.0 36.9 0.8
50000-199999 6.1 . 4.8 .
200000+ 1.5 . 2.3 .
Attack status, 2016 Reported attack 7.9 . 100.0 100.0 Did not report attack 92.1 100.0 . .
Upgraded defences after attack Yes 2.4 NA 100.0 71.5 No 97.6 NA . 28.5
Possible inconsistency in answers across the two survey waves Yes 15.2 5.8 NA NA No 84.8 94.2 100.0 100.0
Attack status, corrected Yes 23.1 19.9 100.0 100.0 No 76.9 80.2 . .
Share of population 32.5 45.5 15.1 6.9
. = no observations NA = not applicable
23
The first cluster is mostly composed of high-appeal firms that did not report a breach. These are the best
performers in the system: despite being an attractive target, they were mostly able to repeal attacks. The
North of Italy, the ICT sector, and large firms are over-represented compared to the reference universe;
uptake rates for cybersecurity training and network analysis are over 90 per cent, and even encryption applies
to almost two thirds.
In the second cluster we find smaller firms (less than 200 employees) that reported no breach; their
defensive assets and their cybersecurity expenditure are below average, although not the lowest in the
population; low-tech sectors and the South are over-represented. This group is low-appeal and might, indeed,
have gone unscathed because it is of little interest to attackers and has at least some security in place.
The third cluster is high-appeal, and presumably high pre-breach vulnerability. Structural characteristics
mimic the high-appeal, no-breaches cluster: Northern, large and ICT firms are over-represented. Also,
security measures are widely adopted and expenditure is higher than average. However, an attack was
observed. This cluster may identify high-value firms that were unaware of cyber risk until a short time ago,
but they received a wake-up call from an attack and are now adequately protected.
Finally, the fourth cluster comprises small low-tech firms that, despite their low appeal, were hit, possibly
on account of exceptionally poor defenses. More than two thirds upgraded their security in the aftermath, but
expenditure and the prevalence of defensive measures remain at the lowest point of the population. This
group is likely to remain vulnerable at least for some time, as it did not seem to learn from its mistakes.
The relative size of clusters paints a very optimistic picture of the reference universe in terms of
cybersecurity, consistent with the low frequency of attacks in the unedited data: three fourths of the
population are allocated to good, resilient clusters where very few attacks were reported. If the corrections
presented in Table 3 are taken into account, the share of unbreached firms goes down from 92.1 to 76.9 per
cent in Cluster 1, and from 80.2 to 19.9 per cent in Cluster 2.
5. Robust estimation of expenditure
Contrary to what we stated for the cost of attacks, in the case of expenditure we have enough point values
to attempt a robust estimation of location measures, and even an estimate of the size of the cybersecurity
market. The distribution of firm-level expenditure is long-tailed, with individual reported values exceeding
€20 million, but the per-employee distribution is more tractable.
As a first step, we use the subsample of respondents who provided a point value for expenditure to impute
point values for those who only provided an interval. Imputation is based on a generalized linear model with
a log link function where the independent variable is per-employee expenditure on defence, and the key
covariates are the levels on the two principal factors resulting from the MCA. Per-employee expenditure data
are treated with winsorisation25 to prevent the few outliers that remain from influencing the estimates; the
25 Winsorisation is a technique for robust estimation based on the substitution of values above a certain percentile with values observed at that percentile. In this exercise, we only winsorise the right tail, at the 95th percentile calculated by size class.
24

model is also estimated by size class, to account for varying elasticities. Alongside the principal factors, the
covariates include some of the structural characteristics of the firm already used in computing the factors, so
as to better elicit their marginal contribution to expenditure. Note that this exercise is not meant to be
explanatory – the coefficients on principal factors (Appendix Table A15) would be very difficult to interpret
– but to be predictive, therefore the specification is chosen based on rates of correct prediction on the
training sample, identified as the share of predicted point values that fall in the correct interval for
respondents that only provided an interval value26.
The model performs well on average, with 85 per cent of correct predictions, and most of the incorrect
ones falling in the interval immediately adjacent to the true one (Appendix Table A16). However, the fit
varies across firm types. It is best on small and low-tech firms, worst in the ICT sector and for big spenders.
Again, predicting tails is difficult. Whenever a prediction is in the incorrect interval, we use the closest limit
of the interval provided by the respondent.
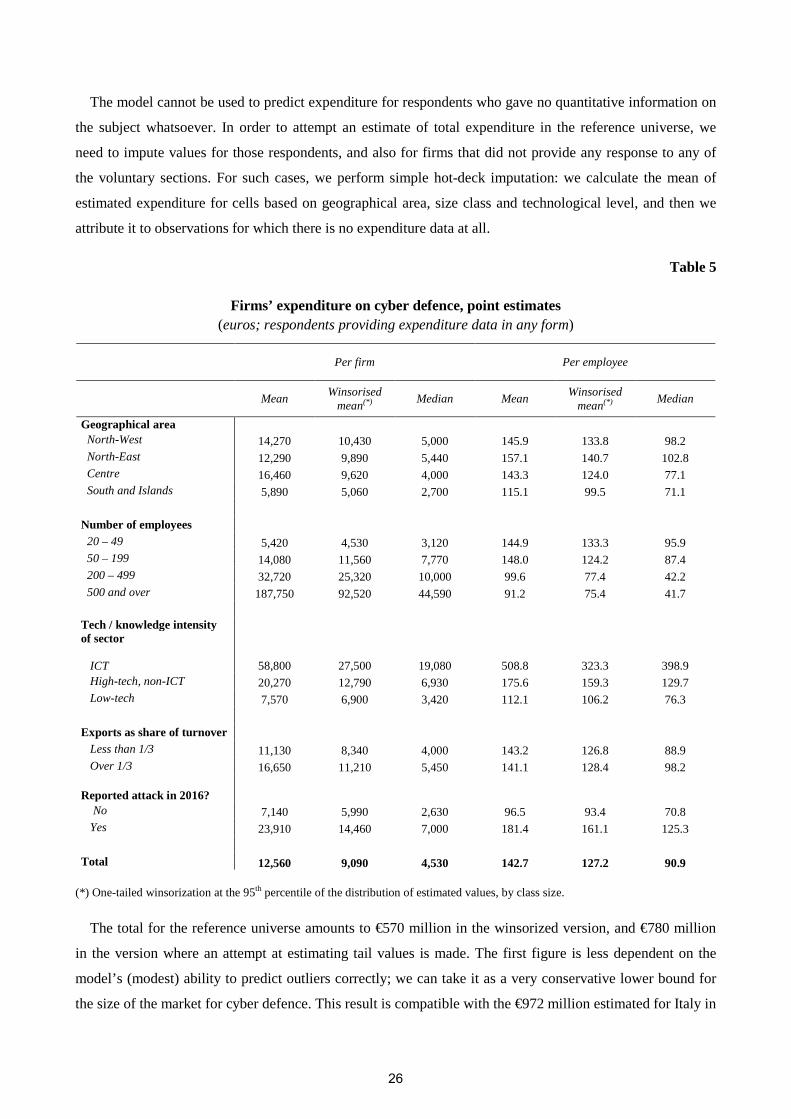
Table 5 shows the main results27. Median expenditure on cyber defence stands at €4,530 overall, and it
varies widely across areas, sectors and firm sizes, consistently with results shown in previous Sections. It
ranges from €3,240 in low-tech sectors to €19,080 euro in the ICT sector; the median firm with 500
employees and over spent €44,590, vis-à-vis the €3,120 of its counterpart with less than 50 employees. A
large difference existed between those who reported no attack, at €2,630, and those who did, at €7,000.
Means are presented in two version. One set of results (column “mean” in Table 5) stems from the
model’s predictions, not subjected to any treatment besides the fact that the model is, from the onset,
estimated based on winsorised values of observed per-employee expenditure. Another set of results (column
“winsorised mean” in Table 5) is based on further treatment of predictions28. The latter certainly understates
the influence of outliers and it should be taken as a very stable, but also very conservative lower bound for
the mean. Non-winsorised mean expenditure amounts to €12,560 overall, and it ranges from €5,890 in
Southern Italy to €187,750 for larger firms. Those who reported attacks are at €23,910, against €7,140 for
those who did not. Winsorised mean expenditure is approximately twice the median in most firm categories.
In per-employee terms the median stands at €90.9, the mean at €142.7. On account of economies of
scale, per capita expenditure is lower in large firms compared to smaller ones; it is much higher in the ICT
sector where, depending on the indicator chosen, it is between three and five times the estimate for low-tech
firms.
26 “No expenditure” and “< €10,000” are collapsed in a single category for the purposes of this model, as predicted values are unlikely to be exactly zero.27 The estimates should be taken as indicative, especially in the case of non-winsorised means, as they are the result of several modeling and estimation steps: a full boot-strapping exercise for variance estimation will be carried out in the future. We believe, however, that they still give credible insight on orders of magnitude, and how much outliers matter in shaping the distribution of expenditure. 28 Right-tail winsorisation at the 95th percentile calculated by size class.
25
The model cannot be used to predict expenditure for respondents who gave no quantitative information on
the subject whatsoever. In order to attempt an estimate of total expenditure in the reference universe, we
need to impute values for those respondents, and also for firms that did not provide any response to any of
the voluntary sections. For such cases, we perform simple hot-deck imputation: we calculate the mean of
estimated expenditure for cells based on geographical area, size class and technological level, and then we
attribute it to observations for which there is no expenditure data at all.
Table 5
Firms’ expenditure on cyber defence, point estimates (euros; respondents providing expenditure data in any form)
Per firm Per employee
Mean Winsorised
mean(*) Median Mean
Winsorised mean(*)
Median
Geographical area North-West 14,270 10,430 5,000 145.9 133.8 98.2 North-East 12,290 9,890 5,440 157.1 140.7 102.8 Centre 16,460 9,620 4,000 143.3 124.0 77.1 South and Islands 5,890 5,060 2,700 115.1 99.5 71.1
Number of employees 20 – 49 5,420 4,530 3,120 144.9 133.3 95.9 50 – 199 14,080 11,560 7,770 148.0 124.2 87.4 200 – 499 32,720 25,320 10,000 99.6 77.4 42.2 500 and over 187,750 92,520 44,590 91.2 75.4 41.7
Tech / knowledge intensity of sector
ICT 58,800 27,500 19,080 508.8 323.3 398.9 High-tech, non-ICT 20,270 12,790 6,930 175.6 159.3 129.7 Low-tech 7,570 6,900 3,420 112.1 106.2 76.3
Exports as share of turnover Less than 1/3 11,130 8,340 4,000 143.2 126.8 88.9 Over 1/3 16,650 11,210 5,450 141.1 128.4 98.2
Reported attack in 2016? No 7,140 5,990 2,630 96.5 93.4 70.8 Yes 23,910 14,460 7,000 181.4 161.1 125.3
Total 12,560 9,090 4,530 142.7 127.2 90.9
(*) One-tailed winsorization at the 95th percentile of the distribution of estimated values, by class size.
The total for the reference universe amounts to €570 million in the winsorized version, and €780 million
in the version where an attempt at estimating tail values is made. The first figure is less dependent on the
model’s (modest) ability to predict outliers correctly; we can take it as a very conservative lower bound for
the size of the market for cyber defence. This result is compatible with the €972 million estimated for Italy in
26
its entirety by a research group on information security and privacy at the Polytechnic of Milan (Osservatorio
Security e Privacy, 2017); the methodology is not public, so we cannot make an exact comparison, but it can
be safely assumed that the figure is higher because it includes sectors not covered in our sample.
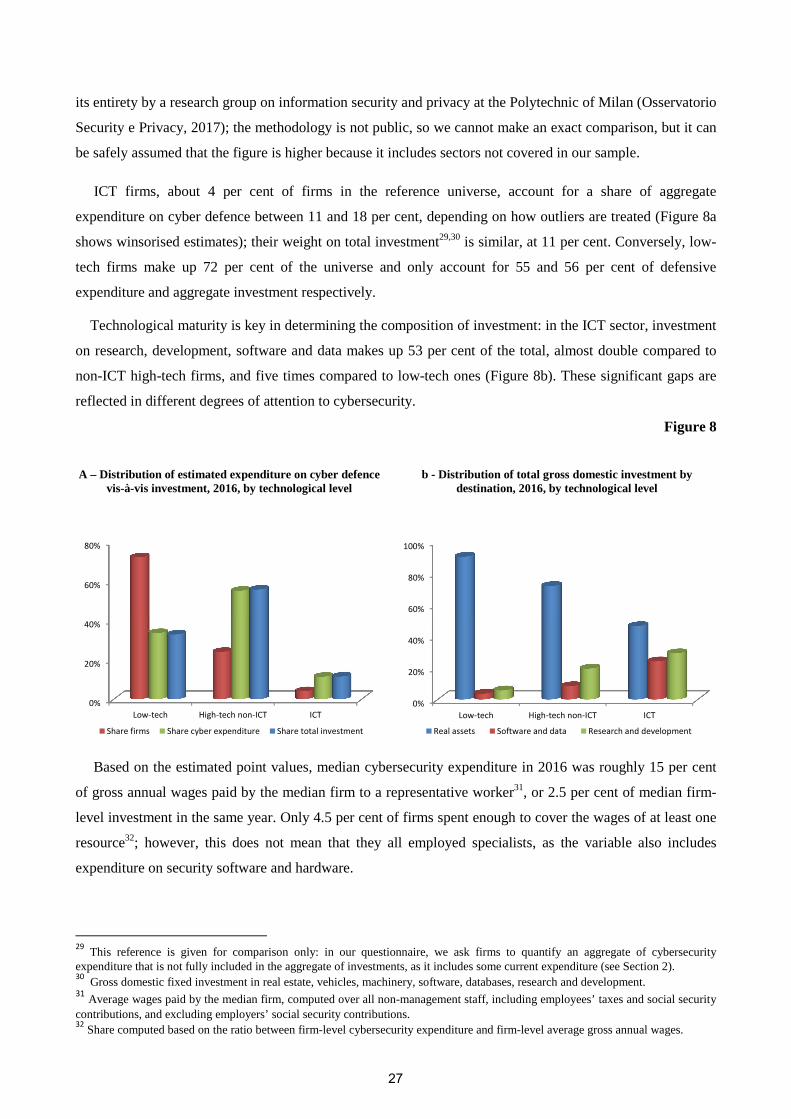
ICT firms, about 4 per cent of firms in the reference universe, account for a share of aggregate
expenditure on cyber defence between 11 and 18 per cent, depending on how outliers are treated (Figure 8a
shows winsorised estimates); their weight on total investment29,30 is similar, at 11 per cent. Conversely, low-
tech firms make up 72 per cent of the universe and only account for 55 and 56 per cent of defensive
expenditure and aggregate investment respectively.
Technological maturity is key in determining the composition of investment: in the ICT sector, investment
on research, development, software and data makes up 53 per cent of the total, almost double compared to
non-ICT high-tech firms, and five times compared to low-tech ones (Figure 8b). These significant gaps are
reflected in different degrees of attention to cybersecurity.
Figure 8
A – Distribution of estimated expenditure on cyber defence vis-à-vis investment, 2016, by technological level
b - Distribution of total gross domestic investment by destination, 2016, by technological level
Based on the estimated point values, median cybersecurity expenditure in 2016 was roughly 15 per cent
of gross annual wages paid by the median firm to a representative worker31, or 2.5 per cent of median firm-
level investment in the same year. Only 4.5 per cent of firms spent enough to cover the wages of at least one
resource32; however, this does not mean that they all employed specialists, as the variable also includes
expenditure on security software and hardware.
29This reference is given for comparison only: in our questionnaire, we ask firms to quantify an aggregate of cybersecurity
expenditure that is not fully included in the aggregate of investments, as it includes some current expenditure (see Section 2). 30
Gross domestic fixed investment in real estate, vehicles, machinery, software, databases, research and development. 31
Average wages paid by the median firm, computed over all non-management staff, including employees’ taxes and social security contributions, and excluding employers’ social security contributions. 32
Share computed based on the ratio between firm-level cybersecurity expenditure and firm-level average gross annual wages.
0%
20%
40%
60%
80%
Low-tech High-tech non-ICT ICT
Share firms Share cyber expenditure Share total investment
0%
20%
40%
60%
80%
100%
Low-tech High-tech non-ICT ICT
Real assets Software and data Research and development
27
6. Comparison with the UK Cyber Security Breaches Survey
Our point estimates are not directly comparable with the UK CSBS. The reference universe is not the
same: we only cover private industrial and non-financial services firms with at least 20 employees, while the
CSBS also includes the financial sector and smaller businesses; health care, social care, education and
academic research are excluded from our sample, as they are mostly part of the public sector in Italy,
whereas private providers of such services are included in the CSBS. The difference is relevant: these sectors
are prime targets for attackers, as they handle large amounts of sensitive data in electronic form. While the
definition of expenditure is the same, net of some small wording differences in the questionnaires, the
definitions of cost diverge: the CSBS includes more cost categories, such as reputational damage and
abandonment of business plans. More generally, our survey is likely to be less accurate, despite a higher
sampling fraction: it is not single-purpose, it was not answered by IT specialists, the questionnaire is much
shorter, and the fieldwork techniques employed were less sophisticated33.
This notwithstanding, the order of magnitude of estimated defensive expenditure and damage from attacks
is the same, and the distribution across firm categories is similar. Expenditure is in the thousands of
euros/pounds for small firms, in the tens of thousands for medium ones, in the hundreds of thousands for
large ones; its distribution is highly skewed. The proportion between expenditure in the ICT sector and
expenditure in the rest of the economy is comparable. One notable difference is that in the UK, the average
expenditure for large firms is much higher than ours, at £387,000, even if the class of large firms starts at 250
employees: this may reflect the presence of the aforementioned data-intensive industries, the higher level of
digitalisation of the UK economy compared to Italy, and the larger size of the market for high-tech services,
such as cybersecurity consulting. Maximum expenditure is around €/£ 20 millions in both surveys. Post-
attack upgrade of defenses is commonplace on both samples.
When it comes to the prevalence of cyber attacks, the two surveys employ definitions that differ in one
significant way. In the 2017 CSBS, some types of attempted attacks are counted, even if they were blocked34:
e.g. “attempted hacking of online bank accounts” is listed as a possibility, and so are “staff receiving
fraudulent emails” and organisation impersonation, even if they did not lead to any damage. In our survey,
respondents are specifically instructed to only take into account attacks that yielded at least some damage35.
Our estimates should not be compared with the UK figures on the prevalence of breaches, but with those on
“breaches with an outcome”. This category is the closest to our definition, although it is not identical.
Breaches with an outcome happened to 19 per cent of the British reference universe, against 23.3 per cent in
our unedited data; the difference likely stems from our non-coverage of firms with less than 20 employees,
less likely to report a breach compared to the average. The CSBS report does not feature any statistical
model for correction of under-reporting or misdetection; comparison with our model-based estimates is
33 The fieldwork was conducted in three stages: before interviews were conducted, firms in the sample were given time to prepare
based on a detailed description of the quantitative information (defensive expenditure and cost of attacks) they needed to provide; then telephone interviewed were administered; finally, a qualitative in-depth analysis of a few case studies was carried out. 34
In the 2016 CSBS, unsuccessful attempts were almost entirely excluded. 35
Whenever respondents requested clarifications, they were also instructed not to consider fraudulent emails that were thrown away without clicking on any malicious link or attachment.
28
therefore not feasible. Where the distribution of attacks is concerned, large firms and the ICT sector stand
out from the rest according to both sources; the British distribution is more skewed than the Italian one, with
larger differences between higher and lower size classes.
The CSBS records much more information on attacks, such as what tools the attackers used, how they were
able to defeat the firm’s defences, how they were detected. The number of breaches over the survey period is
documented; we collected the former variable in the previous survey, and results are comparable, with large
firms, the ICT sector and utilities subjected to more per-firm attacks compared to others. With respect to the
type of outcome, added staff time for repair and recovery is more common than business interruption in the
UK, while the prevalence rates are roughly equal in Italy; for both countries, the incidence of data loss or
theft is much lower.
With respect to costs, the order of magnitude of the phenomenon is the same; reported costs are generally
small, in the thousands and occasionally in the tens of thousands. The CSBS data provides insights that are
not evident from our survey: for example, meaningful point estimates by size class are possible, and they
show that large firms withstand more serious damage in absolute terms compared to small ones. However, a
similar problem appears to exist with respect to tail values; only one large incident appears in the microdata,
and it cannot be used as a basis for any generalization.
Even allowing for different reference universes, cybersecurity training for employees appears to be more
common in Italy than in the UK; the average rate of prevalence in our sample is closer to the one for large
firms in the CSBS. We were not able to find a convincing explanation for this. On the contrary, encryption is
more popular in the UK, possibly because of the 2015 attack against telephone and internet provider Talk
Talk: 150,000 personal records of customers were stolen, the company was fined £450,000 by the
Information Commissioner’s Office, and lawsuits followed; the company reported that, overall, the direct
and indirect costs of the breach reached £40 million. At the time, Talk Talk had approximately 4 million
customers: the case made headline news and was probably known enough to trigger increased cybersecurity
awareness.
7. Conclusions
This paper presented evidence on expenditure related to preventing and managing cyber attacks in the
Italian private non-financial sector, based on the Bank of Italy’s annual surveys. In 2016, most firms
allocated at least some resources to cybersecurity, but the differences across sectors and size classes were
sizable. Median expenditure ranged from €3,240 for low-tech firms to €19,080 in the ICT sector, and from
€3,120 for smaller firms to €44,590 for firms with at least 500 employees. The overall median was €4,530,
roughly 15 per cent of gross annual wages paid by the median firm to a typcial worker, or 2.5 per cent of
median firm-level gross domestic fixed investment.
We estimate that the market for cyber defence in Italy is worth at least €570 million; this is a very
conservative lower bound because, among other things, all public-sector expenditure is excluded from the
survey. Having been attacked in the past leads firms to boost their security investment: among breached
firms, 81 per cent upgraded their defences. Direct monetary costs from attacks were less than €10,000 for
29
the majority of firms; about one per cent reported damage worth over €50,000, and 0.1 per cent above
€200,000.
We cannot give a meaningful estimate of aggregate costs for the whole economy because large incidents
are absent from our dataset: we know from external sources that they exist, and they can cause damage
running into the hundreds of millions, but they are rare in the population and cannot be documented with
sampling techniques that are not tailored to such events. However, we can extrapolate an important feature of
the threat posed by cyber attacks and of the typical firm’s response. In most cases, a breach will not impose
significant costs upon the victim; our estimates do not include indirect costs, but, even if we allow for those
to be at least equal to direct costs, the impact remains small. In this sense, the limited investment that firms
make in cybersecurity can be seen as subjectively rational. On the other hand, a handful of tail events can do
more damage to the economy than all of the run-of-the-mill attacks combined. On account of externalities,
smallish attacks can constitute vehicles for large incidents: from a systemic perspective, they still pose a
significant risk despite their low direct impact and they should not be overlooked. This has policy
implications that need to be explored further.
While our point estimates are not perfectly comparable with those obtained from the UK Cyber Security
Breaches Survey, which constitutes the only example of official statistics in this field, the order of magnitude
of estimated defensive expenditure and the damage from attacks is the same. The ranking of sectors and size
classes with respect to key variables is also very similar, with the ICT sector and large firms standing out
from the rest of the private sector in terms of awareness, expenditure and how appealing a target they are to
attackers.
30

Appendix
31
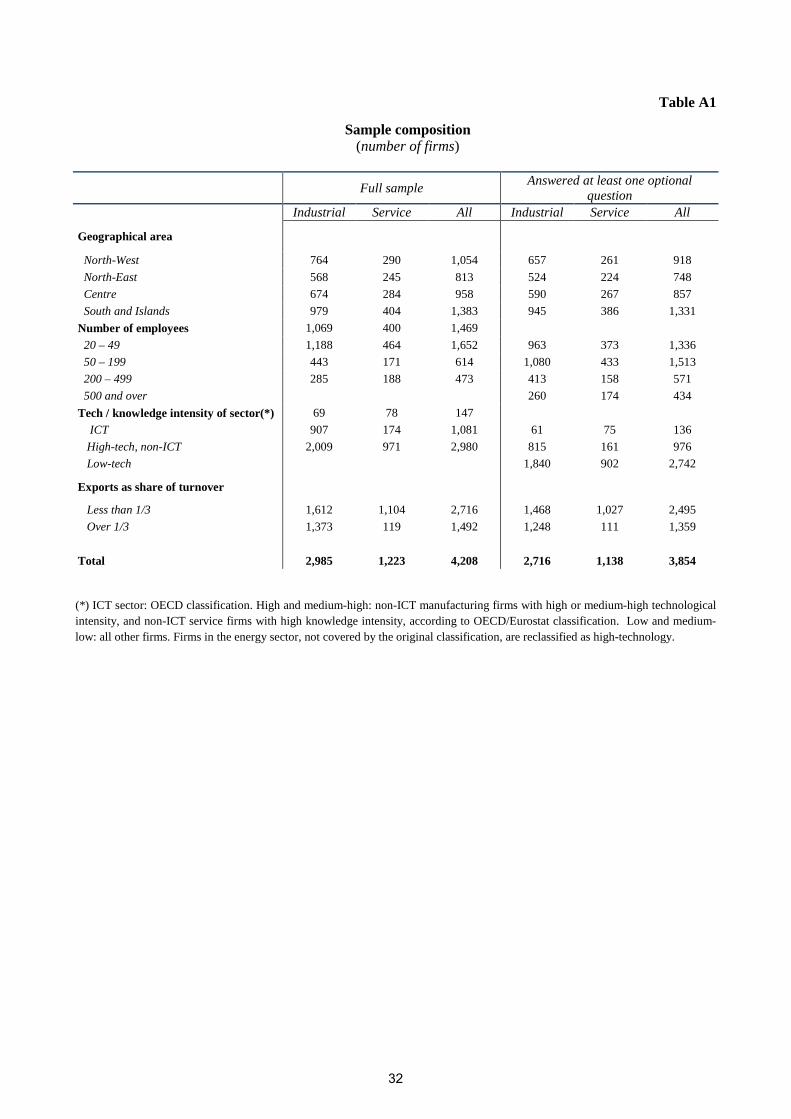
Table A1
Sample composition (number of firms)
Full sample Answered at least one optional
question Industrial Service All Industrial Service All
Geographical area
North-West 764 290 1,054 657 261 918
North-East 568 245 813 524 224 748
Centre 674 284 958 590 267 857
South and Islands 979 404 1,383 945 386 1,331
Number of employees 1,069 400 1,469
20 – 49 1,188 464 1,652 963 373 1,336
50 – 199 443 171 614 1,080 433 1,513
200 – 499 285 188 473 413 158 571
500 and over 260 174 434
Tech / knowledge intensity of sector(*) 69 78 147
ICT 907 174 1,081 61 75 136
High-tech, non-ICT 2,009 971 2,980 815 161 976
Low-tech 1,840 902 2,742
Exports as share of turnover
Less than 1/3 1,612 1,104 2,716 1,468 1,027 2,495
Over 1/3 1,373 119 1,492 1,248 111 1,359
Total 2,985 1,223 4,208 2,716 1,138 3,854
(*) ICT sector: OECD classification. High and medium-high: non-ICT manufacturing firms with high or medium-high technological intensity, and non-ICT service firms with high knowledge intensity, according to OECD/Eurostat classification. Low and medium-low: all other firms. Firms in the energy sector, not covered by the original classification, are reclassified as high-technology.
32
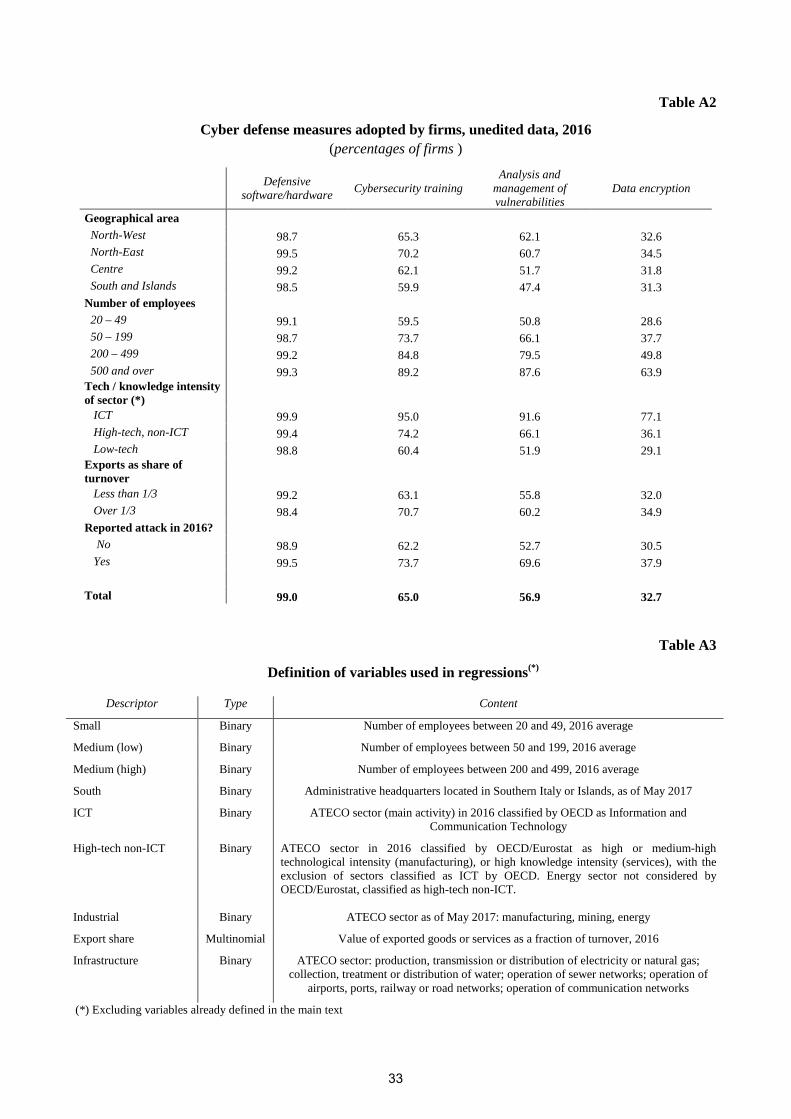
Table A2
Cyber defense measures adopted by firms, unedited data, 2016 (percentages of firms )
Defensive software/hardware
Cybersecurity training Analysis and
management of vulnerabilities
Data encryption
Geographical area North-West 98.7 65.3 62.1 32.6 North-East 99.5 70.2 60.7 34.5 Centre 99.2 62.1 51.7 31.8 South and Islands 98.5 59.9 47.4 31.3 Number of employees 20 – 49 99.1 59.5 50.8 28.6 50 – 199 98.7 73.7 66.1 37.7 200 – 499 99.2 84.8 79.5 49.8 500 and over 99.3 89.2 87.6 63.9 Tech / knowledge intensity of sector (*) ICT 99.9 95.0 91.6 77.1 High-tech, non-ICT 99.4 74.2 66.1 36.1 Low-tech 98.8 60.4 51.9 29.1
Exports as share of turnover Less than 1/3 99.2 63.1 55.8 32.0
Over 1/3 98.4 70.7 60.2 34.9 Reported attack in 2016? No 98.9 62.2 52.7 30.5 Yes 99.5 73.7 69.6 37.9
Total 99.0 65.0 56.9 32.7
Table A3
Definition of variables used in regressions(*)
Descriptor Type Content
Small Binary Number of employees between 20 and 49, 2016 average
Medium (low) Binary Number of employees between 50 and 199, 2016 average
Medium (high) Binary Number of employees between 200 and 499, 2016 average
South Binary Administrative headquarters located in Southern Italy or Islands, as of May 2017
ICT Binary ATECO sector (main activity) in 2016 classified by OECD as Information and Communication Technology
High-tech non-ICT Binary ATECO sector in 2016 classified by OECD/Eurostat as high or medium-high technological intensity (manufacturing), or high knowledge intensity (services), with the exclusion of sectors classified as ICT by OECD. Energy sector not considered by OECD/Eurostat, classified as high-tech non-ICT.
Industrial Binary ATECO sector as of May 2017: manufacturing, mining, energy
Export share Multinomial Value of exported goods or services as a fraction of turnover, 2016
Infrastructure Binary ATECO sector: production, transmission or distribution of electricity or natural gas; collection, treatment or distribution of water; operation of sewer networks; operation of
airports, ports, railway or road networks; operation of communication networks
(*) Excluding variables already defined in the main text
33
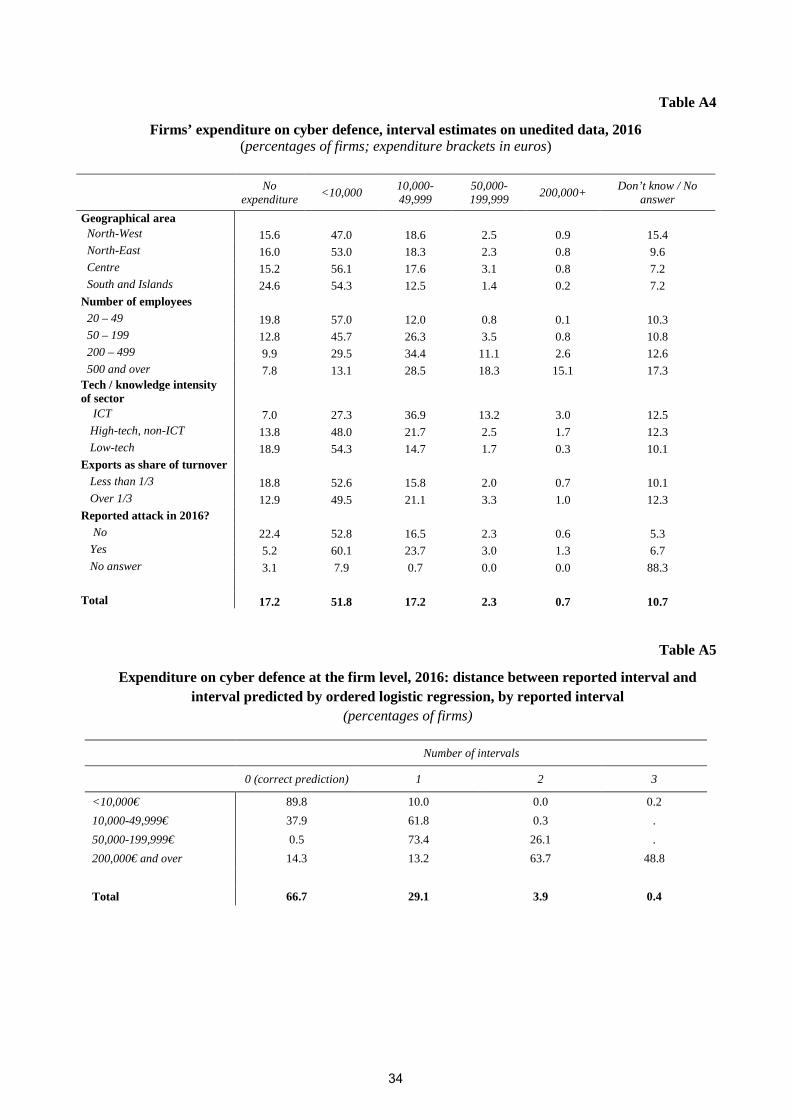
Table A4
Firms’ expenditure on cyber defence, interval estimates on unedited data, 2016 (percentages of firms; expenditure brackets in euros)
No expenditure
<10,000 10,000-49,999
50,000-199,999
200,000+ Don’t know / No
answer
Geographical area North-West 15.6 47.0 18.6 2.5 0.9 15.4 North-East 16.0 53.0 18.3 2.3 0.8 9.6 Centre 15.2 56.1 17.6 3.1 0.8 7.2 South and Islands 24.6 54.3 12.5 1.4 0.2 7.2 Number of employees 20 – 49 19.8 57.0 12.0 0.8 0.1 10.3 50 – 199 12.8 45.7 26.3 3.5 0.8 10.8 200 – 499 9.9 29.5 34.4 11.1 2.6 12.6 500 and over 7.8 13.1 28.5 18.3 15.1 17.3 Tech / knowledge intensity of sector ICT 7.0 27.3 36.9 13.2 3.0 12.5 High-tech, non-ICT 13.8 48.0 21.7 2.5 1.7 12.3
Low-tech 18.9 54.3 14.7 1.7 0.3 10.1 Exports as share of turnover Less than 1/3 18.8 52.6 15.8 2.0 0.7 10.1 Over 1/3 12.9 49.5 21.1 3.3 1.0 12.3
Reported attack in 2016? No 22.4 52.8 16.5 2.3 0.6 5.3 Yes 5.2 60.1 23.7 3.0 1.3 6.7 No answer 3.1 7.9 0.7 0.0 0.0 88.3
Total 17.2 51.8 17.2 2.3 0.7 10.7
Table A5
Expenditure on cyber defence at the firm level, 2016: distance between reported interval and interval predicted by ordered logistic regression, by reported interval
(percentages of firms)
Number of intervals
0 (correct prediction) 1 2 3
<10,000€ 89.8 10.0 0.0 0.2
10,000-49,999€ 37.9 61.8 0.3 .
50,000-199,999€ 0.5 73.4 26.1 .
200,000€ and over 14.3 13.2 63.7 48.8
Total 66.7 29.1 3.9 0.4
34

Table A6
Firms hit by at least one cyber attack, unedited data, 2016 (percentages of firms)
As a share of total firms As a share of total employees
No attack At least one
attack Don’t know/ No answer
No attack At least one
attack Don’t know / No answer
Geographical area North-West 70.9 22.6 6.5 60.5 30.1 9.4 North-East 66.0 27.4 6.6 58.2 34.0 7.8 Centre 72.6 21.8 5.6 54.9 37.4 7.7 South and Islands 75.1 20.0 5.0 70.2 24.5 5.3 Number of employees 20 – 49 73.1 21.3 5.6 73.0 21.4 5.6 50 – 199 67.4 26.1 6.5 67.6 26.4 6.0 200 – 499 60.9 31.6 7.5 61.0 31.4 7.6 500 and over 54.8 34.4 10.8 47.6 41.6 10.8 Tech / knowledge intensity of sector ICT 68.1 26.4 5.5 53.1 41.4 5.5 High-tech, non-ICT 67.4 26.2 6.4 56.4 36.1 7.5 Low-tech 71.8 22.2 6.0 62.1 29.4 8.5
Exports as share of turnover Less than 1/3 72.6 21.9 5.4 61.8 29.6 8.6 Over 1/3 64.9 27.3 7.8 55.2 38.0 6.9
Total 70.6 23.3 6.1 59.9 32.1 8.1
Table A7
Prevalence of cyber attacks: data correction models
Model
Corrects for…
Data treatment Non-response Mis-detection Inconsistency
Base Yes No No Imputed for non-respondents
A Yes Yes No Base + imputed for respondents reporting no security measures or only anti-virus program
B1 Yes No Weak, imputed
Base + imputed for respondents reporting at least two attacks in the first survey (covering 9/15-9/16), but no attack in the second survey (covering 1/16-12/16)
B2 Yes No Strong, imputed
Base + imputed for respondents reporting at least one attack in the first survey, but no attack in the second survey
C1 Yes Yes Weak, corrected
A + corrected to “attack reported” for respondents reporting at least two attacks in the first survey, but no attack in the second survey
C2 Yes Yes Strong, corrected
A + corrected to “attack reported” for respondents reporting at least two attacks in the first survey, but no attack in the second survey
35
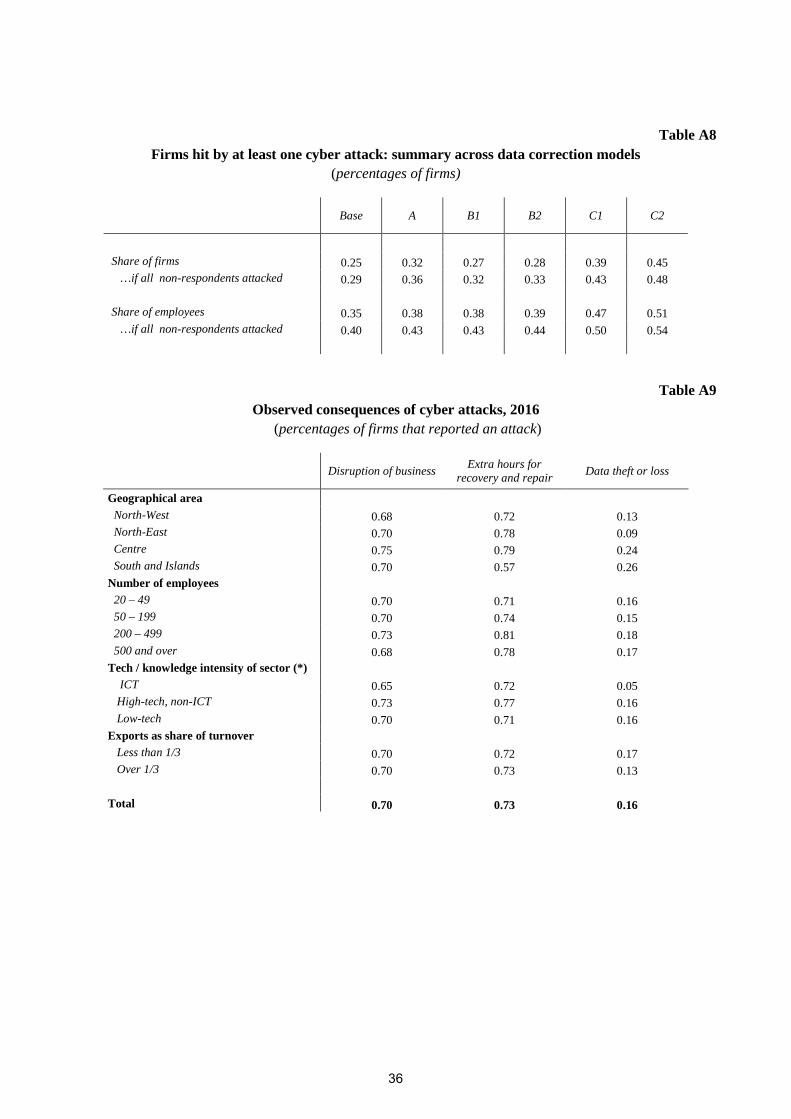
Table A8 Firms hit by at least one cyber attack: summary across data correction models
(percentages of firms)
Base A B1 B2 C1 C2
Share of firms 0.25 0.32 0.27 0.28 0.39 0.45 …if all non-respondents attacked 0.29 0.36 0.32 0.33 0.43 0.48
Share of employees 0.35 0.38 0.38 0.39 0.47 0.51 …if all non-respondents attacked 0.40 0.43 0.43 0.44 0.50 0.54
Table A9 Observed consequences of cyber attacks, 2016
(percentages of firms that reported an attack)
Disruption of business Extra hours for
recovery and repair Data theft or loss
Geographical area North-West 0.68 0.72 0.13 North-East 0.70 0.78 0.09 Centre 0.75 0.79 0.24 South and Islands 0.70 0.57 0.26 Number of employees 20 – 49 0.70 0.71 0.16 50 – 199 0.70 0.74 0.15 200 – 499 0.73 0.81 0.18 500 and over 0.68 0.78 0.17 Tech / knowledge intensity of sector (*) ICT 0.65 0.72 0.05 High-tech, non-ICT 0.73 0.77 0.16
Low-tech 0.70 0.71 0.16 Exports as share of turnover Less than 1/3 0.70 0.72 0.17 Over 1/3 0.70 0.73 0.13
Total 0.70 0.73 0.16
36
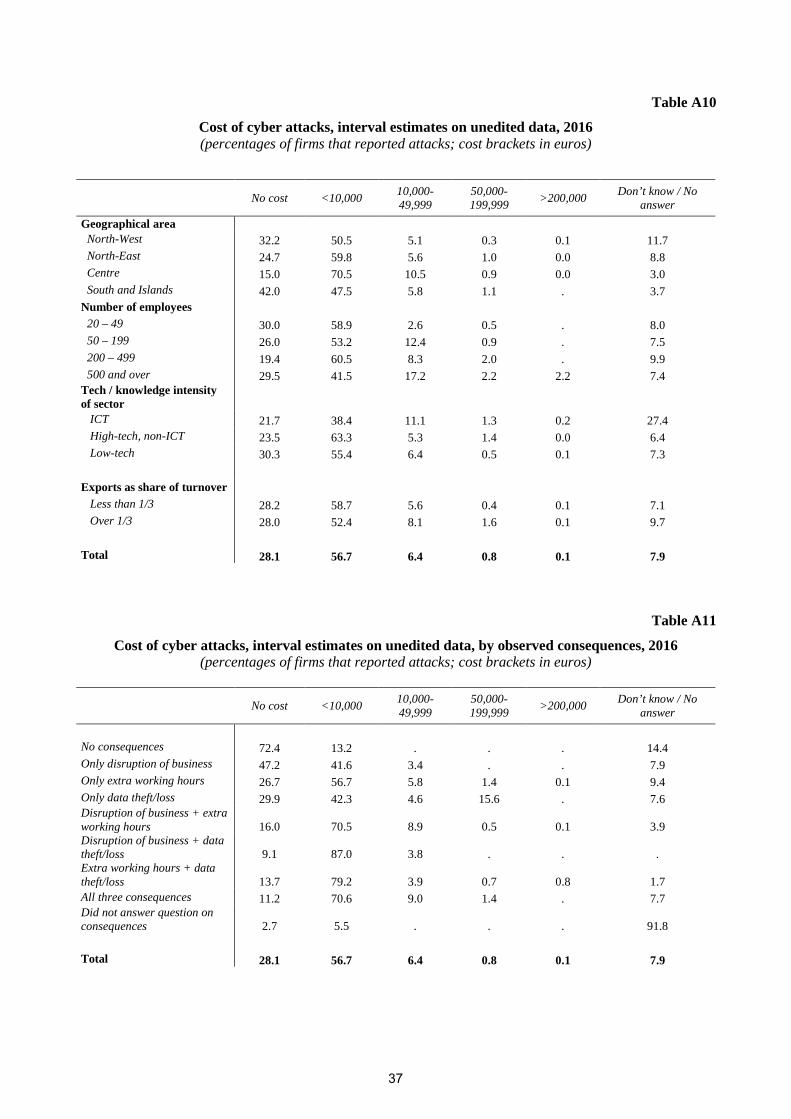
Table A10
Cost of cyber attacks, interval estimates on unedited data, 2016 (percentages of firms that reported attacks; cost brackets in euros)
No cost <10,000 10,000-49,999
50,000-199,999
>200,000 Don’t know / No
answer
Geographical area North-West 32.2 50.5 5.1 0.3 0.1 11.7 North-East 24.7 59.8 5.6 1.0 0.0 8.8 Centre 15.0 70.5 10.5 0.9 0.0 3.0 South and Islands 42.0 47.5 5.8 1.1 . 3.7 Number of employees 20 – 49 30.0 58.9 2.6 0.5 . 8.0 50 – 199 26.0 53.2 12.4 0.9 . 7.5 200 – 499 19.4 60.5 8.3 2.0 . 9.9 500 and over 29.5 41.5 17.2 2.2 2.2 7.4 Tech / knowledge intensity of sector ICT 21.7 38.4 11.1 1.3 0.2 27.4 High-tech, non-ICT 23.5 63.3 5.3 1.4 0.0 6.4 Low-tech 30.3 55.4 6.4 0.5 0.1 7.3
Exports as share of turnover Less than 1/3 28.2 58.7 5.6 0.4 0.1 7.1 Over 1/3 28.0 52.4 8.1 1.6 0.1 9.7
Total 28.1 56.7 6.4 0.8 0.1 7.9
Table A11
Cost of cyber attacks, interval estimates on unedited data, by observed consequences, 2016 (percentages of firms that reported attacks; cost brackets in euros)
No cost <10,000 10,000-49,999
50,000-199,999
>200,000 Don’t know / No
answer
No consequences 72.4 13.2 . . . 14.4 Only disruption of business 47.2 41.6 3.4 . . 7.9 Only extra working hours 26.7 56.7 5.8 1.4 0.1 9.4 Only data theft/loss 29.9 42.3 4.6 15.6 . 7.6 Disruption of business + extra working hours 16.0 70.5 8.9 0.5 0.1 3.9 Disruption of business + data theft/loss 9.1 87.0 3.8 . . . Extra working hours + data theft/loss 13.7 79.2 3.9 0.7 0.8 1.7 All three consequences 11.2 70.6 9.0 1.4 . 7.7 Did not answer question on consequences 2.7 5.5 . . . 91.8
Total 28.1 56.7 6.4 0.8 0.1 7.9
37
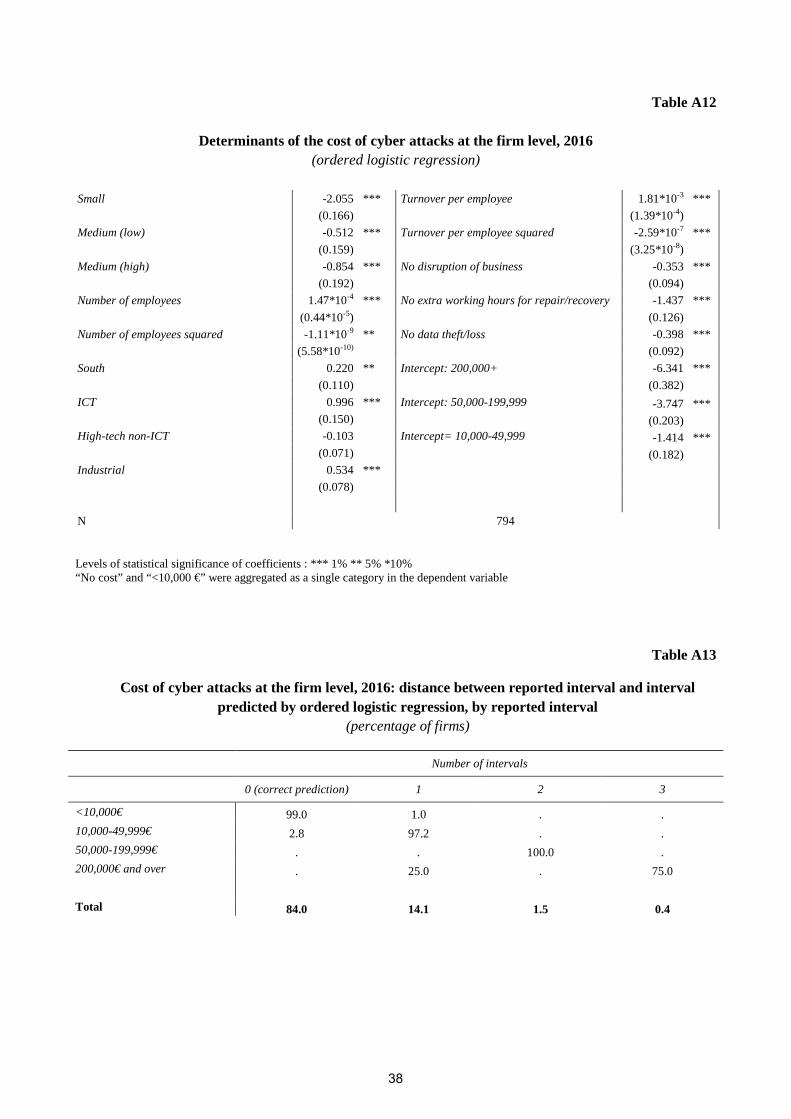
Table A12
Determinants of the cost of cyber attacks at the firm level, 2016 (ordered logistic regression)
Small -2.055 *** Turnover per employee 1.81*10-3 ***
(0.166) (1.39*10-4)
Medium (low) -0.512 *** Turnover per employee squared -2.59*10-7 ***
(0.159) (3.25*10-8)
Medium (high) -0.854 *** No disruption of business -0.353 ***
(0.192) (0.094)
Number of employees 1.47*10-4 *** No extra working hours for repair/recovery -1.437 ***
(0.44*10-5) (0.126)
Number of employees squared -1.11*10-9 ** No data theft/loss -0.398 ***
(5.58*10-10) (0.092)
South 0.220 ** Intercept: 200,000+ -6.341 ***
(0.110) (0.382)
ICT 0.996 *** Intercept: 50,000-199,999 -3.747 *** (0.150) (0.203)
High-tech non-ICT -0.103 Intercept= 10,000-49,999 -1.414 *** (0.071) (0.182)
Industrial 0.534 ***
(0.078)
N 794
Levels of statistical significance of coefficients : *** 1% ** 5% *10% “No cost” and “<10,000 €” were aggregated as a single category in the dependent variable
Table A13
Cost of cyber attacks at the firm level, 2016: distance between reported interval and interval predicted by ordered logistic regression, by reported interval
(percentage of firms)
Number of intervals
0 (correct prediction) 1 2 3
<10,000€ 99.0 1.0 . . 10,000-49,999€ 2.8 97.2 . . 50,000-199,999€ . . 100.0 . 200,000€ and over . 25.0 . 75.0
Total 84.0 14.1 1.5 0.4
38
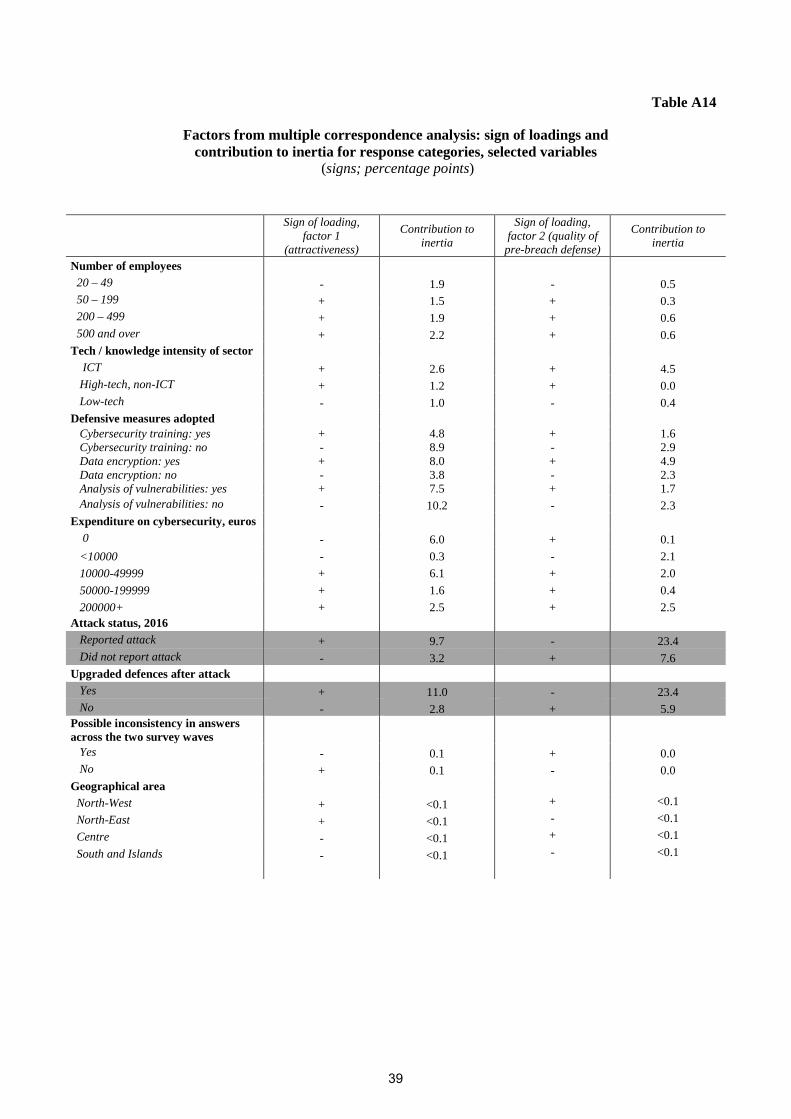
Table A14
Factors from multiple correspondence analysis: sign of loadings and contribution to inertia for response categories, selected variables
(signs; percentage points)
Sign of loading, factor 1
(attractiveness)
Contribution to inertia
Sign of loading, factor 2 (quality of pre-breach defense)
Contribution to inertia
Number of employees 20 – 49 - 1.9 - 0.5 50 – 199 + 1.5 + 0.3 200 – 499 + 1.9 + 0.6 500 and over + 2.2 + 0.6 Tech / knowledge intensity of sector ICT + 2.6 + 4.5 High-tech, non-ICT + 1.2 + 0.0
Low-tech - 1.0 - 0.4 Defensive measures adopted Cybersecurity training: yes + 4.8 + 1.6 Cybersecurity training: no - 8.9 - 2.9 Data encryption: yes + 8.0 + 4.9 Data encryption: no - 3.8 - 2.3 Analysis of vulnerabilities: yes + 7.5 + 1.7 Analysis of vulnerabilities: no - 10.2 - 2.3
Expenditure on cybersecurity, euros 0 - 6.0 + 0.1
<10000 - 0.3 - 2.1
10000-49999 + 6.1 + 2.0
50000-199999 + 1.6 + 0.4
200000+ + 2.5 + 2.5 Attack status, 2016 Reported attack + 9.7 - 23.4
Did not report attack - 3.2 + 7.6 Upgraded defences after attack Yes + 11.0 - 23.4 No - 2.8 + 5.9
Possible inconsistency in answers across the two survey waves Yes - 0.1 + 0.0
No + 0.1 - 0.0 Geographical area North-West + <0.1 + <0.1
North-East + <0.1 - <0.1
Centre - <0.1 + <0.1
South and Islands - <0.1 - <0.1
39
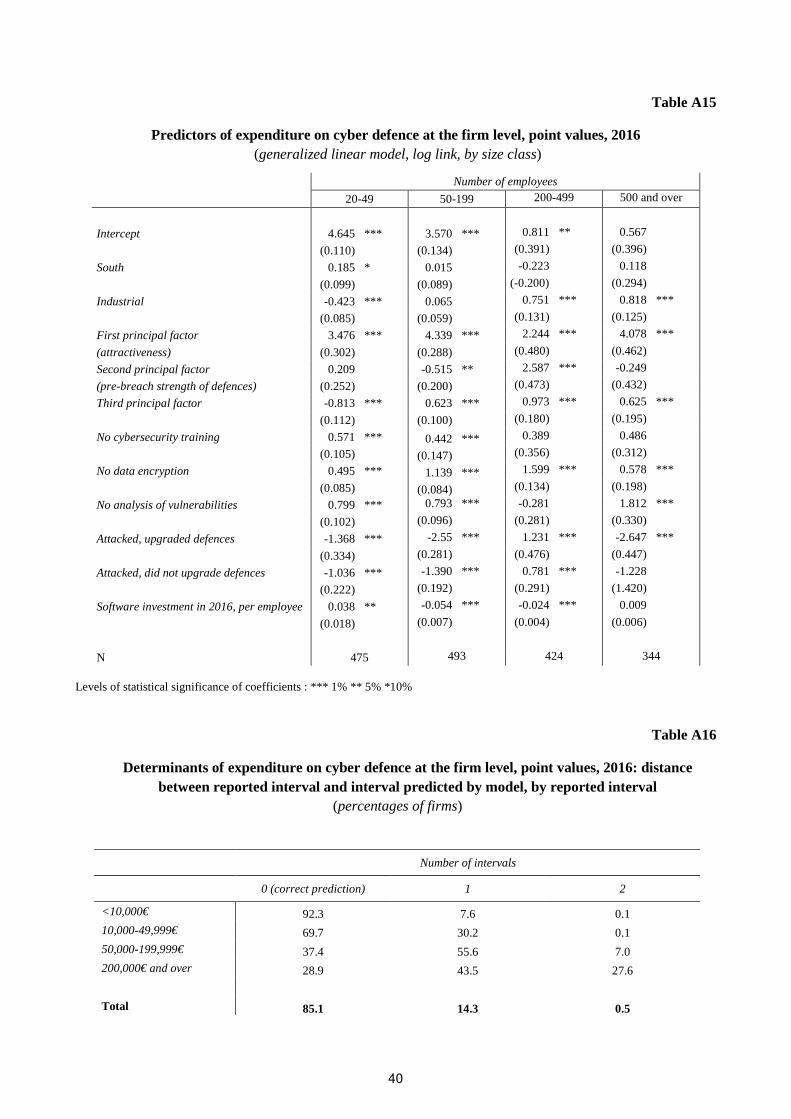
Table A15
Predictors of expenditure on cyber defence at the firm level, point values, 2016 (generalized linear model, log link, by size class)
Number of employees
20-49 50-199 200-499 500 and over
Intercept 4.645 *** 3.570 *** 0.811 ** 0.567
(0.110) (0.134) (0.391) (0.396)
South 0.185 * 0.015 -0.223 0.118
(0.099) (0.089) (-0.200) (0.294)
Industrial -0.423 *** 0.065 0.751 *** 0.818 ***
(0.085) (0.059) (0.131) (0.125)
First principal factor 3.476 *** 4.339 *** 2.244 *** 4.078 ***
(attractiveness) (0.302) (0.288) (0.480) (0.462)
Second principal factor 0.209 -0.515 ** 2.587 *** -0.249
(pre-breach strength of defences) (0.252) (0.200) (0.473) (0.432)
Third principal factor -0.813 *** 0.623 *** 0.973 *** 0.625 ***
(0.112) (0.100) (0.180) (0.195)
No cybersecurity training 0.571 *** 0.442 *** 0.389 0.486
(0.105) (0.147) (0.356) (0.312)
No data encryption 0.495 *** 1.139 *** 1.599 *** 0.578 ***
(0.085) (0.084) (0.134) (0.198)
No analysis of vulnerabilities 0.799 *** 0.793 *** -0.281 1.812 ***
(0.102) (0.096) (0.281) (0.330)
Attacked, upgraded defences -1.368 *** -2.55 *** 1.231 *** -2.647 ***
(0.334) (0.281) (0.476) (0.447)
Attacked, did not upgrade defences -1.036 *** -1.390 *** 0.781 *** -1.228
(0.222) (0.192) (0.291) (1.420)
Software investment in 2016, per employee 0.038 ** -0.054 *** -0.024 *** 0.009
(0.018) (0.007) (0.004) (0.006)
N 475 493 424 344
Levels of statistical significance of coefficients : *** 1% ** 5% *10%
Table A16
Determinants of expenditure on cyber defence at the firm level, point values, 2016: distance between reported interval and interval predicted by model, by reported interval
(percentages of firms)
Number of intervals
0 (correct prediction) 1 2
<10,000€ 92.3 7.6 0.1 10,000-49,999€ 69.7 30.2 0.1 50,000-199,999€ 37.4 55.6 7.0 200,000€ and over 28.9 43.5 27.6
Total 85.1 14.3 0.5
40
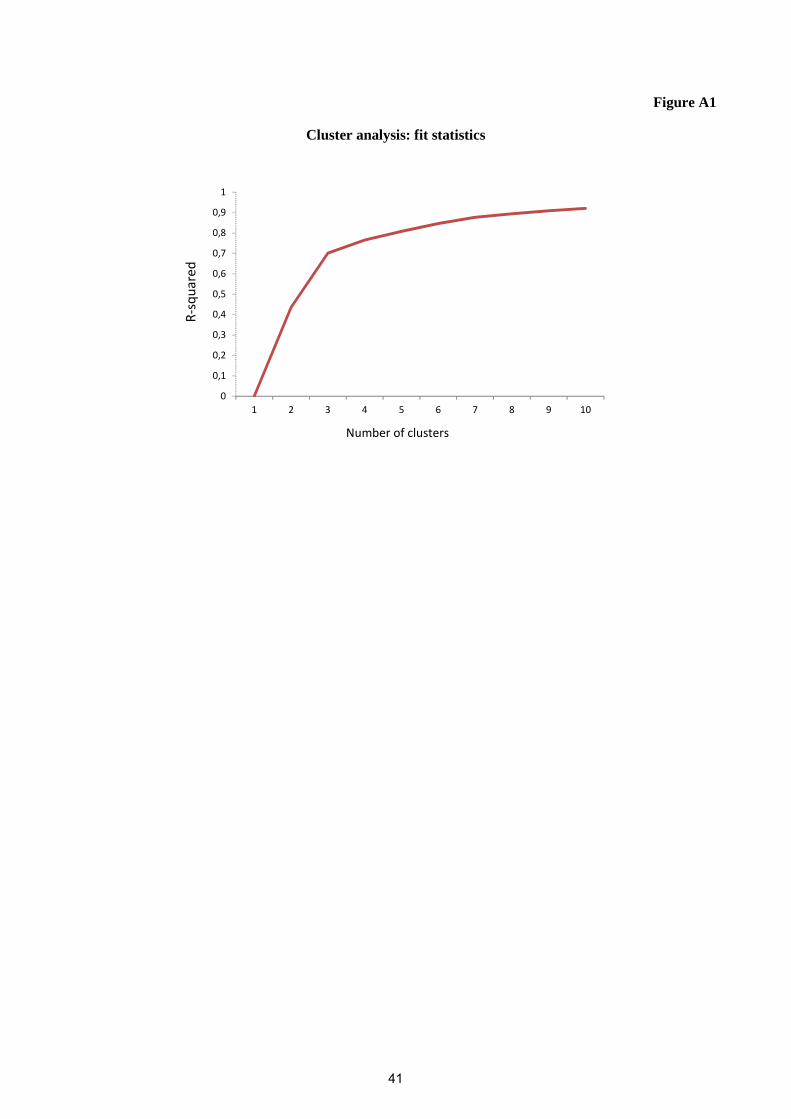
Figure A1
Cluster analysis: fit statistics
0
0,1
0,2
0,3
0,4
0,5
0,6
0,7
0,8
0,9
1
1 2 3 4 5 6 7 8 9 10
Number of clusters
R-s
qu
are
d
41
References
Anderson, R. (2001), Why Information Security is Hard – an Economic Perspective, Proceedings of the 17th
Annual Computer Security Applications Conference.
Australian Cyber Security Centre (2016), Cyber Security Survey.
Banca d’Italia (various years), Survey of Industrial and Service Firms.
Banca d’Italia (various years), Business Outlook Survey of Industrial and Service Firms.
Biancotti, C. (2017), Cyber Attacks: Preliminary Evidence from the Bank of Italy’s Business Surveys,
Occasional Paper 373, Bank of Italy.
Biancotti, C., R. Cristadoro, S. Di Giuliomaria, A. Fazio and G. Partipilo (2017), Cyber Attacks: an
Economic Policy Challenge, voxeu.org.
Biemer, P., R. Groves, L. Lyberg, N. Mathiowetz and S. Sudman eds. (2004), Measurement Error in
Surveys, Wiley.
Center for Strategic and International Studies (2017), Significant Cyber Incidents since 2006.
Fielder, A., E. Panaousis, P. Malacaria, C. Hankin and F. Smeraldi (2014), Game Theory Meets Information
Security Management, IFIP Advances in Information and Communications Technology 428.
Gal-or, E. and A. Ghose (2005), The Economic Incentives for Sharing Security Information, Information
Systems Research 16: 2.
Greenacre, M. J. (1984), Theory and application of correspondence analysis, London: Academic.
G7 Finance Ministers and Central Banks’ Governors Meeting Communiqué (2017).
Kaminska, I. (2017), Introducing the Rise of Cyber Mythology, Financial Times Alphaville, April 19.
Laube, S. and R. Böhme (2016), The Economics of Mandatory Security Breach Reporting to Authorities,
Journal of Cyber Security 2(1): 29-41.
Mandiant Consulting (2016), M-Trends Report.
Moore, T. and R. Anderson (2011), Internet Security, in Peitz, M. and J. Waldfogel (eds.), The Oxford
Handbook of the Digital Economy, Oxford University Press.
OECD (2013), Guidelines for Micro Statistics on Household Wealth.
OECD (2016), Project on Cyber Risk Insurance.
42
Osservatorio Security e Privacy (2017), Cyber Crime: La Minaccia Invisibile che Cambia il Mondo,
Politecnico di Milano.
Schneier, B., K. Seidel and S. Vijayakumar (2016), A Worldwide Survey of Encryption Products.
United Kingdom Department for Culture, Media and Sport (2017), Cyber Security Breaches Survey: Main
Report.
Ward, J. H., Jr. (1963), Hierarchical Grouping to Optimize an Objective Function, Journal of the American
Statistical Association 58: 236–244.
43