Embed Size (px)
Citation preview

lable at ScienceDirect
Quaternary Science Reviews 147 (2016) 340e364
Contents lists avai
Quaternary Science Reviews
journal homepage: www.elsevier .com/locate/quascirev
Invited review
Holocene climate change in Arctic Canada and Greenland
Jason P. Briner a, *, Nicholas P. McKay b, Yarrow Axford c, Ole Bennike d,Raymond S. Bradley e, Anne de Vernal f, David Fisher g, Pierre Francus h, i,Bianca Fr�echette f, Konrad Gajewski j, Anne Jennings k, Darrell S. Kaufman b,Gifford Miller l, Cody Rouston b, Bernd Wagner m
a Department of Geology, University at Buffalo, Buffalo, NY, USAb School of Earth Sciences & Environmental Sustainability, Northern Arizona University, Flagstaff, AZ, USAc Dept of Earth and Planetary Sciences, Northwestern University, Evanston, IL, 60208, USAd Geological Survey of Denmark and Greenland, Copenhagen, Denmarke Department of Geosciences, University of Massachusetts, Amherst, MA, 01003, USAf Centre de recherche en g�eochimie et g�eodynamique (Geotop), Universit�e du Qu�ebec �a Montr�eal, Montr�eal, QC, Canadag Department of Geology, University of Ottawa, Ottawa, ON, K1N6N5, Canadah Centre Eau Terre Environnement, Institut national de la recherche scientifique, Qu�ebec, Qc G1K 9A9, Canadai GEOTOP Research Center, Montr�eal, Qc H3C 3P8, Canadaj Department of Geography, Environment and Geomatics, University of Ottawa, Ottawa, ON, K1N6N5, Canadak Institute of Arctic and Alpine Research, University of Colorado, Boulder, USAl Department of Geological Sciences and Institute of Arctic and Alpine Research, University of Colorado, Boulder, USAm Institute of Geology and Mineralogy, University of Cologne, K€oln, Germany
a r t i c l e i n f o
Article history:Received 27 April 2015Received in revised form10 December 2015Accepted 8 February 2016Available online 28 February 2016
Keywords:GreenlandHoloceneArctic CanadaHolocene thermal maximumNeoglacial
* Corresponding author.E-mail address: [email protected] (J.P. Briner).
http://dx.doi.org/10.1016/j.quascirev.2016.02.0100277-3791/© 2016 Elsevier Ltd. All rights reserved.
a b s t r a c t
This synthesis paper summarizes published proxy climate evidence showing the spatial and temporalpattern of climate change through the Holocene in Arctic Canada and Greenland. Our synthesis includes47 records from a recently published database of highly resolved Holocene paleoclimate time series fromthe Arctic (Sundqvist et al., 2014). We analyze the temperature histories represented by the database andcompare them with paleoclimate and environmental information from 54 additional published records,mostly from datasets that did not fit the selection criteria for the Arctic Holocene database. Combined,we review evidence from a variety of proxy archives including glaciers (ice cores and glacial geo-morphology), lake sediments, peat sequences, and coastal and deep-marine sediments. Thetemperature-sensitive records indicate more consistent and earlier Holocene warmth in the north andeast, and a more diffuse and later Holocene thermal maximum in the south and west. Principal com-ponents analysis reveals two dominant Holocene trends, one with early Holocene warmth followed bycooling in the middle Holocene, the other with a broader period of warmth in the middle Holocenefollowed by cooling in the late Holocene. The temperature decrease from the warmest to the coolestportions of the Holocene is 3.0 ± 1.0 �C on average (n ¼ 11 sites). The Greenland Ice Sheet retracted to itsminimum extent between 5 and 3 ka, consistent with many sites from around Greenland depicting aswitch from warm to cool conditions around that time. The spatial pattern of temperature changethrough the Holocene was likely driven by the decrease in northern latitude summer insolation throughthe Holocene, the varied influence of waning ice sheets in the early Holocene, and the variable influx ofAtlantic Water into the study region.
© 2016 Elsevier Ltd. All rights reserved.
1. Introduction
We can improve our understanding of the sensitivity of Arcticsystems to climate change by assessing past climate changethrough time and space (e.g., Kaufman et al., 2004). For example,whether the Arctic cooled from the early to late Holocene in a

J.P. Briner et al. / Quaternary Science Reviews 147 (2016) 340e364 341
gradual or stepwise manner in response to gradual insolationchange provides insights into internal thresholds intrinsic to theArctic climate system. The role of past sea-ice variability andshifting ocean currents in modulating spatial patterns of temper-ature and precipitation in the past may help predict future spatialpatterns of precipitation and temperature. Finally, the suggestionthat climate change during the early Holocene was regionallyaffected by waning ice sheets and their influence on adjacent seasmay provide clues about future patterns of climate change inheavily glaciated regions (e.g., Kaufman et al., 2004; Kaplan andWolfe, 2006; Renssen et al., 2009). Addressing these features ofthe Holocene climate record may reveal the relative importance ofkey forcing mechanisms of climate change, internal thresholds andfeedbacks within the climate system, and benchmarks for climatemodels.
The Greenland Ice Sheet (GrIS) and heavily glaciated easternCanadian Arctic comprise themajority of glacier ice in the NorthernHemisphere (Gardner et al., 2013). Thus, northeastern NorthAmerica is a particularly suitable area for scrutinizing paleoclimateand glacial-geologic records that reveal the sensitivity of glaciersand ice sheets to climate change. The region flanks key centers ofAtlantic Meridional Overturning Circulation, and is heavily influ-enced by Arctic and Atlantic surface ocean currents.
Previously published syntheses of Arctic climate change haveproduced a temperature reconstruction of the past 2000 years(Kaufman et al., 2009), focused on the timing of the Holocenethermal maximum (Kaufman et al., 2004), used a single proxy type(Gajewski, 2015) or presented regional views (e.g., Bradley, 1990;Gajewski and Atkinson, 2003; Gajewski et al., 2009). There havebeen syntheses of Holocene climate and glaciation of Baffin Island(Miller et al., 2005; Briner et al., 2009a) and on the long-termhistory of the GrIS (Funder et al., 2011). However, there has beenno recent multi-proxy synthesis of Holocene climate change in theArctic Canada/Greenland sector of the Arctic, including bothterrestrial and marine records, despite the increasing number ofHolocene climate reconstructions from land, ocean and ice.
Here we review published Holocene paleorecords from the Ca-nadian Arctic, Greenland and adjacent seas. We combine an anal-ysis of the temperature-sensitive records within the recentlypublished Arctic Holocene database (Sundqvist et al., 2014) withadditional evidence from a broader suite of published studies. Ourprimary goal is to determine temperature trends during the Holo-cene, and the spatial pattern of temperature change throughout theregion. A secondary goal is to compare records of paleoclimatechanges with the size of the GrIS through the Holocene. Inaddressing these goals, we focus primarily on climate changetrends at the millennial timescale.
2. Regional setting and climatic influences
This synthesis includes records that extend from the easterncontinental shelf of Greenland in the east to ~120� W longitude inthe central Canadian Arctic in the west (Fig. 1) and from ~58� N tosites on northernmost Greenland. The region includes the HighArctic islands and sounds heavily influenced by influx of cold ma-rine surface waters from the Arctic Ocean, such as the EastGreenland Current flowing along eastern Greenland. Baffin Bay, thebasin between the Canadian Arctic and West Greenland, receivesthe relatively warm West Greenland Current from the south, andrelatively cold East Baffin Current from the north (Fig. 1). Theclimate on either side of Baffin Bay reflects this oceanographicpattern in both temperature and precipitation amounts; precipi-tation is typically much greater around Greenland than in the Ca-nadian Arctic.
The temperature gradients in the Canadian Arctic are not zonal,
rather, lowest summer temperatures are located in the northwest,and the eastern Arctic Islands such as and Devon and EllesmereIslands are warmer than islands to the west at the same latitudes(Edlund and Alt, 1989; Atkinson and Gajewski, 2002). Greenlandalso has large climate gradients, from the relatively warm andmoist south and west, to the cold and arid climates of the north andeast, where shores are locked in sea ice for much of the year.Another key temperature gradient in Greenland is from offshore toinland, where a significant difference is found across a short dis-tance. Although there is also a coastal effect in the Canadian Arctic(Atkinson and Gajewski, 2002), it is smaller than that found inGreenland. Southwest Greenland, southern Baffin Island and Lab-rador encircle the Labrador Sea, which is heavily influenced byAtlantic water advection and the western extent of the NorthAtlantic Subpolar Gyre. Patterns in ocean circulation and configu-ration of the subpolar gyre through the Holocene dictate climaticconditions not only in areas bordering the Labrador Sea, but alsoacross Baffin Bay, particularly in the east, due to its climate beingstrongly modulated by the West Greenland Current, fed byIrminger Current water as the northern limb of the gyre.
Through the Holocene, the major driver of climate change isinsolation; however, this is heavily modulated in the early Holo-cene by waning ice sheets and associated meltwater release,sometimes periodic, into adjacent seas (Fig. 2). The presence of icesheets well into the Holocene is an important consideration for asynthesis of Holocene climate change. For example, because ice stillcovered many portions of the Canadian Arctic until the middleHolocene (Fig. 3), lacustrine records from those regions clearlycannot be used to assess whether the thermal maximum took placein the early Holocene. An additional factor that drives temperatureand precipitation changes through the Holocene is ocean circula-tion changes in the Labrador Sea and Baffin Bay, modulated by thestrength of western branch of Atlantic Meridional OverturningCirculation and by the connection with the Arctic Ocean viaopening of the Canadian Arctic channels. Finally, the extent andseasonal duration of sea ice may have played a key role in moisturesupply on the northern borders of the focus area.
3. Arctic Holocene database
Sundqvist et al. (2014) compiled a database of 167 previouslypublished Holocene proxy climate records from the Arctic. Recordsincluded in the database (1) are from northern high latitude(>58�N), (2) have a demonstrated relation with a climate variable(although not necessarily calibrated), (3) are continuous time seriesthat include at a minimum the entire 6 to 2 ka time period, (4) areresolved at sub-millennial scale (<400 ± 200 yr), (5) are supportedby at least one age per 3000 years, and (6) are published in peer-reviewed literature. Here, we extract all records from the currentversion (v.2; http://www.ncdc.noaa.gov/paleo/study/15444) of theArctic Holocene database from the Canadian Arctic and Greenlandregion and the mainland Canada region (n ¼ 47; Table 1). Of these,33 are interpreted to represent either mean annual and/or summertemperature. The remaining are interpreted to represent sea-iceconditions or some measure of effective moisture (Table 1). Therecords are from lacustrine (n¼ 26), marine (n¼ 10), ice (n¼ 9) andpeat (n ¼ 2) archives, and include proxy data from pollen, chiron-omids, isotopes of precipitation, ice core melt layers, biomarkers(e.g., alkenones, IP25), sediment organic matter/mineral matterproxies, and marine dinocysts.
We depict the 33 temperature time series as a heat map thatillustrates temperature change in standard deviation units in 200-year bins. The 200-year bins are normalized over the period ofcommon overlap (i.e., the time steps when all records have values),and are used to determine a mean and standard deviation for each

Fig. 1. Map of focus region showing sites (black and white circles) from the Arctic Holocene database (Sundqvist et al., 2014) used in this synthesis. Black circles represent sitesshown in the heat maps in Fig. 3. White circles are sites that record a climate variable other than temperature, and are not shown in the heat maps. Red circles are 54 additional sitesmentioned in the text; see Table 2 for coordinates and site names. EGC ¼ East Greenland Current; IC¼Irminger Current; WGC¼West Greenland Current; BC¼Baffinland Current;LC ¼ Labrador Current.
J.P. Briner et al. / Quaternary Science Reviews 147 (2016) 340e364342
record, which is then used to standardize the full record. We alsoperform probabilistic principal components analysis (pPCA;Tipping and Bishop, 1999) on the 200-year averages of the 33 re-cords between 8 and 0 ka. pPCA uses an expectation maximizationalgorithm to iteratively infill missing data (Tipping and Bishop,1999). These analyses were performed in R version 2.15.2 usingthe pcaMethods package.
The predominant trend throughout the region is cooling fromthe early or middle Holocene through the late Holocene; however,the detailed structure of Holocene temperature changes variesspatially (Fig. 4). Some records show a very warm early Holocenefollowed by net cooling since 8 ka, whereas others are character-ized by maximum warmth sometime during the middle Holocene(Fig. 4). Principal components analysis reveals major features ofregional climate variation since 8 ka (Fig. 5). The records that loadheavily on PC1 (explaining 34% of the variance) are those withstrong contrasts between early/middle and late Holocene climate.These are sites with clear patterns of maximum warmth overmultiple millennia in either the early to middle Holocene (7e5 ka;positive loadings) or the late Holocene (4e0 ka; the less commonnegative loadings). PC2 (explaining 16% of the variance) reflectssites with high temperatures later in the Holocene.
An explicit goal of this paper is to investigate these patternsfurther using a broader suite of available paleorecords. For example,we are intrigued by the later and more subdued thermal maximumrecorded at sites neighboring the Labrador Sea and mainlandCanada. Further, we wish to assess modulation of Holocene climate
by ice sheet meltwater and ocean circulation changes, and thusinvestigate multiple proxies spanning climate gradients of ourstudy region.
4. Quantitative and qualitative reconstructions of Holoceneclimate change
Here we integrate the proxy climate records in the Arctic Ho-locene database with additional paleorecords that have been pub-lished from the region. Some of the additional evidence waspublished following the completion of the Sundqvist et al. (2014)database or was previously overlooked and will be included in asubsequent version of the database. These records are flagged inTable 2. Some of the additional evidence is from archive types thatdo not fit a database of continuous time series (e.g., glacial land-forms, occurrence of extralimital taxa, assemblage data that are notreduced to a single climate-related valuable), or records that didnot meet the selection criteria (due to insufficient duration, tem-poral resolution or age control) for inclusion in the Arctic Holocenedatabase. Nonetheless, our goal is to review evidence for Holoceneclimate change represented by the records in the database along-side a more complete suite of published paleorecords from theregion to better assess the extent to which a wider variety of evi-dence converges on a coherent pattern. Records that were notincluded in the Arctic Holocene database nonetheless contain in-formation useful for addressing a variety of key questions aboutHolocene climate and environmental changes. All ages are reported

Fig. 2. Selected forcing and modulating mechanisms of climate change in Arctic Canada and Greenland. Laurentide Ice Sheet area based on data from Dyke et al. (2003); GreenlandIce Sheet modeled area from Larsen et al. (2015). Insolation data from Berger and Loutre (1991). Detrital carbonate abundance indicates Laurentide Ice Sheet meltwater input intothe Labrador Sea (from Jennings et al., 2015). Iceland-Scotland (IeS) overflow, indicated by changes in the particle size of sortable silt (DSS) from Thornalley et al. (2013), generallyrecords the strength of Atlantic Meridional Overturning Circulation and the strength/size of the subpolar gyre.
J.P. Briner et al. / Quaternary Science Reviews 147 (2016) 340e364 343
in calendar kilo years BP (ka) unless otherwise specified. Recordsfrom the Arctic Holocene database are listed in Table 1, all addi-tional records discussed are in Table 2; all site locations are shownin Fig. 1.
4.1. Ice cores
Many long ice cores have been collected fromGreenland and theeastern Canada Arctic. The often-used d18O is not a straightforwardproxy for temperature over the Holocene because it is affected byelevation changes of the ice core site, moisture source, seasonaldistribution of snowfall and noise (Fisher et al., 1996; Masson-Delmotte et al., 2005). In addition to water isotopes, paleo-temperature reconstructions have been modeled from present-day borehole temperatures, isotopic gradients in trapped air, andfrom melt layers.
Despite its complications in terms of climate interpretation,d18O has been measured on ice cores that span the Holocene fromGreenland, Baffin, Devon and Ellesmere islands in the CanadianArctic, and are included in the Arctic Holocene database (Fig. 6).Vinther et al. (2009) proposed that the d18O values from the Ren-land and Agassiz ice caps are more straight forward to interpretthan those from the GrIS because their surface elevation changes
throughout the Holocene can be estimated by data-constrainedmodel calculations, and the influence of height changes at theirice core sites can be corrected. Furthermore, Vinther et al. (2009)argued that elevation-corrected d18O records from acrossGreenland should be the same, and derived a Greenland-widetemperature record by averaging the elevation-corrected d18O re-cords from Renland and Agassiz (Fig. 7). The temperature record,which integrates all seasons, shows rapid warming from the onsetof the Holocene until ~9.5 ka, relatively uniform temperature at themillennial scale until ~7 ka, followed by ~3.5 �C temperaturedecline to the Little Ice Age, followed by ~1.5 �C warming to today(Fig. 7). The record also shows centennial-scale variability on theorder of 1e2 �C, and a ~3 �C temperature oscillation during the 8.2ka event. Despite the fact that this record is corrected for elevationchanges at Agassiz and Renland, and is calibrated to boreholetemperatures, there are other processes that can influence isotoperatios of precipitation. However, Vinther et al. (2009) point out thatthe combined Agassiz/Renland d18O record should be a reasonabletemperature reconstruction for the Holocene that is at least notinfluenced by elevation history. More recent and ongoing data-constrained uplift and ice sheet modeling work suggests that theelevation correction for the Agassiz record should be changed andthat the Agassiz constant elevation temperature record will be
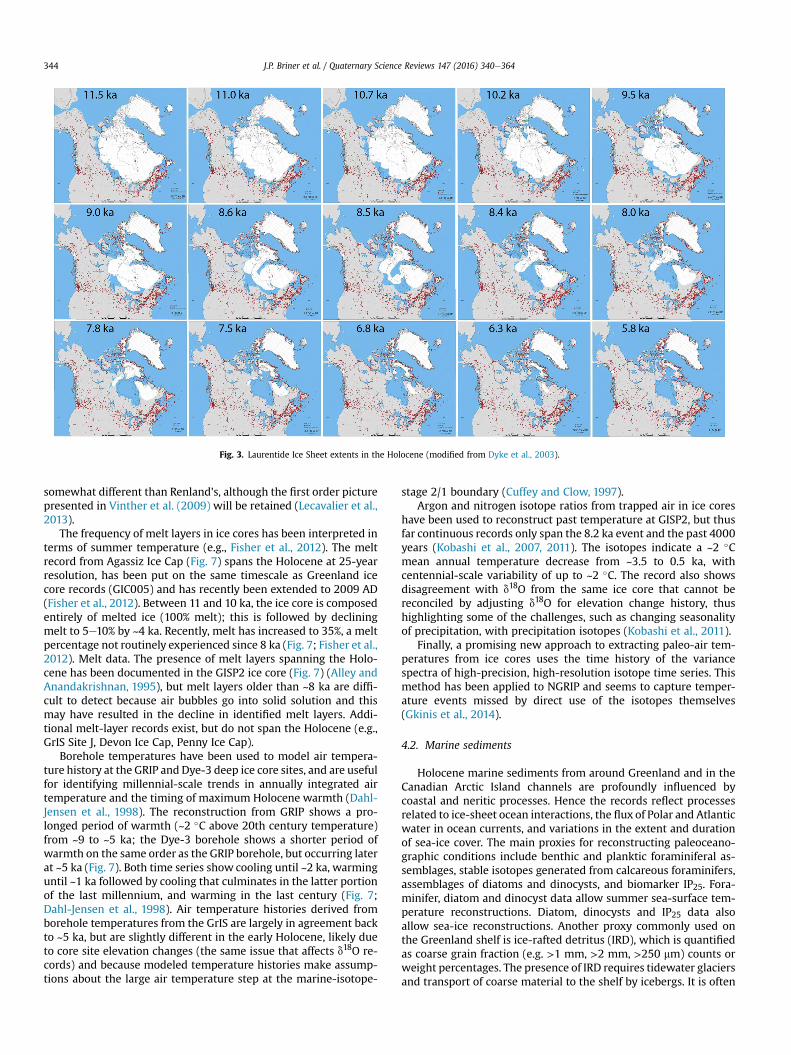
Fig. 3. Laurentide Ice Sheet extents in the Holocene (modified from Dyke et al., 2003).
J.P. Briner et al. / Quaternary Science Reviews 147 (2016) 340e364344
somewhat different than Renland's, although the first order picturepresented in Vinther et al. (2009) will be retained (Lecavalier et al.,2013).
The frequency of melt layers in ice cores has been interpreted interms of summer temperature (e.g., Fisher et al., 2012). The meltrecord from Agassiz Ice Cap (Fig. 7) spans the Holocene at 25-yearresolution, has been put on the same timescale as Greenland icecore records (GIC005) and has recently been extended to 2009 AD(Fisher et al., 2012). Between 11 and 10 ka, the ice core is composedentirely of melted ice (100% melt); this is followed by decliningmelt to 5e10% by ~4 ka. Recently, melt has increased to 35%, a meltpercentage not routinely experienced since 8 ka (Fig. 7; Fisher et al.,2012). Melt data. The presence of melt layers spanning the Holo-cene has been documented in the GISP2 ice core (Fig. 7) (Alley andAnandakrishnan, 1995), but melt layers older than ~8 ka are diffi-cult to detect because air bubbles go into solid solution and thismay have resulted in the decline in identified melt layers. Addi-tional melt-layer records exist, but do not span the Holocene (e.g.,GrIS Site J, Devon Ice Cap, Penny Ice Cap).
Borehole temperatures have been used to model air tempera-ture history at the GRIP and Dye-3 deep ice core sites, and are usefulfor identifying millennial-scale trends in annually integrated airtemperature and the timing of maximum Holocene warmth (Dahl-Jensen et al., 1998). The reconstruction from GRIP shows a pro-longed period of warmth (~2 �C above 20th century temperature)from ~9 to ~5 ka; the Dye-3 borehole shows a shorter period ofwarmth on the same order as the GRIP borehole, but occurring laterat ~5 ka (Fig. 7). Both time series show cooling until ~2 ka, warminguntil ~1 ka followed by cooling that culminates in the latter portionof the last millennium, and warming in the last century (Fig. 7;Dahl-Jensen et al., 1998). Air temperature histories derived fromborehole temperatures from the GrIS are largely in agreement backto ~5 ka, but are slightly different in the early Holocene, likely dueto core site elevation changes (the same issue that affects d18O re-cords) and because modeled temperature histories make assump-tions about the large air temperature step at the marine-isotope-
stage 2/1 boundary (Cuffey and Clow, 1997).Argon and nitrogen isotope ratios from trapped air in ice cores
have been used to reconstruct past temperature at GISP2, but thusfar continuous records only span the 8.2 ka event and the past 4000years (Kobashi et al., 2007, 2011). The isotopes indicate a ~2 �Cmean annual temperature decrease from ~3.5 to 0.5 ka, withcentennial-scale variability of up to ~2 �C. The record also showsdisagreement with d18O from the same ice core that cannot bereconciled by adjusting d18O for elevation change history, thushighlighting some of the challenges, such as changing seasonalityof precipitation, with precipitation isotopes (Kobashi et al., 2011).
Finally, a promising new approach to extracting paleo-air tem-peratures from ice cores uses the time history of the variancespectra of high-precision, high-resolution isotope time series. Thismethod has been applied to NGRIP and seems to capture temper-ature events missed by direct use of the isotopes themselves(Gkinis et al., 2014).
4.2. Marine sediments
Holocene marine sediments from around Greenland and in theCanadian Arctic Island channels are profoundly influenced bycoastal and neritic processes. Hence the records reflect processesrelated to ice-sheet ocean interactions, the flux of Polar and Atlanticwater in ocean currents, and variations in the extent and durationof sea-ice cover. The main proxies for reconstructing paleoceano-graphic conditions include benthic and planktic foraminiferal as-semblages, stable isotopes generated from calcareous foraminifers,assemblages of diatoms and dinocysts, and biomarker IP25. Fora-minifer, diatom and dinocyst data allow summer sea-surface tem-perature reconstructions. Diatom, dinocysts and IP25 data alsoallow sea-ice reconstructions. Another proxy commonly used onthe Greenland shelf is ice-rafted detritus (IRD), which is quantifiedas coarse grain fraction (e.g. >1 mm, >2 mm, >250 mm) counts orweight percentages. The presence of IRD requires tidewater glaciersand transport of coarse material to the shelf by icebergs. It is often

Table 1Proxy records from the Arctic Holocene database of Sundqvist et al. (2014) used in this review.
Site name Site IDFig. 1
Generallocation
Included inmatrix in Fig. 4
Latitude(�)
Longitude(�)
Elevation(m asl)
Source Proxy Climate variable Citation
Canadian Arctic Islands and GreenlandAgassiz 1 High Canadian
Arcticyes 80.70 �73.10 1730 ice d18O.ice,
ice.meltannual air temp Vinther et al., 2006, 2009
AkvaqiakLake
2 Baffin Island yes 66.78 �63.95 17 lake pollen July air temp Fr�echette and de Vernal 2009
ARC-3 3 CentralCanadian Arctic
no 74.27 �91.11 �347 marine IP25 spring sea ice Vare et al., 2009; Belt et al., 2010
BC01 4 WesternCanadian Arctic
yes 75.18 �111.92 225 lake OM, MS, BSi summer airtemp
Peros et al., 2010
Big RoundLake
5 Baffin Island no 69.87 �68.86 195 lake MS relative glacierextent
Thomas et al., 2010
Braya Sø 6 W Greenland yes 67.00 �50.70 170 lake alkenones summer lakesurface temp
D'andrea et al., 2011
CampCentury
7 Greenland IceSheet
yes 77.17 �61.13 1890 ice d18O.ice annual air temp Vinther et al., 2009
DA05 8 W Greenland no 68.72 �51.11 �335 marine forams annual sea ice Lloyd et al., 2007Devon Ice
Cap9 Eastern
Canadian Arcticyes 75.32 �82.50 ice d18O.ice annual air temp Fisher et al., 1983, Fisher
unpublished dataDye-3 10 Greenland Ice
Sheetyes 65.18 �43.82 2620 ice d18O.ice annual air temp Vinther et al., 2006
FlowerValleyLake
11 S Greenland no 65.61 �37.69 73 lake dD effective annualmoisture
Balascio et al., 2013
GISP2 12 Greenland IceSheet
yes 72.58 �38.46 3216 ice d18O.ice,d18O.ice
annual air temp Alley, 2000
GRIP 13 Greenland IceSheet
yes 72.01 �37.63 3230 ice d18O.ice annual air temp Vinther et al., 2006
Hjort Lake 14 E Greenland yes 76.43 �18.77 114 lake chironomids summer airtemp
Schmidt et al., 2011
HU84-030-021
15 Labrador Sea yes 58.37 �57.51 �2853 marine dinocysts summer seasurface temp
de Vernal et al., 2001, 2013
HU90-013-017
16 Labrador Sea yes 58.21 �48.37 �3380 marine dinocysts summer seasurface temp
de Vernal et al., 2013
HU91-039-008 PC
17 Baffin Bay yes 77.27 �74.33 �663 marine dinocysts summer seasurface temp
Levac et al., 2001; de Vernal et al.,2013
Igaliku Lake 18 S Greenland no 61.00 �45.43 30 lake pollen.flux summer airtemp
Massa et al., 2012
IglutalikLake
19 Baffin Island yes 66.14 �66.08 90 lake pollen July air temp Kerwin et al., 2004; Davis, 1980
Jake Lake 20 Baffin Island yes 63.67 �65.15 300 lake pollen July air temp Kerwin et al., 2004; Miller et al.,2005
2004-804-009
21 LancasterSound
yes 74.19 �81.20 �781 marine dinocysts summer seasurface temp
Ledu et al., 2010; de Vernal et al.,2013
MD99-2227
22 Labrador Sea yes 58.21 �48.37 �3460 marine dinocysts summer seasurface temp
deVernal and Hillaire-Marcel, 2006;de Vernal et al., 2013
N14 23 S Greenland no 59.98 �44.18 101 lake BSi annualprecipitation
Andresen et al., 2004
NAUJG1-1 24 W Greenland yes 66.67 �51.97 300 lake mineral.content summer airtemp
Willemse and T€ornqvist, 1999
NGRIP 25 Greenland IceSheet
yes 75.10 �42.32 2917 ice d18O.ice annual air temp Vinther et al., 2006; NorthGRIPmembers, 2004
North Lake 26 W Greenland yes 69.24 �50.03 190 lake OM, BSi,chironomids
July air temp Axford et al., 2013
Penny IceCap
27 Baffin Island yes 67.25 �66.75 1900 ice d18O.ice,d18O.ice
annual air temp Fisher et al., 1998
QipisarqoLake
28 S Greenland yes 61.00 �47.75 7 lake pollen, BSi July air temp Fr�echette and de Vernal 2009;Kaplan et al., 2002
Renland 29 E Greenland yes 71.30 �26.70 2350 ice d18O annual air temp Vinther et al., 2009SFL-1 30 W Greenland yes 67.08 �50.28 247 lake OM summer air
tempWillemse and T€ornqvist, 1999
SP02 31 CentralCanadian Arctic
yes 68.55 �83.29 220 lake OM, MS summer airtemp
Adams and Finkelstein 2010
SS1381 32 W Greenland no 67.01 �51.10 196 lake OM.flux,mineral.flux
effective annualmoisture
Anderson et al., 2012
SS16 33 W Greenland no 66.91 �50.46 477 lake diatoms effective annualmoisture
Perren et al., 2012
SS49 34 W Greenland no 66.86 �52.64 330 lake diatoms effective annualmoisture
Perren et al., 2012
SS8 35 W Greenland no 67.01 �51.07 188 lake mineral.flux,OM.flux
effective annualmoisture
Anderson et al., 2012
KR02 42 WesternCanadian Arctic
yes 71.34 �113.78 299 lake BSi, pollen July air temp Peros and Gajewski 2008
(continued on next page)
J.P. Briner et al. / Quaternary Science Reviews 147 (2016) 340e364 345

Table 1 (continued )
Site name Site IDFig. 1
Generallocation
Included inmatrix in Fig. 4
Latitude(�)
Longitude(�)
Elevation(m asl)
Source Proxy Climate variable Citation
Mainland Canada2005-804-
00636 Victoria Strait yes 68.99 �106.57 �118 marine dinocysts summer sea
surface tempLedu et al., 2010; de Vernal et al.,2013
ARC-4 37 Victoria Strait no 69.17 �100.70 �61 marine IP25 spring sea ice Belt et al., 2010ARC-5 38 Dease Strait no 68.99 �106.57 �112 marine IP25 spring sea ice Belt et al., 2010Ennadai
Lake39 Central
Canadian Arcticyes 61.17 �100.92 168 peat pollen summer air
tempViau & Gajewski, 2009; Nichols,1975
JR01 40 CentralCanadian Arctic
yes 69.90 �95.07 120 lake pollen July air temp Zabenskie and Gajewski 2007
Lake K2 41 N Qu�ebec yes 58.73 �65.93 167 lake chironomids July air temp Fallu et al., 2005LR01 43 N Qu�ebec yes 58.58 �75.25 170 lake pollen summer air
tempGajewski et al., 1993; Viau &Gajewski, 2009
S52/S53 44 CentralCanadian Arctic
yes 59.89 �104.21 395 peat d13C, d13C July air temp Tillman et al., 2010
TorontoLake
45 CentralCanadian Arctic
no 63.72 �109.35 414 lake d18O.cellulose effective annualmoisture
Wolfe et al., 1996; MacDonald et al.,1993
Unit Lake 46 CentralCanadian Arctic
no 59.40 �97.49 294 lake ARM/IRM effective annualmoisture
Camill et al., 2012
WhateverLake
47 CentralCanadian Arctic
no 64.68 �97.05 lake d18O.cellulose effective annualmoisture
Edwards et al., 1996
Notes: Proxy type abbreviations as follows: BSi ¼ biogenic-silica content; DBD ¼ dry bulk density; MAR ¼ mass accumulation rate; MS ¼ magnetic susceptibility; N, C,S ¼ nitrogen, carbon, sulfur; OM ¼ organic-matter content; TOC ¼ total organic carbon. Oldest and youngest ages are in calendar years before 1950 AD (yr BP).
J.P. Briner et al. / Quaternary Science Reviews 147 (2016) 340e364346
inferred that the presence of IRD in shelf sediments relates tocooling because it records iceberg calving, which in turn contrib-utes to cooling and freshening of surface waters. However, IRDcould likewise increase when warmer ocean currents melt moreice. Thus, IRD can be an ambiguous proxy. We note that when usingocean sediment records, it is often difficult to disentangle changesin ocean currents, surface temperature, and changes in adjacent icesheets. Nevertheless, we summarize the broad scale inferred-temperature patterns from around Greenland and the CanadianArctic channels, focusing on the timing of inferred warmest con-ditions and the pattern of late Holocene cooling.
4.2.1. Canadian Arctic Island channels and northern Baffin BayIn the Canadian Arctic, there are many marine records of pale-
oceanographic changes based on diverse approaches. In northernNares Strait, foraminiferal assemblages, stable isotope analyses andsediment lithofacies data from HLY03-05GC (Table 2) were used toreconstruct Holocene conditions (Jennings et al., 2011a). High ma-rine productivity in Hall Basin between 9 and 6 ka suggests reducedsea-ice cover as well as throughflow of nutrient-rich Pacific Water.The late Holocene is poorly resolved in HLY03-05GC, but the slowsedimentation rates and heavier carbon isotope values suggestcooler conditions, increased sea-ice cover and decreased produc-tivity after 6 ka. Other paleoceanographic studies in southern NaresStrait indicated an increase in spring sea ice beginning ~3 ka on thebasis of dinocyst assemblages, IP25 and other biological tracers(Levac et al., 2001; Knudsen et al., 2008; Belt et al., 2010).
In Barrow Strait, Pienkowski et al. (2012) used several proxies toreconstruct a transition at 7.8 to 6.7 ka from a period of more openwater to one trending toward increasing sea ice (Fig. 8). By 6.7 kathey inferred that conditions were similar to present. Glacioiso-static shallowing of the channels within the Canadian Arctic Ar-chipelago reduced and eventually excluded the throughflow of theAtlantic water layer from the Arctic Ocean.
Vare et al. (2009) used IP25 to reconstruct spring sea-ice con-ditions in the Barrow Strait at Site ARC-3 (Table 1; Fig. 1) from 10 to0.4 ka. Low occurrence of spring sea ice inferred from IP25 occurredfrom 10 to 6 ka. From 6 to 4 ka spring sea ice increased gradually. Anincrease in IP25 from 4 to 3 ka and continuing to the end of therecord suggests a strong increase in spring productivity related tosea ice.
Ledu et al. (2008, 2010a, b) reconstructed dense seasonal sea-ice
cover through the Holocene from the Northwest Passage, includingDease Strait (ARC-5), Lancaster Sound (core 2004-804-009) andBarrow Strait (ARC-3; Table 1; Fig. 1). They found slightly increasingsea ice since 3 ka in Lancaster Sound and Dease Strait. They alsoreconstructed summer sea surface temperature changes withmaxima up to 3 �C higher than present between 8.5 and 5.5 ka, withpeak Holocene warmth between 6.5 and 5.5 ka in Lancaster Sound,which they associated with a strengthened influence of the WGC.The temperature and sea-ice reconstructions from Lancaster Soundmatch well those from the northern Baffin Bay (Levac et al., 2001;de Vernal et al., 2013); both records show a gradual cooling ofsurface water in summer and increased seasonal extent of sea-icecover from 5.5 ka to present.
4.2.2. Western Greenland shelfThe marine records from the western Greenland shelf are
particularly complex as they are influenced by meltwater dischargeand ice dynamics along the GrIS margins in addition to large-scaleocean circulation patterns. Hence, the tracers of benthic andepipelagic conditionsmay capture complementary signals that mayprovide apparent discrepancies. For example, high surface airtemperatures responsible for enhanced melting also result infreshening of surface water and increased stratification, in turnfostering large annual amplitude of sea-surface temperature withdense winter sea ice. Although complex, the western Greenlandshelf records are particularly interesting because high sedimenta-tion rates permit reconstruction with centennial resolution orhigher.
Nørgaard-Pedersen and Mikkelsen (2009) studied sedimentfrom Narsaq Sound in South Greenland (Ga3-2) and proposedmaximum retreat of glaciers ~8 ka and cooling at 4.8 ka. Fartheroffshore, from Holsteinburg Dyb, Erbs-Hansen et al. (2013) presenta 6700-yr-long record of variations in Polar and Atlantic watermasses of the West Greenland Current in Holsteinsburg Dyb(GA306-GC3; GA306-GC4) using benthic foraminiferal assem-blages, which suggest that cooling took place after 3.8 ka.
North of Davis Strait in eastern Baffin Bay, Disko Bugt and theadjacent shelf has been an area of intense focus over the pastdecade (Moros et al., 2006b; Lloyd et al., 2007; Perner et al., 2012;Jennings et al., 2014; Ouellet-Bernier et al., 2014; Seidenkrantzet al., 2008; Sha et al., 2014). Using benthic foraminifers in a high-resolution record beginning 7.3 ka (core MSM 343300), Perner et al.

Fig. 4. Heat map of temperature-sensitive records in the Arctic Canada/Greenland region of the Arctic Holocene database (Sundqvist et al., 2014). Numbers refer to site IDs listed inTable 1 and shown on Fig. 1. Records are arranged from left to right in order of decreasing north latitude (top) and west longitude (bottom). Colors correspond to standard deviationswith respect to the interval of common overlap. Missing values are indicated in gray.
J.P. Briner et al. / Quaternary Science Reviews 147 (2016) 340e364 347
(2012) tracked changes in sub-surface water mass, which recordsproperties of the West Greenland Current. From 7.3 to 6.2 ka thebenthic fauna indicate strong Irminger Current flux and enhancedice sheet meltwater production; thermal maximum conditions arerecorded from 6.2 to 3.5 ka (Fig. 8). In the same core, dinocyst as-semblages indicate the maximum sea surface temperature ~6 ka,with significant cooling pulses centered ~4.5 and ~1.5 ka (Ouellet-Bernier et al., 2014). A general trend toward cooling and fresh-ening of sub-surface water masses occurred in Disko Bugt at 3.5 ka(Lloyd et al., 2007; Perner et al., 2012) as suggested from benthicfaunal changes, implying a weakening the West Greenland Currentrelative to increasing influence of the East Greenland Current.
4.2.3. East Greenland shelf/marginSeveral studies have reconstructed Holocene sea-ice variations
and warm saline Atlantic Water inflow via the Norwegian AtlanticCurrent to Fram Strait during the Holocene (core MSM5/5-712-2;Müller et al., 2012; Werner et al., 2013; de Vernal et al., 2013,
Fig. 8). Werner et al. (2013) reconstructed cooling from 5.2 ka to thepresent associated with increased polar water flux and southwardand eastward advancing sea-ice margin. Sea-ice advection to FramStrait was synchronous with full postglacial flooding of the ArcticOcean shelves ~5 ka (Bauch et al., 2001).
The East Greenland shelf in the region of Denmark Strait (68� N)is influenced by the East Greenland Current, which carries bothcold low-salinity Polar Water at the surface and chilled returnAtlantic Water and relatively warm saline Irminger Current in thesubsurface (Jennings et al., 2011b). The sediments from the EastGreenland shelf include the signal of these currents in addition tosedimentary input related to the ice dynamics along the east GrISmargins. Andrews et al. (1997) found increased IRD, which theyinterpreted as a manifestation of advance of Greenland glaciers intotidewater and cooling beginning 6 ka. In the Nansen Trough (JM96-1206/1-GC, JM96-1207/1-GC), Jennings et al. (2002) relatedchanges in benthic foraminiferal assemblages, stable isotopes andincreased IRD fluxes to a shift toward cooler conditions at ~4.7 ka.
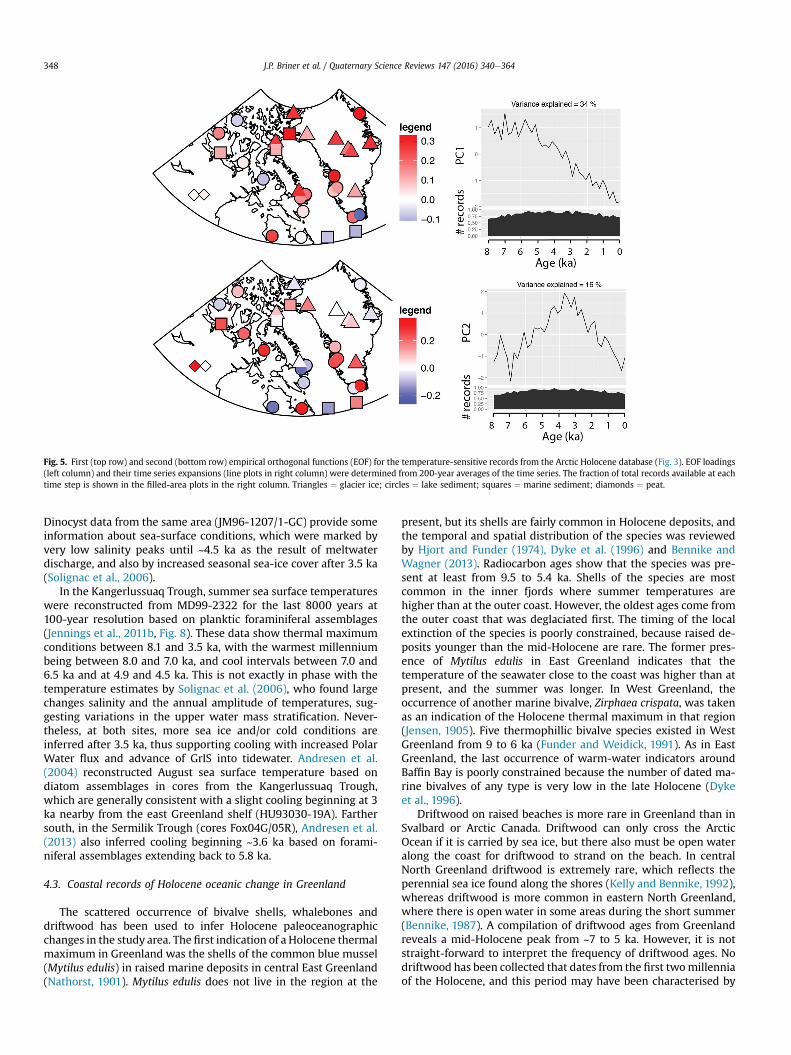
Fig. 5. First (top row) and second (bottom row) empirical orthogonal functions (EOF) for the temperature-sensitive records from the Arctic Holocene database (Fig. 3). EOF loadings(left column) and their time series expansions (line plots in right column) were determined from 200-year averages of the time series. The fraction of total records available at eachtime step is shown in the filled-area plots in the right column. Triangles ¼ glacier ice; circles ¼ lake sediment; squares ¼ marine sediment; diamonds ¼ peat.
J.P. Briner et al. / Quaternary Science Reviews 147 (2016) 340e364348
Dinocyst data from the same area (JM96-1207/1-GC) provide someinformation about sea-surface conditions, which were marked byvery low salinity peaks until ~4.5 ka as the result of meltwaterdischarge, and also by increased seasonal sea-ice cover after 3.5 ka(Solignac et al., 2006).
In the Kangerlussuaq Trough, summer sea surface temperatureswere reconstructed from MD99-2322 for the last 8000 years at100-year resolution based on planktic foraminiferal assemblages(Jennings et al., 2011b, Fig. 8). These data show thermal maximumconditions between 8.1 and 3.5 ka, with the warmest millenniumbeing between 8.0 and 7.0 ka, and cool intervals between 7.0 and6.5 ka and at 4.9 and 4.5 ka. This is not exactly in phase with thetemperature estimates by Solignac et al. (2006), who found largechanges salinity and the annual amplitude of temperatures, sug-gesting variations in the upper water mass stratification. Never-theless, at both sites, more sea ice and/or cold conditions areinferred after 3.5 ka, thus supporting cooling with increased PolarWater flux and advance of GrIS into tidewater. Andresen et al.(2004) reconstructed August sea surface temperature based ondiatom assemblages in cores from the Kangerlussuaq Trough,which are generally consistent with a slight cooling beginning at 3ka nearby from the east Greenland shelf (HU93030-19A). Farthersouth, in the Sermilik Trough (cores Fox04G/05R), Andresen et al.(2013) also inferred cooling beginning ~3.6 ka based on forami-niferal assemblages extending back to 5.8 ka.
4.3. Coastal records of Holocene oceanic change in Greenland
The scattered occurrence of bivalve shells, whalebones anddriftwood has been used to infer Holocene paleoceanographicchanges in the study area. The first indication of a Holocene thermalmaximum in Greenland was the shells of the common blue mussel(Mytilus edulis) in raised marine deposits in central East Greenland(Nathorst, 1901). Mytilus edulis does not live in the region at the
present, but its shells are fairly common in Holocene deposits, andthe temporal and spatial distribution of the species was reviewedby Hjort and Funder (1974), Dyke et al. (1996) and Bennike andWagner (2013). Radiocarbon ages show that the species was pre-sent at least from 9.5 to 5.4 ka. Shells of the species are mostcommon in the inner fjords where summer temperatures arehigher than at the outer coast. However, the oldest ages come fromthe outer coast that was deglaciated first. The timing of the localextinction of the species is poorly constrained, because raised de-posits younger than the mid-Holocene are rare. The former pres-ence of Mytilus edulis in East Greenland indicates that thetemperature of the seawater close to the coast was higher than atpresent, and the summer was longer. In West Greenland, theoccurrence of another marine bivalve, Zirphaea crispata, was takenas an indication of the Holocene thermal maximum in that region(Jensen, 1905). Five thermophillic bivalve species existed in WestGreenland from 9 to 6 ka (Funder and Weidick, 1991). As in EastGreenland, the last occurrence of warm-water indicators aroundBaffin Bay is poorly constrained because the number of dated ma-rine bivalves of any type is very low in the late Holocene (Dykeet al., 1996).
Driftwood on raised beaches is more rare in Greenland than inSvalbard or Arctic Canada. Driftwood can only cross the ArcticOcean if it is carried by sea ice, but there also must be open wateralong the coast for driftwood to strand on the beach. In centralNorth Greenland driftwood is extremely rare, which reflects theperennial sea ice found along the shores (Kelly and Bennike, 1992),whereas driftwood is more common in eastern North Greenland,where there is open water in some areas during the short summer(Bennike, 1987). A compilation of driftwood ages from Greenlandreveals a mid-Holocene peak from ~7 to 5 ka. However, it is notstraight-forward to interpret the frequency of driftwood ages. Nodriftwood has been collected that dates from the first twomillenniaof the Holocene, and this period may have been characterised by

Table 2Records discussed in text in addition to those in the Arctic Holocene database of Sundqvist et al. (2014).
Site name SiteIDFig. 1
Lat (�) Lon (�) Citation Source Proxy Climate variable
HLY03-05GC 48 81.62 �63.26 Jennings et al., 2011b marine benthic and planktic foraminifers, stable isotopes, sediment sea ice, marineproductivity
86027-144 49 74.26 �91.24 Pienkowski et al., 2012 marine Microfossils (dinocysts, non-pollen palynomorphs, benthic andplanktic foraminifers) d18O and d13C from foraminifers, andsedimentology
sea ice
Ga3-2 50 60.94 �46.16 Nørgaard-Pedersen andMikkelsen 2009
marine sediment retreat of glaciers
GA306-GC3* 51 66.63 �54.21 Erbs-Hansen et al., 2013 marine benthic foraminifers variations in Polarand Atlantic watermasses
GA306-GC4 52 66.75 �53.94 Erbs-Hansen et al., 2013 marine benthic foraminifers variations in Polarand Atlantic watermasses
MSM 343300* 53 68.47 �54 Perner et al., 2012 marine benthic foraminifers sub-surface watermass
MSM 343300* 53 68.47 �54 Ouellet-Bernier et al., 2014 marine dinocysts summer sea surfacetempertaure, sea ice
MSM5/5-712-2 NA 78.92 6.77 Müller et al., 2012; Werneret al., 2013; de Vernal et al.,2013
marine IP25, sediment, planktic foraminifers, dinocysts sea ice, Atlanticwater inflow
JM96-1206/1-GCand JM96-1207/1-GC
55 68.1 �29.43 Jennings et al., 2002;Solignac et al., 2006
marine benthic foraminifers, stable isotopes, sediment, dinocysts sub-surface watermass, sea-surfacecondition
MD99-2322 56 67.14 �30.83 Jennings et al., 2011a marine planktic foraminifers summer sea-surfacetemperatures
HU93030-19A 57 67.15 �30.82 Andersen et al., 2004 marine diatoms August sea-surfacetemperatures
Fox04G 58 65.56 �37.46 Andresen et al., 2013 marine benthic and planktic foraminifers sea-surfaceconditions
Fox05R 59 65.56 �37.44 Andresen et al., 2013 marine benthic and planktic foraminifers sea-surfaceconditions
Disraeli Fjord 60 82.87 �73.49 Antoniades et al., 2011 marine redox sediment properties, organic indicators presence/absence ofice shelves
DV09, DevonIsland
61 75.58 �89.32 Courtney-Mustaphi andGajewski, 2013
lake sediments temp
Lower MurrayLake,EllesmereIsland
62 81.35 �69.53 Cook et al., 2009 lake varved sediments July air temp
Baird Inlet 63 78.49 �76.78 Hyv€arinen 1985 lake pollen tempVictoria Island,
Lake WB0264 72.29 �109.87 Fortin and Gajewski 2009 lake chironomids temp
RS36 65 72.58 �95.07 Gajewski 1995 lake pollen tempRS29 66 73.13 �95.28 Gajewski 1995 lake pollen tempLake PW02 67 74.07 �97.77 Finkelstein and Gajewski
2008lake BSi, diatoms temp
Lake PW03 68 73.12 �96.68 Finkelstein and Gajewski2007
lake BSi, diatoms temp
Caribou Lake 69 65.21 �83.8 Rolland et al., 2008 lake chironomids August tempLake CF8 70 70.56 �68.95 Axford et al., 2009, 2011 lake chironomids summer tempLake CF3 71 70.53 �68.37 Briner et al., 2006 lake chironomids summer tempPatricia Bay Lake 72 68.5 �70.47 Kerwin et al., 2004 lake pollen July air tempFog Lake 73 67.18 �63.25 Fr�echette et al., 2006, 2008 lake pollen July air tempLake E 74 67 �50.7 D'Andrea et al., 2011 lake alkenones summer lake surface
tempLake SS1220 75 67.05 �51.22 Olsen et al., 2012a lake redox-sensitive elements NAO indexLangesø 76 75.37 �58.6 Fredskild 1985 lake pollen, beetles, stickleback fishes tempRundesø 77 75.37 �58.6 Fredskild 1985 lake pollen, beetles, stickleback fishes tempQeqertat 78 77.5 �66.65 Fredskild 1985 lake pollen, beetles, stickleback fishes tempNordvestø 79 76.74
and76.73
�73.21and �73.18
Bennike et al., 2008a peat macrofossils temp
Kap Inglefield Sø 80 82.17 �30.57 Blake et al., 1992 lake sediments, algal (Scenedesmus) temp, ice coverKlaresø 81 83.62 �30.78 Fredskild 1969 lake pollen tempKaffeklubben Sø 82 83.52 �28.35 Perren et al., 2012 lake diatoms, chrysophysts tempBliss Lake 83 81.6 �16.67 Olsen et al., 2012b lake d13C, TOC tempSommersø 84 80.02 �22.65 Fredskild 1969; Funder and
Abrahamsen 1988lake pollen temp
Lille Sneha Sø 85 79.53 �23.88 Wagner and Bennike, 2015 lake chironomids, water flea, OM tempA small lake
south ofSkallingen
86 79.53 �23.88 Bennike and Weidick 2001 lake macrofossils, OC, CaCO3 temp
(continued on next page)
J.P. Briner et al. / Quaternary Science Reviews 147 (2016) 340e364 349

Table 2 (continued )
Site name SiteIDFig. 1
Lat (�) Lon (�) Citation Source Proxy Climate variable
Duck Lake 87 76.13 �18.61 Klug et al., 2009b; Schmidtet al., 2011
lake chironomids temp
Melles Lake* 88 75.33 �19.92 Klug et al., 2009a lake OM tempDødis Sø 89 75.32 �20.05 Bj€orck and Persson 1981;
Bj€orck et al., 1994lake pollen summer temp
Peters Bugt Sø 90 75.32 �19.67 Bj€orck and Persson 1981;Bj€orck et al., 1994
lake pollen summer temp
Ailsa Sø 91 74.55 �18.86 Bj€orck and Persson 1981 lake pollen summer tempGermania Havn
Sø92 74.5 �20.63 Bennike and Wagner 2012 lake macrofossils, caddis flies temp
Boresø 93 73.33 �25.22 Bennike et al., 2008b lake pollen, macrofossils, cladocerans, geochemistry tempLake N1 94 72.72 �22.45 Wagner and Melles 2002 lake pollen tempBasaltsø* 95 72.7 �22.48 Wagner et al., 2000; Cremer
et al., 2001lake geochemical data, pollen, diatoms temp
Lake B1 96 72.7 �22.48 Wagner et al., 2005 lake chironomids tempLake Sisi 12 97 66.98 �53.72 Wagner and Bennike 2012 lake macrofossils tempLake Sisi 14 98 66.98 �53.73 Wagner and Bennike 2012 lake macrofossils tempLake Sisi 15 99 66.96 �53.68 Wagner and Bennike 2012 lake macrofossils tempKulusuk Lake* 100 65.56 �37.11 Balascio et al., 2015 lake geochemical data glacier extent
Note: This table includes: (1) records that do notmeet the criteria for inclusion in the Arctic Holocene database, and (2) 6 records thatmeet the criteria but were not included inthe Arctic Holocene database because they were published subsequent to v2 or because they were overlooked; these are marked by * under site name and will be included inan updated version of the database and will posted at NOAA-Paleoclimatology. OC: organic carbon, TOC: total organic carbon, CaCO3: carbonates.
J.P. Briner et al. / Quaternary Science Reviews 147 (2016) 340e364350
perennial sea ice in North and Northeast Greenland. Along thenorth coast of Peary Land in North Greenland, Funder et al. (2011)dated 56 pieces of driftwood. Thirteen were dated to the period0.14e0 ka, 12 to 0.97e0.57 ka, 6 to 1.9e1.8 ka, and the rest of theages are scattered from 7.9 to 2.6 ka. The best-developed beachridges in the region are dated to 8.5 to 6 ka, which is taken to markthe sea-ice minimum and temperature maximum (Funder et al.,2011).
Investigations of Disraeli Fjord, Northern Ellesmere Islandrevealed the presence of ice shelves by the analysis of redox sedi-ment properties and organic indicators (Antoniades et al., 2011).The data show overall Holocene cooling; the fjords were notblocked by ice shelves prior to 4 ka, and were periodically blockedby ice shelves after 4 ka. However, according to England et al.(2008), the lack of driftwood and whales bones in fjords from the
Fig. 6. Oxygen isotope (d18O) records from Holocene-long ice cores in the study area, as comIce Cap data are corrected for elevation change (Vinther et al., 2009). Penny Ice Cap data a
same area after 5.5 ka seems to indicate that the ice shelves mayhave formed earlier.
4.4. Lacustrine sediments
Lake sediments permit diverse methods of reconstructingterrestrial paleoclimate conditions, and offer broad geographiccoverage across our study region. Lake sediments preservenumerous biological, physical and chemical indicators of pastclimate and of aquatic and terrestrial environmental conditions. Anincreasing number of biological and geochemical training setsfacilitate quantitative assessments of past environmental variables(e.g., Kerwin et al., 2004; Whitmore et al., 2005; Shanahan et al.,2013). Importantly, in this treeless study region lakes are uniquein providing abundant continuous archives of terrestrial climate
piled in the Arctic Holocene database (Sundqvist et al., 2014). Only Agassiz and Renlandre from the 1995 core.

Fig. 7. Selected ice core records. Agassiz þ Renland d18O from Vinther et al. (2009);Agassiz melt record from Fisher et al. (2012); GISP2 melt record from Alley andAnandakrishnan (1995); borehole temperature data from Dahl-Jenson et al. (1998).
Fig. 8. Selected marine-sediment records showing transition from warm to coolconditions. Arranged (left to right) in order of increasing influence of Irminger Current.Refer to text for site information and sources.
J.P. Briner et al. / Quaternary Science Reviews 147 (2016) 340e364 351
history beyond the ice caps and the GrIS, thus complementing ice-core derived records that capture atmospheric conditions overlarge ice masses.
Across the Canadian Arctic Islands and Greenland, lakes andtheir catchments experienced deglaciation, and in some casesisostatic emergence from the marine environment, at various timeswithin the late glacial or Holocene. Lake records that begin withinthe Holocene may not capture the onset of warmth, or necessarilyconstrain the timing of the warmest conditions of the Holocene, incontrast with ice core records from the GrIS and nearby ice caps(e.g., Agassiz, Devon and Renland) that span the entire Holocene.
4.4.1. High Canadian ArcticHigh-resolution lacustrine records spanning the entire Holo-
cene are rare in the High Canadian Arctic where the Innuitian IceSheet persisted until ~8 ka (Fig. 3; O'Cofaigh et al., 2000; Dyke et al.,2002) and its influence on regional climate was strong. Althoughmany small lakes contain sedimentary sequences longer than 8000years, their sedimentation rates are low (e.g. Smith, 2002) andradiocarbon dating is problematic (e.g. Abbott and Stafford, 1996).
Although many coastal lakes contain varved sediments, theirlower portions commonly consist of marine sediments and thesedimentary changes can be difficult to interpret over long timeintervals (>2 ka) because of changing boundary conditions unre-lated to climate. The longest varved sediment sequence yetanalyzed from the High Arctic was taken from Lower Murray Lake,Ellesmere Island, which spans the past 5.2 ka (Cook et al., 2009).The mass accumulation rate during the 20th century was positivelycorrelated with instrumental July temperatures. Around 4.9 ka,reconstructed temperatures were 3.5 �C lower than recent
conditions, possibly because of the proximity of the still recedingInnuitian Ice Sheet. Soon after 4.9 ka, temperatures increased forthe next 4000 years. Temperatures decreased at ~0.65 ka to reach aminimum around ~0.15 ka. Since then, temperatures have risen toreach maximum values at the end of the 20th century. Most of thevarved sequences display similarities with the Agassiz Ice Cap d18Oand/or melt records. A pollen-based temperature reconstructionfrom Baird Inlet shows cooling in the past 4 ka (Hyv€arinen, 1985).Sediments from Lake DV09 in north-central Devon Island showsrapid sedimentation prior to ~6 ka, which was interpreted as arelatively warm period (Courtney-Mustaphi and Gajewski, 2013).
4.4.2. Western Canadian ArcticGajewski et al. (2000) discussed four pollen diagrams from
south to north across Banks Island, western Canadian Arctic. Basalages are ~11.5 ka, and pollen data suggest cool conditions from 11.5to 7.8 ka, warm conditions from 7.8 to 2.0 ka, and cooling since 2.0ka (Gajewski et al., 2000). However, this early period of cool con-ditions contrasts with most climate reconstructions from thewestern Canadian Arctic. Lake BC01 (Melville Island; Table 1; Fig. 1)has pollen, diatom and sediment data (Fig. 9a) and a reliablechronology that suggests deglaciation of the site by 13 ka (Peroset al., 2010). Pollen assemblages were used to reconstruct Julytemperature and annual precipitation using the modern analog

J.P. Briner et al. / Quaternary Science Reviews 147 (2016) 340e364352
technique. The data indicate maximum temperatures between 11and 5 ka, and subsequent cooling. Diatoms were essentially absentin sediments older than 5 ka, suggesting dissolution during thepollen-inferred warm period (Fig. 8a; Peros et al., 2010).
Lake KR02 (Victoria Island, Table 1; Fig. 1) is among the bestdated and most studied lake in the western Canadian Arctic. Pollenwas used to reconstruct July temperature and annual precipitationusing three different methods, all of which reveal a long-termsummer cooling of ~4 �C through the 10,200-year-long record,with warmest conditions prior to 6e5 ka and cooling beginning at 5ka (Fig. 9a; Peros and Gajewski, 2008). Chironomid assemblageswere also used for a quantitative reconstruction using two differentmethods (Fortin and Gajewski, 2010) and similarly suggest long-term summer cooling, with highest temperatures between 10.0and 7.5 ka. Although the pollen- and chironomid-inferred tem-perature trends are similar, they differ in their ranges and absolutetemperatures. The diatoms from Lake KR02 are more difficult tointerpret (Fig. 9a; Podritzkie and Gajewski, 2007) because no cali-bration dataset are available for quantitative reconstructions, duein part to lack of analogs in modern assemblages for many fossilassemblages. Recent work suggested that pH, among other limno-logical variables, is a main factor affecting diatom assemblages inthe Arctic (Bouchard et al., 2014; Finkelstein et al., 2014). Thezonation of the diatom assemblages from Lake KR02 and scores ofthe first principal component show transitions at 8.1, 5.8 and 3.6 ka.Dissolution zones were identified at 8.5e8.2, 7.6e7.0 and 5.6e5.0ka. The reason for these is not clear, but Fortin and Gajewski (2010)suggest it is due to lake water pH changes (Fig. 9a).
Fortin and Gajewski (2009) studied a second lake on VictoriaIsland, Lake WB02, to generate a chironomid-inferred temperaturereconstruction (Fig. 9a), which showed little change during theHolocene. There were a lack of good analogs, and subsequent work(Fortin, 2011; Fortin et al., 2015) with a new training set shows along-term cooling trend over the past 5 ka. Finally, using all avail-able pollen data from the western Canadian Arctic, Gajewski(2015a) reconstructed elevated July temperatures prior to 7 kaand lowest July temperatures between ~4.0 and 1.0 ka (Fig. 10).
4.4.3. Central Canadian ArcticPollen concentrations are related to plant production, which is
positively associated with temperature (Gajewski, 1995, 2015b).Long-term cooling since 6 ka is inferred based on pollen concen-trations from two lakes on Somerset Island (Fig. 9b; RS36 and RS29;Gajewski, 1995). Pollen data from a lake on Prince of Wales Island(Gajewski and Frappier, 2001) reveal warmest conditions between7 and 4 ka, followed by cooling. Highest values of biogenic silicasuggest higher diatom production in Lake PW02 and warmestconditions from 9.5 to 6.5 ka and cooling after 4 ka (Fig. 9b;Finkelstein and Gajewski, 2008). At Lake PW03 (Finkelstein andGajewski, 2007), there is a hiatus between 10 and 3.5 ka, perhapsdue to lake-level changes. A sediment core from Lake JR01 (Table 1;Fig. 1), Boothia Peninsula, was analyzed for diatoms (LeBlanc et al.,2004) and temperature was reconstructed based on pollenassemblage data (Zabenskie and Gajewski, 2007). The record spansthe past 7 ka, and diatom concentrations are highest prior to 4 ka(Fig. 9b; LeBlanc et al., 2004). Diatom diversity was greater prior to4.5 ka than at present, and pollen concentrations decreased at 4.2,3.6 and 2.5 ka interpreted as cooling temperatures. July tempera-tures have decreased by ~1 �C since 3.2 ka based on a reconstruc-tion using pollen data and the modern analog technique.
On Southampton Island, a chironomid-based August tempera-ture reconstruction from Caribou Lake (Table 2) suggests temper-atures about 2.2 �C warmer than today from 5.5 to 4.4 ka (Rollandet al., 2008). This was followed by progressive cooling; averagetemperatures during the last 1000 years were 1.2 �C lower than
before ~4.4 ka.Using the pollen records discussed above, Gajewski (2015a)
reconstructed maximum July temperatures prior to 8 ka andlowest July temperatures between 3.7 and 1.0 ka (Fig 10). Althoughthe western Canadian Arctic was warmer than present throughmost of the Holocene, July temperatures were closer to the presentday or slightly cooler in the central Canadian Arctic.
4.4.4. Eastern Canadian Arctic (Baffin Island)On the coastal lowlands of northeastern Baffin Island, lakes were
deglaciated prior to the Holocene, permitting reconstruction ofconditions through the entire interglacial. Lake CF8 and CF3(Table 2) record peak Holocene warmth and aquatic productivity~10 to 8 ka (Fig. 11). Chironomid-inferred summer temperatures atboth sites were several degrees higher than those of the late Ho-locene from 10 to 8 ka and then gradually declined over severalmillennia (Briner et al., 2006; Axford et al., 2009, 2011). In thesepoorly buffered lakes, where climate is hypothesized to exert theprimary control on lake water pH by regulating within-lake dis-solved-inorganic-carbon dynamics (Wolfe, 2002), steady declinesin diatom-inferred pH through the Holocene support the temper-ature inferences from chironomids (Michelutti et al., 2007; Wilsonet al., 2012). Pollen from nearby Patricia Bay Lake (Table 2; Kerwinet al., 2004) suggests overall July cooling of ~1 �C between 7.8 and3.2 ka, which is the duration of that record (Kerwin et al., 2004). Theintense summer warmth of the early Holocene on northeast BaffinIsland was likely interrupted by at least two centennial-scale coldperiods, which are inferred from regional glacier advance andchironomid assemblage shifts at Lake CF8. These may correlatewith the Greenland 9.3 ka and 8.2 ka cold events (Axford et al.,2009).
Farther south on Baffin Island, Fr�echette et al. (2006, 2008) usedpollen to reconstruct July temperature from Fog Lake (Table 2;Fig. 11), which reveal a long-term decline of ~1e2 �C through thelast 8000 years with warmest conditions prior to 5e4 ka. Low-resolution midge-based reconstructions from Fog Lake andnearby Brother of Fog Lake support an early-middle Holocene1e2 �C warmer than the late Holocene (Francis et al., 2006). Acomparable cooling trend of ~2e3 �C is inferred at Akavaqiak Lake(Table 1; Fig. 1) where highest July temperatures occurred prior to 5ka (Fr�echette and de Vernal, 2009). Kerwin et al. (2004) recon-structed July temperature trends since 8 ka from six pollen recordson the southern half of Baffin Island using response surfaces andthe modern analog technique. The modern training set used byKerwin et al. (2004) included 275 surface pollen sites from theeastern Canada boreal forest, forest tundra and tundra. Recon-struction results showed that summers warmer than today (þ1to þ2 �C) prevailed prior to 4e3 ka. Finally, Gajewski (2015a)compiled pollen assemblages from nine sites, which includedsites extending earlier than 8.2 ka, and inferred maximum Julytemperatures between ~8.2 and 5.3 ka and cooler temperaturesprior to 8.2 ka (Fig. 10).
4.4.5. West and south GreenlandThis section summarizes lake records from South, Southwest,
West and Northwest Greenland. In the south, there is multi-proxyevidence from multiple sites for overall millennial-scale coolingfrom the early and middle Holocene to late Holocene. At QipisarqoLake (Table 1; Fig. 1), pollen data indicate a sharp increase in July airtemperature of 3e4 �C at 7.5e7.0 ka and higher temperatures until5.5e5.0 ka. After 5 ka, a progressive cooling of 1e2 �C is inferred(Fig. 12; Fr�echette and de Vernal, 2009). Chironomid assemblagesand d18O of chironomid head capsules suggest that the period ofpeak Holocene summer water temperatures began as early as9.0e8.5 ka, and indicate overall summer cooling from the early

Fig. 9. Selected paleoenvironmental records from several lakes in the (a) western and (b) central Canadian Arctic. Black curves are derived from weighted averaging partial leastsquares regression, blue from modern analog technique and red from partial least squares regression. H0 is rarefaction-corrected Shannon-Weiner diversity index. The pHreconstruction is derived using transfer function from Fortin and Gajewski (2009), based on loss-on-ignition and biogenic silica values. Source of data in (a): KR02 (Peros andGajewski, 2008; Fortin and Gajewski, 2010; Podritske and Gajewski, 2007), WB02 (Fortin and Gajewski, 2010), BC01 (Peros et al., 2010). Source of data in (b): JR01 (Zabenskieand Gajewski, 2007; LeBlanc et al., 2004), PW02 (Finklestein and Gajewski, 2008), PW03 (Finkelstein and Gajewski, 2007), PWWL (Gajewski and Frappier, 2001), RS29 andRS36 (Gajewski, 1995).
J.P. Briner et al. / Quaternary Science Reviews 147 (2016) 340e364 353
Holocene to the last millennium of ~2 �C (Fig. 12; Wooller et al.,2004). Sediment organic matter and biogenic silica abundance in-crease from the time of the lake's isolation from the sea at ~9.1 kathrough ~6 ka, with stable, high abundances from ~6 to 3 ka anddeclining abundances after 3 ka (Fig. 12; Kaplan et al., 2002).
Geochemical data from Lake Igaliku (Table 1; Fig. 1) are inter-preted as relatively warm conditions at the time of the lake'sisolation ~9.5 ka, although changes in soil and vegetation cover inthe centuries following emergence complicate interpretations for
the earliest Holocene (Massa et al., 2012). Geochemistry, pollen anddiatoms indicate that relative warmth continued through ~4.8 ka,and coldest conditions are inferred after ~3 ka (Massa et al., 2012).At Lake N14 (Table 1; Figs. 1 and 12), with a basal age of ~14 ka nearthe southern tip of Greenland, Andresen et al. (2004) inferredrelative warmth and climatic stability from ~8 to 5 ka, and a coolerand more variable climate prior to and thereafter.
The millennial-scale Holocene trends discussed above contrastnotably with quantitative temperature inferences from pollen data
Fig. 10. Regional temperature reconstructions based on pollen assemblages from the Canadian Arctic Islands and coastal Greenland (from Gajewski, 2015a). Individual pollenspectra were converted to estimates of July temperature using the Modern Analog Technique, interpolated to 200-yr intervals and averaged. Temperatures are plotted as anomaliesfrom the present day. Temperature reconstructions were calculated in R using the MATTOOLS package (Sawada, 2006) and the Whitmore et al. (2005) modern pollen database.
Fig. 11. Timing of the Holocene thermal maximum (red bars) at lakes on Baffin Island,with sites arranged north to south (left to right). Records that do not extend to theearly Holocene might not encompass the warmest interval. Refer to text for site in-formation and sources.
J.P. Briner et al. / Quaternary Science Reviews 147 (2016) 340e364354
at eight sites from Southwest and South Greenland (Gajewski,2015a) e sites previously studied by Fredskild (1973, 1983) andKelly and Funder (1974). Gajewski (2015a) inferred gradual summerwarming throughout the early and middle Holocene in this region,with highest July temperatures after 4 ka (Fig. 10). Alnus pollen is apartial driver of this trend (Gajewski, 2015a). Holocene trends inAlnus abundance vary significantly across the region, and theinterpretation of Alnus pollen has been debated and remains un-certain (Fredskild, 1973,1983; Kelly and Funder, 1974; Fr�echette andde Vernal, 2009; Massa et al., 2012). However, there are also hintsfrom moraines and marine sediments that Southwest and SouthGreenland may have experienced hetereogeneous Holoceneclimate trends, and/or trends contrasting with the surroundingregion (Seidenkrantz et al., 2007;Winsor et al., 2014), so agreementamong all climate reconstructions in this region is not necessarily
to be expected.The region near Kangerlussuaq (67� 0.60 N, 50� 42.70 W), at the
head of Søndre Strømfjord in Southwest Greenland, boasts thehighest density of paleolimnological studies on Greenland. Therelatively wide expanse of ice-free land there and precipitation leedue to Sukkertoppen Iskappe yields a relatively continental-styleclimate and abundant oligosaline lakes. There are numerous re-constructions of hydroclimate through the middle to late Holocene,including those based upon stable isotopes in lacustrine carbon-ates, geomorphic reconstructions of lake-level change, and diatomassemblages sensitive to lakewater chemistry (e.g., McGowan et al.,2003; Anderson and Leng, 2004; Aebly and Fritz, 2009; Andersonet al., 2012; Perren et al., 2012). Collectively, these records pro-vide strong evidence for greatly reduced effective moisture duringthe early tomiddle Holocene (from deglaciation until ~5 ka or later)relative to the late Holocene (Fig. 12). Additional lacustrine proxiesprovide independent evidence that warmth accompanied thisaridity: A high-resolution alkenone-based quantitative tempera-ture reconstruction that begins ~6.1 ka from Braya Sø (Table 1;Figs. 1 and 11) and nearby Lake E (Table 2) suggests highest tem-peratures ~6.1e5.6 ka, followed by generally cooler but highlyvariable temperatures through the late Holocene (D'Andrea et al.,2011). The presence of an extralimital, thermophilous ostracodein two other Kangerlussuaq-area lakes from 7.2 to 6.3 ka suggeststhose centuries may have been the warmest in the region (Bennike,2000; Bennike et al., 2010). A reconstruction of the North AtlanticOscillation index through the second half of the Holocene fromLake SS1220 (Table 2) hints at changes in atmospheric circulationthat may have accompanied temperature changes in the region(Olsen et al., 2012a). At the outer coast near Susimiut (lakes Sisi12,Sisi14 and Sisi15), the maximum occurrence of statoblasts of thebryozoan Plumatella repens from ~10 to 4.5 ka probably reflects thetransition to cooling ~4.5 ka, which is also indicated by geochemicalproxies from the lake sediments (Bennike and Wagner, 2012).
Paleolimnological data are notably more sparse north of Kan-gerlussuaq. One exception is in West Greenland near Ilulissat,where a ~7000-year-long summer temperature reconstructionfrom chironomids at North Lake (Table 1; Fig. 1) is complementedby paleoenvironmental data from four nearby lakes extending backto 9.7 ka (Axford et al., 2013, Fig.12). These datasets suggest that the

Fig. 12. Timing of the Holocene thermal maximum at lake sites in northwestern, western, southwestern and southern Greenland. Sites are arranged from north to south (left toright). Refer to text for site information and sources.
J.P. Briner et al. / Quaternary Science Reviews 147 (2016) 340e364 355
warmest summers occurred between 6 and 4 ka, with warmer-than-present conditions established by at least 7 ka. All five lakerecords described by Axford et al. (2013) register major transientdecreases in organic-matter content between 4.3 and 3.2 ka,possibly reflecting a connection between West Greenland's climateand the “4.2 ka event” documented elsewhere (e.g., Booth et al.,2005). After 4 ka, chironomid-inferred summer temperatures atNorth Lake declined by an estimated ~4 �C into the coldest cen-turies of the Little Ice Age, followed by a warming of ~2 �C after theLittle Ice Age.
Fredskild (1985) described Holocene trends in pollen assem-blages at three lakes in Northwest Greenland (Langesø, Rundesø,and Qeqertat; Table 2), and noted preservation in the early Holo-cene of two species currently only living farther south. Remains ofthe beetle Colymbetes dolabratus and the stickleback fish Gaster-osteus aculeatus indicate conditions warmer than today and alonger ice-free period ~8.8 and ~7.5 ka, respectively (Fig. 12). In aquantitative analysis of the pollen data from Qeqertat and Langesø,combined with two others from northeastern Greenland andEllesmere Island, Gajewski (2015a) inferred highest July tempera-tures between 7.5 and 5.5 ka, and an overall decline of ~1.5 �C be-tween the early and late Holocene (Fig. 10). Bennike et al. (2008a)described peat deposits from Nordvestø (Table 2), an islandwithin the North Water polynya, which may indicate warmerconditions in the early and middle Holocene compared with thelate Holocene (Fig. 12). Blake et al. (1992) studied sediment fromKap Inglefield Sø (Table 2) and interpreted the sharp decrease insedimentation rate and the reduced abundance of algal Scene-desmus as the presence of a nearly permanent ice cover since 4.5 ka.
4.4.6. East GreenlandEast Greenland is here taken in a broad sense, spanning from
Northeast to Southeast Greenland. All the Holocene lake recordsfrom the region show an early to middle Holocene thermalmaximum. In Northeast Greenland, however, the timing of thethermal maximum is not well constrained. The record from Kaf-feklubben Sø (Table 2) begins 3.5 ka. Diatoms and chrysophystsdisappeared at 2.4 ka, presumably due to cooling (Perren et al.,2012). The record from Bliss Lake (Table 2) covers most of theHolocene, but the low-elevation lake did not become isolated fromthe sea until 7.2 ka. After isolation, geochemical proxies such as d13Cand total organic carbon indicate warmer-than-present conditionsuntil 6.5 ka (Olsen et al., 2012b, Fig. 13). The middle and late Ho-locene were characterized by colder conditions, except for slightly
warmer conditions between 3.3 and 0.9 ka.Pronounced declines in Salix pollen abundance in the sediment
form Klaresø (Table 2) and Sommersø (Table 2) are dated to ~4.6and 4.3 ka (Fig. 12; Fredskild, 1969; Funder and Abrahamsen, 1988).Although both ages are uncertain, they are assumed to reflect theend of the thermal maximum. The thermal maximum from LilleSneha Sø (Table 2) is interpreted to be ~7.7 to 4.4 ka based onmaximum concentrations of chironomids, maximum occurrence ofephippia of the water flea Daphnia pulex, highest organic-mattercontents and lowest mineral input (Wagner and Bennike, 2015).The highest temperatures are around 7 ka, when macrofossils ofSalix arctica achieved maximum concentrations. The transition tocooler conditions began ~5 ka, cooling further intensified between4.1 and 3.5 ka, and the coolest conditions are inferred after ~1.1 ka.At the southern margin of Skallingen, a record from a small lakenear Blåsø confirms the end of the warm part of the Holocenebetween 5 and 4 ka by a decline in macrofossils, organic carbon andcarbonate (Bennike and Weidick, 2001).
Several lakes have been studied farther south, on the island ofStore Koldewey. The records from Duck Lake (Table 2) and HjortLake (Table 1; Fig. 1) indicate the warmest millennia between ~8and 4 ka (Fig. 13; Wagner et al., 2008; Klug et al., 2009a; Schmidtet al., 2011) based on aquatic organisms (chironomids). SedimentfromMelles Lake (Table 2) on the southern part of the island showsan increase of organic-matter accumulation as early as ~10 ka (Kluget al., 2009b), which may mark the earliest onset of Holocenewarmth. This early onset of warmth compared with sites farthernorth is probably due to earlier local deglaciation, and underscoresthe role of deglaciation in controlling when the thermal maximumcan be recorded at a site. The highest concentrations of organicmatter and aquatic mosses are in early to mid-Holocene sediments,and the thermal maximum ended here at ~5.5 ka. From ~4.5 ka,colder climate on the island coincides with increased sea-ice extenton the southeastern Greenland shelf (Jennings et al., 2002).
On Hochstetter Forland, pollen assemblages from Dødis Sø, Pe-ters Bugt Sø, and Ailsa Sø (Table 2) indicate summer temperatureshigher than present between 8.8 and 5.6 ka (Bj€orck and Persson,1981; Bj€orck et al., 1994). Sediment from Germania Havn Sø(Table 2) on Sabine Ø indicates peak warmth at 7.6e6.6 ka (BennikeandWagner, 2012). Germania Havn Sø shows only small changes ingranulometric and geochemical data during the Holocene, whichcan probably be explained by its location at the outer coast and thebuffering effect of the Greenland Sea. However, declining concen-trations ofDryasmacrofossils and caddis flies in the late Holocene is

Fig. 13. Timing of the Holocene thermal maximum (red bar), the peak of the Holocenethermal maximum, decline in pollen records or timing of late Holocene cooling (bluebars) in selected records from north to south in eastern Greenland.
J.P. Briner et al. / Quaternary Science Reviews 147 (2016) 340e364356
probably due to decreasing summer temperatures (Bennike andWagner, 2012). In Boresø (Table 2), peak warmth occurred from8.3 to 7.3 ka, and a further temperature decline is inferred at 5.5 ka(Bennike et al., 2008a, b). The available pollen assemblages fromthis region indicate the warmest conditions between 8 and 5 ka,with temperature below present between 9.2 and 8.5 ka, and mildconditions from 5 ka to the present (Gajewski, 2015a, Fig. 10).
Lake N1 (Table 2) from Ymer Ø shows gradually declining Betulapollen percentages from 5 ka, which is interpreted as a coolingtrend that culminated during the Little Ice Age (Wagner andMelles,2002). In Basaltsø (Table 2), geochemical, pollen and diatom dataindicate that the Holocene thermal maximum spanned from 9 to6.5 ka, somewhat earlier than farther north (Wagner et al., 2000;Cremer et al., 2001). Decreases in several geochemical parametersat 5 ka indicate decreasing temperatures. A similar history is indi-cated by chironomids from a small nearby Lake B1 (Table 2;Wagneret al., 2005). Raffles Sø experienced more or less ice-free conditionsduring the summer from the early Holocene until ~1.8 ka (Cremeret al., 2001). A broad but not very pronounced maximum inBetula nana pollen between 8.5 and 5 ka may originate from windtransported pollen grains from Liverpool Land and may indicatewarmer conditions than today (Wagner and Melles, 2001). In theScoresby Sund region, the thermal maximumwas dated to 8.8 and5.8 ka, with further temperature declines at ~5.2, 4.2 and 3 ka(Funder, 1978).
In the Tasiilaq region, Southeast Greenland, Jakobsen et al.(2008) conclude that maximum warmth occurred from 11.2 to 9.7ka, which is earlier than any other site from Greenland, including
some (e.g., Lake N14) that span this interval; however the in-terpretations are highly uncertain. Peak occurrences of shrub pol-len such as Empetrum, Vaccinium uliginosum and Salix spp. occurredin the middle Holocene, which might represent the Holocenethermal maximum. In the same region, hydrogen isotopes of n-al-kanes in Flower Valley Lake (Table 1; Fig. 1) on Ammassalik Ø havebeen used to infer evaporative enrichment of lake water and indi-cate warmer and/or drier conditions from ~8.4 to 4.1 ka (Balascioet al., 2013). Finally, Balascio et al. (2015) dated the Holocenethermal maximum to the interval 7.8e4.1 ka based on the sedi-mentary sequence from Kulusuk Lake. During this time period, noglacier was present in the catchment of the lake, in contrast to theearly and late Holocene.
4.5. Mountain glacier and ice sheet fluctuations in Canada andGreenland
Mountain glaciers and ice caps in the Canadian Arctic compriseabout one third of the total volume of ice stored in mountain gla-ciers and ice caps globally (Gardner et al., 2011). Alongwith the GrISand the independent glaciers that fringe it, Arctic Canada andGreenland collectively play a key role in the Northern Hemisphere'scontribution to global sea-level change. Documenting the responseof glaciers during periods of past warmth, such as the Holocenethermal maximum, and periods of abrupt climate change, such asthe 8.2 ka event, have been important targets for glacial geologists.The task is challenging, however, due to the fact that much of theregion has cooled throughout the middle and late Holocene,causing glaciers to expand and obscure evidence of their earlierhistories. Nevertheless, scattered records of past glaciationthroughout the Canadian Arctic and Greenland do shed light on thehistory of glacier extent during the Holocene. Because of their largesize (hence overall slow response time) and dynamic behavior, weconsider ice sheets separately from mountain glaciers; we usemountain glacier records as proxies for Holocene climate change.
4.5.1. Mountain glacier fluctuationsMountain glaciers deposited moraines on Baffin Island during
the early Holocene (Miller and Dyke, 1974), although direct agesfrom these moraines are sparse. Dating of marine deltas formed bymeltwater from these advances include ages consistent with boththe Cockburn Substage (~9.5e8.5 ka; Andrews and Ives, 1978) andthe 8.2 ka event (Miller, 1973). Young et al. (2013a) used 10Be datingof moraine boulders on local glacier moraines in northeasternBaffin Island, thought to be equivalent to ice sheet Cockburn mo-raines, and demonstrated that mountain glaciers deposited mo-raines at 8.2 ka (Young et al., 2013a). A number of studies usingcontinuous proglacial lake sequences also reveal evidence forglacier expansion during the early Holocene. Glaciers on southernBaffin Island were present in catchments between 10 and 8 ka(Donard Lake; Miller et al., 2005) and at 8.2 ka (Lake Jake, Table 1;Fig.1; Miller et al., 2005) and on northeastern Baffin Island between10 and 5 ka (Big Round Lake, Table 1; Fig. 1; Thomas et al., 2010).Thus, mountain glaciers in the eastern Canadian Arctic experiencedperiods of advance and stability in the early Holocene, super-imposed on a general trend of overall mass loss and terminusretreat.
Evidence for widespread glacier advances during the late Ho-locene is found throughout the Canadian Arctic, but the majority ofthe chronological studies are from Baffin Island. Mapping ofmoraine sequences and generalized chronologies derived fromlichenometry from the Cumberland Peninsula, Baffin Island (Miller,1973; Davis, 1985), serves as a foundation for late Holocene glacierhistories from Arctic Canada. Glaciers generally approached theirlate-Holocene-maximum dimensions as early as 3.5 to 2.5 ka

J.P. Briner et al. / Quaternary Science Reviews 147 (2016) 340e364 357
(Briner et al., 2009b). Sediment from the proglacial-thresholdDonard Lake (above) reveals glacier expansion ~5 ka, with a sub-sequent expanded state, lengthening again ~2 ka (Miller et al.,2005). Based on populations of radiocarbon ages from ice-killedsurface tundra moss, Miller et al. (2013a) found several periods ofglacier expansion, beginning about 5 ka, and then at various timesbetween 5 and 2 ka, with increasing expansion occurring ~1.6 ka,~1.1 ka, ~0.7 ka and ~0.5 ka (Anderson et al., 2008; Miller et al.,2012, 2013b; Margreth et al., 2014). Based on increasing mineralmatter input at Donard Lake, glacier expansion is interpreted tohave begun ~6 ka and intensified at 2.5 ka (following a period non-glacial period from 8 to 6 ka; Miller et al., 2005). Big Round Lakesediments reveal renewed glacier activity ~2 ka, following a non-glacial period between ~5 and 2 ka (Thomas et al., 2010). Younget al. (2015) dated moraine sequences in two valleys in north-eastern Baffin Island; the ages ranged from 1050 CE through theLittle Ice Age, revealing that glaciers were at their late Holocenemaximum extents throughout the last millennium, with no pro-nounced advance at the onset of the Little Ice Age period.
The history of mountain glacier change through the Holocene inGreenland is not well constrained. Although pre-last-millenniumlocal glacier deposits have been described from around Greenland(Kelly, 1980; Kelly and Lowell, 2009), absolute chronologies existfrom few locations. For example, in the Disko Bugt region, West-Central Greenland, local glacier moraines were deposited at orshortly prior to ~10 ka (Ing�olfsson et al., 1990). Young et al. (2015)dated moraines on Nuussuaq to within the Medieval WarmPeriod, demonstrating that glaciers were at their late Holocenemaximum extents prior to the Little Ice Age period. In NorthGreenland, local glaciers depositedmoraines between 9.6 and 6.3 kaand between 5.5 and 5.0 ka (M€oller et al., 2010). In East Greenland, alocal ice cap attained its late Holocene maximum position 1.6 ka totoday, and during a short-lived episode ~2.6 ka (Levy et al., 2014).Lowell et al. (2013) reconstructed local ice cap history on LiverpoolLand, East Greenland, where glaciers were smaller than presentbetween 11.7 and 0.9 ka. In Southeast Greenland, Balascio et al.(2015) used a continuous record of glacier length from KulusukLake (Table 2) sediments to conclude that local glaciers were in thecatchment until ~9 ka, advanced ~8.2 ka, were then likely absentuntil ~4 ka and subsequently experienced net advance until 1.3 ka,after which glaciers remained extended until the 20th century. Inmany places around Greenland the moraine sequence is similar toelsewhere in the Arctic, where glaciers are fronted by a morainecomplex that is mostly composed of crests dating to the past mil-lennium, but that also contains crests from earlier in the late Ho-locene (e.g., Weidick, 1968; Kelly and Lowell, 2009).
4.5.2. Ice sheet fluctuationsThe Laurentide and Innuitian ice sheets were retreating rapidly
yet still sizable at the onset of the Holocene (Fig. 3). Evidence for icesheet stability and re-advance during the Cockburn Substage wasnoted long ago (Falconer et al., 1965) and is particularly widespreadin fjords and sounds fronting Baffin Bay along eastern Baffin Island(e.g., Andrews and Ives, 1978). The chronology for this period of icesheet fluctuations is generally not well constrained, but an olderphase is dated between 9.8 and 9.4 kawheremoraines are graded tomarine deltas or where till overlies older marine sediments (Millerand Dyke, 1974). In addition, some moraines formed by ice sheetoutlet glaciers and ice-contact marine deltas were deposited coin-cident with the 8.2 ka event (Briner et al., 2009a; Young et al.,2013a). The fact that multiple moraines were deposited between10 and 8 ka implies that at least some sectors of the Laurentide IceSheet experienced positive mass balance sufficient to result in ter-minus advances during the early Holocene. This interval may havebeen wetter than previously and subsequently, and also may have
been interrupted by intervals of cool summers (Young et al., 2013a).The history of the GrIS during the Holocene is based on
numerous studies; here we provide a succinct summary. Generally,the GrIS was retreating in the early Holocene and advanced in thelate Holocene, but the spatial patterns and precise timing icemargin fluctuations provide important information. Like the Lau-rentide Ice Sheet, the GrIS deposited moraines throughout theHolocene, and hence was at least periodically in balance withclimate. Thus, the retreat of the GrIS through the early and middleHolocene (up until at least 6.8 ka, when it retreated to somewherebehind its present margin) was due to an overall warming climatethrough the early and middle Holocene, and was not a laggedresponse of the major Late Pleistocene-to-Holocene warming. Themost prominent Holocene ice sheet moraines in West Greenlandare arguably the multi-crested Fjord Stade moraines. The double-crested Fjord Stade moraines in the Disko Bugt region (e.g.,Weidick, 1968; Long et al., 2006; Weidick and Bennike, 2007) dateto 9.3 and 8.2 ka (e.g., Young et al., 2013b), but it remains debatedwhether or not the entire length of the Fjord Stademoraines date tothese discrete intervals.
West of the Fjord Stade moraines in the Kangerlussuaq region,the GrIS deposited a moraine ~9.9 ka, and deposited moraines at~7.3 and ~6.8 ka to the east of the Fjord Stade moraines (Ten BrinkandWeidick, 1974; Levy et al., 2012; Carlson et al., 2014). Prominentearly Holocene moraines are also widespread in North Greenland(e.g., Kelly and Bennike, 1992). Off Northeast Greenland, end mo-raines indicate that the shelf deglaciated during the late glacial andearly Holocene (Winkelmann et al., 2010). Nioghalvfjerdsfjorden(79� N) was deglaciated between 9.7 and 7.7 ka and becamecovered by a ~65-km-long and 20-km-wide floating outlet glacierafter ~4.5 ka (Bennike and Weidick, 2001). The Storstrømmenglacier to the south was smaller than present from 6 to 1 ka(Weidick et al., 1996).
In the Scoresby Sund region, East Greenland, the GrIS depositedmoraines during the Milne Land stage (Funder, 1978). The morainesrecently have been re-visited and dated precisely, and the innerMilne Land stage moraines are Holocene in age, dating between~11.0 and ~10.5 ka (Hall et al., 2008; Kelly et al., 2008). Followingthe Milne Land stage, the eastern GrIS retreated to within its cur-rent extent, and there is no moraine evidence for subsequentfluctuations in the early or middle Holocene. The other location onGreenland with direct chronology relating to Holocene glaciation isin the south, where the GrIS deposited moraines several kilometersbeyond historical moraines during the Narssarssuaq stade, dated to>1.5 ka (Bennike and Sparrenbom, 2007; Winsor et al., 2014).
TheminimumHolocene extent of the GrIS is best constrained bysediment from proglacial-threshold lakes (e.g., Kaplan et al., 2002;Briner et al., 2010; Larsen et al., 2011, 2015), and from chronologiesof re-worked bivalve shells in late Holocenemoraines (e.g., Weidicket al., 2004; Briner et al., 2014). We update data from Larsen et al.(2015) with additional records more recently published toconstrain the minimum Holocene extent of the GrIS (Fig. 14). Basedon available data, the GrIS probably reached its minimum size be-tween ~5 and 2 ka, although certainly there are regional differencesin the timing of its minimum configuration and subsequentexpansion in the latest Holocene (Fig. 14; Larsen et al., 2015; Youngand Briner, 2015).
5. Synthesis
5.1. What was the millennial-scale pattern of temperature changethrough the Holocene?
The primary outcome of this synthesis is that most records inArctic Canada and Greenland display clear evidence for periods of

J.P. Briner et al. / Quaternary Science Reviews 147 (2016) 340e364358
both warmer-than-present and cooler-than-present conditions atthe millennial timescale during the Holocene. A large proportion ofsites in the Arctic Holocene database (Fig. 4) display a thermalmaximum in the early or middle Holocene, and their lowest tem-peratures in the last millennium, albeit with both spatial andtemporal variability. The pattern seen in the heat maps (Fig. 4)using the time series in the Arctic Holocene database is bolstered bythe more extensive evidence discussed in this paper. For example,Hjort Lake is the only site included in the Arctic Holocene database(v2) from eastern Greenland, but its record of warmth from 8 to 5ka is bolstered by more than a dozen additional records from thatregion that are not in the database (Fig. 13).
The average and standard deviation of the magnitude of tem-perature change between the warmest and coldest portions of the
Fig. 14. Constraints on Greenland Ice Sheet size, arranged from north to south, withSoutheast at the bottom. Greenland Ice Sheet modeled surface area from Larsen et al.(2015). Using sedimentation in proglacial-threshold lakes, horizontal orange barsindicate times when the GrIS was less extensive than today, and blue horizontal barsindicate times when the GrIS margin was more extensive locally (modified from Larsenet al., 2015). Centered-histograms are the number (box height) of dated bivalvesreworked into late Holocene moraines (from Briner et al., 2014). Narrow bars (Weid04)are reworked bivalve ages from Weidick et al. (2004). mel ¼ Mellevlille Bugt;upr ¼ Upernavik Isfjord; jak ¼ Jakobshavn Isfjord (Briner et al., 2014); sec ¼ SecondaryLake; pri ¼ Primary Lake (Briner et al., 2013); new ¼ newspaper Lake (Cronauer et al.,2016); lo ¼ Lake Lo (Håkansson et al., 2014); sol ¼ South Oval Lake; il ¼ Iceboom Lake;mer ¼ Merganser Lake; rav ¼ Raven Lake; goo ¼ Goose Lake; loo ¼ Loon Lake;Et ¼ Eqaluit taserssuat (Briner et al., 2010); kt ¼ Kassuup Tasia; tv ¼ Tininnillik Valley(Kelley et al., 2012); luc ¼ Lake Lucy; spo ¼ Sports Lake (Young and Briner, 2015);Kan01, 09370, fl ¼ Frederikshåb Isblink (Larsen et al., 2015); oip ¼ Qipisarqo Lake(Kaplan et al., 2002); ln ¼ Lower Nordbosø (Larsen et al., 2011); ti ¼ Torqulertivit Imiat(Larsen et al., 2015).
Holocene based on reconstructions calibrated to temperature is3.0 ± 1.0 �C (range of 5 �Ce1.5 �C, n ¼ 11). This value is higher thanthe 1.6 ± 0.8 �C that Kaufman et al. (2004) reported, but their valueincludes sites in the entire Western Hemisphere Arctic, and is thedifference between thermal maximum temperatures and “present”temperatures. The Holocene temperature change in Greenland andthe Canadian Arctic is higher than the ~1e2 �C reported fromNorway (8e4 ka; Bjune et al., 2005), and the �1 �C reported in anupdated synthesis of Holocene records from eastern Beringia(Kaufman et al., 2016).
Although many sites experienced a warmer early or middleHolocene and a cooler late Holocene, overall temperature trendsthrough the Holocene varied significantly between sites (Fig. 4), thegeneral pattern previously documented, albeit with fewer records(e.g., Kaufman et al., 2004; Kaplan and Wolfe, 2006). Only a fewsites exhibit maximum warmth in the earliest millennia of theHolocene when summer insolation was highest in the region (e.g.,Agassiz melt record). Many records lag peak summer insolation andregister maximum warmth sometime between ~9 and 5 ka. How-ever, the lack of earliest Holocene warmth may be related to thepresence of ice sheets. Certainly, lakes located within the footprintof early Holocene ice sheet margins (Fig. 3) would not be able torecord an early Holocene thermal maximum. Furthermore, ice coresites with d18O and borehole temperature records were higher inelevation (colder) in the early Holocene than they are today. Thus inmany areas throughout Arctic Canada and Greenland there issampling bias against an early Holocene thermal maximum, and abias toward a middle Holocene thermal maximum. On the otherhand, lakes (such as Lake N15, southern Greenland, and Lake BC01,western Canadian Arctic) that lie well beyond early Holocene icesheet margins (Fig. 1), do not register maximum warmth until themiddle Holocene. In any case, despite differences in timing ofmaximum warmth between sites in this synthesis, almost all sitesexperienced cooling in the last two millennia.
The heat maps reveal a spatial pattern in the Holocenewarm-to-cool trend. Many records south of 66�N, regardless of archive orproxy type, register a later onset of warmth, a milder thermalmaximum, and a later onset of cooling compared to records fromnorth of 66�N (Fig. 15). This pattern is also prominent in the prin-cipal components analysis (Fig. 5), which shows both early warmthand early onset of cooling (PC1) and middle Holocene warmth(PC2). Thus, PC1 and PC2 may be respectively influenced by thespatial pattern illustrated in Fig. 15. Kaufman et al. (2004), whichalso revealed a later initiation of thermal maximum conditions inthe south versus the higher latitudes within our focus region. Onepossible mechanism for the spatiotemporal temperature patterns isthat sites more heavily influenced by the size and strength of theNorth Atlantic subpolar gyre (e.g., South and West Greenland andLabrador) experience peak warmth later in the Holocene than sitesless influenced by ocean currents (e.g., North Greenland, westernand central Canadian Arctic, mainland Canada) (Rimbu et al., 2003;Thornalley et al., 2013). Gajewski's (2015a) pollen-inferred Julytemperature pattern from southern Greenland, if reliable (see dis-cussion above), supports the observation of maximum warmthafter 4 ka (Fig.10). If the changes in ice core site elevationwere not afactor, there may be a stronger north-to-south gradient in tem-perature trend, with even more sites north of 66�N showing earlierwarmth (Figs. 4 and 15). Of course, difference in the timing ofwarmth registered in all records included in this review mightreflect non-climate-related effects or chronological errors.
Marine sediments reveal a different spatial pattern of temper-ature change than some of the terrestrial records (Fig. 8). A north-south gradient in the timing of maximum warmth is not clearlyevident in the marine records, but this is not surprising given thatocean currents flow meridionally. A notable pattern is earlier

Fig. 15. Composite temperature series from records in the Arctic Holocene database (Sundqvist et al., 2014) subdivided into northern (n ¼ 22) and southern (n ¼ 10) sites in theCanadian Arctic Islands, Greenland, and mainland Canada regions.. The series were standardized to have a mean of zero and variability of ±1 standard deviation (SD) over theinterval of common overlap, back to 6 ka. The composite is sensitive to the diminishing number of records during the early Holocene.
J.P. Briner et al. / Quaternary Science Reviews 147 (2016) 340e364 359
cooling (~7e5 ka) in areas less influenced today by North Atlanticcurrents, particularly the Irminger Current, compared with sitesmore strongly influenced today by the Irminger Current (~4e3 ka;Fig. 8).
The regional expression of the 8.2 ka event was also assessedusing a detection method described in Morrill et al. (2013). The 8.2ka event is characterized by proxy records as an abrupt cooling thatpersisted for 100e150 years, and has been linked to a suddenmeltwater pulse into the North Atlantic (e.g., Hoffman et al., 2012).In the Canadian Islands and Greenland portion of the Arctic Holo-cene database, 27 records passed a criterion of 100-year-averageresolution in the interval 6.7e9.7 ka. Of these, 20 records passed ananomaly test for an 8.2 ka event, illustrating the regional impor-tance and coherency of this event.
5.2. What was the GrIS response to Holocene climate change?
The overall pattern of GrIS change through the Holocene, retreatduring the early and middle Holocene, and advance during the lateHolocene, indicates that the GrIS is in balance with climate onmillennial timescales. Periods of positive GrIS mass balance in theearly Holocene in West Greenland (e.g., during deposition ofmoraine sequences dating between ~10 and ~8 ka) are consistentwith cool, pre-thermal maximum conditions in many re-constructions. Subsequent retreat coincided with peak warmthindicated by sites from around Greenland, but our knowledge of thesize of the GrIS during the middle Holocene is extremely limited.Two recent reviews of GrIS size during the middle Holocenegenerally agreed about when the GrIS retracted to its minimumextent. Larsen et al. (2015) suggested that the GrIS experienced itsHoloceneminimum extent between 6 and 4 ka, whereas Young andBriner (2015) suggested minimum ice extent occurred between 4and 2 ka. If thermal maximum conditions throughout most of theregion took place during the early or middle Holocene, one mightexpect that the GrIS would have been its smallest at the end of thewarm period, or during the transition to cooler conditions. In fact,most lacustrine and reworked marine bivalve records agree on aperiod centered ~4 ka as a GrIS minimum (Fig.13). This is supported
by modeling results shown in Larsen et al. (2014) indicating mini-mum ice volume ~4 ka (Fig. 13). However, the GrIS spans a largearea that almost certainly experienced variable Holocene temper-ature and precipitation histories (cf. Vinther et al., 2009), and thus itmay have experienced different ice margin histories in different icesheet sectors. Although it is still to early to determine whether thepattern of GrIS change mimics temperature changes discussed inthis synthesis, some records shed light on this relation. Forexample, in southern Greenland where some climate re-constructions show a mild and late thermal maximum, Larsen et al.(2011) report minimal retreat of the GrIS during the Holocene.Other records in West Greenland, a region strongly influenced bythe Irminger Current's input to the West Greenland Current, alsopoint to minimum ice extent in the middle and late Holocene(Young and Briner, 2015; Cronauer et al., 2016). Overall, the GrISseems to have been in balance with climate on millennial time-scales during the Holocene, suggesting that whole ice sheetresponse times and dynamic influences on ice margin changeoperate on sub-millennial timescales or shorter.
6. Conclusions
This synthesis of Holocene temperature change in Arctic Canadaand Greenland is based on a recently published compilation ofproxy records (Sundqvist et al., 2014) together with other evidence,including glacier fluctuations, marine IRD, and time series that didnot meet the selection criteria for the Arctic Holocene database.There are too few records at present to make any rigorous analysisof precipitation changes through the Holocene. The spatial patternof Holocene temperature change documented in this review canserve as a target for climate modeling efforts and a guide forlocating data-poor regions and developing new research questions.Such targets for modeling include: (1) the generally earlier periodof maximumwarmth in the far northern sites and a later period ofmaximum warmth farther south, (2) a more subtle temperaturetrend, and perhaps more subdued maximum warmth, at sitesaround South Greenland and the Labrador Sea, (3) differences inthe timing of the warm-to-cool transition related to regions

J.P. Briner et al. / Quaternary Science Reviews 147 (2016) 340e364360
variably influenced by ocean currents, and (4) an overall decrease of~3.0 ± 1.0 �C in the Holocene. One explicit goal of this synthesis is tocompare climate reconstructions with the history of the GrIS. Inthis regard, we find that periods of positive LIS and GrIS massbalance in the early Holocene are consistent with climate re-constructions depicting cool conditions prior to maximum Holo-cenewarmth. Furthermore, it is clear that theminimumGrIS extentwas achieved around the time of transition from warm-to-coolconditions recorded at sites around Greenland, as one mightexpect. However, there are too few studies of GrIS ice margin his-tory to recognize a pattern of change (e.g., north to south) thatmight coincide with the temperature trends identified in thissynthesis.
Acknowledgments
The authors would like to thank all contributors to the ArcticHolocene Transitions project for helpful discussions over the pastseveral years, and the PAGES International Project Office for facili-tating project meetings. Briner acknowledges Charles Porreca forcompiling references. Francus thanks François Lapointe forinformal discussion and acknowledges financial support by theNatural Sciences and Engineering Research Council of Canada.Gajewski acknowledges financial support by the Natural Sciencesand Engineering Research Council of Canada. ARC-1107869 sup-ported McKay's postdoc position during the early stages of thisproject.
References
Abbott, M.B., Stafford Jr., T.W., 1996. Radiocarbon geochemistry of modern andancient arctic Lake systems, baffin island, Canada. Quat. Res. 45 (3), 300e311.http://dx.doi.org/10.1006/qres.1996.0031.
Adams, J.K., Finkelstein, S.A., 2010. Watershed-scale reconstruction of middle andlate Holocene paleoenvironmental changes on Melville Peninsula, Nunavut,Canada. Quat. Sci. Rev. 29 (17e18), 2302e2314. http://dx.doi.org/10.1016/j.quascirev.2010.05.033.
Aebly, F.A., Fritz, S.C., 2009. Palaeohydrology of kangerlussuaq (Søndre strømfjord),west Greenland during the last ~8000 years. Holocene 19 (1), 91e104. http://dx.doi.org/10.1177/0959683608096601.
Alley, R.B., Anandakrishnan, S., 1995. Variations in melt-layer frequency in the GISP2ice core: implications for Holocene summer temperatures in central Greenland.Ann. Glaciol. 21, 64e70.
Alley, R.B., 2000. The Younger Dryas cold interval as viewed from centralGreenland: Quat. Sci. Rev 19 (1e5), 213e226. http://dx.doi.org/10.1016/S0277-3791(99)00062-1.
Anderson, N.J., Brodersen, K.P., Ryves, D.B., McGowan, S., Johansson, L.S.,Jeppesen, E., Leng, M.J., 2008. Climate versus In-Lake processes as controls onthe development of community structure in a low-arctic Lake (South-WestGreenland). Ecosystems 11 (2), 307e324. http://dx.doi.org/10.1007/s10021-007-9123-y.
Anderson, N.J., Leng, M.J., 2004. Increased aridity during the early Holocene in WestGreenland inferred from stable isotopes in laminated-lake sediments. Quat. Sci.Rev. 23 (7e8), 841e849. http://dx.doi.org/10.1016/j.quascirev.2003.06.013.
Anderson, N.J., Liversidge, A.C., McGowan, S., Jones, M.D., 2012. Lake and catchmentresponse to Holocene environmental change: spatial variability along a climategradient in southwest Greenland. J. Paleolimnol. 48 (1), 209e222. http://dx.doi.org/10.1007/s10933-012-9616-3.
Andresen, C.S., Bj€orck, S., Bennike, O., Bond, G., 2004. Holocene climate changes insouthern Greenland: evidence from lake sediments. J. Quat. Sci. 19 (8),783e795. http://dx.doi.org/10.1002/jqs.886.
Andresen, C.S., Hansen, M.J., Seidenkrantz, M.-S., Jennings, A.E., Knudsen, M.F.,Nørgaard-Pedersen, N., Larsen, N.K., Kuijpers, A., Pearce, C., 2013. Mid- to late-Holocene oceanographic variability on the Southeast Greenland shelf. Holocene23 (2), 167e178. http://dx.doi.org/10.1177/0959683612460789.
Andersen, C., Koç, N., Jennings, A., Andrews, J.T., 2004. Nonuniform response of themajor surface currents in the Nordic Seas to insolation forcing: implications forthe Holocene climate variability. Paleoceanography 19 (2), PA2003. http://dx.doi.org/10.1029/2002PA000873.
Andrews, J.T., Ives, J.D., 1978. “Cockburn” nomenclature and the late quaternaryhistory of the eastern Canadian arctic. Arct. Alp. Res. 10 (3), 617e633. http://dx.doi.org/10.2307/1550683.
Andrews, J.E., Riding, R., Dennis, P.F., 1997. The stable isotope record of environ-mental and climatic signals in modern terrestrial microbial carbonates fromEurope. Palaeogeogr. Palaeoclimatol. Palaeoecol. 129 (1e2), 171e189. http://
dx.doi.org/10.1016/S0031-0182(96)00120-4.Antoniades, D., Francus, P., Pienitz, R., St-Onge, G., Vincent, W.F., 2011. Holocene
dynamics of the Arctic's largest ice shelf. Proc. Natl. Acad. Sci. 108 (47),18899e18904. http://dx.doi.org/10.1073/pnas.1106378108.
Atkinson, D.E., Gajewski, K., 2002. High-resolution estimation of summer surface airtemperature in the Canadian arctic archipelago. J. Clim. 15 (24), 3601e3614.http://dx.doi.org/10.1175/1520-0442(2002)015<3601:HREOSS>2.0.CO;2.
Axford, Y., Briner, J.P., Cooke, C.A., Francis, D.R., Michelutti, N., Miller, G.H., Smol, J.P.,Thomas, E.K., Wilson, C.R., Wolfe, A.P., 2009. Recent changes in a remote Arcticlake are unique within the past 200,000 years. Proc. Natl. Acad. Sci. 106 (44),18443e18446.
Axford, Y., Briner, J.P., Francis, D.R., Miller, G.H., Walker, I.R., Wolfe, A.P., 2011. Chi-ronomids record terrestrial temperature changes throughout Arctic in-terglacials of the past 200,000 yr. Geol. Soc. Am. Bull. 123 (7e8), 1275e1287.
Axford, Y., Losee, S., Briner, J.P., Francis, D.R., Langdon, P.G., Walker, I.R., 2013. Ho-locene temperature history at the western Greenland Ice Sheet margin recon-structed from lake sediments. Quat. Sci. Rev. 59 (0), 87e100. http://dx.doi.org/10.1016/j.quascirev.2012.10.024.
Balascio, N.L., D'Andrea, W.J., Bradley, R.S., Perren, B.B., 2013. Biogeochemical evi-dence for hydrologic changes during the Holocene in a lake sediment recordfrom southeast Greenland. Holocene 23 (10), 1428e1439. http://dx.doi.org/10.1177/0959683613493938.
Balascio, N.L., D'Andrea, W.J., Bradley, R.S., 2015. Glacier response to North Atlanticclimate variability during the Holocene. Clim. Past Discuss. 11, 2009e2036.
Bauch, H.A., Mueller-Lupp, T., Taldenkova, E., Spielhagen, R.F., Kassens, H.,Grootes, P.M., Thiede, J., Heinemeier, J., Petryashov, V.V., 2001. Chronology of theholocene transgression at the North Siberian margin. Glob. Planet. Change 31(1e4), 125e139. http://dx.doi.org/10.1016/S0921-8181(01)00116-3.
Belt, S.T., Vare, L.L., Mass�e, G., Manners, H.R., Price, J.C., MacLachlan, S.E.,Andrews, J.T., Schmidt, S., 2010. Striking similarities in temporal changes tospring sea ice occurrence across the central Canadian Arctic Archipelago overthe last 7000 years. Quat. Sci. Rev. 29 (25e26), 3489e3504. http://dx.doi.org/10.1016/j.quascirev.2010.06.041.
Bennike, O., 2000. Palaeoecological studies of Holocene lake sediments from westGreenland. Palaeogeogr. Palaeoclimatol. Palaeoecol. 155 (3e4), 285e304. http://dx.doi.org/10.1016/S0031-0182(99)00121-2.
Bennike, O., 1987. Quaternary geology and biology of the Jørgen Brønlund Fjordarea, North Greenland. Medd. Om. Grønl. Geosci. 18, 1e23.
Bennike, O., Anderson, N.J., McGowan, S., 2010. Holocene palaeoecology of south-west Greenland inferred from macrofossils in sediments of an oligosaline lake.J. Paleolimnol. 43 (4), 787e798. http://dx.doi.org/10.1007/s10933-009-9368-x.
Bennike, O., Goodsite, M., Heinemeier, J., 2008a. Palaeoecology of Holocene peatdeposits from Nordvestø, north-west Greenland. J. Paleolimnol. 40 (1),557e565. http://dx.doi.org/10.1007/s10933-007-9181-3.
Bennike, O., Sørensen, M., Fredskild, B., Jacobsen, B.H., B€ocher, J., Amsinck, S.L.,Jeppesen, E., Andreasen, C., Christiansen, H.H., Humlum, O., 2008b. Late qua-ternary environmental and cultural changes in the Wollaston forland region,northeast Greenland. In: Hans Meltofte, T.R.C., Elberling, Bo,Forchhammer, Mads C., Rasch, Morten (Eds.), Advances in Ecological Research.Academic Press, pp. 45e79.
Bennike, O., Sparrenbom, C.J., 2007. Dating of the Narssarssuaq stade in southernGreenland. Holocene 17 (2), 279e282. http://dx.doi.org/10.1177/0959683607075856.
Bennike, O., Wagner, B., 2012. Deglaciation chronology, sea-level changes andenvironmental changes from Holocene lake sediments of Germania Havn Sø,Sabine Ø, northeast Greenland. Quat. Res. 78 (1), 103e109. http://dx.doi.org/10.1016/j.yqres.2012.03.004.
Bennike, O., Wagner, B., 2013. Holocene range of Mytilus edulis in central EastGreenland. Polar Rec. 49 (03), 291e296. http://dx.doi.org/10.1017/S0032247412000277.
Bennike, O., Weidick, A., 2001. Late quaternary history around Niog-halvfjerdsfjorden and Jøkelbugten, North-East Greenland. Boreas 30 (3),205e227. http://dx.doi.org/10.1111/j.1502-3885.2001.tb01223.x.
Berger, A., Loutre, M.F., 1991. Insolation values for the climate of the last 10 millionyears. Quat. Sci. Rev. 10 (4), 297e317. http://dx.doi.org/10.1016/0277-3791(91)90033-Q.
Bj€orck, S., Persson, T., 1981. Late Weichselian and Flandrian biostratigraphy andchronology from hochstetter forland, northeast Greenland. Medd. Om. Grønl.Geosci. 5, 1e19.
Bj€orck, S., Wohlfarth, B., Bennike, O., Hjort, C., Persson, T., 1994. Revision of the earlyHolocene lake sediment based chronology and event stratigraphy on Hoch-stetter Forland, NE Greenland. Boreas 23 (4), 513e523. http://dx.doi.org/10.1111/j.1502-3885.1994.tb00619.x.
Bjune, A.E., Bakke, J., Nesje, A., Birks, H.J.B., 2005. Holocene mean July temperatureand winter precipitation in western Norway inferred from palynological andglaciological lake-sediment proxies. Holocene 15 (2), 177e189. http://dx.doi.org/10.1191/0959683605hl798rp.
Blake, W.J., Boucherle, M.M., Fredskild, B., Janssens, J.A., Smol, J.P., 1992. Thegeomorphological setting, glacial history and Holocene development of “KapInglefield Sø”, Inglefield Land, North-West Greenland. Meddelelser Om. Grønl.Geosci. (27), 1e42.
Booth, R.K., Jackson, S.T., Forman, S.L., Kutzbach, J.E., Bettis, E.A., Kreigs, J.,Wright, D.K., 2005. A severe centennial-scale drought in midcontinental NorthAmerica 4200 years ago and apparent global linkages. Holocene 15 (3),321e328. http://dx.doi.org/10.1191/0959683605hl825ft.
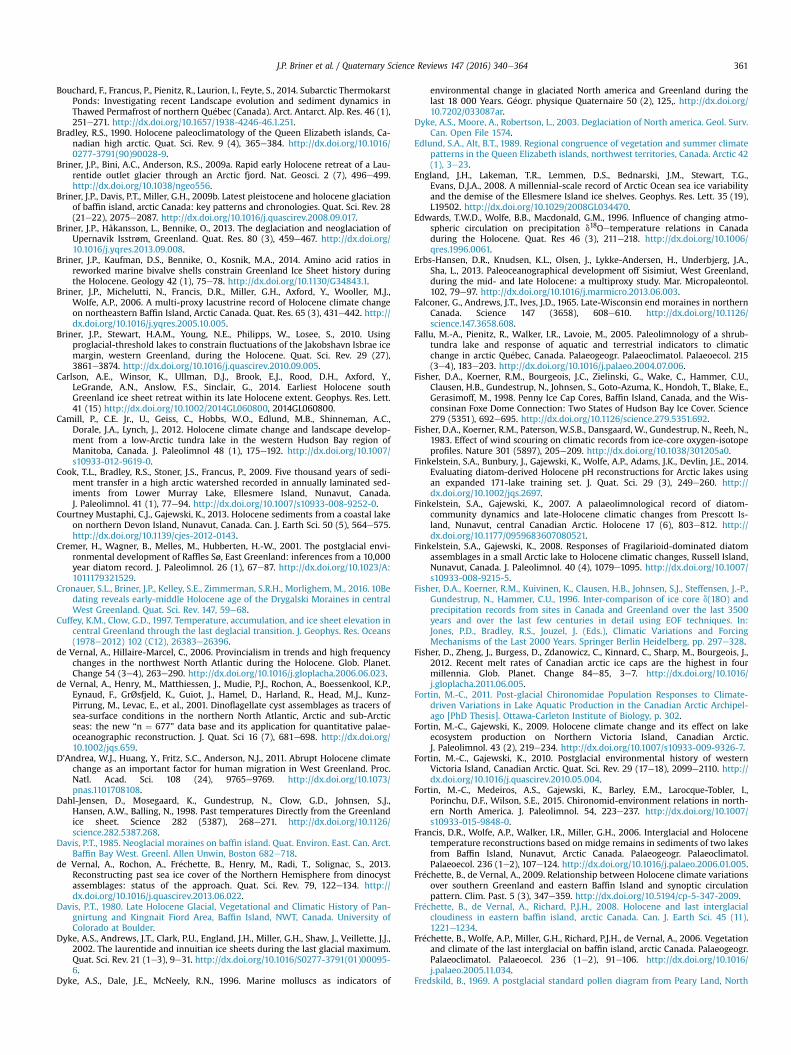
J.P. Briner et al. / Quaternary Science Reviews 147 (2016) 340e364 361
Bouchard, F., Francus, P., Pienitz, R., Laurion, I., Feyte, S., 2014. Subarctic ThermokarstPonds: Investigating recent Landscape evolution and sediment dynamics inThawed Permafrost of northern Qu�ebec (Canada). Arct. Antarct. Alp. Res. 46 (1),251e271. http://dx.doi.org/10.1657/1938-4246-46.1.251.
Bradley, R.S., 1990. Holocene paleoclimatology of the Queen Elizabeth islands, Ca-nadian high arctic. Quat. Sci. Rev. 9 (4), 365e384. http://dx.doi.org/10.1016/0277-3791(90)90028-9.
Briner, J.P., Bini, A.C., Anderson, R.S., 2009a. Rapid early Holocene retreat of a Lau-rentide outlet glacier through an Arctic fjord. Nat. Geosci. 2 (7), 496e499.http://dx.doi.org/10.1038/ngeo556.
Briner, J.P., Davis, P.T., Miller, G.H., 2009b. Latest pleistocene and holocene glaciationof baffin island, arctic Canada: key patterns and chronologies. Quat. Sci. Rev. 28(21e22), 2075e2087. http://dx.doi.org/10.1016/j.quascirev.2008.09.017.
Briner, J.P., Håkansson, L., Bennike, O., 2013. The deglaciation and neoglaciation ofUpernavik Isstrøm, Greenland. Quat. Res. 80 (3), 459e467. http://dx.doi.org/10.1016/j.yqres.2013.09.008.
Briner, J.P., Kaufman, D.S., Bennike, O., Kosnik, M.A., 2014. Amino acid ratios inreworked marine bivalve shells constrain Greenland Ice Sheet history duringthe Holocene. Geology 42 (1), 75e78. http://dx.doi.org/10.1130/G34843.1.
Briner, J.P., Michelutti, N., Francis, D.R., Miller, G.H., Axford, Y., Wooller, M.J.,Wolfe, A.P., 2006. A multi-proxy lacustrine record of Holocene climate changeon northeastern Baffin Island, Arctic Canada. Quat. Res. 65 (3), 431e442. http://dx.doi.org/10.1016/j.yqres.2005.10.005.
Briner, J.P., Stewart, H.A.M., Young, N.E., Philipps, W., Losee, S., 2010. Usingproglacial-threshold lakes to constrain fluctuations of the Jakobshavn Isbrae icemargin, western Greenland, during the Holocene. Quat. Sci. Rev. 29 (27),3861e3874. http://dx.doi.org/10.1016/j.quascirev.2010.09.005.
Carlson, A.E., Winsor, K., Ullman, D.J., Brook, E.J., Rood, D.H., Axford, Y.,LeGrande, A.N., Anslow, F.S., Sinclair, G., 2014. Earliest Holocene southGreenland ice sheet retreat within its late Holocene extent. Geophys. Res. Lett.41 (15) http://dx.doi.org/10.1002/2014GL060800, 2014GL060800.
Camill, P., C.E. Jr., U., Geiss, C., Hobbs, W.O., Edlund, M.B., Shinneman, A.C.,Dorale, J.A., Lynch, J., 2012. Holocene climate change and landscape develop-ment from a low-Arctic tundra lake in the western Hudson Bay region ofManitoba, Canada. J. Paleolimnol 48 (1), 175e192. http://dx.doi.org/10.1007/s10933-012-9619-0.
Cook, T.L., Bradley, R.S., Stoner, J.S., Francus, P., 2009. Five thousand years of sedi-ment transfer in a high arctic watershed recorded in annually laminated sed-iments from Lower Murray Lake, Ellesmere Island, Nunavut, Canada.J. Paleolimnol. 41 (1), 77e94. http://dx.doi.org/10.1007/s10933-008-9252-0.
Courtney Mustaphi, C.J., Gajewski, K., 2013. Holocene sediments from a coastal lakeon northern Devon Island, Nunavut, Canada. Can. J. Earth Sci. 50 (5), 564e575.http://dx.doi.org/10.1139/cjes-2012-0143.
Cremer, H., Wagner, B., Melles, M., Hubberten, H.-W., 2001. The postglacial envi-ronmental development of Raffles Sø, East Greenland: inferences from a 10,000year diatom record. J. Paleolimnol. 26 (1), 67e87. http://dx.doi.org/10.1023/A:1011179321529.
Cronauer, S.L., Briner, J.P., Kelley, S.E., Zimmerman, S.R.H., Morlighem, M., 2016. 10Bedating reveals early-middle Holocene age of the Drygalski Moraines in centralWest Greenland. Quat. Sci. Rev. 147, 59e68.
Cuffey, K.M., Clow, G.D., 1997. Temperature, accumulation, and ice sheet elevation incentral Greenland through the last deglacial transition. J. Geophys. Res. Oceans(1978e2012) 102 (C12), 26383e26396.
de Vernal, A., Hillaire-Marcel, C., 2006. Provincialism in trends and high frequencychanges in the northwest North Atlantic during the Holocene. Glob. Planet.Change 54 (3e4), 263e290. http://dx.doi.org/10.1016/j.gloplacha.2006.06.023.
de Vernal, A., Henry, M., Matthiessen, J., Mudie, P.J., Rochon, A., Boessenkool, K.P.,Eynaud, F., GrØsfjeld, K., Guiot, J., Hamel, D., Harland, R., Head, M.J., Kunz-Pirrung, M., Levac, E., et al., 2001. Dinoflagellate cyst assemblages as tracers ofsea-surface conditions in the northern North Atlantic, Arctic and sub-Arcticseas: the new “n ¼ 677” data base and its application for quantitative palae-oceanographic reconstruction. J. Quat. Sci 16 (7), 681e698. http://dx.doi.org/10.1002/jqs.659.
D'Andrea, W.J., Huang, Y., Fritz, S.C., Anderson, N.J., 2011. Abrupt Holocene climatechange as an important factor for human migration in West Greenland. Proc.Natl. Acad. Sci. 108 (24), 9765e9769. http://dx.doi.org/10.1073/pnas.1101708108.
Dahl-Jensen, D., Mosegaard, K., Gundestrup, N., Clow, G.D., Johnsen, S.J.,Hansen, A.W., Balling, N., 1998. Past temperatures Directly from the Greenlandice sheet. Science 282 (5387), 268e271. http://dx.doi.org/10.1126/science.282.5387.268.
Davis, P.T., 1985. Neoglacial moraines on baffin island. Quat. Environ. East. Can. Arct.Baffin Bay West. Greenl. Allen Unwin, Boston 682e718.
de Vernal, A., Rochon, A., Fr�echette, B., Henry, M., Radi, T., Solignac, S., 2013.Reconstructing past sea ice cover of the Northern Hemisphere from dinocystassemblages: status of the approach. Quat. Sci. Rev. 79, 122e134. http://dx.doi.org/10.1016/j.quascirev.2013.06.022.
Davis, P.T., 1980. Late Holocene Glacial, Vegetational and Climatic History of Pan-gnirtung and Kingnait Fiord Area, Baffin Island, NWT, Canada. University ofColorado at Boulder.
Dyke, A.S., Andrews, J.T., Clark, P.U., England, J.H., Miller, G.H., Shaw, J., Veillette, J.J.,2002. The laurentide and innuitian ice sheets during the last glacial maximum.Quat. Sci. Rev. 21 (1e3), 9e31. http://dx.doi.org/10.1016/S0277-3791(01)00095-6.
Dyke, A.S., Dale, J.E., McNeely, R.N., 1996. Marine molluscs as indicators of
environmental change in glaciated North america and Greenland during thelast 18 000 Years. G�eogr. physique Quaternaire 50 (2), 125,. http://dx.doi.org/10.7202/033087ar.
Dyke, A.S., Moore, A., Robertson, L., 2003. Deglaciation of North america. Geol. Surv.Can. Open File 1574.
Edlund, S.A., Alt, B.T., 1989. Regional congruence of vegetation and summer climatepatterns in the Queen Elizabeth islands, northwest territories, Canada. Arctic 42(1), 3e23.
England, J.H., Lakeman, T.R., Lemmen, D.S., Bednarski, J.M., Stewart, T.G.,Evans, D.J.A., 2008. A millennial-scale record of Arctic Ocean sea ice variabilityand the demise of the Ellesmere Island ice shelves. Geophys. Res. Lett. 35 (19),L19502. http://dx.doi.org/10.1029/2008GL034470.
Edwards, T.W.D., Wolfe, B.B., Macdonald, G.M., 1996. Influence of changing atmo-spheric circulation on precipitation d18Oetemperature relations in Canadaduring the Holocene. Quat. Res 46 (3), 211e218. http://dx.doi.org/10.1006/qres.1996.0061.
Erbs-Hansen, D.R., Knudsen, K.L., Olsen, J., Lykke-Andersen, H., Underbjerg, J.A.,Sha, L., 2013. Paleoceanographical development off Sisimiut, West Greenland,during the mid- and late Holocene: a multiproxy study. Mar. Micropaleontol.102, 79e97. http://dx.doi.org/10.1016/j.marmicro.2013.06.003.
Falconer, G., Andrews, J.T., Ives, J.D., 1965. Late-Wisconsin end moraines in northernCanada. Science 147 (3658), 608e610. http://dx.doi.org/10.1126/science.147.3658.608.
Fallu, M.-A., Pienitz, R., Walker, I.R., Lavoie, M., 2005. Paleolimnology of a shrub-tundra lake and response of aquatic and terrestrial indicators to climaticchange in arctic Qu�ebec, Canada. Palaeogeogr. Palaeoclimatol. Palaeoecol. 215(3e4), 183e203. http://dx.doi.org/10.1016/j.palaeo.2004.07.006.
Fisher, D.A., Koerner, R.M., Bourgeois, J.C., Zielinski, G., Wake, C., Hammer, C.U.,Clausen, H.B., Gundestrup, N., Johnsen, S., Goto-Azuma, K., Hondoh, T., Blake, E.,Gerasimoff, M., 1998. Penny Ice Cap Cores, Baffin Island, Canada, and the Wis-consinan Foxe Dome Connection: Two States of Hudson Bay Ice Cover. Science279 (5351), 692e695. http://dx.doi.org/10.1126/science.279.5351.692.
Fisher, D.A., Koerner, R.M., Paterson, W.S.B., Dansgaard, W., Gundestrup, N., Reeh, N.,1983. Effect of wind scouring on climatic records from ice-core oxygen-isotopeprofiles. Nature 301 (5897), 205e209. http://dx.doi.org/10.1038/301205a0.
Finkelstein, S.A., Bunbury, J., Gajewski, K., Wolfe, A.P., Adams, J.K., Devlin, J.E., 2014.Evaluating diatom-derived Holocene pH reconstructions for Arctic lakes usingan expanded 171-lake training set. J. Quat. Sci. 29 (3), 249e260. http://dx.doi.org/10.1002/jqs.2697.
Finkelstein, S.A., Gajewski, K., 2007. A palaeolimnological record of diatom-community dynamics and late-Holocene climatic changes from Prescott Is-land, Nunavut, central Canadian Arctic. Holocene 17 (6), 803e812. http://dx.doi.org/10.1177/0959683607080521.
Finkelstein, S.A., Gajewski, K., 2008. Responses of Fragilarioid-dominated diatomassemblages in a small Arctic lake to Holocene climatic changes, Russell Island,Nunavut, Canada. J. Paleolimnol. 40 (4), 1079e1095. http://dx.doi.org/10.1007/s10933-008-9215-5.
Fisher, D.A., Koerner, R.M., Kuivinen, K., Clausen, H.B., Johnsen, S.J., Steffensen, J.-P.,Gundestrup, N., Hammer, C.U., 1996. Inter-comparison of ice core d(18O) andprecipitation records from sites in Canada and Greenland over the last 3500years and over the last few centuries in detail using EOF techniques. In:Jones, P.D., Bradley, R.S., Jouzel, J. (Eds.), Climatic Variations and ForcingMechanisms of the Last 2000 Years. Springer Berlin Heidelberg, pp. 297e328.
Fisher, D., Zheng, J., Burgess, D., Zdanowicz, C., Kinnard, C., Sharp, M., Bourgeois, J.,2012. Recent melt rates of Canadian arctic ice caps are the highest in fourmillennia. Glob. Planet. Change 84e85, 3e7. http://dx.doi.org/10.1016/j.gloplacha.2011.06.005.
Fortin, M.-C., 2011. Post-glacial Chironomidae Population Responses to Climate-driven Variations in Lake Aquatic Production in the Canadian Arctic Archipel-ago [PhD Thesis]. Ottawa-Carleton Institute of Biology, p. 302.
Fortin, M.-C., Gajewski, K., 2009. Holocene climate change and its effect on lakeecosystem production on Northern Victoria Island, Canadian Arctic.J. Paleolimnol. 43 (2), 219e234. http://dx.doi.org/10.1007/s10933-009-9326-7.
Fortin, M.-C., Gajewski, K., 2010. Postglacial environmental history of westernVictoria Island, Canadian Arctic. Quat. Sci. Rev. 29 (17e18), 2099e2110. http://dx.doi.org/10.1016/j.quascirev.2010.05.004.
Fortin, M.-C., Medeiros, A.S., Gajewski, K., Barley, E.M., Larocque-Tobler, I.,Porinchu, D.F., Wilson, S.E., 2015. Chironomid-environment relations in north-ern North America. J. Paleolimnol. 54, 223e237. http://dx.doi.org/10.1007/s10933-015-9848-0.
Francis, D.R., Wolfe, A.P., Walker, I.R., Miller, G.H., 2006. Interglacial and Holocenetemperature reconstructions based on midge remains in sediments of two lakesfrom Baffin Island, Nunavut, Arctic Canada. Palaeogeogr. Palaeoclimatol.Palaeoecol. 236 (1e2), 107e124. http://dx.doi.org/10.1016/j.palaeo.2006.01.005.
Fr�echette, B., de Vernal, A., 2009. Relationship between Holocene climate variationsover southern Greenland and eastern Baffin Island and synoptic circulationpattern. Clim. Past. 5 (3), 347e359. http://dx.doi.org/10.5194/cp-5-347-2009.
Fr�echette, B., de Vernal, A., Richard, P.J.H., 2008. Holocene and last interglacialcloudiness in eastern baffin island, arctic Canada. Can. J. Earth Sci. 45 (11),1221e1234.
Fr�echette, B., Wolfe, A.P., Miller, G.H., Richard, P.J.H., de Vernal, A., 2006. Vegetationand climate of the last interglacial on baffin island, arctic Canada. Palaeogeogr.Palaeoclimatol. Palaeoecol. 236 (1e2), 91e106. http://dx.doi.org/10.1016/j.palaeo.2005.11.034.
Fredskild, B., 1969. A postglacial standard pollen diagram from Peary Land, North
J.P. Briner et al. / Quaternary Science Reviews 147 (2016) 340e364362
Greenland. Pollen spores 11, 573e583.Fredskild, B., 1985. Holocene pollen records from west Greenland: quaternary en-
vironments: eastern Canadian arctic, baffin Bay and western Greenland. In:Andrews, J.T. (Ed.), Allen and Unwin, pp. 643e681. Boston.
Fredskild, B., 1973. Studies in the vegetational history of Greenland. Palaeobotanicalinvestigations of some Holocene lake and bog deposits. Meddelelser omGr€onland 198 (4), 1e245.
Fredskild, B., 1983. The Holocene vegetational development of the Godthåbsfjordarea, West Greenland. Medd. Om. Grønl. Geosci. 10, 1e28.
Funder, S.V., 1978. Holocene stratigraphy and vegetation history in the ScoresbySund area, East Greenland. Bull. Grønl. Geol. Unders. 129, 1e66.
Funder, S., Abrahamsen, N., 1988. Palynology in a polar desert, eastern NorthGreenland. Boreas 17 (2), 195e207. http://dx.doi.org/10.1111/j.1502-3885.1988.tb00546.x.
Funder, S., Goosse, H., Jepsen, H., Kaas, E., Kjær, K.H., Korsgaard, N.J., Larsen, N.K.,Linderson, H., Lyså, A., M€oller, P., Olsen, J., Willerslev, E., 2011. A 10,000-Yearrecord of arctic ocean sea-ice VariabilitydView from the Beach. Science 333(6043), 747e750. http://dx.doi.org/10.1126/science.1202760.
Funder, S., Weidick, A., 1991. Holocene boreal molluscs in Greenland d palae-oceanographic implications. Palaeogeogr. Palaeoclimatol. Palaeoecol. 85 (1e2),123e135. http://dx.doi.org/10.1016/0031-0182(91)90029-Q.
Gajewski, K., 1995. Modern and holocene pollen assemblages from some smallarctic lakes on Somerset island, NWT, Canada. Quat. Res. 44 (2), 228e236.http://dx.doi.org/10.1006/qres.1995.1067.
Gajewski, K., 2015a. Quantitative reconstruction of holocene temperatures acrossthe Canadian arctic and Greenland. Glob. Planet. Change 128, 14e23. http://dx.doi.org/10.1016/j.gloplacha.2015.02.003.
Gajewski, K., 2015b. Impact of holocene climate variability on arctic vegetation.Glob. Planet. Change 133, 272e287. http://dx.doi.org/10.1016/j.gloplacha.2015.09.006.
Gajewski, K., Payette, S., Ritchie, J.C., 1993. Holocene vegetation history at theBoreal-ForesteShrub-Tundra transition in North-Western Quebec. J. Ecol 81 (3),433e443. http://dx.doi.org/10.2307/2261522.
Gajewski, K., Atkinson, D.A., 2003. Climatic change in northern Canada. Environ.Rev. 11 (2), 69e102. http://dx.doi.org/10.1139/a03-006.
Gajewski, K., Frappier, M., 2001. A Holocene lacustrine record of environmentalchange in northeastern Prince of Wales Island, Nunavut, Canada. Boreas 30 (4),285e289. http://dx.doi.org/10.1111/j.1502-3885.2001.tb01047.x.
Gajewski, K., Mott, R.J., Ritchie, J.C., Hadden, K., 2000. Holocene vegetation historyof Banks island, northwest territories, Canada. Can. J. Bot. 78 (4), 430e436.http://dx.doi.org/10.1139/b00-018.
Gajewski, K., Peros, M., Finkelstein, S., Fortin, M., 2009. Holocene paleoclimate ofthe Canadian arctic islands: the ACVAST project. Pages Past. Glob. Chang. News17 (1), 11e13.
Gardner, A.S., Moholdt, G., Cogley, J.G., Wouters, B., Arendt, A.A., Wahr, J.,Berthier, E., Hock, R., Pfeffer, W.T., Kaser, G., Ligtenberg, S.R.M., Bolch, T.,Sharp, M.J., Hagen, J.O., et al., 2013. A reconciled estimate of glacier contribu-tions to sea level Rise: 2003 to 2009. Science 340 (6134), 852e857. http://dx.doi.org/10.1126/science.1234532.
Gardner, A.S., Moholdt, G., Wouters, B., Wolken, G.J., Burgess, D.O., Sharp, M.J.,Cogley, J.G., Braun, C., Labine, C., 2011. Sharply increased mass loss from glaciersand ice caps in the Canadian Arctic Archipelago. Nature 473 (7347), 357e360.http://dx.doi.org/10.1038/nature10089.
Gkinis, V., Simonsen, S.B., Buchardt, S.L., White, J.W.C., Vinther, B.M., 2014. Waterisotope diffusion rates from the NorthGRIP ice core for the last 16,000 years eGlaciological and paleoclimatic implications. Earth Planet. Sci. Lett. 405,132e141. http://dx.doi.org/10.1016/j.epsl.2014.08.022.
Håkansson, L., Briner, J.P., Andresen, C.S., Thomas, E.K., Bennike, O., 2014. Slowretreat of a land based sector of the West Greenland Ice Sheet during the Ho-locene Thermal Maximum: evidence from threshold lakes at Paakitsoq. Quat.Sci. Rev. 98, 74e83. http://dx.doi.org/10.1016/j.quascirev.2014.05.016.
Hall, B., Baroni, C., Denton, G., Kelly, M.A., Lowell, T., 2008. Relative sea-level change,Kjove land, scoresby sund, east Greenland: Implications for seasonality inyounger dryas time. Quat. Sci. Rev. 27 (25e26), 2283e2291. http://dx.doi.org/10.1016/j.quascirev.2008.08.001.
Hjort, C., Funder, S., 1974. The subfossil occurrence of Mytilus edulis L. in centralEast Greenland. Boreas 3 (1), 23e33. http://dx.doi.org/10.1111/j.1502-3885.1974.tb00664.x.
Hoffman, J.S., Carlson, A.E., Winsor, K., Klinkhammer, G.P., LeGrande, A.N.,Andrews, J.T., Strasser, J.C., 2012. Linking the 8.2 ka event and its freshwaterforcing in the Labrador Sea. Geophys. Res. Lett. 39, L18703. http://dx.doi.org/10.1029/2012GL053047.
Hyv€arinen, H., 1985. Holocene pollen stratigraphy of Baird Inlet, east-centralEllesmere Island, arctic Canada. Boreas 14 (1), 19e32. http://dx.doi.org/10.1111/j.1502-3885.1985.tb00884.x.
Ing�olfsson, �O., Frich, P., Funder, S., Humlum, O., 1990. Paleoclimatic implications ofan early holocene glacier advance on disko island, west Greenland. Boreas 19(4), 297e311. http://dx.doi.org/10.1111/j.1502-3885.1990.tb00133.x.
Jakobsen, B.H., Fredskild, B., Pedersen, J.B.T., 2008. Holocene changes in climate andvegetation in the Ammassalik area, East Greenland, recorded in lake sedimentsand soil profiles. Dan. J. Geogr. 108 (1), 21e50. http://dx.doi.org/10.1080/00167223.2008.10649573.
Jennings, A., Andrews, J., Pearce, C., Wilson, L., �Olfasd�otttir, S., 2015. Detrital car-bonate peaks on the Labrador shelf, a 13e7 ka template for freshwater forcingfrom the Hudson Strait outlet of the Laurentide Ice Sheet into the subpolar gyre.
Quat. Sci. Rev. 107, 62e80. http://dx.doi.org/10.1016/j.quascirev.2014.10.022.Jennings, A., Andrews, J., Wilson, L., 2011a. Holocene environmental evolution of the
SE Greenland shelf North and south of the Denmark Strait: Irminger and eastGreenland current interactions. Quat. Sci. Rev. 30 (7e8), 980e998. http://dx.doi.org/10.1016/j.quascirev.2011.01.016.
Jennings, A.E., Knudsen, K.L., Hald, M., Hansen, C.V., Andrews, J.T., 2002. A mid-Holocene shift in Arctic sea-ice variability on the East Greenland Shelf. Holo-cene 12 (1), 49e58. http://dx.doi.org/10.1191/0959683602hl519rp.
Jennings, A.E., Sheldon, C., Cronin, T.M., Francus, P., Stoner, J., Andrews, J., 2011b. Theholocene history of nares strait: transition from glacial Bay to Arctic-Atlanticthroughflow. Oceanography 24 (3), 26e41. http://dx.doi.org/10.5670/oceanog.2011.52.
Jennings, A.E., Walton, M.E., �O Cofaigh, C., Kilfeather, A., Andrews, J.T., Ortiz, J.D., DeVernal, A., Dowdeswell, J.A., 2014. Paleoenvironments during younger Dryas-early holocene retreat of the Greenland ice sheet from outer disko trough,central west Greenland. J. Quat. Sci. 29 (1), 27e40. http://dx.doi.org/10.1002/jqs.2652.
Jensen, A.S., 1905. On the Mollusca of East-Greenland: I. Lamellibranchiata. Withand Introduction on Greenland's Fossil Mollusc-fauna from the quaternarytime. Meddelelser Om. Grønl. 29, 287e362.
Kaplan, M.R., Wolfe, A.P., 2006. Spatial and temporal variability of Holocene tem-perature in the North Atlantic region. Quat. Res. 65 (2), 223e231. http://dx.doi.org/10.1016/j.yqres.2005.08.020.
Kaplan, M.R., Wolfe, A.P., Miller, G.H., 2002. Holocene environmental variability insouthern Greenland inferred from Lake sediments. Quat. Res. 58 (2), 149e159.http://dx.doi.org/10.1006/qres.2002.2352.
Kaufman, D.S., Axford, Y.L., Henerson, A., McKay, N.P., Oswald, W.W., Saenger, C.,Anderson, R.S., Bailey, H.L., Clegg, B., Gajewski, K., Hu, F.S., Jones, M.C., Massa, C.,Routson, C.C., Werner, A., Wooller, M.J., Yu, Z., 2016. Holocene climate changesin eastern Beringia (NW North America) e a systemic review of multi-proxyevidence. Quat. Sci. Rev., 147, 312e339. http://dx.doi.org/10.1016/j.quascirev.2015.10.021.
Kaufman, D.S., Ager, T.A., Anderson, N.J., Anderson, P.M., Andrews, J.T., Bartlein, P.J.,Brubaker, L.B., Coats, L.L., Cwynar, L.C., Duvall, M.L., 2004. Holocene thermalmaximum in the western Arctic (0e180 W). Quat. Sci. Rev. 23 (5), 529e560.http://dx.doi.org/10.1016/j.quascirev.2003.09.007.
Kaufman, D.S., Schneider, D.P., McKay, N.P., Ammann, C.M., Bradley, R.S., Briffa, K.R.,Miller, G.H., Otto-Bliesner, B.L., Overpeck, J.T., Vinther, B.M., Arctic Lakes 2kProject Members, Abbott, M., Axford, Y., Bird, B., et al., 2009. Recent warmingReverses long-term arctic cooling. Science 325 (5945), 1236e1239. http://dx.doi.org/10.1126/science.1173983.
Kelley, S.E., Briner, J.P., Young, N.E., Babonis, G.S., Csatho, B., 2012. Maximum lateHolocene extent of the western Greenland Ice Sheet during the late 20thcentury. Quat. Sci. Rev. 56, 89e98. http://dx.doi.org/10.1016/j.quascirev.2012.09.016.
Kelly, M., 1980. The status of the Neoglacial in western Greenland. Rapp. Grønl.Geol. Unders. 64, 1e24.
Kelly, M.R., Bennike, O., 1992. The Quaternary geology of central North Greenland.Rapp. Grønl. Geol. Unders 153, 34e34.
Kelly, M., Funder, S.V., 1974. The pollen stratigraphy of late Quaternary lake sedi-ments of South-West Greenland. Rapp. Grønl. Geol. Unders. 64, 1e26.
Kelly, M.A., Lowell, T.V., 2009. Fluctuations of local glaciers in Greenland duringlatest Pleistocene and Holocene time. Quat. Sci. Rev. 28 (21e22), 2088e2106.http://dx.doi.org/10.1016/j.quascirev.2008.12.008.
Kelly, M.A., Lowell, T.V., Hall, B.L., Schaefer, J.M., Finkel, R.C., Goehring, B.M.,Alley, R.B., Denton, G.H., 2008. A 10Be chronology of lateglacial and Holocenemountain glaciation in the Scoresby Sund region, east Greenland: implicationsfor seasonality during lateglacial time. Quat. Sci. Rev. 27 (25e26), 2273e2282.http://dx.doi.org/10.1016/j.quascirev.2008.08.004.
Kerwin, M.W., Overpeck, J.T., Webb, R.S., Anderson, K.H., 2004. Pollen-based sum-mer temperature reconstructions for the eastern Canadian boreal forest, sub-arctic, and Arctic. Quat. Sci. Rev. 23 (18e19), 1901e1924. http://dx.doi.org/10.1016/j.quascirev.2004.03.013.
Klug, M., Bennike, O., Wagner, B., 2009a. Repeated short-term bioproductivitychanges in a coastal lake on Store Koldewey, northeast Greenland: an indicatorof varying sea-ice coverage? Holocene 19 (4), 653e663. http://dx.doi.org/10.1177/0959683609104040.
Klug, M., Schmidt, S., Bennike, O., Heiri, O., Melles, M., Wagner, B., 2009b. Lakesediments from store Koldewey, northeast Greenland, as archive of late pleis-tocene and holocene climatic and environmental changes. Boreas 38 (1), 59e71.http://dx.doi.org/10.1111/j.1502-3885.2008.00038.x.
Knudsen, K.L., Stabell, B., Seidenkrantz, M.-S., Eiríksson, J., Blake, W., 2008. Deglacialand Holocene conditions in northernmost Baffin Bay: sediments, foraminifera,diatoms and stable isotopes. Boreas 37 (3), 346e376. http://dx.doi.org/10.1111/j.1502-3885.2008.00035.x.
Kobashi, T., Kawamura, K., Severinghaus, J.P., Barnola, J.M., Nakaegawa, T.,Vinther, B.M., Johnsen, S.J., Box, J.E., 2011. High variability of Greenland surfacetemperature over the past 4000 years estimated from trapped air in an ice core.Geophys. Res. Lett. 38 (21), L21501.
Kobashi, T., Severinghaus, J.P., Brook, E.J., Barnola, J.M., Grachev, A.M., 2007. Precisetiming and characterization of abrupt climate change 8200 years ago from airtrapped in polar ice. Quat. Sci. Rev. 26 (9e10), 1212e1222. http://dx.doi.org/10.1016/j.quascirev.2007.01.009.
Larsen, N.K., Funder, S., Kjær, K.H., Kjeldsen, K.K., Knudsen, M.F., Linge, H., 2014.Rapid early Holocene ice retreat in West Greenland. Quat. Sci. Rev. 92, 310e323.

J.P. Briner et al. / Quaternary Science Reviews 147 (2016) 340e364 363
http://dx.doi.org/10.1016/j.quascirev.2013.05.027.Larsen, N.K., Kjaer, K.H., Olsen, J., Funder, S., Kjeldsen, K.K., Nørgaard-Pedersen, N.,
2011. Restricted impact of Holocene climate variations on the southernGreenland Ice Sheet. Quat. Sci. Rev. 30, 3171e3180. http://dx.doi.org/10.1016/j.quascirev.2011.07.022.
Larsen, N.K., Kjær, K.H., Lecavalier, B., Bjørk, A.A., Colding, S., Huybrechts, P.,Jakobsen, K.E., Kjeldsen, K.K., Knudsen, K.-L., Odgaard, B.V., Olsen, J., 2015. Theresponse of the southern Greenland ice sheet to the Holocene thermalmaximum. Geology 43 (4), 291e294. http://dx.doi.org/10.1130/G36476.1.
LeBlanc, M., Gajewski, K., Hamilton, P.B., 2004. A diatom-based Holocene palae-oenvironmental record from a mid-arctic lake on Boothia Peninsula, Nunavut,Canada. Holocene 14 (3), 417e425. http://dx.doi.org/10.1191/0959683604hl717rp.
Lecavalier, B.S., Milne, G.A., Vinther, B.M., Fisher, D.A., Dyke, A.S., Simpson, M.J.R.,2013. Revised estimates of Greenland ice sheet thinning histories based on ice-core records. Quat. Sci. Rev. 63, 73e82. http://dx.doi.org/10.1016/j.quascirev.2012.11.030.
Ledu, D., Rochon, A., de Vernal, A., Barletta, F., St-Onge, G., 2010a. Holocene sea icehistory and climate variability along the main axis of the Northwest Passage,Canadian Arctic. Paleoceanography 25 (2), PA2213. http://dx.doi.org/10.1029/2009PA001817.
Ledu, D., Rochon, A., de Vernal, A., St-Onge, G., 2010b. Holocene paleoceanographyof the northwest passage, Canadian Arctic Archipelago. Quat. Sci. Rev. 29(25e26), 3468e3488. http://dx.doi.org/10.1016/j.quascirev.2010.06.018.
Ledu, D., Rochon, A., de Vernal, A., St-Onge, G., 2008. Palynological evidence ofHolocene climate change in the eastern Arctic: a possible shift in the Arcticoscillation at the millennial time scaleThis article is one of a series of paperspublished in this Special Issue on the theme Polar Climate Stability Network.Can. J. Earth Sci. 45 (11), 1363e1375. http://dx.doi.org/10.1139/E08-043.
Levac, E., Vernal, A.D., Blake Jr., W., 2001. Sea-surface conditions in northernmostBaffin Bay during the Holocene: palynological evidence. J. Quat. Sci. 16 (no. 4),353e363. http://dx.doi.org/10.1002/jqs.614.
Levy, L.B., Kelly, M.A., Howley, J.A., Virginia, R.A., 2012. Age of the Ørkendalenmoraines, Kangerlussuaq, Greenland: constraints on the extent of the south-western margin of the Greenland Ice Sheet during the Holocene. Quat. Sci. Rev.52, 1e5. http://dx.doi.org/10.1016/j.quascirev.2012.07.021.
Levy, L.B., Kelly, M.A., Lowell, T.V., Hall, B.L., Hempel, L.A., Honsaker, W.M.,Lusas, A.R., Howley, J.A., Axford, Y.L., 2014. Holocene fluctuations of Bregne icecap, Scoresby Sund, east Greenland: a proxy for climate along the Greenland IceSheet margin. Quat. Sci. Rev. 92, 357e368. http://dx.doi.org/10.1016/j.quascirev.2013.06.024.
Lloyd, J.M., Kuijpers, A., Long, A., Moros, M., Park, L.A., 2007. Foraminiferal recon-struction of mid- to late-Holocene ocean circulation and climate variability inDisko Bugt, West Greenland. Holocene 17 (8), 1079e1091. http://dx.doi.org/10.1177/0959683607082548.
Long, A.J., Roberts, D.H., Dawson, S., 2006. Early holocene history of the westGreenland ice sheet and the GH-8.2 event. Quat. Sci. Rev. 25 (9e10), 904e922.http://dx.doi.org/10.1016/j.quascirev.2005.07.002.
Lowell, T.V., Hall, B.L., Kelly, M.A., Bennike, O., Lusas, A.R., Honsaker, W., Smith, C.A.,Levy, L.B., Travis, S., Denton, G.H., 2013. Late Holocene expansion of Istorvet icecap, Liverpool Land, east Greenland. Quat. Sci. Rev. 63, 128e140. http://dx.doi.org/10.1016/j.quascirev.2012.11.012.
Margreth, A., Dyke, A.S., Gosse, J.C., Telka, A.M., 2014. Neoglacial ice expansion andlate Holocene cold-based ice cap dynamics on Cumberland Peninsula, BaffinIsland, Arctic Canada. Quat. Sci. Rev. 91, 242e256. http://dx.doi.org/10.1016/j.quascirev.2014.02.005.
Massa, C., Perren, B.B., Gauthier, �E., Bichet, V., Petit, C., Richard, H., 2012.A multiproxy evaluation of Holocene environmental change from Lake Igaliku,South Greenland. J. Paleolimnol. 48 (1), 241e258. http://dx.doi.org/10.1007/s10933-012-9594-5.
Masson-Delmotte, V., Jouzel, J., Landais, A., Stievenard, M., Johnsen, S.J.,White, J.W.C., Werner, M., Sveinbjornsdottir, A., Fuhrer, K., 2005. GRIP Deute-rium excess reveals rapid and orbital-scale changes in Greenland moistureorigin. Science 309 (5731), 118e121. http://dx.doi.org/10.1126/science.1108575.
MacDonald, G.M., Edwards, T.W.D., Moser, K.A., Pienitz, R., Smol, J.P., 1993. Rapidresponse of treeline vegetation and lakes to past climate warming. Nature 361(6409), 243e246. http://dx.doi.org/10.1038/361243a0.
McGowan, S.M., Ryves, D.B., Anderson, N.J., 2003. Holocene records of effectiveprecipitation in West Greenland. Holocene 13 (2), 239e249. http://dx.doi.org/10.1191/0959683603hl610rp.
Michelutti, N., Wolfe, A.P., Briner, J.P., Miller, G.H., 2007. Climatically controlledchemical and biological development in Arctic lakes. J. Geophys. Res. Bio-geosciences 112 (G3), G03002. http://dx.doi.org/10.1029/2006JG000396.
Miller, G.H., 1973. Late Quaternary glacial and climatic history of northern Cum-berland Peninsula, Baffin Island, N.W.T., Canada. Quat. Res. 3 (4), 561e583.http://dx.doi.org/10.1016/0033-5894(73)90031-8.
Miller, G.H., Briner, J.P., Refsnider, K.A., Lehman, S.J., Geirsd�ottir, �A., Larsen, D.J.,Southon, J.R., 2013a. Substantial agreement on the timing and magnitude ofLate Holocene ice cap expansion between East Greenland and the Eastern Ca-nadian Arctic: a commentary on Lowell et al., 2013. Quat. Sci. Rev. 77, 239e245.http://dx.doi.org/10.1016/j.quascirev.2013.04.019.
Miller, G.H., Dyke, A.S., 1974. Proposed extent of late Wisconsin laurentide ice oneastern baffin island. Geology 2 (3), 125e130. http://dx.doi.org/10.1130/0091-7613(1974)2<125:PEOLWL>2.0.CO;2.
Miller, G.H., Geirsd�ottir, �A., Zhong, Y., Larsen, D.J., Otto-Bliesner, B.L., Holland, M.M.,
Bailey, D.A., Refsnider, K.A., Lehman, S.J., Southon, J.R., Anderson, C.,Bj€ornsson, H., Thordarson, T., 2012. Abrupt onset of the Little Ice Age triggeredby volcanism and sustained by sea-ice/ocean feedbacks. Geophys. Res. Lett. 39(2), L02708. http://dx.doi.org/10.1029/2011GL050168.
Miller, G.H., Lehman, S.J., Refsnider, K.A., Southon, J.R., Zhong, Y., 2013b. Unprece-dented recent summer warmth in Arctic Canada. Geophys. Res. Lett. 40 (21)http://dx.doi.org/10.1002/2013GL057188, 2013GL057188.
Miller, G.H., Wolfe, A.P., Briner, J.P., Sauer, P.E., Nesje, A., 2005. Holocene glaciationand climate evolution of baffin island, arctic Canada. Quat. Sci. Rev. 24 (14e15),1703e1721. http://dx.doi.org/10.1016/j.quascirev.2004.06.021.
M€oller, P., Larsen, N.K., Kjær, K.H., Funder, S., Schomacker, A., Linge, H., Fabel, D.,2010. Early to middle Holocene valley glaciations on northernmost Greenland.Quat. Sci. Rev. 29 (25e26), 3379e3398. http://dx.doi.org/10.1016/j.quascirev.2010.06.044.
Moros, M., Jensen, K.G., Kuijpers, A., 2006. Mid-to late-Holocene hydrological andclimatic variability in Disko Bugt, central West Greenland. Holocene 16 (3),357e367. http://dx.doi.org/10.1191/0959683606hl933rp.
Morrill, C., LeGrande, A.N., Renssen, H., Bakker, P., Otto-Bliesner, B.L., 2013. Modelsensitivity to North Atlantic fresh-water forcing at 8.2 ka. Clim. Past 9, 955e968.http://dx.doi.org/10.5194/cp-9-955-2013.
Müller, J., Werner, K., Stein, R., Fahl, K., Moros, M., Jansen, E., 2012. Holocene coolingculminates in sea ice oscillations in Fram Strait. Quat. Sci. Rev. 47, 1e14. http://dx.doi.org/10.1016/j.quascirev.2012.04.024.
Nathorst, A.G., 1901. Bidrag til nord€ostra Gr€onlands geologi. Geol. Foren. i Stockh.F€orhandlingar 23, 275e306.
NorthGrip Project Members, Andersen, K.K., Azuma, N., Barnola, J.-M., Bigler, M.,Biscaye, P., Caillon, N., Chappellaz, J., Clausen, H.B., Dahl-Jensen, D., Fischer, H.,Flückiger, J., Fritzsche, D., Fujii, Y., Goto-Azuma, K., et al., 2004. High-resolutionrecord of Northern Hemisphere climate extending into the last interglacialperiod. Nature 431 (7005), 147e151. http://dx.doi.org/10.1038/nature02805.
Nørgaard-Pedersen, N., Mikkelsen, N., 2009. 8000 year marine record of climatevariability and fjord dynamics from Southern Greenland. Mar. Geol. 264 (3e4),177e189. http://dx.doi.org/10.1016/j.margeo.2009.05.004.
Nichols, H., 1975. Palynological and Paleoclimatic Study of the Late QuaternaryDisplacements of the Boreal Forest-Tundra Ecotone in Keewatin and Mackenzie.N.W.T., Canada: INSTAAR Occasional Paper 15, 87.
�O Cofaigh, C., England, J., Zreda, M., 2000. Late Wisconsinan glaciation of southernEureka sound: evidence for extensive innuitian ice in the Canadian high arcticduring the last glacial maximum. Quat. Sci. Rev. 19 (13), 1319e1341. http://dx.doi.org/10.1016/S0277-3791(99)00104-3.
Olsen, J., Anderson, N.J., Knudsen, M.F., 2012a. Variability of the North AtlanticOscillation over the past 5,200 years. Nat. Geosci. 5 (11), 808e812. http://dx.doi.org/10.1038/ngeo1589.
Olsen, J., Kjær, K.H., Funder, S., Larsen, N.K., Ludikova, A., 2012b. High-Arctic climateconditions for the last 7000 years inferred frommulti-proxy analysis of the BlissLake record, North Greenland. J. Quat. Sci. 27 (3), 318e327. http://dx.doi.org/10.1002/jqs.1548.
Ouellet-Bernier, M.-M., Vernal, A., de, Hillaire-Marcel, C., Moros, M., 2014. Paleo-ceanographic changes in the disko bugt area, west Greenland, during. Holocene.http://dx.doi.org/10.1177/0959683614544060, 0959683614544060.
Perner, K., Moros, M., Jennings, A., Lloyd, J.M., Knudsen, K.L., 2012. Holocenepalaeoceanographic evolution off West Greenland. Holocene. http://dx.doi.org/10.1177/0959683612460785, 0959683612460785.
Peros, M.C., Gajewski, K., 2008. Holocene climate and vegetation change on VictoriaIsland, western Canadian Arctic. Quat. Sci. Rev. 27 (3e4), 235e249. http://dx.doi.org/10.1016/j.quascirev.2007.09.002.
Peros, M., Gajewski, K., Paull, T., Ravindra, R., Podritske, B., 2010. Multi-proxy recordof postglacial environmental change, south-central Melville Island, NorthwestTerritories, Canada. Quat. Res. 73 (2), 247e258. http://dx.doi.org/10.1016/j.yqres.2009.11.010.
Perren, B.B., Wolfe, A.P., Cooke, C.A., Kjær, K.H., Mazzucchi, D., Steig, E.J., 2012.Twentieth-century warming revives the world's northernmost lake. Geology 40(11), 1003e1006. http://dx.doi.org/10.1130/G33621.1.
Pie�nkowski, A.J., England, J.H., Furze, M.F.A., Marret, F., Eynaud, F., Vilks, G.,Maclean, B., Blasco, S., Scourse, J.D., 2012. The deglacial to postglacial marineenvironments of SEBarrow Strait, Canadian Arctic Archipelago. Boreas 41 (2),141e179. http://dx.doi.org/10.1111/j.1502-3885.2011.00227.x.
Podritske, B., Gajewski, K., 2007. Diatom community response to multiple scales ofHolocene climate variability in a small lake on Victoria Island, NWT, Canada.Quat. Sci. Rev. 26 (25e28), 3179e3196. http://dx.doi.org/10.1016/j.quascirev.2007.06.009.
Renssen, H., Sepp€a, H., Heiri, O., Roche, D.M., Goosse, H., Fichefet, T., 2009. Thespatial and temporal complexity of the Holocene thermal maximum. Nat.Geosci. 2 (6), 411e414. http://dx.doi.org/10.1038/ngeo513.
Rimbu, N., Lohmann, G., Kim, J.-H., Arz, H.W., Schneider, R., 2003. Arctic/NorthAtlantic Oscillation signature in Holocene sea surface temperature trends asobtained from alkenone data. Geophys. Res. Lett. 30 (6), 1280. http://dx.doi.org/10.1029/2002GL016570.
Rolland, N., Larocque, I., Francus, P., Pienitz, R., Laperri�ere, L., 2008. Holocene climateinferred from biological (Diptera: Chironomidae) analyses in a SouthamptonIsland (Nunavut, Canada) lake. Holocene 18 (2), 229e241. http://dx.doi.org/10.1177/0959683607086761.
Sawada, M., 2006. An open source implementation of the Modern Analog Tech-nique (MAT) within the R computing environment. Comput. Geosciences 32 (6),818e833. http://dx.doi.org/10.1016/j.cageo.2005.10.008.

J.P. Briner et al. / Quaternary Science Reviews 147 (2016) 340e364364
Schmidt, S., Wagner, B., Heiri, O., Klug, M., Bennike, O., Melles, M., 2011. Chirono-mids as indicators of the Holocene climatic and environmental history of twolakes in Northeast Greenland. Boreas 40 (1), 116e130. http://dx.doi.org/10.1111/j.1502-3885.2010.00173.x.
Seidenkrantz, M.-S., Aagaard-Sørensen, S., Sulsbrück, H., Kuijpers, A., Jensen, K.G.,Kunzendorf, H., 2007. Hydrography and climate of the last 4400 years in a SWGreenland fjord: implications for Labrador Sea palaeoceanography. Holocene 17(3), 387e401. http://dx.doi.org/10.1177/0959683607075840.
Seidenkrantz, M.-S., Roncaglia, L., Fischel, A., Heilmann-Clausen, C., Kuijpers, A.,Moros, M., 2008. Variable North Atlantic climate seesaw patterns documentedby a late Holocene marine record from Disko Bugt, West Greenland. Mar.Micropaleontol. 68 (1e2), 66e83. http://dx.doi.org/10.1016/j.marmicro.2008.01.006.
Sha, L., Jiang, H., Seidenkrantz, M.-S., Knudsen, K.L., Olsen, J., Kuijpers, A., Liu, Y.,2014. A diatom-based sea-ice reconstruction for the Vaigat Strait (Disko Bugt,West Greenland) over the last 5000 yr. Palaeogeogr. Palaeoclimatol. Palaeoecol.403, 66e79. http://dx.doi.org/10.1016/j.palaeo.2014.03.028.
Shanahan, T.M., Hughen, K.A., Ampel, L., Sauer, P.E., Fornace, K., 2013. Environ-mental controls on the 2H/1H values of terrestrial leaf waxes in the easternCanadian Arctic. Geochimica Cosmochimica Acta 119, 286e301. http://dx.doi.org/10.1016/j.gca.2013.05.032.
Smith, I.R., 2002. Diatom-based Holocene paleoenvironmental records from conti-nental sites on northeastern Ellesmere Island, high Arctic, Canada.J. Paleolimnol. 27 (1), 9e28. http://dx.doi.org/10.1023/A:1013514305420.
Solignac, S., Giraudeau, J., de Vernal, A., 2006. Holocene sea surface conditions inthe western North Atlantic: spatial and temporal heterogeneities. Paleo-ceanography 21 (2), PA2004. http://dx.doi.org/10.1029/2005PA001175.
Sundqvist, H.S., Kaufman, D.S., McKay, N.P., Balascio, N.L., Briner, J.P., Cwynar, L.C.,Sejrup, H.P., Sepp€a, H., Subetto, D.A., Andrews, J.T., Axford, Y., Bakke, J.,Birks, H.J.B., Brooks, S.J., et al., 2014. Arctic Holocene proxy climate database e
new approaches to assessing geochronological accuracy and encoding climatevariables. Clim. Past. 10 (4), 1605e1631. http://dx.doi.org/10.5194/cp-10-1605-2014.
Ten Brink, N.W., Weidick, A., 1974. Greenland ice sheet history since the lastglaciation. Quat. Res. 4 (4), 429e440. http://dx.doi.org/10.1016/0033-5894(74)90038-6.
Thomas, E.K., Szymanski, J., Briner, J.P., 2010. Holocene alpine glaciation inferredfrom lacustrine sediments on northeastern Baffin Island, Arctic Canada. J. Quat.Sci. 25 (2), 146e161. http://dx.doi.org/10.1002/jqs.1286.
Thornalley, D.J.R., Blaschek, M., Davies, F.J., Praetorius, S., Oppo, D.W., McManus, J.F.,Hall, I.R., Kleiven, H., Renssen, H., McCave, I.N., 2013. Long-term variations inIcelandeScotland overflow strength during the Holocene. Clim. Past 9 (5),2073e2084. http://dx.doi.org/10.5194/cp-9-2073-2013.
Tillman, K.P., Holzk€amper, S., Kuhry, P., Sannel, A.B.K., Loader, N.J., Robertson, I.,2010. Long-term climate variability in continental subarctic Canada: a 6200-year record derived from stable isotopes in peat. Palaeogeography, Palae-oclimatology. Palaeoecology 298 (3e4), 235e246. http://dx.doi.org/10.1016/j.palaeo.2010.09.029.
Tipping, M.E., Bishop, C.M., 1999. Probabilistic principal component analysis. J. R.Stat. Soc. Ser. B Stat. Methodol. 61 (3), 611e622.
Vare, L.L., Mass�e, G., Gregory, T.R., Smart, C.W., Belt, S.T., 2009. Sea ice variations inthe central Canadian arctic archipelago during the holocene. Quat. Sci. Rev. 28(13e14), 1354e1366. http://dx.doi.org/10.1016/j.quascirev.2009.01.013.
Vinther, B.M., Buchardt, S.L., Clausen, H.B., Dahl-Jensen, D., Johnsen, S.J., Fisher, D.A.,Koerner, R.M., Raynaud, D., Lipenkov, V., Andersen, K.K., Blunier, T.,Rasmussen, S.O., Steffensen, J.P., Svensson, A.M., 2009. Holocene thinning of theGreenland ice sheet. Nature 461 (7262), 385e388. http://dx.doi.org/10.1038/nature08355.
Viau, A.E., Gajewski, K., 2009. Reconstructing Millennial-Scale, Regional Paleo-climates of Boreal Canada during the Holocene. J. Clim 22 (2), 316e330. http://dx.doi.org/10.1175/2008JCLI2342.1.
Vinther, B.M., Clausen, H.B., Johnsen, S.J., Rasmussen, S.O., Andersen, K.K.,Buchardt, S.L., Dahl-Jensen, D., Seierstad, I.K., Siggaard-Andersen, M.-L.,Steffensen, J.P., Svensson, A., Olsen, J., Heinemeier, J., 2006. A synchronizeddating of three Greenland ice cores throughout the Holocene. J. Geophys. Res.Atmos 111 (D13), D13102. http://dx.doi.org/10.1029/2005JD006921.
Wagner, B., Melles, M., 2001. A Holocene seabird record from Raffles Sø sediments,East Greenland, in response to climatic and oceanic changes. Boreas 30 (3),228e239. http://dx.doi.org/10.1111/j.1502-3885.2001.tb01224.x.
Wagner, B., Melles, M., 2002. Holocene environmental history of western Ymer Ø,East Greenland, inferred from lake sediments. Quat. Int. 89 (1), 165e176. http://dx.doi.org/10.1016/S1040-6182(01)00087-8.
Wagner, B., Bennike, O., 2012. Chronology of the last deglaciation and Holoceneenvironmental changes in the Sisimiut area, SW Greenland based on lacustrinerecords. Boreas 41, 481e493. http://dx.doi.org/10.1111/j.1502-3885.2011.00245.x.
Wagner, B., Bennike, O., 2015. Holocene environmental change in the Skallingen
area, eastern North Greenland, based on a lacustrine record. Boreas 44 (1),45e59. http://dx.doi.org/10.1111/bor.12085.
Wagner, B., Melles, M., Hahne, J., Niessen, F., Hubberten, H.-W., 2000. Holoceneclimate history of Geographical Society Ø, East Greenlandd evidence from lakesediments. Palaeogeogr. Palaeoclimatol. Palaeoecol. 160 (1e2), 45e68. http://dx.doi.org/10.1016/S0031-0182(00)00046-8.
Wagner, B., Heiri, O., Hoyer, D., 2005. Chironomids as proxies for palae-oenvironmental changes in east Greenland: a holocene record fromGeographical society Ø. Z. Dtsch. Ges. für Geowiss. 156 (4), 543e556. http://dx.doi.org/10.1127/1860-1804/2005/0156-0543.
Wagner, B., Bennike, O., Bos, J.A.A., Cremer, H., Lotter, A.F., Melles, M., 2008.A multidisciplinary study of holocene sediment records from hjort sø on storeKoldewey, northeast Greenland. J. Paleolimnol. 39 (3), 381e398. http://dx.doi.org/10.1007/s10933-007-9120-3.
Weidick, A., 1968. Observations on some Holocene glacier fluctuations in WestGreenland. Medd. Om. Grønl. 165 (6), 1e202.
Weidick, A., Andreasen, C., Oerter, H., Reeh, N., 1996. Neoglacial glacier changesaround Storstrommen, North-East Greenland. Polarforschung 64 (3), 95e108.
Weidick, A., Bennike, O., 2007. Quaternary glaciation history and glaciology ofjakobshavn Isbræ and the disko bugt region, west Greenland: a review. Geol.Surv. Den. Greenl. Bull. 14 (1e78).
Weidick, A., Kelly, M., Bennike, O., 2004. Late Quaternary development of thesouthern sector of the Greenland Ice Sheet, with particular reference to theQassimiut lobe. Boreas 33 (4), 284e299. http://dx.doi.org/10.1111/j.1502-3885.2004.tb01242.x.
Werner, K., Spielhagen, R.F., Bauch, D., Hass, H.C., Kandiano, E., 2013. Atlantic Wateradvection versus sea-ice advances in the eastern Fram Strait during the last 9ka: multiproxy evidence for a two-phase Holocene. Paleoceanography 28 (2),283e295. http://dx.doi.org/10.1002/palo.20028.
Whitmore, J., Gajewski, K., Sawada, M., Williams, J.W., Shuman, B., Bartlein, P.J.,Minckley, T., Viau, A.E., Webb III, T., Shafer, S., Anderson, P., Brubaker, L., 2005.Modern pollen data from North America and Greenland for multi-scale pale-oenvironmental applications. Quat. Sci. Rev. 24 (16e17), 1828e1848. http://dx.doi.org/10.1016/j.quascirev.2005.03.005.
Wilson, C.R., Michelutti, N., Cooke, C.A., Briner, J.P., Wolfe, A.P., Smol, J.P., 2012. Arcticlake ontogeny across multiple interglaciations. Quat. Sci. Rev. 31, 112e126.http://dx.doi.org/10.1016/j.quascirev.2011.10.018.
Willemse, N.W., T€ornqvist, T.E., 1999. Holocene century-scale temperature vari-ability from West Greenland lake records. Geology 27 (7), 580e584. http://dx.doi.org/10.1130/0091-7613(1999)0272.3.CO;2.
Wolfe, B.B., Edwards, T.W.D., Aravena, R., MacDonald, G.M., 1996. Rapid Holocenehydrologic change along boreal treeline revealed by d13C and d18O in organiclake sediments, Northwest Territories, Canada. J. Paleolimnol 15 (2), 171e181.http://dx.doi.org/10.1007/BF00196779.
Winkelmann, D., Jokat, W., Jensen, L., Schenke, H.-W., 2010. Submarine end mo-raines on the continental shelf off NE Greenland e implications for Lateglacialdynamics. Quat. Sci. Rev. 29 (9e10), 1069e1077. http://dx.doi.org/10.1016/j.quascirev.2010.02.002.
Winsor, K., Carlson, A.E., Rood, D.H., 2014. 10Be dating of the Narsarsuaq moraine insouthernmost Greenland: evidence for a late-Holocene ice advance exceedingthe Little Ice Age maximum. Quat. Sci. Rev. 98, 135e143. http://dx.doi.org/10.1016/j.quascirev.2014.04.026.
Wolfe, A.P., 2002. Climate modulates the acidity of Arctic lakes on millennial timescales. Geology 30 (3), 215e218. http://dx.doi.org/10.1130/0091-7613(2002)030<0215:CMTAOA>2.0.CO;2.
Wooller, M.J., Francis, D., Fogel, M.L., Miller, G.H., Walker, I.R., Wolfe, A.P., 2004.Quantitative paleotemperature estimates from d18O of chironomid head cap-sules preserved in arctic lake sediments. J. Paleolimnol. 31 (3), 267e274. http://dx.doi.org/10.1023/B: JOPL.0000021944.45561.32.
Young, N.E., Briner, J.P., 2015. Holocene evolution of the western Greenland IceSheet: assessing geophysical ice-sheet models with geological reconstructionsof ice-margin change. Quat. Sci. Rev. 114, 1e17. http://dx.doi.org/10.1016/j.quascirev.2015.01.018.
Young, N.E., Briner, J.P., Rood, D.H., Finkel, R.C., 2013a. Glacier extent during theyounger dryas and 8.2-ka event on baffin island, arctic Canada. Science 337(6100), 1330e1333. http://dx.doi.org/10.1126/science.1222759.
Young, N.E., Briner, J.P., Rood, D.H., Finkel, R.C., Corbett, L.B., Bierman, P.R., 2013b.Age of the Fjord Stade moraines in the Disko Bugt region, western Greenland,and the 9.3 and 8.2 ka cooling events. Quat. Sci. Rev. 60 (0), 76e90. http://dx.doi.org/10.1016/j.quascirev.2012.09.028.
Young, N.E., Schweinsberg, A., Briner, J.P., Schaefer, J.M., 2015. Glacier maxima inbaffin Bay during the medieval warm period coeval with norse settlement. Sci.Adv. 1 (11), e1500806.
Zabenskie, S., Gajewski, K., 2007. Post-Glacial climatic change on Boothia Peninsula,Nunavut, Canada. Quat. Res. 68 (2), 261e270. http://dx.doi.org/10.1016/j.yqres.2007.04.003.


![-Traces Worshop [Ottawa]- April 29th, 2007phil/Ottawa.Traces.07.talks/eric.paquette.pdf · Quantum decoherence Eric Oliver Paquette (U. Montr´ eal)´-Traces Worshop [Ottawa]-April](https://img.pdfslide.us/doc/110x75/601d3854d93e38614c0119c2/traces-worshop-ottawa-april-29th-philottawatraces07talksericpaquettepdf.jpg)


![arXiv:1406.2572v1 [cs.LG] 10 Jun 2014gmail.com Caglar Gulcehre Universite de Montr´ eal´ gulcehrc@iro.umontreal.ca Kyunghyun Cho Universite de Montr´ ´eal kyunghyun.cho@umontreal.ca](https://img.pdfslide.us/doc/110x75/5b1be1e97f8b9a3c258f215e/arxiv14062572v1-cslg-10-jun-2014-gmailcom-caglar-gulcehre-universite-de-montr.jpg)