Embed Size (px)
Citation preview

at SciVerse ScienceDirect
Quaternary Science Reviews 55 (2012) 23e33
Contents lists available
Quaternary Science Reviews
journal homepage: www.elsevier .com/locate/quascirev
Invited paper
A re-examination of evidence for the North Atlantic “1500-year cycle” at Site 609
Stephen P. Obrochta a,*, Hiroko Miyahara b, Yusuke Yokoyama c, Thomas J. Crowley d
aUniversity of Tokyo Atmosphere Ocean Research Institute, Kashiwa, Chiba 227-8564, JapanbUniversity of Tokyo Institute for Cosmic Ray Research, Japan Agency for Marine-Earth Science and Technology, JapancUniversity of Tokyo Atmosphere Ocean Research Institute, University of Tokyo Department of Earth and Planetary Sciences, Japan Agency for Marine-Earth Science and Technology,JapandBraeheads Institute, Maryfield, Braeheads, East Linton, East Lothian, Scotland EH40 3DH, UK
a r t i c l e i n f o
Article history:Received 27 March 2012Received in revised form7 August 2012Accepted 13 August 2012Available online
Keywords:North AtlanticPaleoceanographyIce-rafted debris (IRD)StratigraphyMillennial climate variabilitySolar variability
* Corresponding author.E-mail address: [email protected] (S.P. O
0277-3791/$ e see front matter � 2012 Elsevier Ltd.http://dx.doi.org/10.1016/j.quascirev.2012.08.008
a b s t r a c t
Ice-rafting evidence for a “1500-year cycle” sparked considerable debate on millennial-scale climatechange and the role of solar variability. Here, we reinterpret the last 70,000 years of the subpolar NorthAtlantic record, focusing on classic DSDP Site 609, in the context of newly available raw data, the latestradiocarbon calibration (Marine09) and ice core chronology (GICC05), and a wider range of statisticalmethodologies. A w1500-year oscillation is primarily limited to the short glacial Stage 4, the age ofwhich is derived solely from an ice flowmodel (ss09sea), subject to uncertainty, and offset most from theoriginal chronology. Results from the most well-dated, younger interval suggest that the original1500 � 500 year cycle may actually be an admixture of the w1000 and w2000 cycles that are observedwithin the Holocene at multiple locations. In Holocene sections these variations are coherent with 14Cand 10Be estimates of solar variability. Our new results suggest that the “1500-year cycle” may bea transient phenomenon whose origin could be due, for example, to ice sheet boundary conditions forthe interval in which it is observed. We therefore question whether it is necessary to invoke such exoticexplanations as heterodyne frequencies or combination tones to explain a phenomenon of such fleetingoccurrence that is potentially an artifact of arithmetic averaging.
� 2012 Elsevier Ltd. All rights reserved.
1. Introduction
The late Gerard Bond and colleagues reported from multiplelocations across the North Atlantic a “1500-year cycle” in ice-rafted,hematite-stained grains (HSG) that appeared to pace theDansgaardeOeschger (DeO) Events prominent in the last-glacialinterval of the GISP2 Greenland ice core (Bond and Lotti,1995; Bondet al., 1997, 1999). The subsequent interpretation of solar forcing ofHSG variability during the Holocene (Bond et al., 2001) stimulatedsubstantial debate on the mechanisms of millennial variability, duein part to the lack of a corresponding 1500-year solar cycle. Thisbody of work remains widely discussed, with the above-mentionedfour manuscripts being cumulatively cited in excess of 3000 times.
Classic DSDP Site 609 (49� 52.70 N, 24� 14.30 W; 3884 mbsl),located on the upperemiddle eastern flank of the Mid AtlanticRidge within the “IRD Belt” of Ruddiman (1977), produced one ofthe more well-known HSG records (Fig. 1). In addition, this site wasinstrumental in linking Greenland air temperature with North
brochta).
All rights reserved.
Atlantic sea surface temperature (SST) fluctuations, as well as indemonstrating that DeO Events are bundled into progressivelycooler interstadials that culminate in a large ice discharge (HeinrichEvent) (Bond et al., 1992, 1993).
During IODP Exp. 303, Site 609 was reoccupied, and a contin-uous 355 m sequence was recovered from Site U1308 (Exp. 303Scientists, 2006). Hodell et al. (2008) used grayscale variations tocorrelate the two sites, allowing for the transfer of the Site 609 agemodel to Site U1308. However, the utility of the Site 609 age modelis currently limited due to its basis in older chronologies that havesince undergone significant revision.
Therefore, in this manuscript we reinterpret the HSG record ofDSDP Site 609 (Bond et al., 1999) in light of an improved chronologyfor the last glaciation, Marine Isotope Stages (MISs) 2e4. We 1)reassess the chronostratigraphic correlation between Site 609 andthe Greenland ice core record, 2) improve the early-glacial chro-nology with the virtually complete North GRIP (NGRIP) ice core(NGRIP Project Members, 2004), and 3) temporally extend the late-glacial radiocarbon chronology with the most recent marineradiocarbon calibration curve (Reimer et al., 2009). We then 4)apply an age uncertainty model to this thoroughly updated chro-nology to evaluate the effects of age perturbations on cyclicity.

60 oW 45 oW 30oW 15oW
0o 15
o E
25 oN
35 oN
45 oN
55 oN
65 oN
75 oN
85 oN
oW 45 oW 0o
15
35 oN
45 oN
55 oN
65 oN
75 oN
N
−6 −5 −4 −3 −2 −1 0 1 2 3Elevation (km)
Fig. 1. Star depicts the location of Site 609 (49�52.70N, 24�14.30W; 3884 mbsl). Squaresrepresent locations of western and eastern cores, MC21 and GGC22 (44�180N, 46�160W;3958 mbsl), MC52 (55�280N, 14�430W, 2172 mbsl), V29-191 (54�160N, 16�470W,2370 mbsl), and V23-81 (54�150N, 16�500W, 2393 mbsl). Circles denote Greenland icecores GISP2 (72�360N, 38�300W; 3200 m) and NGRIP (75�60N, 42�200W; 2917 m).
S.P. Obrochta et al. / Quaternary Science Reviews 55 (2012) 23e3324
Finally, we 5) make available the entire Site 609 dataset (seeSupplemental Online Material) with the goal of enabling betterglobal correlation to this important location.
2. Background
2.1. Sources and significance of hematite stained grains
Over forty years ago, Paleozoic red beds in the area of the Gulf ofSt. Lawrence, which contain abundant hematite-cemented quartzsandstones (e.g., Belt, 1965), were proposed as a primary source forferruginous sediments transported to the North Atlantic basinduring Pleistocene glaciations (Heezen et al., 1966). Ericson et al.(1961) first described these sediments in western North Atlanticsediment cores during the early days of the Lamont-Doherty EarthObservatory’s “core a day” program. Subsequently, similar sedi-ments were discovered at the mouth of the Gulf of St. Lawrence(Heezen and Drake, 1964) and in Baffin Bay (Marlowe, 1968). Thelatter, however, does not appear to significantly export ferruginoussediment because of the lack of such deposits in the Labrador Sea(Hollister, 1967). Pollen (Needham et al., 1969) and clay mineral(Conolly et al., 1967; Zimmerman, 1972) assemblages also stronglysuggest a Gulf of St. Lawrence source.
Sediment cores taken along major iceberg trajectories latercorroborated the interpretation that ice-rafted HSG were primarilyderived from the Gulf of St. Lawrence during the last glaciation(Bond and Lotti, 1995). During the Holocene, however, core topanalyses indicate other sources for HSG. Red beds from EastGreenland and Svalbard, and likely the Arctic Ocean, contributedsignificant amounts of HSG, and changes in ocean circulation (asopposed to increased calving) are interpreted to be responsible forvariations in the amount of HSG deposited in the modern subpolarNorth Atlantic (Bond et al.,1997). Thus, Bond et al. (1997) concludedthat HSG deposition from melting ice is controlled by differingmechanisms during the Holocene and long interstadials (oceancirculation changes) and during glacial times (increased icebergdischarge).
2.2. HSG methodology
Bond and Lotti (1995), as well as Bond et al. (1997, 1999, 2001),performed counts of HSG, detrital carbonate (DC), and Icelandicglass (IG) on the 63e150 mm size fraction using grain-mount slidesand a petrographic microscope. This size fraction was chosen toprovide “greater accuracy in petrologic identification” (Bond andLotti, 1995). Using a narrow range of relatively small-sized grainsalso reduces variability resulting from any relationship betweengrain size and composition (Bond et al., 1999) without introducinga compositional bias (Bond and Lotti, 1995). Grain-mount slidesallow multiple grain faces to be viewed at once, increasing identi-fication efficiency. In addition, the relative abundance of the 63e150 mm fraction remains high during interglacials, allowing stan-dardized measurements from both interglacial and glacial times(Bond et al., 1999). Counts of bulk lithic grains and Neo-globoquadrina pachyderma (s) were performed on the >150 mmfraction using standard techniques (Bond and Lotti, 1995; Bondet al., 1997).
2.3. Principal HSG results
Early discussion of HSG focused on its potential for integratingmuch of the observed last-glacial millennial variability. Grootes andStuvier (1997) identified a sharp, highly significant 1470-yearspectral peak in the Greenland GISP2 ice core d18O record. Coinci-dentally, Bond et al. (1997) reported a mean pacing of 1470 � 523years in HSG deposition. Peaks in HSG deposition occurred simul-taneously with increases in IG and preceded each of the large“Hudson Strait” Heinrich Events (H1, H2, H4, H5), which arerecognizable by abrupt increases in DC (Bond and Lotti, 1995; Bondet al., 1999). Therefore, the 1500-year cycle in HSG potentiallyexplained not only the pacing of the DeO Events evident inGreenland ice cores (e.g., Schulz, 2002; Rahmstorf, 2003) but alsooffered an explanation for surging of the Laurentide Ice Sheet (LIS):climate acting on unstable ice in multiple locations that simulta-neously surges and in turn destabilizes the LIS, perhaps due to theeffects of sea level rise on grounded ice margins, producinga Heinrich Event.
However, neither the last glacial nor Holocene HSG recordsexhibit statistically significant 1500-year periodicity. Thereforethese records were referred to as either “quasi-periodic” (Bondet al., 1997) or “cyclic” (in a geologic sense, implying repetition,not periodicity) (Bond et al., 2001). The mean pacing of 1470 � 523years was derived by interval counting (the elapsed time betweencycle midpoints) and was the combined result of a compositerecord covering the last glaciation with V23-81 (1536 � 563 years)and the Holocene with V29-191 (1374 � 502 years) (Bond et al.,1997). Bond et al. (1999) later revised the V23-81 result to1469 � 514 years and presented results for the last glacial intervalof DSDP Site 609 (1476 � 585 years).
The most well-known HSG record is the eastern (MC21-GGC22)and western (MC52-V29-191) North Atlantic Holocene stack thatwas shown to be highly coherent with cosmogenic nuclideproduction. While this was used to suggest that “at least theHolocene segment of the North Atlantic’s ‘1500-year’ cycle appearsto have been linked to variations in solar irradiance” (Bond et al.,2001), the coherency was, in fact, not at 1500 years at all but atprimarily 500, 1000, and perhaps 2000 years. (Variability at thelatter period was filtered out of the records prior to cross-spectralanalysis.) The absence of coherency at a w1500-year periodreflects the lack of power at this band in the HSG and solar proxyrecords. Variations in this stacked record coincided with well-known climatic events, including the 8.2 ka Event, MedievalWarm Climate Anomaly, and Little Ice Age, (Bond et al., 1997, 2001),

S.P. Obrochta et al. / Quaternary Science Reviews 55 (2012) 23e33 25
but these climate events are not spaced at 1500-year intervals. Thephrase “1500-year,” as it appears in Bond et al. (2001), is a genericdescriptor that, in every instance, may be replaced with “HSG”; itdoes not indicate that there is coherence with solar variability ata 1500-year period.
Applying the results of Bond et al. (2001) to the last-glacial HSGrecords presents a conundrum. Either the solar forcing wouldrequire modification, e.g., heterodynes (Clemens, 2005) andcombination tones (Braun et al., 2005) of centennial scale oscilla-tions, or the w1500 � 500-year cycle is more consistent withw1000- and perhaps w2000-year variability. Indeed, subsequentwork reduced the importance of an exact 1470-year mean HSGcycle length by demonstrating that the 1470-year spectral peakresults from three extremely regularly spaced DeOwarming eventsin GISP2 (Schulz, 2002) and is absent from other Greenland icecores (e.g., Clemens, 2005; Ditlevsen et al., 2007).
3. Methods
3.1. Age model
We update the radiometrically-dated portion of the Site 609age model to reflect recent improvements to the last glacial chro-nology provided by the Marine09 radiocarbon calibration (Reimeret al., 2009). Though the radiocarbon dating of Site 609 extendsinto MIS 3, the original chronology was based on only dates up to19,340 14C years that were converted to calendar ages using thecalibration of Bard et al. (1993) and resulted in a maximumcalendar age of 22,646 years BP (BP is relative to 1950 AD). Here, weuse Calib 6.0 (Stuiver and Reimer, 1993) to recalculate new calendarages and include eleven previously uncalibrated dates, extendingthe radiocarbon-dated interval of this site to 31,120 14C years BP(Table 1). A constant global reservoir correction (405 years) isapplied by the Calib program. We do not specify a local reservoircorrection (DR). All radiocarbon dates were performed on plankticforaminifers, none of which were sampled from Heinrich layers.This greatly reduces the possibility of large reservoir age changesassociated with fluctuations in thermohaline circulation and ofcontamination from infilling with radiocarbon-dead, fine-graineddetrital carbonate (Hodell and Curtis, 2008).
From early MIS 3, beyond the radiocarbon-dated interval, Bondet al. (1999) exported the Meese/Sowers (M/S94) GISP2 ice corechronology to Site 609 by tying the % N pachyderma (s) SST proxy
Table 1Site 609 radiocarbon dates.
Depth (cm) 14C years (uncorrected) s (y) Original calibration (y BP 1950)
55 11,500 e e
73.5 12,750 220 14,47479.5 13,650 90 15,59084.5 14,990 230 17,25287.5 16,360 240 18,95090.5 16,760 150 19,44698.5 17,360 120 20,190107.5 19,340 220 22,646110.5 20,370 330 e
111.5 20,950 260 e
112.5 21,510 220 e
115.5 21,770 220 e
118.5 22,780 340 e
140.5 25,660 440 e
148.5 26,570 310 e
153.5 29,570 660 e
166.5 30,480 680 e
174.5 31,120 730 e
14C dates are uncorrected for reservoir age and from Bond et al. (1993). The date at 55 cmof 100 years. Marine09 calibration is from (Reimer et al., 2009). The reported calibration6.0 (Stuiver and Reimer, 1993).
record to the GISP2 ice core (Fig. 2), which is layer counted to 55 ka(Bender et al., 1994; Meese et al., 1997). However, very high densitysampling of the new, virtually complete North GRIP (NGRIP) icecore indicates that GISP2 likely suffers from excessive layer thin-ning (Svensson et al., 2006). Therefore, we improve the olderportion of the Site 609 age model by aligning the SST proxy and theNGRIP d18O records, allowing us to import the latest Greenland icecore chronology (GICC05, layer counted to 60 ka beyond which thess09sea flow model is applied) (Svensson et al., 2008). We rely onthe original Site 609 depth tie points of Bond et al. (1999) (Table 2),which are primarily lows inN. pachyderma (s) abundance. These arecorrelated to the corresponding events in the NGRIP ice core (e.g,peak low percent tied to peak interstadial d18O) (Fig. 2). Thisprocedure assumes North Atlantic sea surface and Greenland airtemperature variations are in phase. Supplemental Fig. 1 compareseach ice core record to the Site 609 N. pachyderma (s) record indown-core depth.
3.2. Spectral analysis
In a similar fashion as Bond et al. (1997, 1999), we calculate theelapsed time between cycle midpoints. Multitaper method (MTM)spectral analysis is performed using the software package SSA-MTM Toolkit (Ghil et al., 2002) after interpolating to a 200-yeartime step, which is a slightly lower resolution than the averagesampling resolution of w180 years. Morlet wavelet analysis isperformed usingMatlabwith code available for download at http://paos.colorado.edu/research/wavelets/software.html (Torrence andCompo, 1998). Prior to wavelet analysis, the data were firstdetrended and smoothed by subtracting the first SSA-reconstructed(trend) component before interpolation to a 200-year interval andapplication of a 500-year lowpass filter.
3.3. Age uncertainty model
Alternate age models are calculated by allowing the age controlpoints of Site 609 to vary independently within their respectiveGaussian 2s ranges to assess the robustness of HSG variability toplausible chronological perturbations. Because there is no pub-lished uncertainty for the ss09sea flow model that was used toassign ages in excess of 60 ka to NGRIP, the corresponding intervalof Site 609 is excluded. For radiocarbon dates, the 2s range incalibrated calendar years is used. NGRIP-derived dates use the
Marine09 calibration (y BP 1950) 1s range (BP 1950) 2s range (y BP 1950)
12,980 12,860e13,120 12,700e13,19014,440 14,020e14,690 13,800e15,14016,190 15,910e16,600 15,430e16,75017,740 17,400e18,030 17,120e18,16019,120 18,920e19,380 18,660e19,48019,510 19,390e19,600 19,210e19,93020,130 19,970e20,320 19,810e20,42022,610 22,280e22,720 22,120e23,34023,850 23,470e24,270 22,930e24,57024,530 24,250e24,910 23,850e25,12025,230 24,910e25,590 24,540e25,87025,540 25,190e25,850 24,960e26,16027,000 26,600e27,640 26,050e27,92030,050 29,580e30,430 29,300e30,97030,840 30,630e31,090 30,360e31,22033,670 33,070e34,580 31,930e34,90034,640 33,640e35,220 33,150e36,31035,360 34,690e35,660 33,700e36,670
is from Elliot et al. (1998), and does not include a reported error; we assumed a valueages are the rounded, median probability determined by the online version of Calib

5 10 15 20 25 30 35 40 45 50 55 60 65 70 75 80−46
−44
−42
−40
−38
−36
−34
NG
RIP
δ18
O
NGRIP Age (ka b2k)
0
0.2
0.4
0.6
0.8
1
Site
609
N. p
ach
yd
erm
a [s
] (%
/100
)
5 10 15 20 25 30 35 40 45 50 55 60 65 70 75 80
−44
−42
−40
−38
−36
−34
GIS
P2 δ
18O
GISP2 Age (ka b2k)
Fig. 2. The GISP2 ice core d18O record (purple, top) is tied to the Site 609% N. pachyderma (s) record (green, middle) as shown in Fig. 3 of Bond et al. (1999), resulting in warm SSTevents (lows in N. pachyderma (s) abundance) being tied to interstadials, stadials, and/or transitions. Here, these original picks (open squares) are tied to the proper correspondingfeatures of the NGRIP ice core record (blue, bottom). Radiocarbon dates are updated to Marine09 (filled circles), with inclusion of additional Site 609 radiocarbon dates (opencircles). All ages plotted relative to A.D. 2000 (b2k).
S.P. Obrochta et al. / Quaternary Science Reviews 55 (2012) 23e3326
maximum counting error (MCE) of GICC05, which is “the accu-mulated error obtained by summing up the uncertain annuallayers” and is regarded as roughly equivalent to 2s range (Svenssonet al., 2008) (Table 3). To prevent potential age reversals due to
Table 2Site 609 original and revised Greenland ice core tie points.
609 depth (cm) %Nps GISP2 depth (m) GISP2 age (ka BP 1950) GISP2 event
139.5 L 2076 29.03 T191.5 L 2176 35.23 I213.5 L 2230 38.32 I248.5 L 2276.8* 41.21 T261.5 L 2301.92* 42.486 I285.5 L 2356.075* 45.283 I347.5 P 2465.9807** 53.4973 I346.5 L 2488 56.24 I369.5 L 2502 57.76 T385.5 L 2536 62.11 S405.5 L 2564 66.02 S420.5 L 2584 68.75 T445.5 T 2612 73.02 T
The tie points to GISP2 used to produce the agemodel for Site 609 are shown at left (Bondnot presented in table format as above. At right are our ties of the same depths in Site 609 tss09sea time scales at 60 ka (Svensson et al., 2008). %Nps ¼ percentage of N. pachydemaevent; I¼ interstadial; S¼ stadial; P¼ relative peak inNps abundance; L¼ relative low inMS/94 age model for GISP2, which assigned ages of 53.22 ka and 53.5 ka to 2464 m and 24required to obtain the age of 53.4973 ka that was assigned by Bond et al. (1999) to 347.
overlapping uncertainty, one radiocarbon date at 87.5 cmbsf andtwo NGRIP tie points at 191.5 and 364.5 cmbsf are excluded.
50 ensembles of 100,000 alternate age models are calculated.Maximum allowable sedimentation rate and maximum change in
NGRIP depth (m) NGRIP age (ka b2k) NGRIP event NGRIP chronology
1890.14 28.50 I GICC052008.60 35.45 I GICC052067.93 38.15 I GICC052123.82 41.45 I GICC052156.58 43.30 I GICC052216.73 46.65 I GICC052347.85 54.40 S GICC052394.54 57.80 I GICC052414.50 59.05 I GICC052463.40 63.95 I ss09sea2507.37 69.60 I ss09sea2534.94 72.25 I ss09sea2579.85 76.50 T ss09sea
et al., 1999). These data are presented graphically in Fig. 3 of Bond et al. (1999) but areo the NGRIP ice core. A 705-year shift to younger ages is required to align GICC05 and(s) relative to total planktic foraminifers; GISP2/NGRIP Event ¼ Greenland climate
Nps abundance; T¼Greenland/Nps transition; *¼ interpolated point; ** Based on the66 m, respectively, a tie point to a depth of exactly 2465.98071428571 m in GISP2 is5 cm in Site 609.

Table 3Site 609 revised age model.
Site 609depth (cmbsf)
Age(ka b2k)
2s range formodel
Tie pointtype
Chronology
55 13.03 �0.24 þ 0.28 14C* Marine0973.5 14.49 �0.84 þ 0.50 14C Nps Marine0979.5 16.24 �0.56 þ 0.82 14C Gb Marine0984.5 17.79 �0.68 þ 0.58 14C Nps Marine0987.5 19.17 N/A 14C Nps Marine0990.5 19.56 �0.24 þ 0.18 14C Nps Marine0998.5 20.18 �0.32 þ 0.38 14C Nps Marine09107.5 22.66 �0.66 þ 0.22 14C Nps Marine09110.5 23.90 �0.76 þ 0.84 14C Nps Marine09111.5 24.58 �0.56 þ 0.76 14C Nps Marine09112.5 25.28 �0.64 þ 0.72 14C Nps Marine09115.5 25.59 �0.70 þ 0.62 14C Nps Marine09118.5 27.05 �0.80 þ 1.28 14C Nps Marine09140.5 30.10 �0.94 þ 0.76 14C Gi Marine09148.5 30.89 �0.42 þ 0.50 14C Nps Marine09153.5 31.98 �1.20 þ 1.82 14C Nps Marine09166.5 33.20 �2.0 þ 1.16 14C Nps Marine09174.5 33.92 �1.34 þ 0.60 14C Gi Marine09191.5 35.45 N/A % Nps GICC05213.5 38.15 �1.44 % Nps GICC05248.5 41.45 �1.64 % Nps GICC05261.5 43.30 �1.74 % Nps GICC05285.5 46.65 �1.90 % Nps GICC05347.5 54.40 �2.32 % Nps GICC05346.5 57.80 N/A % Nps GICC05369.5 59.05 �2.56 % Nps GICC05385.5 63.95 e % Nps ss09sea405.5 69.60 e % Nps ss09sea420.5 72.25 e % Nps ss09sea445.5 76.50 e % Nps ss09sea
Age control points used in the “best-fit” age model of (Fig. 2). The three oldestradiocarbon dates are adjusted within 2s range, optimizing the fit to the NGRIP-correlated section. The tie point to NGRIP at 139.5 cm overlaps with the newlycalibrated radiocarbon dates and is not used for the updated Site 609 agemodel. N/Arefers to tie points excluded from the age uncertainty model, and ss09sea ages haveno reported error range. Nps ¼ N. pachyderma (s); Gb ¼ G. bulloides; Gi ¼ G. inflata. *14C date at 55 cm was performed on undisclosed material.
S.P. Obrochta et al. / Quaternary Science Reviews 55 (2012) 23e33 27
sedimentation rate are specified as 20 and 15 cm/k.y., respectively,which are approximately twice the values exhibited by the best-fitage model. Alternate age models that exceeded these parametersare discarded. Each of the accepted age models are applied to the
10
20
30
40
50
60
70
80
IntC
al09
/GIC
C05
/ss0
9sea
Age
(ka
b2k)
0
100
200
300
400
500
50 100 150 200 250 300 350 400 450 sedi
men
tatio
n ra
te (c
m/k
y)
Depth (cmbsf)
Site 609 first-pass age model
A
Fig. 3. A) Main panel shows sedimentation rate (black, bottom), the mean probability of Mar(inner and outer error bars) (Table 1), and NGRIP-derived ages (red circles) (Table 2). Upper ithree oldest radiocarbon dates are adjusted within 2s range to produce a more reasonable
Site 609 HSG series, which is then analyzed by multitaper methodspectral analysis (MTM) after interpolation to a 200-year fixed timestep. A distribution is populated from the frequencies of spectralpeaks exhibiting at least 95% confidence relative to an AR(1)background. Results are reported as the mean and standard devi-ation of all 50 distributions.
The above results are then compared to results from syntheticseries passed through the same age uncertainty model. These aredesigned to exhibit similar spectral characteristics as the Site 609HSG series, which was best simulated by adding pink noise to sinewaves based on frequencies identified during spectral analysis ofthe best-fit agemodel. Both single- and combined-frequency wavesare used. Each series is then interpolated to the same age scale asthe Site 609 HSG record. Finally, the first and second SSA-reconstructed HSG components are added in order to createa similar low-frequency, non-linear trend as the Site 609 HSG series(Fig. S2). Model convergence and stability are obtainedwith shorterruns of 20 ensembles of 10,000 alternate age models.
4. Results
4.1. Site 609 updated chronology
Several errors in the original site 609 correlation to theGreenland ice record are corrected. The Bond et al. (1999) ties toGISP2 are not optimal and vary in relative phasing, resulting inindividual lows in N. pachyderma (s) abundance (relatively warmSST) being inconsistently tied to Greenland stadials, interstadials,or transitions.
The age model presented here for Site 609 (Table 3) is adjustedslightly to optimize the fit between the radiocarbon and ice corederived ages. The youngest Greenland ice core tie point of Bondet al. (1999), located at 139.5 cmbsf, is not required because itoverlaps with the radiocarbon dated interval. In addition, withoutadjustment, the interval between the oldest radiocarbon date(174.5 cmbsf; 35.36 � 0.73 ka) and the next youngest ice core tiepoint (191.5 cmbsf; 35.45 ka) produces an abrupt, two order ofmagnitude increase in sedimentation rate exceeding 400 cm/k.y.(Fig. 3a). Therefore, the three oldest radiocarbon dates are adjusted
10
20
30
40
50
60
70
80
IntC
al09
/GIC
C05
/ss0
9sea
Age
(ka
b2k)
0
5
10
15
20
50 100 150 200 250 300 350 400 450 sedi
men
tatio
n ra
te (c
m/k
y)
Depth (cmbsf)
Site 609 optimized age model
B
ine09 calibrated radiocarbon ages (blue circles) with associated 1s and 2s error rangesnset shows offset between overlapping ice core tie points and radiocarbon ages. B) Thesedimentation rate (Table 3). Solid lines show polynomial fit through age points.

-54
-52
-50
-48
-46
-4410 20 30 40 50 60 70
EDM
L18
Age (ka b2k)
1.5
2
2.5
3
3.5
4
4.510 20 30 40 50 60 70Si
te 6
09 P
lank
tic
18
Age (ka b2k)
0
20
40
60
80
100
Site
609
N. p
ach
yd
erm
a s
(%)
0
10
20
30
Site
609
Det
rital
CO
3 (%) 0
10
20
30
Site
609
Gla
ss (%
)0
10
20
30
40
Site
609
HSG
(%)
-46-44-42-40-38-36-34-32
NG
RIP
18
H1 H2 H3 H4 H5 H6
Fig. 4. Antarctic EDML (black) (EPICA Community Members, 2006) and GreenlandNGRIP (purple) (NGRIP Project Members, 2004) ice core d18O records are plotted aboveSite 609 HSG (red), IG (brown), DC (green), % N. pachyderma (s) (blue), andN. pachyderma (s) d18O (black) (Bond et al., 1999). All records plotted on NGRIP GICC05chronology.
S.P. Obrochta et al. / Quaternary Science Reviews 55 (2012) 23e3328
within their 2s range to produce a more reasonable sedimentationrate (Fig. 3b). Specifically, the radiocarbon dates at 153.5 and166.5 cmbsf are adjusted to 31.98 and 33.20 ka, respectively, and anage of 33.92 ka is obtained for the oldest radiocarbon date at174.5 cmbsf by linear interpolation between 33.20 ka and 35.45 ka,forcing no change in sedimentation rate. The updated chronologyresults in generally older ages for the Site 609 age model, withprogressively increasing offset beginning from w40 ka and reach-ing a maximum of w4 k.y. by 70 ka (Fig. 2).
NGRIP and all available Site 609 data are plotted in our updatedchronology with the Antarctic EDML ice core as a South Atlanticcounterpart (Fig. 4). All series, including EDML, are plotted on theNGRIP GICC05 age scale (EPICA Community Members, 2006).Increases in IG and HSG coincide with reduced SST duringGreenland stadials and precede peaks in DC and planktic d18O, bothof which indicate greatly increased discharge of LIS-derivedicebergs (Bond and Lotti, 1995; Bond et al., 1999). Warming inAntarctica occurs subsequent to the onset of each of these “HudsonStrait” Heinrich Events (H1, H2, H4, and H5), as reduced productionof North Atlantic Deep Water would result in diminished north-ward heat transport (Crowley, 1992).
4.2. Spectral analysis
Bond et al. (1999) reported an average elapsed time betweenSite 609 HSG cycle midpoints of 1476 � 584 years but did notspecify the down-core intervals defining each cycle. Our indepen-dent calculation of cycle midpoints results in an indistinguishableaverage length of 1492 � 571 years with the original Bond chro-nology, and 1573 � 669 years with our updated chronology. Anumber of spectral peaks are apparent at 1/2180, 1/1670, 1/1390, 1/980, 1/850, and 1/750 years (Fig. 5). While the 1/1390-year peakexhibits the highest amplitude relative to an AR(1) background,wavelet analysis indicates that it is nonstationary, and power in thisband results primarily from the ss09sea-dated interval (>60 ka)that comprises the oldest 10 k.y. of the record (Fig. 6). The distri-bution of elapsed time between cycle midpoints in the GICC05-dated interval (<60 ka) exhibits two primary modes at w1000-and w2000-year wait-times (Fig. 7).
4.3. Alternate age models
Of the total 100,000 alternate age models calculated per each ofthe 50 ensembles, on average, 3612 � 222 (1s) are within thespecified sedimentation rate criteria (Fig. 8). The ensemble-meandistribution of 95% confident significant spectral frequenciesexhibits two primary bands. A 1/975� 50 year frequency is presentin w45% of all age models (1587), and a relatively wide bandcentered at 1/2050 � 150 years is detected in w20% (760). Athird, minor band located at 1/1400 � 30 years is significant in 12%(427) (Fig. 9).
Out of the five synthetic series created (Fig. S3), only twocombined-frequency series produced results with significantcorrelation to results from the HSG series. The first series is con-structed with equal amplitude 1/1025- and 1/2100-year frequen-cies (r2 ¼ 0.83), and the other adds a 1/1390-year frequency, withthe 1/2100- and w1/1390-year components scaled respectively at95% and 50% through iterative adjustment to maximize correlation(r2 ¼ 0.86) (Fig. 10).
5. Discussion
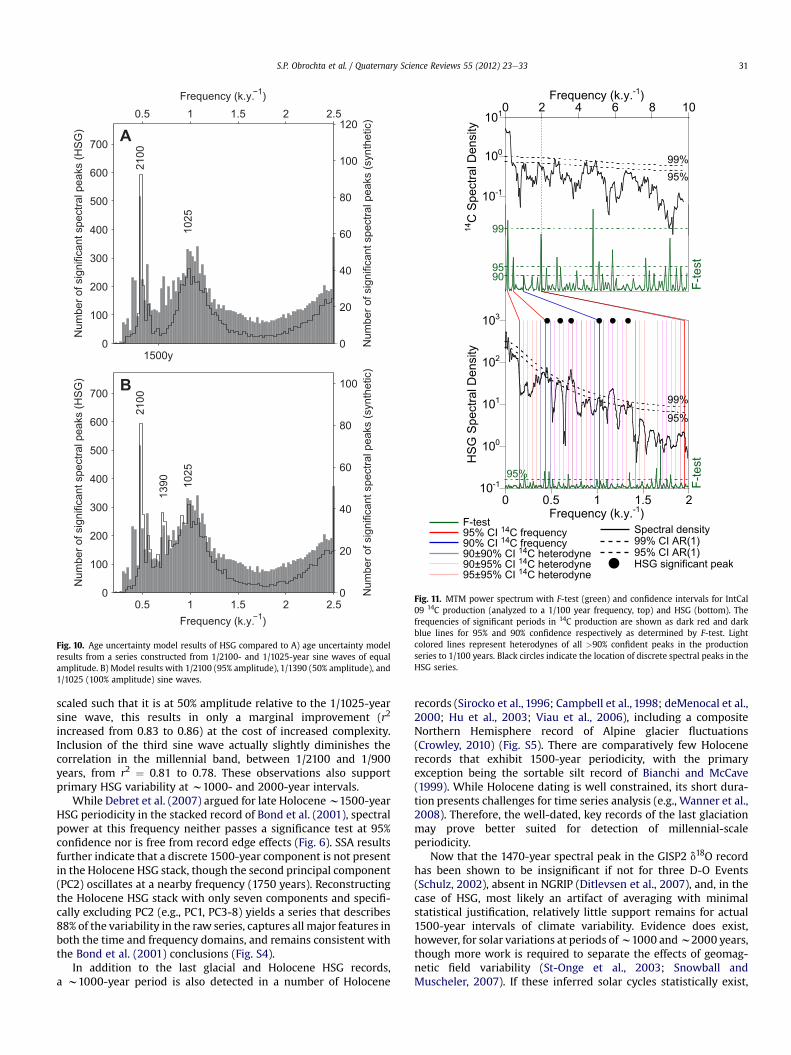
The absence of any identifiable external 1500-year forcingfocused several efforts to explain such climate variability throughice-sheet modulation. Combination tones and heterodynes ofcentennial-scale cycles in inferred Holocene solar proxy records,such as directly observed sunspot cycles or atmospheric 14Cproduction, could be combined to produce frequencies consistentwith those observed inmany glacial records, including 1/1470 years(e.g., Braun et al., 2005; Clemens, 2005). However, all possibleheterodynes of statistically significant frequencies in the IntCal0914C production record are calculated to demonstrate that themillennial band (lower than and including 1/500 years) is saturatedsuch that, by chance, any particular significant spectral peak from

F-Te
st
95%10-1
100
101
102
103
0 0.5 1 1.5 2
Spec
tral D
ensi
ty
Frequency (k.y.-1)
99%
95%
F-Te
st
95%10-1
100
101
102
103
0 0.5 1 1.5 2
Spec
tral D
ensi
ty
Frequency (k.y.-1)
99%
95%
0
5
10
15
20
25
30
35
10 20 30 40 50 60 70 80
HSG (%)MaximumMidpointMinimum
HSG
(%)
IntCal09/GICC05ss09sea Age (ka b2k)
Calculatedcyclicity
1573 ± 669 y
0
5
10
15
20
25
30
35
10 20 30 40 50 60 70 80
HSG (%)MaximumMidpointMinimum
HSG
(%)
MS94 Age (ka BP 1950)
Calculated(Reported)
cyclicity1492 ± 571 y
(1476 ± 584 y)
A
C
B
D
Fig. 5. A) Cycle midpoints for site 609 HSG using the Bond et al. (1999) age model were reported to produce 1476 � 584 (we calculated 1492 � 571) year cyclicity (midpoint tomidpoint) but B) did not exhibit 1470-year spectral power. C) Site 609 HSG plotted with updated chronology contains a D) statistically significant (99% confidence) spectral peak atw1/1390 years (1/1470e1/1330 year range). Upper and lower red dashed lines denote 99% and 95% confidence relative to an AR(1) background, respectively; blue dashed linesdenote 95% confidence of periodicity by F-Test; and green dots indicate narrow-band, significant peaks relative to an AR(1) background. MTM power spectra calculated using theSSA-MTM toolkit (Ghil et al., 2002).
S.P. Obrochta et al. / Quaternary Science Reviews 55 (2012) 23e33 29
any particular climate record will appear to correspond to 14Cproduction (Fig. 11).
If the Site 609 HSG variability is indeed solar in origin, a moreparsimonious explanation is that it is directly related to theobserved variability in the inferred forcings, the w1000- andw2000-year periods that are present in both Holocene atmo-spheric 14C production and ice core 10Be flux (Fig. S4). This isconsistent with both wavelet analysis (Fig. 6) and age uncertaintymodeling (Fig. 7) results that indicate these components arestrongly significant throughout glacial Stages 2 and 3. The lack of
0 5 10 15 20 25 30
.125
.25
.5
1
2
4
8
16
32
Ag
Perio
d (k
.y.)
51015202530
HSG
(%)
Fig. 6. Wavelet analysis of the stacked Holocene HSG record of Bond et al. (2001) (left) andintervals, and the hatched area represents the cone of influence. The 609 record was interpthan 500 years. White areas in the wavelet indicate the nyquist frequency of the Site 609 s
these oscillations during the extended warm periods of GreenlandInterstadial 12 (w43e47 ka) and 13e14 (w50e55 ka) may reflectcirculation changes similar to those proposed for the Holocene(Bond et al., 1997). The low late-glacial sedimentation rates at Site609 (Fig. 3) preclude the detection of 1000-year periodicity from 15to w30 ka, which is indicated by the regions of Fig. 6 from whichshading is removed.
Therefore, the “1500-year cycle” is more likely to be either anartifact of arithmetic averaging or the result of chronologicaluncertainty. Within the GICC05-dated interval (<60 ka) of Site 609,
35 40 45 50 55 60 65 70e (ka)
DSDP Site 609 (Bond et al., 1999) (right). Solid black lines indicate the 95% confidenceolated to a 200-year time step, detrended, and filtered to removed frequencies highereries prior to 200-year interpolation.

0 0.5 1 1.5 2 2.5 3 3.5 40
1
2
3
4
5
6
7
Elapsed time between cycle midpoints (k.y.)
N (C
ycle
s)
Fig. 7. Interval counting the elapsed time between cycle midpoints for the GICC05interval of Site 609 results in a bimodal distribution. The two modes at w1000 andw2000 years average to 1500 years. Wide blue curve is a Gaussian fit to the entiredistribution. Narrow red curves are fit to two distributions split at 1500 years.
0.25 0.5 0.75 1 1.25 1.5 1.75 2 2.25 2.50
200
400
600
800
1000
1200
1400
1600
1800
2000
Frequency (k.y.−1)
Num
ber o
f sig
nific
ant s
pect
ral p
eaks
Fig. 9. Distribution of ensemble-mean and 1s range of significant spectral peaks inalternate age models. Shaded vertical bars indicate sum total within each band.Vertical dashed lines indicate the frequency of millennial-scale spectral peaks in best-fit age model (1/2180, 1/1390, and 1/980 years). Results are plotted in the frequencydomain, causing lower (higher) frequency bands to appear artificially narrow (wide)(See text for explanation of bandwidths).
S.P. Obrochta et al. / Quaternary Science Reviews 55 (2012) 23e3330
the w1500-year average cycle length corresponds to the non-existent mean in a bimodal distribution dominated by w1000-and 2000-year wait times between HSG deposition events (Fig. 7).Considering the entire record, only 4 of the 34 HSG cycles resolvedat Site 609 exhibit a length within 150 years of 1500. These areprimarily limited to the oldest interval (>60 ka), corresponding toMIS 4, which exhibits the highest chronological uncertainty due thesole age constraint being the ss09sea ice flow model. As shown bywavelet analysis, this short interval contributes substantially to therelatively high amplitude of the w1500-year spectral peak evidentin MTM results (Fig. 5). There exists little 1500-year significantvariance in the interval younger than 60 ka, either at Site 609 orwithin the stacked Holocene HSG record of Bond et al. (2001)(Fig. 6). If not the product of averaging or uncertainty, that the
3200 3400 3600 3800 40000
2
4
6
8
10
12
14
N (E
nsem
bles
)
Number of accepted age models
A
Fig. 8. A) Number of age models per ensemble that exhibit 1) less than a 20 cm/k.y. maximThe total ranged from 4048 (ensemble 17) to 3104 (ensemble 45). B) All ageedepth relationshcircles indicate ages based on the ss09sea ice flow model, for which no published error ex
1500-year periodicity is limited to MIS 4 could indicate unique icesheet boundary conditions subsequent to glacial inception.
Furthermore, analysis of a synthetic series indicates that chro-nological uncertainty in the most well-constrained interval (<60ka) of Site 609 is sufficiently large to produce 1500-year periodicityfrom w1000- and 2000-year forcings. A simple series based onequal amplitude sine waves at the 1/1025- and 1/2100-yearfrequencies explains 83% of the variability in the Site 609 HSGseries, and a small proportion of realizations contain 1500-yearperiodicity, even though no 1500-year forcing is specified (Fig. 10).
However, the results of chronological uncertainty modelingcannot entirely discount a 1500-year period. Therefore additionalsynthetic series are also considered. Though the highest correlationis obtained when a weak 1390-year component is included and
0 50 100 150 200 250 300 350 400 4500
10
20
30
40
50
60
70
80
Core Depth (cmbsf)
Age
(ka
b2k)
B
um sedimentation rate and 2) a maximum differential sedimentation rate of 15 cm/k.y.ips (N ¼ 3348) from a representative ensemble. Error bars denote 2s age error. Unfilledists.
1500y0
100
200
300
400
500
600
700
Num
ber o
f sig
nific
ant s
pect
ral p
eaks
(HSG
)
0.5 1 1.5 2 2.5
0
20
40
60
80
100
120
Frequency (k.y.−1)
Num
ber o
f sig
nific
ant s
pect
ral p
eaks
(syn
thet
ic)
2100
1025
A
0.5 1 1.5 2 2.50
100
200
300
400
500
600
700
Num
ber o
f sig
nific
ant s
pect
ral p
eaks
(HSG
)
Frequency (k.y.−1)
0
20
40
60
80
100N
umbe
r of s
igni
fican
t spe
ctra
l pea
ks (s
ynth
etic
)
2100
1390 10
25
B
Fig. 10. Age uncertainty model results of HSG compared to A) age uncertainty modelresults from a series constructed from 1/2100- and 1/1025-year sine waves of equalamplitude. B) Model results with 1/2100 (95% amplitude), 1/1390 (50% amplitude), and1/1025 (100% amplitude) sine waves.
10-1
100
101
102
103
0 0.5 1 1.5 2
HSG
Spe
ctra
l Den
sity
Frequency (k.y.-1)
99%
95%
10-1
100
1010 2 4 6 8 10
14C
Spe
ctra
l Den
sity
99%95%
Frequency (k.y.-1)
F-te
st9590
99
F-te
st
95%
90% CI 14C frequency90±90% CI 14C heterodyne90±95% CI 14C heterodyne95±95% CI 14C heterodyne
95% CI 14C frequencyF-test
95% CI AR(1)99% CI AR(1)Spectral density
HSG significant peak
Fig. 11. MTM power spectrum with F-test (green) and confidence intervals for IntCal09 14C production (analyzed to a 1/100 year frequency, top) and HSG (bottom). Thefrequencies of significant periods in 14C production are shown as dark red and darkblue lines for 95% and 90% confidence respectively as determined by F-test. Lightcolored lines represent heterodynes of all >90% confident peaks in the productionseries to 1/100 years. Black circles indicate the location of discrete spectral peaks in theHSG series.
S.P. Obrochta et al. / Quaternary Science Reviews 55 (2012) 23e33 31
scaled such that it is at 50% amplitude relative to the 1/1025-yearsine wave, this results in only a marginal improvement (r2
increased from 0.83 to 0.86) at the cost of increased complexity.Inclusion of the third sine wave actually slightly diminishes thecorrelation in the millennial band, between 1/2100 and 1/900years, from r2 ¼ 0.81 to 0.78. These observations also supportprimary HSG variability at w1000- and 2000-year intervals.
While Debret et al. (2007) argued for late Holocenew1500-yearHSG periodicity in the stacked record of Bond et al. (2001), spectralpower at this frequency neither passes a significance test at 95%confidence nor is free from record edge effects (Fig. 6). SSA resultsfurther indicate that a discrete 1500-year component is not presentin the Holocene HSG stack, though the second principal component(PC2) oscillates at a nearby frequency (1750 years). Reconstructingthe Holocene HSG stack with only seven components and specifi-cally excluding PC2 (e.g., PC1, PC3-8) yields a series that describes88% of the variability in the raw series, captures all major features inboth the time and frequency domains, and remains consistent withthe Bond et al. (2001) conclusions (Fig. S4).
In addition to the last glacial and Holocene HSG records,a w1000-year period is also detected in a number of Holocene
records (Sirocko et al., 1996; Campbell et al., 1998; deMenocal et al.,2000; Hu et al., 2003; Viau et al., 2006), including a compositeNorthern Hemisphere record of Alpine glacier fluctuations(Crowley, 2010) (Fig. S5). There are comparatively few Holocenerecords that exhibit 1500-year periodicity, with the primaryexception being the sortable silt record of Bianchi and McCave(1999). While Holocene dating is well constrained, its short dura-tion presents challenges for time series analysis (e.g., Wanner et al.,2008). Therefore, the well-dated, key records of the last glaciationmay prove better suited for detection of millennial-scaleperiodicity.
Now that the 1470-year spectral peak in the GISP2 d18O recordhas been shown to be insignificant if not for three D-O Events(Schulz, 2002), absent in NGRIP (Ditlevsen et al., 2007), and, in thecase of HSG, most likely an artifact of averaging with minimalstatistical justification, relatively little support remains for actual1500-year intervals of climate variability. Evidence does exist,however, for solar variations at periods ofw1000 andw2000 years,though more work is required to separate the effects of geomag-netic field variability (St-Onge et al., 2003; Snowball andMuscheler, 2007). If these inferred solar cycles statistically exist,

S.P. Obrochta et al. / Quaternary Science Reviews 55 (2012) 23e3332
then conceivably higher climate sensitivity during the intermediateinterval of global ice volume may explain the apparently largermillennial-scale fluctuations in MIS 3 than in the Holocene.
6. Conclusions
An updated chronology for classic DSDP Site 609 is based on thelatest radiocarbon calibration (Marine09) and Greenland ice corechronology (GICC05). With this new age model, the hematite-stained grain (HSG) ice-rafting proxy, well known for displayinga “1500-year cycle,” exhibits primary variability at 1000- and 2000-year periods. Thus, the original 1476 � 585 year result reported forSite 609 (Bond et al., 1999) is likely an admixture of one longer andone shorter cycle. Chronological modeling indicates that a 1500-year component, if indeed present, would be relatively minor andpotentially the result of age model uncertainty. Taking into accountthis uncertainty, the variability in HSG over the millennialfrequency band is most consistent with dual 1000 and 2000-yearforcing, similar to the variability in inferred solar proxies. There-fore, HSG provides relatively little data supporting actual 1500-yearintervals of climate variability in either the Holocene or last glacial.The number is likely an artifact of averaging and seems to have littlestatistical justification.
Acknowledgments
The scientific contributions of G.C. Bond sparked much fruitfuldebate on the nature of millennial climate. Rusty Lotti-Bondprovided the full dataset for Site 609, without which this workwould not have been possible. We are also indebted to P.A. Baker,B.J. Corliss, and G.S. Dwyer. The work contained in this manuscriptwas conducted at the University of Tokyo Atmosphere and OceanResearch Institute (formerly the Ocean Research Institute) withfunding from the JSPS (Kakenhi 23654080, 22101005, 22244061,20.08826 and the NEXT program GR031). Post-expedition researchfunding was provided by JOI/USSSP.
Appendix A. Supplementary material
Supplementary data related to this article can be found online athttp://dx.doi.org/10.1016/j.quascirev.2012.08.008.
References
Bard, E., Arnold, M., Fairbanks, R.G., Hamelin, B., 1993. 230The324U and 14C agesobtained by mass spectrometry on coral. Radiocarbon 35 (1), 191e199.
Belt, E.S., 1965. Stratigraphy and paleogeography of Mabou Group and relatedMiddle Carboniferous facies, Nova Scotia, Canada. Geological Society of AmericaBulletin 76 (7), 777e802.
Bender, M., Sowers, T., Dickson, M.-L., Orchardo, J., Grootes, P., Mayewski, P.A.,Meese, D.A., 1994. Climate correlations between Greenland and Antarcticaduring the past 100,000 years. Nature 372 (6507), 663e666.
Bianchi, G.G., McCave, I.N., 1999. Holocene periodicity in North Atlantic climate anddeep-ocean flow south of Iceland. Nature 397 (6719), 515e517.
Bond, G.C., Lotti, R., 1995. Iceberg discharges into the North-Atlantic on millennialtime scales during the last glaciation. Science 267 (5200), 1005e1010.
Bond, G.C., Showers, W., Cheseby, M., Lotti, R., Almasi, P., deMenocal, P., Priore, P.,Cullen, H., Hajdas, I., Bonani, G., 1997. A pervasive millennial-scale cycle in NorthAtlantic Holocene and glacial climates. Science 278 (5341), 1257e1266.
Bond, G.C., Showers, W., Elliot, M., Evans, M.N., Lotti, R., Hajdas, I., Bonani, G.,Johnsen, S., 1999. The North Atlantic’s 1e2 kyr climate rhythm: relation toHeinrich events, Dansgaard/Oeschger cycles and the little ice age. In: Clark, P.U.,Webb, R.S., Keigwin, L.d. (Eds.), Mechanisms of Global Climate Change atMillennial Time Scales. AGU, Washington D.C., pp. 35e68.
Bond, G.C., Heinrich, H., Broecker, W., Labeyrie, L., McManus, J., Andrews, J., Huon, S.,Jantschik, R., Clasen, S., Simet, C., Tedesco, K., Klas, M., Bonani, G., Ivy, S., 1992.Evidence for massive discharges of icebergs into the North-Atlantic oceanduring the Last Glacial Period. Nature 360 (6401), 245e249.
Bond, G.C., Broecker, W., Johnsen, S., McManus, J., Labeyrie, L., Jouzel, J., Bonani, G.,1993. Correlations between climate records from North-Atlantic sediments andGreenland Ice. Nature 365 (6442), 143e147.
Bond, G.C., Kromer, B., Beer, J., Muscheler, R., Evans, M.N., Showers, W., Hoffmann, S.,Lotti-Bond, R., Hajdas, I., Bonani, G., 2001. Persistent solar influence on NorthAtlantic climate during the Holocene. Science 294 (5549), 2130e2136.
Braun, H., Christl, M., Rahmstorf, S., Ganopolski, A., Mangini, A., Kubatzki, C.,Roth, K., Kromer, B., 2005. Possible solar origin of the 1470-year glacial climatecycle demonstrated in a coupled model. Nature 438 (70695), 208e211.
Campbell, I.D., Campbell, C., Apps, M.J., Rutter, N.W., Bush, A.B.G., 1998. Late Holo-cene w1500 yr climatic periodicities and their implications. Geology 26 (5),471e473.
Clemens, S.C., 2005. Millennial-band climate spectrum resolved and linked tocentennial-scale solar cycles. Quaternary Science Reviews 24 (5e6), 521e531.
Conolly, J.R., Needham, H.D., Heezen, B.C., 1967. Late Pleistocene and Holocenesedimentation in the Laurentian Channel. The Journal of Geology 75 (2),131e147.
Crowley, T.J., 2010. Assessing the suneclimate relationship in paleoclimate records.In: Schrijver, C.J., Siscoe, G.L. (Eds.), Heliophysics: Evolving Solar Activity and theClimates of Space and Earth. Cambridge University Press, Cambridge.
Crowley, T.J., 1992. North Atlantic deep water cools the Southern Hemisphere.Paleoceanography 7 (4), 489e497.
Debret, M., Bout-Roumazeilles, V., Grousset, F., Desmet, M., McManus, J.F.,Massei, N., Sebag, D., Petit, J.-R., Copard, Y., Trentesaux, A., 2007. The origin ofthe 1500-year climate cycles in Holocene North-Atlantic records. Climates ofthe Past 3 (4), 569e575.
deMenocal, P.B., Ortiz, J.D., Guilderson, T.P., Sarnthein, M., 2000. Coherent high- andlow-latitude climate variability during the Holocene warm period. Science 288(5474), 2198e2202.
Ditlevsen, P.D., Andersen, K.K., Svensson, A., 2007. The DO-climate events areprobably noise induced: statistical investigation of the claimed 1470 yearscycle. Climates of the Past 3 (1), 129e134.
Elliot, M., Labeyrie, L., Bond, G.C., Cortijo, E., Turon, J.-L., Tisnerat, N., Duplessy, J.-C.,1998. Millennial-scale iceberg discharges in the Irminger Basin during the lastglacial period: relationship with the Heinrich Events and environmentalsettings. Paleoceanography 13 (5), 433e446.
EPICA Community Members, 2006. One-to-one coupling of glacial climate vari-ability in Greenland and Antarctica. Nature 444 (7116), 195e198.
Ericson, D.B., Ewing, M., Wollin, G., Heezen, B.C., 1961. Atlantic deep-sea sedimentcores. Geological Society of America Bulletin 72 (2), 193e286.
Exp 303 Scientists, 2006. Site U1308. Proceedings of the Integrated Ocean DrillingProgram Volume 303/306.
Ghil, M., Allen, M.R., Dettinger, M.D., Ide, K., Kondrashov, D., Mann, M.E.,Robertson, A.W., Saunders, A., Tian, Y., Varadi, F., Yiou, P., 2002. Advancedspectral methods for climatic time series. Reviews of Geophysics 40 (1). http://dx.doi.org/10.1029/2000RG000092.
Grootes, P.M., Stuvier, M., 1997. Oxygen 18/16 variability in Greenland snow and icewith 10�3- to 105-year time resolution. Journal of Geophysical Research 102(C12), 26455e66470.
Heezen, B.C., Drake, C.L., 1964. Grand banks slump. AAPG Bulletin 48 (2), 221e225.Heezen, B.C., Hollister, C.D., Ruddiman, W.F., 1966. Shaping of the continental rise by
deep geostrophic contour currents. Science 152 (3721), 502e508.Hodell, D.A., Curtis, J.H., 2008. Oxygen and carbon isotopes of detrital carbonate in
North Atlantic Heinrich Events. Marine Geology 256 (1e4), 30e35.Hodell, D.A., Channell, J.E.T., Curtis, J.H., Romero, O.E., Röhl, U., 2008. Onset of
“Hudson Strait” Heinrich events in the eastern North Atlantic at the end of themiddle Pleistocene transition (w640 ka)? Paleoceanography 23. http://dx.doi.org/10.1029/2008PA001591.
Hollister, C.D., 1967. Sediment Distribution and Deep Circulation in the WesternNorth Atlantic. Ph.D. thesis, Columbia Univesity, New York.
Hu, F.S., Kaufman, D., Yoneji, S., Nelson, D., Shemesh, A., Huang, Y., Tian, J., Bond, G.,Clegg, B., Brown, T., 2003. Cyclic variation and solar forcing of Holocene climatein the Alaskan Subarctic. Science 301 (5641), 1890e1893.
Marlowe, J.I., 1968. Unconsolidated marine sediments in Baffin Bay. Journal ofSedimentary Petrology 38 (4), 1065e1078.
Meese, D.A., Gow, A.J., Alley, R.B., Zielinski, G.A., Grootes, P.M., Ram, M., Taylor, K.C.,Mayewski, P.A., Bolzan, J.F., 1997. The Greenland Ice Sheet Project 2 depth-agescale: methods and results. Journal of Geophysical Research 102 (C12),26,411e26,423.
Needham, H.D., Habib, D., Heezen, B.C., 1969. Upper carboniferous palynomorphs asa tracer of red sediment dispersal patterns in the Northwest Atlantic. TheJournal of Geology 77 (1), 112e120.
NGRIP Project Members, 2004. High-resolution record of Northern Hemisphereclimate extending into the last interglacial period. Nature 431 (7005), 147e151.
Rahmstorf, S., 2003. Timing of abrupt climate change: a precise clock. GeophysicalResearch Letters 30 (10). http://dx.doi.org/10.1029/2003GL017115.
Reimer, P.J., Baillie, M.G.L., Bard, E., Bayliss, A., Beck, J.W., Blackwell, P.G.,BronkRamsey, C., Buck, C.E., Burr, G.S., Edwards, R.L., Friedrich, M., Grootes, P.M.,Guilderson, T.P., Hajdas, I., Heaton, T.J., Hogg, A.G., Hughen, K.A., Kaiser, K.F.,Kromer, B., McCormac, F.G., Manning, S.W., Reimer, R.W., Richards, D.A.,Southon, J.R., Talamo, S., Turney, C.S.M., vanderPlicht, J., Weyhenmeyer, C.E.,2009. IntCal09 and Marine09 radiocarbon age calibration curves, 0e50,000years cal BP. Radiocarbon 51 (4), 1111e1150.
Ruddiman, W.F., 1977. Late Quaternary deposition of ice-rafted sand in the subpolarNorth Atlantic (lat 40 degrees to 65 degrees N). Geological Society of AmericaBulletin 88 (12), 1813e1827.
Schulz, M., 2002. On the 1470-year pacing of DansgaardeOeschger warm events.Paleoceanography 17 (2). http://dx.doi.org/10.1029/2000PA000571.

S.P. Obrochta et al. / Quaternary Science Reviews 55 (2012) 23e33 33
Sirocko, F., Garbe-Schönberg, D., McIntyre, A., Molfino, B., 1996. Teleconnectionsbetween the subtropical monsoons and high-latitude climates during the lastdeglaciation. Science 272 (5261), 526e529.
Snowball, I., Muscheler, R., 2007. Palaeomagnetic intensity data: an Achilles heel ofsolar activity reconstructions. The Holocene 17 (6), 851e859.
St-Onge, G., Stoner, J.S., Hillaire-Marcel, C., 2003. Holocene paleomagnetic recordsfrom the St. Lawrence Estuary, eastern Canada: centennial- to millennial-scalegeomagnetic modulation of cosmogenic isotopes. Earth and Planetary ScienceLetters 209 (1e2), 113e130.
Stuiver, M., Reimer, P.J., 1993. Extended 14C data base and revised CALIB 3.0 14C agecalibration program. Radiocarbon 35 (1), 215e230.
Svensson, A., Andersen, K.K., Bigler, M., Clausen, H.B., Dahl-Jensen, D., Davies, S.M.,Johnsen, S.J., Muscheler, R., Rasmussen, S.O., Röthlisberger, R., PederSteffensen, J., Vinther, B.M., 2006. The Greenland Ice Core Chronology 2005, 15e42 ka. Part 2: comparison to other records. Quaternary Science Reviews 25 (23e24), 3258e3267.
Svensson, A., Andersen, K.K., Bigler, M., Clausen, H.B., Dahl-Jensen, D., Davies, S.M.,Johnsen, S.J., Muscheler, R., Parrenin, F., Rasmussen, S.O., Röthlisberger, R.,Seierstad, I., Steffensen, J.P., Vinther, B.M., 2008. A 60 000 year Greenlandstratigraphic ice core chronology. Climate of the Past 4 (1), 47e57.
Torrence, C., Compo, G.P., 1998. A practical guide to wavelet analysis. Bulletin of theAmerican Meteorological Society 79 (1), 61e78.
Viau, A.E., Gajewski, K., Sawada, M.C., Fines, P., 2006. Millennial-scale temperaturevariations in North America during the Holocene. Journal of GeophysicalResearch 111. http://dx.doi.org/10.1029/2005JD006031.
Wanner, H., Beer, J., Bütikofer, J., Crowley, T.J., Cubasch, U., Flückiger, J., Goosse, H.,Grosjean, M., Joos, F., Kaplan, J.O., Küttel, M., Müller, S.A., Prentice, I.C.,Solomina, O., Stocker, T.F., Tarasov, P., Wagner, M., Widmann, M., 2008. Mid- toLate Holocene climate change: an overview. Quaternary Science Reviews 27(19e20), 1791e1828.
Zimmerman, H.B., 1972. Sediments of the New England continental rise. GeologicalSociety of America Bulletin 83 (12), 3709e3724.