Embed Size (px)
Citation preview

www.deutsche-boerse.com
Quarterly statementQuarter 1 / 2016

2 Deutsche Börse Group quarterly statement Q1/2016
Quarterly results at a glance
Deutsche Börse Group’s net revenue grew by 8 per cent in the first quarter of 2016, to
€648.5 million (Q1/2015: €600.1 million). The Eurex segment was the largest driver of growth dur-
ing the quarter, generating considerable additional volume in equity index derivatives trading and in
commodities products. Operating costs amounted to €340.1 million (Q1/2015: €293.0 million). However, adjusted for non-
recurring items (in particular in connection with the planned merger with London Stock Exchange
Group plc, as well as efficiency programmes), operating costs stood at €301.2 million (Q1/2015:
€282.5 million). The increase was solely due to consolidation effects. Group earnings before interest and tax (EBIT) amounted to €310.6 million (Q1/2015: €312.3 million).
Adjusted for non-recurring items, Deutsche Börse Group increased its EBIT by 9 per cent, to
€349.5 million (Q1/2015: €319.2 million). Basic earnings per share amounted to €1.10 for an average of 186.7 million shares. Adjusted for non-
recurring items, they amounted to €1.25 (Q1/2015: €1.21 for 184.2 million shares; adjusted: €1.24). This result is in line with Deutsche Börse Group’s expectations for the 2016 financial year. A dividend of €2.25 per share will be proposed to the Annual General Meeting on 11 May 2016.
Material events at a glance
On 9 March 2016, Deutsche Börse AG entered into an agreement with NASDAQ, Inc. regarding the
sale of International Securities Exchange Holdings, Inc. (ISE). On 16 March 2016, Deutsche Börse AG and London Stock Exchange Group plc (LSE Group) reached
agreement on the terms of a recommended all-share merger of equals.
Q1/2016: Deutsche Börse Group continues
growth path

3 Earnings releases
Fundamental information about the Group
The fundamental information about the Group described on pages 18 to 30 of the 2015 financial
report is still valid in principle. However, there have been changes to the basis of consolidation.
Comparability of figures
Compared to the first quarter of 2015, the following changes to the basis of consolidation occurred:
Effective 4 May 2015, APX Holding group was acquired. As wholly owned subsidiaries of EPEX Spot
SE, the APX Holding group companies have been included in full in Deutsche Börse Group’s consoli-
dated financial statements since May 2015 (Eurex segment). Effective 15 October 2015, Deutsche Börse AG acquired all shares in 360T Beteiligungs GmbH (360T)
and has included the company in full in its consolidated financial statements since that date (Eurex
segment). Effective 25 February 2016, Deutsche Börse AG sold its interest in Infobolsa S.A. Until that date, BME
and Deutsche Börse had each held 50 per cent of the interests in Infobolsa S.A. and its subsidiaries
(Market Data + Services segment).
Within Deutsche Börse Group, a series of organisational changes took place, affecting segment reporting:
Xetra segment Explicit recognition of revenue from listings (which were previously recognised under the “Other” item)
Clearstream segment Breakdown of custody and settlement fees into international business (ICSD), domestic business (Ger-
many, CSD), and Investment Funds Services (prior to this, breakdown was only into custody and set-
tlement)
Market Data + Services segment Merger of the Tools and Market Solutions business segments into Infrastructure Services Information business segment was renamed Data Services Reassignment of revenue from regulatory services, from Tools to Data Services Reassignment of EEX connection revenues to Eurex
Business development in Q1/2016 and its reporting are based on a consolidated profit and loss account
excluding divestment of ISE ( page 12). In accordance with the requirements of IFRS 5, Deutsche
Börse Group, in addition, publishes a consolidated income statement and a consolidated balance sheet,
both taking into account ISE as discontinued operation ( pages 13 to 15).
Q1/2016 earnings releases

4 Deutsche Börse Group quarterly statement Q1/2016
Material events
Merger with the London Stock Exchange Group
The Executive Board of Deutsche Börse and the Group Board of London Stock Exchange Group plc
confirmed on 23 February 2016 that they are in detailed discussions about a potential merger of
equals of the two businesses. On 16 March Deutsche Börse AG and London Stock Exchange Group plc
announced that they had reached agreement on the terms of a recommended allshare merger of equals.
Under this industry-defining combination, the companies will merge to create a leading Europe-based
global markets infrastructure group, resulting in a significantly enhanced product offering for customers
and in leading positions across multiple asset classes (derivatives, equities, fixed income, FX and energy
products). The newly formed combined group will have the ability to serve global customers across the
investment, trading and risk and balance sheet management life cycle. The merger will deliver a plat-
form of choice for risk and balance sheet management, increasing safety, resiliency and transparency in
global markets.
The main advantages of the planned merger are: Highly complementary combination across divisions and asset classes which accelerates London Stock
Exchange Group’s and Deutsche Börse’s respective growth strategies and results in a significantly en-
hanced product offering for customers Through its enhanced position in the global market infrastructure sector, well placed to adapt to indus-
try and regulatory dynamics, able to compete globally, and create shareholder value based on a track
record of execution and deep understanding of customers’ needs Leading positions across multi-asset classes (derivatives, equities, fixed income, FX and energy prod-
ucts) and ability to service global customers across the investment, trading and risk and balance sheet
management life cycle Delivered through an attractive portfolio of leading businesses in capital markets, post-trade, index and
information services and technology with diversified revenues across divisions Bringing together London, a leading global financial centre, and Frankfurt, the home of the ECB and
access point to Europe’s largest economy, in an industry-defining combination Enhances a global footprint, strengthening the combined group’s reach and distribution The newly formed holding company (UK TopCo) has been incorporated in the UK and has a unitary
board with equal representation from London Stock Exchange Group and Deutsche Börse London Stock Exchange Group plc will maintain a one-tier-board system, while Deutsche Börse AG will
maintain a two-tier board system subject to applicable co-determination rules. The combined group will have a balanced governance structure and maintain its headquarters in
Frankfurt and London. The existing regulatory framework of all regulated entities within the combined group will remain un-
changed, subject to customary and final regulatory approvals. London Stock Exchange Group and Deutsche Börse AG will continue to be subject to tax in their re-
spective countries of incorporation. Delivering significant value creation through cost synergies of €450 million per annum, achieved in
year three post completion, and significant opportunities for revenue synergies.
The completion of the transaction is subject to the approval by competition and supervisory authorities.
The Group is in constructive talks with the respective authorities to explain the compelling strategic
rationale and the advantages of the planned merger for all stakeholders and in parallel started to pre-
pare all the necessary approvals, including regulatory, anti-trust and shareholder approvals. Further
details on the planned merger of the two companies, as well as the announcement made under Rule 2.7
of the UK Takeover Code can be found at www.mergerdocuments-db-lseg.com.
5 Earnings releases
Disposal of International Securities Exchange
On 9 March 2016, Deutsche Börse AG and NASDAQ, Inc. entered into an agreement regarding the sale
of International Securities Exchange Holdings, Inc. (ISE), operator of three US equity options exchanges,
and ISE’s holding company U.S. Exchange Holdings, Inc. to NASDAQ for a total cash consideration of
US$1.1 billion. The agreement excludes ownership interests in BATS Global Markets, Inc. and in Digital
Asset Holdings LLC, which will continue to be owned by Deutsche Börse. At the time of the acquisition,
ISE was allocated to the Eurex segment from a balance sheet perspective. With the divestiture, the
goodwill of the Eurex segment will only reduce partially, so that a high triple-digit million euro disposal
gain is expected for Deutsche Börse at Group level. The transaction has received anti-trust clearance
already and is now still subject to the approval by supervisory authorities. The completion of the transac-
tion is anticipated for mid-2016.
In the context of its growth strategy “Accelerate”, Deutsche Börse Group implemented far-reaching organ-
isational changes and defined the Group’s financial targets. As part of that, the company is constantly
evaluating the competitive positioning, profitability, ability to innovate, and strategic benefits of all its
shareholdings and own activities. Deutsche Börse pursues the goal to become the number one or two
player in every business in which the company operates. This goal requires an active management of
the business portfolio. In areas where Deutsche Börse is not able to meet this goal, the company is
evaluating other options.
Results of operations
Results of operations of the Group in the first quarter 2016
Key figures on results of operations of Deutsche Börse Group (reported) Q1/2016 Q1/2015 Change %
Net revenue €m 648.5 600.1 8
Operating costs €m 340.1 293.0 16
EBIT €m 310.6 312.3 – 1
Tax rate % 27.0 25.9 4
Net profit for the period attributable to Deutsche Börse AG shareholders €m 205.4 222.3 – 8
Earnings per share (basic) € 1.10 1.21 – 9
Key figures on results of operations of Deutsche Börse Group (adjusted) Q1/2016 Q1/2015 Change %
Net revenue €m 648.5 600.1 8
Operating costs €m 301.2 282.5 7
EBIT €m 349.5 319.2 9
Tax rate % 27.0 26.0 4
Net profit for the period attributable to Deutsche Börse AG shareholders €m 233.8 228.6 2
Earnings per share (basic) € 1.25 1.24 1

6 Deutsche Börse Group quarterly statement Q1/2016
Compared to the first quarter of 2015, Deutsche Börse Group’s net revenue increased by 8 per cent.
The main driver of this development was the Eurex segment with a growth rate of 25 per cent, which
was due mainly to the commodities business of European Energy Exchange AG (EEX) and high levels
of trading activity in equity index derivatives. The Clearstream and Market Data + Services segments
achieved solid results, while the cash market business lagged behind the first quarter of the previous
year, given the very high trading activity and considerably higher index levels at that time. Net revenue
associated with the changes to the basis of consolidation (as described before) amounted
to €21.6 million.
Operating costs were higher than in the same quarter of the previous year, given increased non-recurring
and consolidation effects. Non-recurring items increased by €28.4 million year-on-year, to €38.9 million.
As expected, these items include mainly integration costs for acquired companies (€6.7 million) as well
as fees associated with litigation (€7.2 million) and efficiency measures (€5.5 million). Non-recurring
items also include the costs incurred in connection with the planned merger with the LSE Group
(€15.7 million) and the disposal of ISE (€3.8 million). Changes in consolidated activities resulted in
costs of €17.6 million in the first quarter of 2016. However, excluding non-recurring and consolidation
effects, costs remained stable.
Deutsche Börse Group’s financial result amounted to €–20.0 million in the first quarter of 2016
(Q1/2015: €5.7 million). The decrease as compared to the prior-year quarter results firstly from positive
currency translation effects, amounting to €18.1 million, as well as secondly from higher interest ex-
penses due to the acquisitions of 360T and STOXX in the previous year.
As expected, the adjusted tax rate in the first quarter of 2016 was 27.0 per cent (Q1/2015: 26.0 per
cent).

7 Earnings releases
Results of operations by segment in the first quarter 2016
Eurex segment
Eurex segment: key indicators Q1/2016 Q1/2015 Change
FINANCIAL KEY FIGURES €m €m %
Net revenue
European equity index derivatives 124.5 102.8 21
European interest rate derivatives 47.3 45.6 4
European equity derivatives 9.9 9.9 0
US options (ISE) 38.0 35.4 7
Commodities (EEX) 55.0 40.3 36
Foreign exchange (360T) 15.8 – –
Other (including repo business and net interest income from banking business) 23.3 16.6 40
Total net revenue 313.8 250.6 25
Operating costs 159.7 122.5 30
EBIT 156.0 132.9 17
EBIT (adjusted) 176.0 130.9 34
PERFORMANCE INDICATORS
Financial derivatives m contracts m contracts %
Total Eurex and ISE1) 627.7 543.8 15
European derivatives1) 467.6 416.2 12
European equity index derivatives2) 255.7 214.4 19
European interest rate derivatives 131.7 123.9 6
European equity derivatives2) 76.8 74.8 3
US options (ISE) 160.1 127.6 25
Commodities3) 4) TWh / m t C02 TWh / m t C02 %
Electricity 1,033.8 786.7 31
Gas 545.7 243.9 124
Emissions trading 242.8 161.4 50
FX business €bn €bn %
Average daily outstanding volume on 360T 57.4 54.9 5
1) The total shown does not equal the sum of the individual figures as it includes other traded products such as ETFs, volatility, agricultural and precious metals
derivatives.
2) Dividend derivatives have been allocated to the equity index and equity derivatives.
3) Volume traded on EEX in terawatt-hours (TWh) for power and gas trading and in million CO2 tonnes for trading in emission rights
4) Including the volumes traded on EPEX, APX/Belpex, and (since 17 February 2016) on SEEPEX in the power segment, as well as the volumes traded on Powernext
and Gaspoint Nordic in the gas segment (Gaspoint Nordic new for 2016)
The Eurex segment was very successful during the first quarter of 2016, even surpassing the strong
results achieved in its trading business in Q1/2015. 360T Beteiligungs GmbH, consolidated since the
first quarter of 2015, and APX Holding group (APX), consolidated since the beginning of May 2015,
contributed €15.8 million and €6.5 million, respectively, to net revenue. Operating costs included con-
solidation effects in the amount of €11.7 million for 360T, and €6.0 million for APX.
8 Deutsche Börse Group quarterly statement Q1/2016
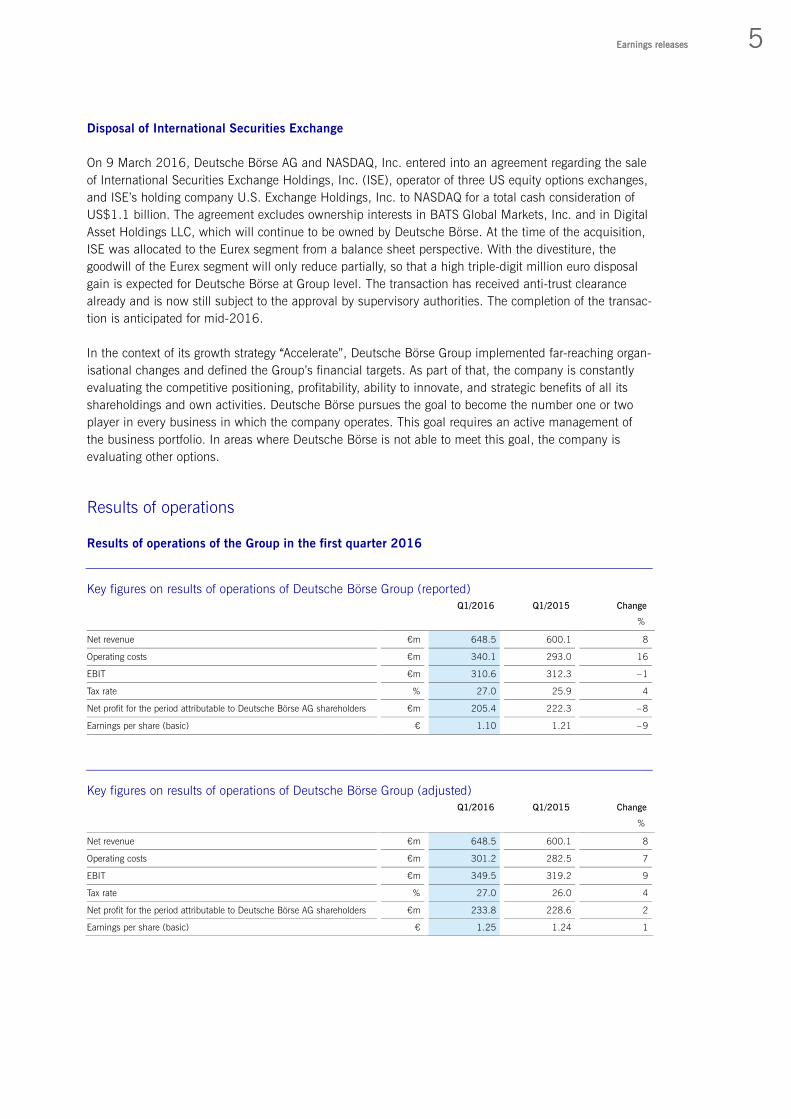
Index derivatives remained the European product group with the strongest revenue and the biggest
growth rate, in particular futures and options based on EURO STOXX® index products, with a combined
number of 197.1 million contracts, used for hedging purposes across all asset classes.
The number of US options contracts traded on ISE rose year-on-year in the first quarter of 2016. Thus,
ISE achieved a considerable increase in an overall slightly growing market environment, maintaining its
position as the fourth largest options exchange in the US.
The EEX group was able to markedly grow its commodities business. The growth rate was mainly due to
the increased power derivatives market share, in particular in Germany, France and Italy. In its core
German power derivatives market, EEX grew despite the overall declining market volume. Clients were
particularly attracted by the integrated clearing solution and the geographical expansion of the product
range. The EEX group was also able to achieve growth in the trading of natural gas products, given new
products and the high pricing quality – in February, the volume traded on the PEGAS® platform sur-
passed 200 TWh for the first time.
Regarding foreign exchange trading on the 360T® platform, daily volumes increased as well. In the peri-
od under review, 360T’s growth rate was stronger than that of comparable FX trading platforms.
Xetra segment
Xetra segment: key indicators
Q1/2016 Q1/2015 Change
FINANCIAL KEY FIGURES €m €m %
Net revenue
Trading 28.9 34.0 – 15
Central counterparty for equities 7.3 7.8 – 6
Listing 2.9 3.3 – 12
Other 4.3 4.1 5
Total net revenue 43.4 49.2 – 12
Operating costs 20.3 17.8 14
EBIT 23.1 31.8 – 27
EBIT (adjusted) 24.7 31.9 – 23
PERFORMANCE INDICATORS €bn €bn %
Trading volume (order book turnover, single-counted)
Xetra® 355.9 395.2 – 10
Börse Frankfurt 11.6 17.5 – 34
Tradegate Exchange 17.8 24.0 – 26
The business development on the German cash market lagged behind the previous year's development
for all marketplaces, including Xetra, Frankfurt Stock Exchange and Tradegate. This was in line with the
trend on the other European cash markets, which had received massive support from the introduction of
ECB’s bond acquisition programme during the first quarter of 2015. Market participants did not reduce
their trading activities compared to the first quarter of 2015, measured in terms of order executions.
However, lower company market valuations in conjunction with modest investor interest led to a decline
of the average value of executed orders, which ultimately translated into a decrease in overall trading
volumes (number x price).
9 Earnings releases
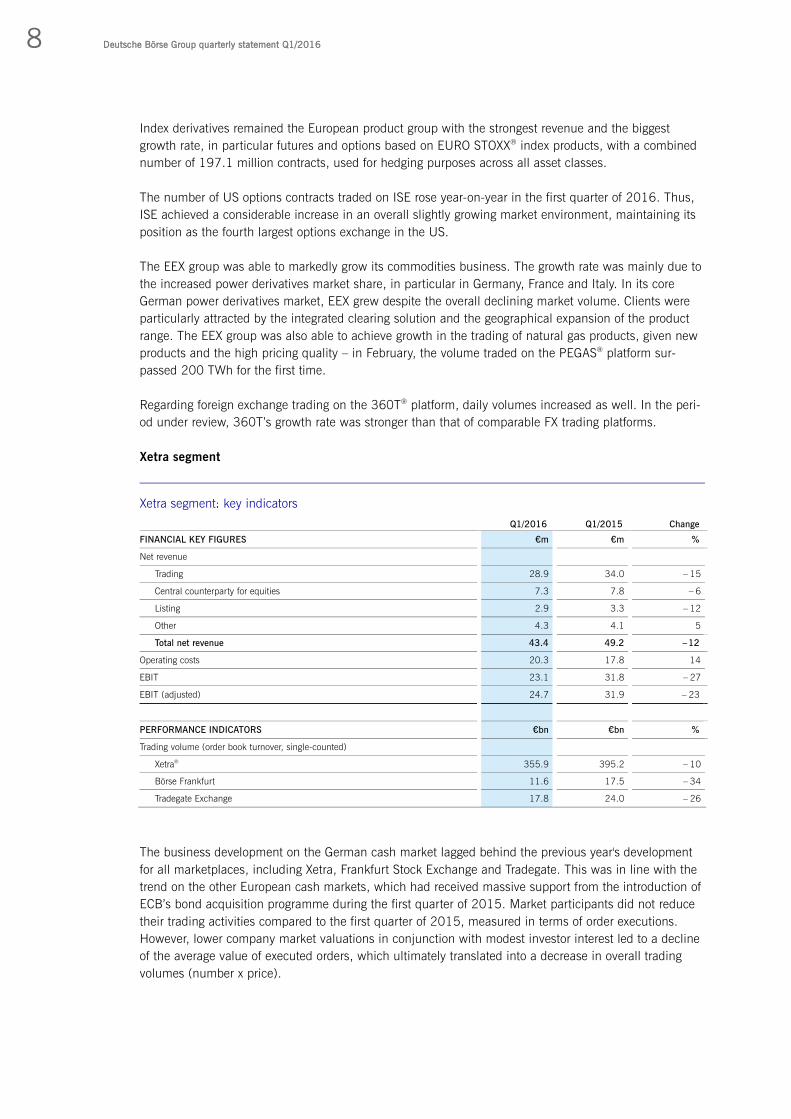
Clearstream segment
Clearstream segment: key indicators
Q1/2016 Q1/2015 Change
FINANCIAL KEY FIGURES €m €m %
Net revenue
International business (ICSD) 98.6 100.3 – 2
Domestic business (CSD) 29.5 33.0 – 11
Investment Funds Services 29.2 31.6 – 8
Global Securities Financing 17.1 16.6 2
Net interest income from banking business 12.9 9.3 39
Total net revenue 187.3 190.8 – 2
Operating costs 106.3 99.6 7
EBIT 81.3 91.2 – 11
EBIT (adjusted) 93.8 99.2 – 5
PERFORMANCE INDICATORS
International business (ICSD) € trillion € trillion %
Value of securities deposited (average value) 6.7 6.6 2
Domestic business (CSD) € trillion € trillion %
Value of securities deposited (average value) 5.8 6.2 – 6
Investment Funds Services € trillion € trillion %
Value of securities deposited (average value) 0.5 0.4 13
Global Securities Financing €bn €bn %
Outstanding volume (average value) 530.2 628.4 – 16
Net interest income from banking business €bn €bn %
Outstanding volume (daily average value)1) 12.9 13.3 – 3
1) Including approximately €1.5 billion (Q1 2015: €1.5 billion) currently restricted by relevant EU and US sanction programmes
While the Clearstream segment was able to slightly increase its share in securities under custody in the
International Central Securities Depository (ICSD) business, the domestic CSD business and the funds
business declined given the general development on the German cash and funds markets. In the inter-
national business, the value of securities held in custody increased slightly. However, the number of
transactions declined year-on-year due to the lower trading activity of market participants. Cash custom-
er deposits were down 3 per cent compared to the previous year. However, since 47 per cent of the daily
cash balances are denominated in US dollars, rebounding interest rates in the US lead to an increase in
net interest income from the banking business by 40 per cent. The domestic CSD business closely re-
flects the business development on the German cash market: the declining trading activity led to a de-
cline in settlement volumes and – compared to the previous year – significantly lower index levels, which
ultimately translated into a reduction in value of the assets under custody. The Investment Funds Ser-
vices business development was in line with general market trends, which were slightly declining as well.
In the Global Securities Financing (GSF) business, the average outstanding volume decreased by 16 per
cent. After the ECB provided plenty of liquidity on the market as part of its quantitative easing pro-
gramme, volumes declined considerably, in particular with regard to the GC Pooling® product. Simulta-
neously, orders shifted towards smaller lending volumes with higher pricing, leading to an overall in-
crease in net revenue for the GSF business.

10 Deutsche Börse Group quarterly statement Q1/2016
Market Data + Services segment
Market Data + Services segment: key indicators
Q1/2016 Q1/2015 Change
FINANCIAL KEY FIGURES €m €m %
Net revenue
Data Services1) 41.3 46.2 – 11
Index 28.9 27.9 4
Infrastructure Services2) 33.8 35.4 – 5
Total net revenue 104.0 109.5 – 5
Operating costs 53.8 53.1 1
EBIT 50.2 56.4 – 11
EBIT (adjusted) 55.0 57.2 –7
1) Until 31 December 2015 “Information”
2) Until 31 December 2015 “Tools” and “Market Solutions”
The weaker business development in Q1/2016 partially explains the segment’s net revenue development.
In addition, the decline compared to the first quarter of 2015 was attributable to non-recurring effects: in
the previous year, audit income was concentrated on the first quarter, and decreased by €6.6 million
year-on-year in Q1/2016. In addition, EEX connection revenues have been allocated to the Eurex seg-
ment since the first quarter of 2016, prior-year figures have been adjusted accordingly.
The segment’s business divisions have been subject to restructuring: since 1 January 2016, the three
business areas Data Services, Index, and Infrastructure Services replace the former business areas In-
formation, Index, Tools, and Market Solutions. Revenue grew by 4 per cent in the Index business area,
driven mainly by the 19 per cent increase in trading volume of index contracts in the Eurex segment.
Assets under management in Exchange Traded Funds (ETFs) grew by 3 per cent despite lower index
levels. Revenue with structured products was below the level of the previous year. In the Data Services
business area (formerly Information), net revenue declined, which was particularly due to the deteriorat-
ing number of audits year-on-year. Current business was stable at Infrastructure Services – the slightly
negative differences were attributable to non-recurring effects.
Financial position
Development of management indicators
The company’s clients generally expect it to maintain conservative interest service cover and leverage
ratios, and to achieve good credit ratings. Therefore, the Group targets a minimum consolidated interest
service cover ratio (defined as the ratio of EBITDA to interest expenses from financing activities) of 16.
During the first quarter of 2016, Deutsche Börse Group achieved this target, with an interest service
cover ratio of 27.9 (Q1/2015: 32.0). This figure is based on relevant interest expenses of €13.8 million
and adjusted EBITDA of €384.3 million.

11 Earnings releases
Moreover, Deutsche Börse Group targets a maximum ratio of interest-bearing gross debt to EBITDA of 1.5
at Group level. During the first quarter of 2016, the Group achieved a 1.5 ratio of gross debt to EBITDA.
This figure is based on gross debt of €2,237.6 million, and adjusted EBITDA of €384.3 million.
Dividends
For financial year 2015, Deutsche Börse AG is proposing that the Annual General Meeting resolve to pay
a dividend of €2.25 per no-par value share (2014: €2.10). This dividend corresponds to a distribution
ratio of 55 per cent of net profit for the period attributable to Deutsche Börse AG shareholders, adjusted
for the special factors described in the section on the results of operations (2014: 58 per cent, also
adjusted for special items). Given 186.7 million no-par value shares bearing dividend rights, this would
result in a total dividend of €420.1 million (2014: €386.8 million). The aggregate number of shares
bearing dividend rights is produced by deducting the 6.3 million treasury shares from the ordinary share
capital of 193.0 million shares.
Report on post-balance sheet date events
No events requiring disclosure in the report on post-balance sheet date events occurred between the end
of the quarter and the time of publication of the quarterly statement.
Risks and opportunities
Deutsche Börse Group provides detailed information on its operating environment, strategy, principles,
organisation, processes, methods and concepts of its risk management as well as the measures imple-
mented to minimise risks in its 2015 financial report on pages 76 to 98. Detailed information about
the opportunities and opportunities management can be found also in the 2015 financial report on
pages 98 to 105.
At present, the Executive Board cannot identify any significant change in the Group’s risk profile, as
described therein.
Outlook
For the remainder of the 2016 financial year, Deutsche Börse Group does not expect any material devia-
tion from the forecasts for its operating environment made in its 2015 consolidated financial statements.
The Group expects an increase of net revenue in the range between 5 and 10 per cent, and of the oper-
ating costs in the – corresponding – range between 0 and 5 per cent (excluding non-recurring effects).
Regarding EBIT and the profit for the period attributable to shareholders of Deutsche Börse AG, annual
growth rates of approximately 10 to 15 per cent (excluding non-recurring effects) are projected for the
forecast period and the following years.

12 Deutsche Börse Group quarterly statement Q1/2016
Excluding divestment of International Securities Exchange (ISE)
for the period 1 January to 31 March 2016
Quarter ended Quarter ended
31 Mar 2016 31 Mar 2015
€m €m
Sales revenue 739.4 679.8
Net interest income from banking business 18.6 8.4
Other operating income 4.6 5.2
Total revenue 762.6 693.4
Volume-related costs – 114.1 – 93.3
Net revenue (total revenue less volume-related costs) 648.5 600.1
Staff costs – 153.0 – 135.0
Depreciation, amortisation and impairment losses – 35.3 – 34.1
Other operating expenses – 151.8 – 123.9
Operating costs – 340.1 – 293.0
Result from equity investments 2.2 5.2
Earnings before interest and tax (EBIT) 310.6 312.3
Financial income 0.4 19.4
Financial expense – 20.4 – 13.7
Earnings before tax (EBT) 290.6 318.0
Other tax – 0.4 – 0.4
Income tax expense – 78.1 – 82.1
Net profit for the period 212.1 235.5
Net profit for the period attributable to Deutsche Börse AG shareholders 205.4 222.3
Net profit for the period attributable to non-controlling interests 6.7 13.2
Earnings per share (basic) (€) 1.10 1.21
Earnings per share (diluted) (€) 1.10 1.21
Consolidated profit and loss account

13 Shortened financial statements
Taking into account ISE as discontinued operation
for the period 1 January to 31 March 2016
Quarter ended
(restated)
Quarter ended
31 Mar 2016 31 Mar 2015
€m €m
Sales revenue 658.4 617.7
Net interest income from banking business 18.6 8.4
Other operating income 4.6 5.2
Total revenue 681.6 631.3
Volume-related costs – 71.1 – 66.6
Net revenue (total revenue less volume-related costs) 610.5 564.7
Staff costs – 142.6 – 125.2
Depreciation, amortisation and impairment losses – 31.0 – 28.0
Other operating expenses – 142.3 – 117.8
Operating costs – 315.9 – 271.0
Result from equity investments 1.6 6.9
Earnings before interest and tax (EBIT) 296.2 300.6
Financial income 0.2 19.4
Financial expense – 20.4 – 13.7
Earnings before tax (EBT) 276.0 306.3
Other tax – 0.3 – 0.4
Income tax expense – 74.4 – 79.4
Net profit for the period from continuing operations 201.3 226.5
Net profit for the period from discontinued operations 10.8 9.0
Net profit for the period 212.1 235.5
Net profit for the period attributable to Deutsche Börse AG shareholders 205.4 222.3
Net profit for the period attributable to non-controlling interests 6.7 13.2
Earnings per share (basic) (€) 1.10 1.21
from continuing operations 1.04 1.16
from discontinued operations 0.06 0.05
Earnings per share (diluted) (€) 1.10 1.21
from continuing operations 1.04 1.16
from discontinued operations 0.06 0.05
Consolidated income statement

14 Deutsche Börse Group quarterly statement Q1/2016
Taking into account ISE as discontinued operation
as at 31 March 2016
Assets
31 Mar 2016 31 Dec 2015 31 Mar 2015
€m €m €m
NON-CURRENT ASSETS
Intangible assets
Software 204.6 225.4 208.7
Goodwill 2,672.0 2,898.8 2,377.8
Payments on account and construction in progress 167.8 152.5 125.4
Other intangible assets 874.6 1,356.3 1,136.2
3,919.0 4,633.0 3,848.1
Property, plant and equipment
Fixtures and fittings 35.4 40.3 37.5
Computer hardware, operating and office equipment 62.2 68.7 62.9
Payments on account and construction in progress 1.6 0.7 1.2
99.2 109.7 101.6
Financial assets
Investments in associates and joint ventures 39.0 38.5 33.1
Other equity investments 189.2 219.4 213.6
Receivables and securities from banking business 1,664.8 2,018.6 1,390.7
Other financial instruments 18.6 32.3 29.1
Other loans 0.6 0.2 1.0
1,912.2 2,309.0 1,667.5
Financial instruments of the central counterparties 9,585.6 7,175.2 8,787.6
Other non-current assets 11.8 11.7 11.9
Deferred tax assets 61.6 148.3 159.6
Total non-current assets 15,589.4 14,386.9 14,576.3
CURRENT ASSETS
Receivables and other current assets
Financial instruments of the central counterparties 167,921.3 126,289.6 200,733.5
Receivables and securities from banking business 19,639.3 10,142.9 14,600.9
Trade receivables 438.1 554.1 423.9
Receivables from related parties 2.0 4.7 1.8
Income tax receivables 90.9 94.2 79.4
Other current assets 580.9 1,022.3 313.9
Assets held for sale1) 857.3 0 0
189,529.8 138,107.8 216,153.4
Restricted bank balances 24,391.2 26,870.0 36,038.9
Other cash and bank balances 706.4 711.1 929.6
Total current assets 214,627.4 165,688.9 253,121.9
Total assets 230,216.8 180,075.8 267,698.2
Consolidated balance sheet

15 Shortened financial statements
Equity and liabilities
31 Mar 2016 31 Dec 2015 31 Mar 2015
€m €m €m
EQUITY
Subscribed capital 193.0 193.0 193.0
Share premium 1,326.0 1,326.0 1,249.0
Treasury shares – 315.5 – 315.5 – 443.0
Revaluation surplus – 18.7 – 5.3 – 35.9
Accumulated profit 2,629.6 2,357.9 2,748.1
Shareholders’ equity 3,814.4 3,556.1 3,711.2
Non-controlling interests 139.6 139.0 387.8
Total equity 3,954.0 3,695.1 4,099.0
NON-CURRENT LIABILITIES
Provisions for pensions and other employee benefits 167.4 140.7 181.6
Other non-current provisions 119.6 131.7 104.5
Deferred tax liabilities 370.5 581.3 515.3
Interest-bearing liabilities 2,537.6 2,546.5 1,460.7
Financial instruments of the central counterparties 9,585.6 7,175.2 8,787.6
Other non-current liabilities 4.2 10.0 12.6
Total non-current liabilities 12,784.9 10,585.4 11,062.3
CURRENT LIABILITIES
Tax provisions 268.4 316.7 320.7
Other current provisions 142.8 174.5 113.5
Financial instruments of the central counterparties 167,556.8 126,006.5 199,668.4
Liabilities from banking business 20,017.3 11,681.4 15,588.5
Other bank loans and overdrafts 45.2 42.2 0.9
Trade payables 233.9 372.8 211.6
Liabilities to related parties 1.8 1.8 2.3
Cash deposits by market participants 24,391.2 26,869.0 36,037.7
Other current liabilities 613.6 330.4 593.3
Liabilities associated with assets held for sale1) 206.9 0 0
Total current liabilities 213,477.9 165,795.3 252,536.9
Total liabilities 226,262.8 176,380.7 263,599.2
Total equity and liabilities 230,216.8 180,075.8 267,698.2
1) Including operating activities of International Securities Exchange (ISE)
Contact
Investor Relations
Phone +49-(0) 69- 2 11-1 16 70
Fax +49-(0) 69- 2 11-1 46 08
E-mail [email protected]
www.deutsche-boerse.com/ir_e
Publication date
27 April 2016
Publications service
The 2015 corporate report may be obtained from
the publications service of Deutsche Börse Group.
Phone +49-(0) 69- 2 11-1 15 10
Fax +49-(0) 69- 2 11-1 15 11
Downloads at
www.deutsche-boerse.com/annualreport
Reproduction – in whole or in part – only with
the written permission of the publisher
Registered trademarks
Eurex®, GC Pooling® and Xetra® are registered trade-
marks of Deutsche Börse AG. EURO STOXX 50® and
STOXX® are registered trademarks of STOXX Ltd. 360T®
is a registered trademark of 360 Treasury Systems AG.
TRADEGATE® is a registered trademark of Tradegate AG.
PEGAS® is a registered trademark of Powernext SA.


Published byDeutsche Börse AG60485 Frankfurt /MainGermanywww.deutsche-boerse.com
Order number 1005-4613
Financial calendar27 April 2016Publication Q1/2016 results
11 May 2016Annual General Meeting
1 June 2016Investor day
27 July 2016Publication half-yearly financial report 2016
28 October 2016Q3/2016 results