Embed Size (px)
Citation preview

Annual Report 2002Focus on ProcessD
euts
che
Bör
se G
roup
Ann
ual R
epor
t 20
02
Glossary
At equity Measurement of an equity interest using the equity method,
under which the shares acquired are initially recognized at cost. In
subsequent periods, the carrying amount of the shares increases or
decreases in line with the investor’s share in the investee’s net profit
or loss for the period. Distributions received from the investee reduce
the carrying amount of the shares.
CCP ➔ Central Counterparty
CDAX® An index comprising all German securities in the ➔ Prime
and General Standards across all sectors and segments.
Central Counterparty For cash market trading: a central counterparty
for exchange and off-exchange transactions that acts as a legal inter-
mediary between trading parties, thus ensuring anonymity and mini-
mizing the default risk. For derivatives transactions ➔ clearing: a
similar function that allows Eurex market participants to settle the
entire process chain of a trade over a single system.
Clearing The netting and settlement of receivables and liabilities
arising from securities and derivatives transactions; determination
of the bilateral net debt of buyers and sellers.
Commercial paper A short-term (between 2 and 364 days) promis-
sory note of a company that is generally issued on a discount basis
and repaid at the principal amount.
Cost of capital The Weighted Average Cost of Capital (WACC) of a
company (cost of equity and debt) that reflects the ratio of available
equity to debt in an accounting period. The cost of debt is governed
by the actual funding terms, whereby interest on borrowings is tax
deductible (tax shield). The cost of equity is the after-tax return on
a share that an investor can expect using the Capital Asset Pricing
Model (CAPM).
Custody The safekeeping and administration of securities for others.
A custody account (similar to an account for money transactions) is
established for each client. This account contains details of the types,
nominal amounts or quantities, numbers, etc. of the securities held,
as well as the name and address of the account holder.
DAX® An index calculated by Deutsche Börse every 15 seconds. It
depicts the performance of the 30 German companies with the great-
est ➔ exchange volume and ➔ market capitalization (blue chips).
Derivative A highly liquid standardized financial instrument whose
value is linked to changes in the price of an ➔ underlying asset. The
most common examples of derivatives are ➔ futures and ➔ options.
eb.rexx® The Deutsche Börse index family for fixed-income securities.
The indices are based on prices on the Eurex Bonds trading plat-
form.
ETF – Exchange Traded Funds Mutual funds whose shares can be
bought or sold in continuous trading on the stock exchange, and that
track the performance of the index on which they are based. ➔ XTF
Exchange volume The total amount of trades executed for a security
or on an entire market within a defined period of time; expressed as
a currency amount (euros, US dollars, etc.).
Future A derivatives contract in which sellers agree to deliver, and
buyers agree to purchase, a certain quantity of an underlying at a
predetermined price on a specified date.
General Standard An admission standard on the Frankfurt Stock
Exchange. Unlike the ➔ Prime Standard, issuers need only meet the
minimum statutory requirements (such as an annual report and ad-hoc
disclosures) to be admitted to and remain in the General Standard.
iBoxx® Real-time indices and prices for bonds. Calculated by
Deutsche Börse on the basis of real-time prices from leading invest-
ment banks.
Market capitalization An indicator of a company’s market value that
corresponds to the market price multiplied by the number of shares
listed on the exchange. Market capitalization can be calculated for
individual sectors or for the entire equities market.
MDAX® A selection index in the ➔ Prime Standard for midcaps in
traditional sectors. Like the ➔ TecDAX®, this index ranks directly
below the equities listed in the ➔ DAX®.
Option A derivatives contract that entitles buyers and sellers to buy
(call) or sell (put) a defined quantity of an ➔ underlying at an
agreed price (exercise price) within a certain period of time or on
a specified date.
Prime Standard An admission standard on the Frankfurt Stock
Exchange that requires issuers to meet high transparency criteria.
These requirements, such as quarterly reports and the application
of internationally accepted accounting standards, exceed those of
the ➔ General Standard. A listing in the Prime Standard is a pre-
condition for admission to a Deutsche Börse selection index, such
as DAX®, MDAX®, TecDAX®, or SDAX®.
Quote book The electronic order book for Eurex Bonds, where
market makers enter binding bid and ask prices (quotes).
Rating A system for classifying corporate creditworthiness. Indepen-
dent agencies award a rating for a company’s short- or long-term
debt securities, based on the probability of future interest and princi-
pal payments. The purpose of ratings is to make the risk associated
with an investment more transparent for investors. Depending on
the agency, an AAA or Aaa rating is awarded for the highest quality;
Aa and AA also both indicate a high quality in every respect; the
suffixes 1, 2 or 3, or + and –, allow further differentiation of the
quality.
Round lot The minimum number of units in equities trading for
which an order can be placed not only in auctions, but also in
continuous trading at any time. The round lot for all equities traded
on the Frankfurt Stock Exchange and in the Xetra® trading system
is one share.
SDAX® A selection index in the ➔ Prime Standard for smallcaps in
traditional sectors. These equities rank directly below those in the
➔ MDAX®.
Settlement The completion and fulfilment of an exchange trans-
action, i. e. the delivery of the security or commodity in exchange
for the cash equivalent.
TecDAX® A selection index in the ➔ Prime Standard for the 30
largest technology equities ranking below the DAX® selection index.
Underlying A security or commodity on which an options or futures
contract is based. The underlying for options on equities is the share
itself, and the underlying for a DAX® future is the DAX index.
Xetra Stars® Deutsche Börse segments where the most attractive
international equities are traded on the fully electronic Xetra plat-
form. Dow Jones Euro STOXX 50SM shares are represented in the
Xetra European Stars, while Xetra US Stars includes US equities
from the most common stock indices.
XTF Exchange Traded Funds® A segment on the Frankfurt Stock
Exchange for continuous trading in investment fund shares. Index
funds (➔ ETF) and actively managed funds can be traded here.
2002
Deutsche Börse Group: Financial Highlights
Consolidated income statement
Sales revenue €m
Net interest income from banking business €m
Earnings before interest, taxes and goodwill amortization and write-downs (EBITA) €m
Earnings before interest and taxes (EBIT) €m
DVFA/SG earnings €m
Dividend (proposal for 2002) €m
Consolidated cash flow statement
Cash flows from operating activities €m
Cash flows from investing activities €m
Consolidated balance sheet
Total noncurrent assets €m
Shareholders’ equity €m
Technical closing date liabilites €m
Total assets €m
Performance indicators
DVFA/SG earnings per share €
Dividend per share €
DVFA/SG cash flow per share €
Employees (annual average)
Sales revenue per employee € thousands
EBIT (excluding share of results of associated companies) / sales revenue %
Return on equity 1) %
Equity ratio %
Market indicators
Xetra
Number of transactions thousands
Order book turnover €m
Participants (at 31 December)
Floor trading
Number of transactions thousands
Order book turnover €m
Eurex
Number of transactions thousands
Participants (at 31 December)
Clearstream
Number of transactions national thousands
international thousands
Securities deposits (at 31 December) national €bn
international €bn
Deutsche Börse share price 2)
Opening price 2) €
High €
Low €
Closing price €
1) Based on DVFA/SG earnings2) Closing price on preceding trading day

Sales Revenue by Segmentin €m
1) Deutsche Börse Systems and Xlaunch2) Deutsche Börse Systems, entory, Clearstream TEC and Xlaunch
Xetra
2001 2002
Eurex
2001 2002
InformationProducts
2001 2002
Clearstream
2001 2002
InformationTechnology
2001
Highlights by Quarterin €m
2002 2001 2002 2001 2002 2001 2002 2001 2002 2001Q1 Q2 Q3 Q4 FY
Sales revenue 204.9 191.7 205.3 182.9 355.7 185.5 340.6 200.2 1,106.5 760.3
Net interest income from banking business 0 0 0 0 32.6 0 31.8 0 64.4 0
Earnings before interest,taxes and goodwill amortization and write-downs (EBITA) 88.4 90.2 81.2 70.3 136.7 64.8 113.6 53.0 419.9 278.3
Earnings before interest and taxes (EBIT) 87.4 90.2 80.0 70.3 87.9 64.8 95.9 52.8 351.2 278.1
Profit before tax from ordinary activities (EBT) 95.0 98.8 89.4 83.5 92.2 75.3 97.8 61.6 374.4 319.2
DVFA/SG earnings 64.6 65.2 59.7 52.2 38.5 49.4 72.3 36.9 235.1 203.7
243.1
+23%
+20%
210.8
268.8
331.6
109.9121.5
277.0
138.51)
165.62)
0
–13%
+11%
Consolidated income statement
Sales revenue €m 1,106.5 760.3 46
Net interest income from banking business €m 64.4 0 –
Earnings before interest, taxes and goodwill amortization and write-downs (EBITA) €m 419.9 278.3 51
Earnings before interest and taxes (EBIT) €m 351.2 278.1 26
DVFA/SG earnings €m 235.1 203.7 15
Dividend (proposal for 2002) €m 49.2 37.0 33
Consolidated cash flow statement
Cash flows from operating activities €m 466.2 248.8 87
Cash flows from investing activities €m –1,734.1 –152.8 1,035
Consolidated balance sheet
Total noncurrent assets €m 2,656.4 737.2 260
Shareholders’ equity €m 2,152.2 1,560.3 38
Technical closing date liabilites €m 3,475.1 164.7 2,010
Total assets €m 6,544.2 2,135.1 207
Performance indicators
DVFA/SG earnings per share € 2.18 2.04 7
Dividend per share € 0.44 0.36 22
DVFA/SG cash flow per share € 4.35 2.83 55
Employees (annual average) 2,302 1,030 123
Sales revenue per employee € thousands 481 738 –35
EBIT (excluding share of results of associated companies) / sales revenue % 28.6 30.7 –7
Return on equity 1) % 12.7 15.9 –20
Equity ratio % 70.1 79.2 –11
Market indicators
Xetra
Number of transactions thousands 60,001 49,719 21
Order book turnover €m 876,179 958,407 –9
Participants (at 31 December) 359 413 –13
Floor trading
Number of transactions thousands 86,653 124,342 –30
Order book turnover €m 157,760 235,780 –33
Eurex
Number of transactions thousands 801,201 674,158 19
Participants (at 31 December) 424 427 –1
Clearstream
Number of transactions national thousands 67.0 66.2 1
international thousands 15.2 19.8 –23
Securities deposits (at 31 December) national €bn 4,407 4,838 –9
international €bn 2,737 2,830 –3
Deutsche Börse share price 2)
Opening price 3) € 43.21 33.50 4) 29
High € 51.50 44.93
Low € 32.40 29.77
Closing price € 38.16 43.21 –12
Change2002 2001 %
1) Based on DVFA/SG earnings2) Adjusted for the 10-for-1 stock split implemented on 1 June 20013) Closing price on preceding trading day4) Issue price on 5 February 2001
Deutsche Börse Group: Financial Highlights
Quarters 1 to 4 – Sales revenue by segment – Share price
➔
Deutsche Börse Group: Five-Year Review
Consolidated income statement
Sales revenue 2) €m 455.1 599.0 648.9 760.3 1,106.5
Net interest income from banking business €m 0 0 0 0 64.4
Other operating income €m 27.8 45.9 95.7 77.3 70.6
Fee and commission expense from banking business €m 0 0 0 0 –66.3
Total expenses less own expenses capitalized 2) €m –373.0 –533.0 –591.6 –604.3 –858.8
Income from equity investments (net) €m –3.7 –5.7 63.5 44.8 34.8
Earnings before interest and taxes (EBIT) €m 106.3 106.2 216.5 278.1 351.2
Net financial income €m 17.0 25.3 2.4 41.1 23.2
Profit before tax from ordinary activities €m 123.3 131.5 218.9 319.2 374.4
DVFA/SG earnings 3) €m 53.4 70.0 142.9 203.7 235.1
Dividend (proposal for 2002) €m 31.1 58.7 30.8 37.0 49.2
Consolidated cash flow statement
Cash flows from operating activities €m 155.0 168.4 101.5 248.8 466.2
Cash flows from investing activities €m –82.5 –137.9 –252.3 –152.8 –1,734.1
Consolidated balance sheet
Noncurrent assets (excluding miscellaneous and deferred tax assets) €m 193.3 260.0 620.3 737.2 2,656.4
Receivables over 1 year including deferred tax assets €m 10.7 20.7 12.5 17.5 22.0
Receivables from banking business €m 978.6 2,907.1 0 6.9 3,085.0
Restricted bank balances €m 93.8 450.1 71.1 164.7 303.7
Other cash and bank balances €m 55.9 102.1 69.5 1,055.1 248.1
Other current assets €m 122.0 165.9 149.3 153.7 229.0
Shareholders’ equity 3) €m 218.5 257.9 419.8 1,560.3 2,152.2
Minority interests €m 3.2 3.8 4.3 10.6 23.1
Noncurrent interest bearing liabilities €m 0 0 90.0 0 9.2
Other noncurrent provisions and liabilities €m 116.4 137.4 84.3 116.2 210.0
Technical closing date liabilities 4) €m 964.7 3,284.6 71.1 164.7 3,475.1
Other current provisions and liabilities €m 151.4 222.2 253.2 283.3 674.6
Total assets 3) €m 1,454.2 3,905.9 922.7 2,135.1 6,544.2
Balance sheet performance indicators
Trade creditors 1 days 28 37 33 28 33
Trade creditors 2 days 32 42 39 33 38
Trade creditors ratio % 20 24 27 29 47
Equity ratio 1 % 30 23 41 203 42
Equity ratio 2 % 68 64 56 220 61
Debt / equity ratio % 31 36 30 14 22
Liabilities structure % 57 62 59 71 75
Cash ratio % 37 46 27 372 37
Current ratio % 117 121 86 430 72
Debt coverage % 66 55 70 101 67
Equity / net tangible assets 6.4 6.6 8.5 37.1 7.9
19981) 19991) 2000 2001 20021) 19981) 19991) 2000 2001 20021)
1) Deutsche Börse Clearing AG was fully consolidated until 1999. The 50 percent interest in Clearstream International S.A. was carried at equity following the merger of Deutsche Börse Clearing AG with the operations of Cedel International S.A. to form Clearstream International S.A. Following the acquisition of Cedel International S.A., Clearstream International S.A. has been fully consolidated since 1 July 2002.
2) Excluding net license fees, which were recognized until 20003) Restated to reflect changes in accounting policies 4) Technical closing date liabilities include liabilities from banking business of Deutsche Börse Clearing and Clearstream International S.A.,
and the Eurex Clearing members’ cash deposits.5) Adjusted for the 10-for-1 stock split implemented on 1 June 2001
Deutsche Börse Group: Five-Year Review
Performance indicators
EBIT (excluding share of results of associated companies) / sales revenue % 24 19 24 31 29
Cash flow 1 return on investment (CF1 ROI) % 36 32 35 20 20
Cash flow 2 return on investment (CF2 ROI) % 37 32 35 21 19
DVFA/SG earnings per share 5) € 0.73 0.95 1.95 2.04 2.18
Dividend per share 5) € 0.42 0.80 0.30 0.36 0.44
Operating cash flow per share 5) € 2.11 2.29 1.38 2.49 4.33
Return on equity % 27 29 40 16 13
Staff costs / total revenue % 20 17 14 12 18
Employees (FTEs, annual average) 1,042 1,143 894 1,030 2,302
Sales revenue per employee 2) € thousands 437 524 726 738 481
Market indicators
Xetra
Number of transactions thousands 7,150 15,785 39,009 49,719 60,001
Order book volume €m 403,302 514,959 980,552 958,407 876,179
Participants (at 31 December) 280 404 431 413 359
Floor
Number of transactions thousands 47,159 73,364 163,914 124,342 86,653
Order book volume €m 207,998 400,479 438,712 235,780 157,760
Eurex
Number of traded contracts millions 248.2 379.1 454.1 674.2 801.2
Participants (at 31 December) 313 414 429 427 424

Our objective is to become the preeminent exchange organization. We will
provide access to the most attractive securities and derivatives markets.
Being the only fully integrated exchange organization worldwide, we offer
a full range of trading, clearing, settlement, custody, information and
infrastructure services at lowest costs. We will organize new markets and
thereby improve their liquidity.
We will provide first-class services targeted at intermediaries and vendors,
investors and issuers worldwide.
We initiate and support improvements of the regulatory framework and
are open for valuable partnerships.
To achieve these goals we build on our uniquely skilled professionals
and the power and reliability of our fully integrated electronic systems.
Thus, we create superior shareholder value.
Our mission is to improve the efficiency of capital markets.

005 To Our Shareholders
006 Managing Directors
008 Management Structure
009 Supervisory Board
010 2002 – The Year That Was
014 Deutsche Börse: Focus on Process032 Deutsche Börse AG Shares: Capital Markets Reward Successful Business Model040 Our Staff: Skills Base Increases046 Xetra: Setting Standards, Creating Structures 056 Eurex: Success in Volatile Markets066 Information Products: No Information – No Trading074 Clearstream: Efficient Processes084 Information Technology: Infrastructure for Deutsche Börse
and International Financial Markets
096 Customer Governance: The Closest Possible Cooperation with Customers102 Corporate Governance: Transparency and Responsible Management104 Report of the Supervisory Board
108 Group Management Report135 Deutsche Börse AG Annual Financial Statements in Accordance with IFRS /IAS135 – Consolidated Income Statement136 – Consolidated Balance Sheet138 – Consolidated Cash Flow Statement139 – Consolidated Statement of Changes in Shareholders’ Equity140 Notes to the Consolidated Financial Statements203 Auditors’ Report204 Single-Entity Financial Statements in Accordance with the HGB205 Proposal on the Appropriation of the Unappropriated Surplus
206 Appointments of Executive Board and Supervisory Board Members
210 Investor Relations/Publications
211 Financial Calendar/Contact
212 Deutsche Börse Group Worldwide
213 Index
214 Acknowledgements
Content
CONTENT 003

DEUTSCHE BÖRSE GROUP004

TO OUR SHAREHOLDERS 005
Deutsche Börse Group continued its growth course in fiscal 2002. Despite the difficult environment,
the Group increased its sales revenue by €346 million, and its earnings by €73 million, thus
exceeding the goals we set at the beginning of the year. The Supervisory Board and the Executive
Board will be proposing a dividend of €0.44 per share – an increase of 22 percent on last year –
to the Annual General Meeting on 14 May 2003.
The Group’s growth can be attributed in part to the acquisition of the securities settlement and
custody organization Clearstream International in the middle of the year. The Group now employs
around 3,300 people at its primary locations in Germany, Luxembourg and Switzerland, as well
as at its branch offices in London, Paris, Chicago, New York, São Paulo, Hong Kong and Dubai.
It is their dedication and professionalism that has made the Group’s excellent results possible.
Today, Deutsche Börse Group provides around 2,000 customers – primarily from Europe and
the US – with a range of efficient and cost-effective infrastructure services. On behalf of all our
employees and myself, I would like to personally thank all our customers for the confidence they
have shown in Deutsche Börse Group.
Dear shareholders, despite the difficult environment we will continue to justify your trust, and
will do our utmost to fulfil your expectations.
With kind regards,
Werner G. Seifert
Chairman of the Executive Board
Dear Shareholders,

MANAGING DIRECTORS006
Managing Directors as at 1 March 2003
Werner G. Seifert, born 1949Chief Executive Officer Deutsche Börse AGResponsible for Group Coordination andCustomers/Markets (Information Services, Technology Services)Frankfurt/Main
André Roelants, born 1943Deputy Chief Executive Officer Deutsche Börse AGResponsible for Customers/Markets (Banking and Custody Services) Lintgen, Luxembourg
Yves Baguet, born 1960Responsible for Delivery (Operations, Infrastructure and Implementation)Waltzing (Arlon), Belgium
Rudolf Ferscha, born 1961Member of the Executive Board Deutsche Börse AGResponsible for Customers/Markets (Trading and Clearing Services)Frankfurt/Main
Matthias Ganz, born 1963Responsible for OperationsGlashütten/Schlossborn
Frank Gerstenschläger, born 1960Responsible for Technology ServicesDarmstadt
Mathias Hlubek, born 1963Member of the Executive Board Deutsche Börse AGResponsible for Finance/Group Corporate Center Kronberg
Ulrich Kastner, born 1954Responsible for Application Development Trading and ConsultingEschborn
Michael Kuhn, born 1954Member of the Executive Board Deutsche Börse AGResponsible for Technology/Systems Frankfurt/Main

MANAGING DIRECTORS 007
Christoph Lammersdorf, born 1950Responsible for Information Services Mainz
Gerhard Leßmann, born 1958Responsible for Application Development Clearing and Settlement, CustodyKronberg
Axel Nawrath, born 1954Responsible for Policy, Communication and LegalBerlin
Volker Potthoff, born 1954Responsible for Banking and Custody ServicesBad Homburg
Martin Reck, born 1961Responsible for Group FunctionalityRockenberg
Jürgen Karl Röthig, born 1962Responsible for Trading/Clearing/Info OperationsOberursel
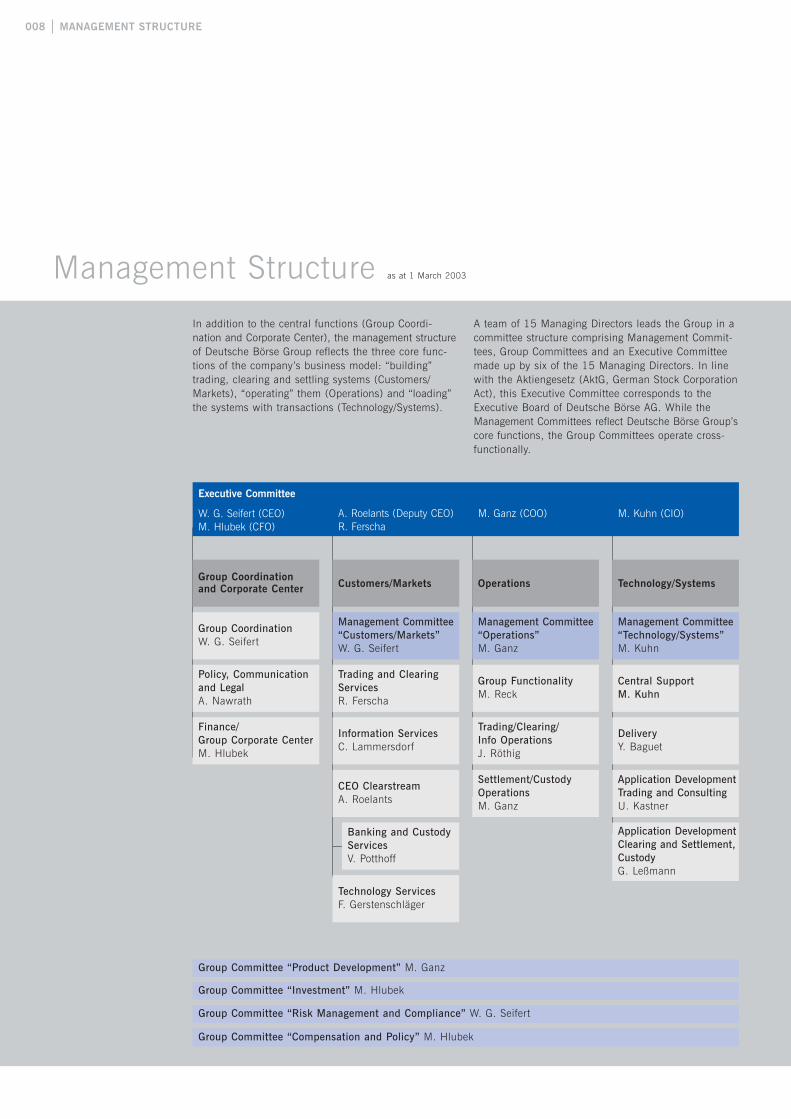
MANAGEMENT STRUCTURE008
Management Structure as at 1 March 2003
Group Coordination and Corporate Center Customers/Markets
Group CoordinationW. G. Seifert
Finance/Group Corporate CenterM. Hlubek
Information ServicesC. Lammersdorf
CEO ClearstreamA. Roelants
Technology ServicesF. Gerstenschläger
Management Committee“Customers/Markets”W. G. Seifert
Trading and ClearingServicesR. Ferscha
Banking and CustodyServicesV. Potthoff
Policy, Communicationand Legal A. Nawrath
Operations
Management Committee“Operations”M. Ganz
Group FunctionalityM. Reck
Trading/Clearing/Info OperationsJ. Röthig
Settlement/CustodyOperationsM. Ganz
Technology/Systems
Management Committee“Technology/Systems”M. Kuhn
Central SupportM. Kuhn
DeliveryY. Baguet
Application DevelopmentTrading and ConsultingU. Kastner
Application DevelopmentClearing and Settlement,CustodyG. Leßmann
Group Committee “Product Development” M. Ganz
Group Committee “Investment” M. Hlubek
Group Committee “Risk Management and Compliance” W. G. Seifert
Group Committee “Compensation and Policy” M. Hlubek
In addition to the central functions (Group Coordi-nation and Corporate Center), the management structureof Deutsche Börse Group reflects the three core func-tions of the company’s business model: “building” trading, clearing and settling systems (Customers/Markets), “operating” them (Operations) and “loading”the systems with transactions (Technology/Systems).
A team of 15 Managing Directors leads the Group in acommittee structure comprising Management Commit-tees, Group Committees and an Executive Committeemade up by six of the 15 Managing Directors. In linewith the Aktiengesetz (AktG, German Stock CorporationAct), this Executive Committee corresponds to theExecutive Board of Deutsche Börse AG. While theManagement Committees reflect Deutsche Börse Group’score functions, the Group Committees operate cross-functionally.
A. Roelants (Deputy CEO)R. Ferscha
M. Ganz (COO) M. Kuhn (CIO)
Executive Committee
W. G. Seifert (CEO) M. Hlubek (CFO)

SUPERVISORY BOARD 009
Supervisory Board
Dr. Rolf-E. BreuerChairmanChairman of the Supervisory Board Deutsche Bank AGPresidentBundesverband deutscher Banken
Manfred ZaßDeputy ChairmanChairman of the Executive Board (until 31 Jan. 2002)DGZ DekaBank Deutsche Kommunalbank
Ralf ArnemannStaff Member in the IP Applications Section Deutsche Börse Systems AG
Herbert BayerTrade Union Secretaryver.di e.V., Area Frankfurt/Main and Region, FB Financial Services
Dr. Peter CoymMember of the Executive BoardLehman Brothers Bankhaus AGChairmanVerband der Auslandsbanken in Deutschland e.V.
Leonhard H. FischerMember of the Executive Board (until 31 October 2002)Dresdner Bank AG andMember of the Executive Board (until 31 October 2002)Allianz AG
Uwe E. FlachDeputy Chairman of the Executive Board DZ Bank AG, Deutsche Zentral-Genossenschaftsbank
Hans-Peter GabeStaff Member in the Personnel Services SectionDeutsche Börse AG
Dr. Peter Gloystein (until 9 September 2002)Spokesman for the Executive Board (until 31 Aug. 2002)ING BHF-Bank AG
Harold HöraufPersonally Liable Partner HSBC Trinkaus & Burkhardt KGaA
Sandra S. Jaffee (as of 22 November 2002)Executive Vice President Citibank N.A. President and CEO Global Securities Services
Dr. Stefan Jentzsch (as of 15 May 2002)Member of the Executive BoardHypoVereinsbank AG
Dr. Norbert Juchem (until 15 May 2002)Member of the Executive Board (until 31 January 2002)HypoVereinsbank AG
Hessel Lindenbergh (as of 22 November 2002)Member of the Executive BoardING GroupChairmanNetherlands Bankers’ Association
Dr. Claus Löwe (until 19 September 2002)Senior Partner arsago ACM GmbHBad Homburg
Friedrich von MetzlerPersonally Liable Partner B. Metzler seel. Sohn & Co. KGaA
Fritz NolsChairman of the Supervisory BoardFritz Nols Global Equity Services AGSpokesman for the Executive BoardBundesverband der Wertpapierhandelsfirmen e. V.
Klaus M. PatigMember of the Executive BoardCommerzbank AG
Roland PrantlStaff Member in the Configuration Management SectionDeutsche Börse Systems AG
Sadegh RismanchiStaff Member in the Configuration Management SectionDeutsche Börse Systems AG
Gerhard B. RoggemannMember of the Executive BoardWestdeutsche Landesbank Girozentrale
Rainer RoubalChairman of the Executive BoardICF Intermediär Center Frankfurt Kursmakler AG
Johannes WittStaff Member in the Financial Accounting and ControlsSection Deutsche Börse AG
Silke ZillesStaff Member in the IP Marketing & Sales SectionDeutsche Börse AGFrankfurt/Main

January
Annual Reception 2002
Invited by Deutsche Börse,
around 1,000 guests from
the worlds of business,
politics and the financial
community – including
the main speaker Frits
Bolkestein, EU Commis-
sioner in charge of the
Internal Market and Tax-
ation – meet to discuss
current developments
on the European capital
markets.
Neuer Markt Sentiment
Index debuts
Together with Cognitrend,
Deutsche Börse estab-
lishes a mood barometer
survey for the Neuer
Markt. The Sentiment
Index tracks the ratio of
optimists to pessimists
and the way this changes
on a weekly basis. In
October, a DAX® mood
barometer for blue chips
will supplement the Neuer
Markt Sentiment Index.
February
Expansion of Xetra
European Stars
Deutsche Börse admits
17 French securities, one
Belgian and one Finnish
security – all from the
Dow Jones Euro STOXX
50SM – to its European
trading segment, Xetra
European Stars®.
Takeover offer to
Cedel owners
Deutsche Börse AG makes
an offer to the owners of
Cedel International for the
acquisition of their shares.
In the event of a takeover,
Deutsche Börse will
become the sole owner of
the securities settlement
company Clearstream
International. Cedel cur-
rently holds 50 percent of
the shares in Clearstream
– as does Deutsche Börse.
March
Shares at all-time high
On 12 March, the
Deutsche Börse shares
reach their highest level
to date at €51.50. Since
the IPO in February
2001, the shares have
risen in value by around
53 percent.
Round lot one for
MDAX securities
With immediate effect,
investors may buy MDAX®
shares starting with an
order size of one share.
Electricity exchange
merger
EEX®, a subsidiary of
Deutsche Börse, and Leip-
zig Power Exchange (LPX)
merge to form “EEX Euro-
pean Energy Exchange AG”,
based in Leipzig. Hourly
trading takes place on
the Leipzig Sapri system,
derivatives trading and
continuous block trading
are effected via the Frank-
furt Xetra® system.
April
Two years of XTF
Two years after its intro-
duction, Deutsche Börse’s
XTF® segment has estab-
lished itself as a perma-
nent feature on the Ger-
man capital market and,
at the same time, as
Europe’s most important
market for exchange-
traded index funds.
MTS France market data
from Frankfurt for the
first time
Deutsche Börse exclusive-
ly provides the real-time
prices of MTS France,
one of the key markets
for government bonds
in Europe.
12th German Equity
Forum
The German Equity
Forum is held in Frankfurt
am Main for the first
time. The initiative, led
by Deutsche Börse, KfW
(the German Development
Bank) and the State of
Hesse, brings together
companies seeking capital
with specialist investors.
The event is opened by
Roland Koch, Prime
Minister of Hesse.
Deutsche Börse invites
the public on the Night
of Museums
With almost 2,500 visi-
tors, great interest is
generated by Deutsche
Börse’s art collection XL
Photography on the Night
of Museums.
May
Annual General Meeting
2002
The shareholders resolve
a dividend for fiscal 2001
of €0.36 per share – a
20-percent increase year-
on-year. The AGM is
broadcast live on the
Internet for the first time.
Investor Center online
The portal for private
investors offers up-to-date
information on the capital
markets and useful details
on trading with shares,
derivates and warrants:
www.deutsche-boerse.com/
marketinfo/index_e.htm.
Launch of NISAX 20
Deutsche Börse calculates
the NISAX 20 in coopera-
tion with Norddeutsche
Landesbank. The index
shows the development of
the 20 largest companies
in Lower Saxony.
June
Free float: A new
weighting criterion for
share indices
With immediate effect,
the weighting of a compa-
ny in Deutsche Börse’s
share indices is based
on its free float shares –
shares that can be freely
traded and are not held
by the founding family or
major shareholders.
Symposium on Capital
Market Law
Representatives of the
European Commission
and the German Federal
Government, together
with representatives from
academic institutions and
securities trading, meet at
the Neue Börse to discuss
the proposals made by
the European Commission
to create a pan-European
supervision of capital
markets.
Private placement
successful
More than 9 million
Deutsche Börse shares
are placed with institu-
tional investors in Europe
and the US at a price
of €44 per share. The
proceeds go towards the
acquisition of Cedel Inter-
national.
Commercial Paper
issued
Deutsche Börse issues
commercial paper with a
volume of around €400
million to partially finance
the acquisition of Cedel.
1st quarter 2nd quarter
2002 – THE YEAR THAT WAS
2002 – The Year That Was
010

July
Acquisition of Cedel
International completed
Deutsche Börse acquires
Cedel International – and
with it its 50-percent share
in Clearstream International
– at a price of €1.6 billion.
The largest transaction in
the history of the securi-
ties industry to date is fi-
nanced using the proceeds
of the IPO, the successful
private placement and the
commercial paper program.
Deutsche Börse’s offer is
accepted by all Cedel
shareholders.
a/c/e refocused
Eurex and the Chicago
Board of Trade (CBOT)
restructure their a/c/e
alliance: Eurex will be
exclusively responsible for
the a/c/e platform’s soft-
ware and its further devel-
opment; CBOT will pay
license fees for the use of
the software.
August
Interface to central
counterparty
Deutsche Börse Systems’
Xentric® CCP Request
Broker offers a new, pro-
fessional interface between
the in-house systems of
stock trading participants
and the central counter-
party (CCP).
Round lot one for
DAX securities
Deutsche Börse reduces
the order size for all
DAX securities to just
one, allowing a minimum
lot of one for all Xetra-
traded shares.
Launch of
Xetra Release 7.0
The new version offers an
enhanced front end and
interface for customizing
the system to trading par-
ticipants' environments. In
addition, the trading sys-
tem now also includes
the relevant functions for
the launch of Xetra BEST®
in September.
September
First Eurex participant
in Australia
Fortis Clearing Sydney
Pty Ltd. becomes the first
Australian participant
directly linked to Eurex.
New service for private
investors: Xetra BEST
Xetra Best Execution – or
Xetra BEST for short – sup-
ports the immediate exe-
cution of private investors’
orders at lower prices than
would be generated using
the Xetra order book at
that time.
7th Global Securities
Financing Summit in
Luxembourg
Clearstream invites finance
experts to debate develop-
ments in securities financ-
ing and discuss efficient
liquidity and collateral
management.
October
CreationOnline added to
CreationConnect
CreationOnline, the secure
browser solution for access
to Clearstream’s settlement
process, is now available
via Clearstream’s virtual
private network and the
public Internet.
Deutsche Börse
Computershare offers
share register manage-
ment services
The newly formed joint
venture by Deutsche Börse
AG and Computershare
Ltd. offers German public
companies assistance with
share register management.
New index concept
presented
As of March 2003, the
development of prices on
the German stock market
will be even more trans-
parent thanks to a new
index concept: in future,
Deutsche Börse will distin-
guish between traditional
and technology sectors
below the DAX. The new
index system will be intro-
duced at the first chaining
date 2003.
November
Infobolsa investment
Deutsche Börse acquires a
50-percent interest in Info-
bolsa, one of the leading
European providers of real-
time financial information.
A German subsidiary is
expected to provide infor-
mation to German finan-
cial services providers.
13th German Equity
Forum
Once again, Deutsche
Börse and KfW host the
German Equity Forum in
Frankfurt. For the first
time, listed companies
also present their business
models and products to
analysts and institutional
investors.
Exchange Council agrees
on new segmentation of
stock market
New exchange rules are
resolved by the Exchange
Council and approved by
the Exchange Supervisory
Authority of the State of
Hesse. As of the beginning
of 2003, there will be two
new segments on the
Frankfurt Stock Exchange:
the Prime Standard – with
particularly high trans-
parency requirements –
and the General Standard.
December
eb.rexx: New index family
for fixed-income securities
Together with Eurex
Bonds, Deutsche Börse
introduces a new index
group, initially comprising
ten German bond indices.
Deutsche Börse
in the DAX
Almost two years after its
IPO, Deutsche Börse is
included in the German
blue-chip index DAX.
Clearstream expands
Vestima
Clearstream’s purchase of
Filinks adds a complemen-
tary technology to the
Vestima® investment fund
service. It will increase
efficiency in forwarding
orders from domestic
markets.
Acquisition of entory
complete
Deutsche Börse redeems
the final remaining tranche
of shares from the previ-
ous shareholders and now
holds a 100-percent inter-
est in entory AG.
3rd quarter 4th quarter
2002 – THE YEAR THAT WAS 011

Business concept: Combining economies of scale and scope at different value-added intensities
Back office
Settlement
Clearing
Trading
Front office
Build
Economies of scale
Economies of scope
Value added intensity
Selling technology
Operate Insourcing load
Load
Core functio
ns
Proc
ess
chai
n
Core formats
Providing full service
Business model

DEUTSCHE BÖRSE 015
A single European financial market for the benefit of both investors and issuers –
this is what the European Union is aiming to achieve by no later than 2005
with its Financial Services Action Plan. A series of EU directives is being drawn
up, including, most notably, the Investment Services Directive (ISD), which is
intended to harmonize the structures of the securities markets. Simultaneously,
the debate on the right structure for cross-border securities transactions has
intensified over the past year. Various bodies have voiced their opinions on the
matter: since the European Commission began a consultation process in the area
of clearing and settlement in May 2002, the European Parliament has produced
a report; the G30, a group of representatives of prominent market participants
and public institutions, drafted its position in January 2003. In addition, the
European Commission has formed a committee of experts chaired by Alberto
Giovannini, whose second report (which will appear in the spring of 2003) will
provide the basis for its approach to the issue. In other words: the architecture
of the European capital market is undergoing a complete overhaul.
As a successful capital market infrastructure ser-
vices provider, Deutsche Börse Group is looking
carefully at these opinions and is continuing to
develop its business model against the backdrop
of this debate. In line with calls made by some
contributions to the debate, Deutsche Börse Group
analysed its performance in European cross-border
securities transactions in its study entitled “Cross-
Border Equity Trading, Clearing & Settlement
in Europe”, which was published in April 2002
and which can be accessed at www.deutsche-
boerse.com>Services>Publications/Downloads.
The first part of the following considerations
shows that the securities industry, as well as the
European and German legislators, should be trying
to streamline the diversity of regulatory frameworks
in Europe. The process-oriented business model
provided in the second part of this chapter demon-
strates how Deutsche Börse is already making a
contribution to creating a more efficient inter-
national capital market architecture. The third
part shows how Deutsche Börse Group devel-
oped a functional leadership structure out of this
business model on 1 January 2003, in order to
continue to focus systematically and swiftly on
the future requirements of the European capital
market structure.
Deutsche Börse: Focus on Process

Efficiency in the European securitiessector is possible despite regulatoryand institutional diversity
Investors should always take every opportunity
to improve their returns and minimize their risk.
This is particularly important in light of the cur-
rent weakness on the capital markets, which
has been continuing for several years now. One
option is to diversify into various European capi-
tal markets. In practice, however, the costs in-
volved in this type of diversification outweigh the
benefits for most investors. In order to maintain
a presence on all markets for investors or for the
purposes of proprietary trading, banks and other
intermediaries must be linked to various trading
and settlement systems. This involves a degree
of complexity, from both a technical and regula-
tory point of view, which in turn brings direct
and indirect costs. One alternative is to engage a
second intermediary in the target market, which
incurs even higher costs. Following the introduc-
tion of the euro, European politicians expect the
costs involved in the trading and settlement of
cross-border securities transactions to fall.
How extensive are the political expectations?
In theory, the following model can be conceived:
a standardized trading and settlement platform for
all European markets with a standardized market
model and uniform standards, for example for
trading regulations, for the deposit of collateral,
for settlement periods and for the extended regu-
latory environment for accounting or tax systems.
This would mean that trading participants would
only have to connect to a process based on a
single technology, and therefore to one institution-
al and regulatory system. The costs for market
participants would fall: this standardized and
integrated process from the incoming order to the
last stage in the settlement process would bring
the unit costs down to a minimum. That’s the
theoretical wishful thinking, anyway.
Would the model be politically viable?
Will the future private demand for cross-border
trading be enough to justify the material invest-
ments and the restriction of competition? All of
the national markets would have to cede national
sovereignty over the regulatory framework in order
to implement this model – but is this desirable
and can it be achieved? Could Luxembourg,
Switzerland and Ireland really be persuaded to
give up their competitive advantages, e. g. from
their low rates of tax? On the other hand, would
the United Kingdom be willing to do away with
its stamp duty, although this provides the British
Treasury with revenue which exceeds the total
DEUTSCHE BÖRSE016

amount to be saved on European cross-border
transactions? Finally: would the United Kingdom
and Switzerland remain outside the model be-
cause of their non-membership of the euro zone?
Are the complexity costs involved in the engage-
ment of intermediaries really the only relevant
criteria? After all, this problem has long been of
no consequence to institutional investors, who
are tied to the liquidity of their domestic market
through their brokers.
Would introduction of the model be a responsible move from a regulatory perspective?
Regardless of its feasibility, the model of an entire-
ly standardized European infrastructure ignores
the economies of scale. The advocates of the uni-
fied model are the very ones who are bringing
this important argument to bear: should the trans-
action costs in the cross-border stock market be
at the same low level for all European investors?
If so, which domestic market should serve as the
reference market? Depending on their size, differ-
ent domestic markets have significantly different
economies of scale – the Luxembourg stock mar-
ket cannot achieve the same economies of scale
as the German one.
This systematic problem cannot be solved either
politically or economically. This is why prices for
cross-border and domestic transactions can only
be harmonized for each individual country. If this
system were to be implemented, we would remain
in a situation in which the same transactions were
priced differently in France to Germany or Italy.
As such, investors would be at either an advan-
tage or a disadvantage depending on where they
live. This problem does not only affect investors,
it also impacts the infrastructure providers: the
protection of national regulation in Europe has
led to over-capacity in trading, clearing and settle-
ment. Would the smaller, national providers of
infrastructure services then be forced to give up,
or become junior partners as part of a consolida-
tion process?
The distortions caused by a single European
infrastructure would also affect the intermedia-
ries: the unit and connection costs still depend
on the volume of orders – the effects of differing
participant sizes are not automatically eliminated
by a single infrastructure. Rather, a unified system
would promote a concentration movement among
intermediaries. This would lead to a new pricing
power at just a few intermediaries, who could then
reverse the reduction in clearing and settlement
transaction fees for retail customers if they want.
DEUTSCHE BÖRSE 017

Do the benefits outweigh the material andregulatory costs of the theoretical model?
All of these effects and consequences should be
looked at in relation to the size of the problem.
On closer examination, the price for the diverse
range of institutional providers in Europe is lower
than those who talk of the costs being “ten times
as high as in the USA” would lead us to believe.
According to analyses carried out by Deutsche
Börse Group and published in the aforementioned
study, the inefficiencies of the current system
amount to €4.3 billion per year, compared to a
theoretical model which would allow transactions
to be processed at the costs applicable in the
cheapest country of reference (see chart).The scale
of this inefficiency has since been confirmed by
competitors. Using the same method and the fig-
ures used in the study, the total annual cost for
equity transactions in Europe amounts to €40.9
billion. The inefficiency of the current diversity
therefore accounts for one tenth of total costs.
And of this tenth, only one fifth (2 percentage
points or around €860 million) is attributable to
the market infrastructure, thus corresponding to
a €28 burden on an average institutional trans-
action of €150,000 – a rate of 0.19 per mill. In
fact, these costs are the result of the diversity in
the technologies used and the inefficiency of the
current processes. The remaining €3.4 billion,
on the other hand, can be put down to the fact
that the harmonization of the general regulatory
framework is progressing too slowly. Regulatory
frameworks are often established by the national
political bodies in order to create apparent com-
petitive advantages, such as with the various
legal constructs for securities (for example, the
prevalence of registered shares in the United
Kingdom, and bearer shares in Germany) or the
different tax treatment of capital services such as
interest and dividends, or the different regulations
governing company takeovers.It cannot even be
ruled out as yet that the regulatory frameworks
will drift further apart in the future, for example
the tax systems.
DEUTSCHE BÖRSE018
Additional costs of cross-border securities transactions per year
20 %
Affected by intermediariesand exchange organizations Different market practices Great variety of infrastructures
Total volume ¤4.3 billion p. a.
40 %
Hard to affect, only long-term changes conceivable
Small cross-border volumes (home bias) Different languages and cultures
40%
Affected by the EU and its member countries
Different regulatory frameworks and fiscal systemsDifferent corporate action rulesDifferent currencies

This applies despite the fact that the idea of a
single framework is perfectly conceivable and
has long been in existence in other sectors of the
securities market: after all, with the Eurobond
market, Europe has had a cost-efficient and
smooth-running cross-border bond market for
decades now. It is only when the basis for a
similar regulatory framework for the stock market
has been established politically that the costs
for cross-border securities transactions will fall
in line with political expectations. Exchange and
settlement organizations, as well as the interme-
diaries involved, will do their homework in the
meantime and make the processes more efficient.
How does the model comply with concepts of a free market economy?
Is a public “utility company” (this is what would
arise from such a model), as opposed to compe-
ting capital market infrastructure providers, really
in a position to work cost-effectively, and can it,
and does it want to, be innovative in the absence
of competitive pressure? Most European countries
have, quite rightly, moved towards privatization
in the telecommunications, energy and railway
sectors. The trend is to move away from diri-
gisme and towards market mechanisms. This has
brought welcoming results: in the telecommuni-
cations sector, for example, efficiency improved
drastically following the end of the state mono-
poly. Why should the right move for the stock
markets lie in the opposite direction?
Cui bono – who would benefit most from the model?
By and large, the first conclusion to be drawn is
that the problem is less relevant, and of a lesser
magnitude than the debate surrounding it might
lead us to believe. Secondly, responsibility has
been spread very unevenly on the shoulders of
capital market participants. The calls for a diri-
giste solution come, for the most part, from the
global securities houses. These often started ex-
panding into Europe only a few years ago (even
though they barely invested in the infrastructure
in the past), but also include banks which were
originally European and which have since parted
with their interests in the exchange and settle-
ment organizations at a high profit, meaning
that they have also amortized their investments.
These companies are now trying to use their
order volumes to take over the management of
clearing and settlement companies in particular
by calling for user participation. They want to
adapt these processes to meet their cost needs –
not necessarily to the benefit of smaller market
participants. This would allow them to process
their order volumes in-house (to internalize
them) and thus to increase their margins to the
detriment of private investors. These very same
companies believe, unlike the smaller intermedi-
aries, that they no longer require stock exchan-
ges for the cash market, but only the appropriate
clearing and settlement infrastructures.
DEUTSCHE BÖRSE 019

Efficiency and effectiveness only by means of a free market economy approach
At this point, Deutsche Börse would again like to
emphasize its long-standing objective to minimize
the trading and settlement costs for the European
capital market: “Our mission is to improve the
efficiency of markets” (see p. 1). As part of this
objective, Deutsche Börse differentiates between
trading and settlement costs and makes them
transparent. The results of its ongoing endeavors
become particularly clear when one considers
how long it is taking banks or postal service pro-
viders to lower the cost of basic services such as
transfers and delivery.
Deutsche Börse Group is trying to streamline the
existing diversity on the European markets within
the framework of a free market economy. It wants
to create value for shareholders, and can only do
so by serving its customers to the very best.
Deutsche Börse Group is convinced that its ap-
proach benefits all capital market participants –
issuers, investors and intermediaries – far better
than a public utility company, under the sole
control of those who use it, ever could.
In light of the fact that the regulatory structures,
for which exchange and settlement organizations
are not responsible and which they are unable
to influence, account for four-fifths of the prob-
lem (see chart on p. 18), Deutsche Börse Group
is focusing on that fifth which it can influence:
focus on process! The fact is that in the current
environment (or, at least, in a very similar one)
processes can be streamlined more quickly
and with greater benefits than the cross-border
harmonization of various different systems in a
broader sense. The business model of Deutsche
Börse Group, which is integrated along the value
chain, is not the expression of an ideology, but
of the pragmatic realization to increase advan-
tages to customers, both today and in the future.
Process-oriented Group business model
In spite of its diversified business portfolio and
the vast range of transactions at different stages
of the value chain, Deutsche Börse is running
what is ultimately a monolithic business. All of
its endeavors must focus on improving the se-
curities and derivatives trading process from the
incoming order to the final settlement (“money
versus securities”) and the custodian services
which follow, in the interests of its customers.
This means running transactions through the
integrated system more quickly, more reliably,
more efficiently and with less risk.
DEUTSCHE BÖRSE020

Harmonization in Europe and beyond possible for all transactions
The range of transactions which form part of the
process chain and resulting portfolio is, however,
vast. This means that there are various approa-
ches which could be taken to further harmonize
and standardize the European capital market and
thus make cross-border transactions more efficient.
The vast range of areas covered internationally
already offers a host of possibilities which Deutsche
Börse exploits at every opportunity.
Cash market: Focus on Europe
It is in this sector that expansion poses the most
problems, not only for Deutsche Börse, but for all
stock exchanges: the liquidity concentrated on a
single trading platform cannot be transferred easily,
even with fierce competition. Despite all European
harmonization efforts, this is the result of the pro-
tection offered by the national regulatory frame-
works.
There are, however, three possible models for the
consolidation of liquidity: firstly, the purchase of
other markets. The French-led Euronext, for example,
is attempting to consolidate the Dutch, Belgian
and Portuguese markets horizontally on a single
technical platform. The difficulty involved in inte-
grating the Dutch market, however, demonstrates
how regulatory resistance has to be overcome and
traditional patterns of behavior revised.
Secondly, there is the “insourcing” of other markets:
Deutsche Börse uses its technical platform to operate
the Irish and Austrian markets as well. This allows
these markets to benefit from Deutsche Börse’s low
unit costs, and trading participants enjoy a wider
offering via a single technical point of access. Similar
approaches have been taken on the Scandinavian
markets as well as on London’s virt-X, which
has outsourced its operations to the SWX Swiss
Exchange.
Thirdly, there is the option of merging the cash
markets: Deutsche Börse attempted a merger with
the London Stock Exchange in 2002. The project
could not be implemented due to a series of reasons.
Once again, established patterns of behavior among
market participants, regulatory differences and
national perspectives proved to be major stumbling
blocks. Nonetheless, the actual structural and
technical dimension did not pose an insurmountable
problem then, and it would not pose one today.
DEUTSCHE BÖRSE 021

Derivatives market: US equities are on the way
Eurex, which belongs to Deutsche Börse Group,
is the market leader in all derivatives on European
underlyings, with the exception of short-term inter-
est-rate futures. This means that even today, it
serves an international market. Eurex will now
develop the market for derivatives on US under-
lyings, which, like the market for euro products,
is international. In doing so, it is relying on its
market model and unrivaled price-performance
ratio. One example: it is virtually impossible to
make a direct comparison of derivatives trading
prices. Figures for turnover and sales revenue
demonstrate, however, that Eurex is the clear price
leader among the world’s major derivatives ex-
changes: according to the latest available figures
for 2001, Eurex generated sales revenue (includ-
ing clearing) which was lower than, or on a com-
parable level with that of its main competitors.
However, since by far the most contracts are
traded on Eurex®, the average price (sales reve-
nue divided by the number of contracts) amoun-
ted to €0.50 per contract, compared with bet-
ween €0.74 and €1.82 for its competitors in
Chicago and London. Eurex was also able to gene-
rate the highest profits, thus proving that low
prices and shareholder value are by no means
a contradiction (see chart).
DEUTSCHE BÖRSE022
Eurex derivatives market: Unrivaled price performance ratioKey performance figures 2001 including clearing
674
336
412
411
307
226 1)
Eurex
CME
CBOE
CBOT
Liffe
Traded contracts (millions)
Sales revenue (€m)
Calculated average price (€)
1) Figures include estimated fees of the clearing organizations OCC (CBOE), BOTCC (CBOT) and LCH (Liffe).
2) Estimated sales revenue
260
322 1)
216
393 1) 2)
0.50
1.82
1.24
1.00
0.74

Clearing, information products, settlement and custodian services: Global reach
Eurex Clearing AG allows Deutsche Börse Group
to minimize the risks involved on the derivatives
market, and recently also on the cash market, for
securities and bond instruments on both exchange
and OTC markets across all time zones. With its
Information Services, Deutsche Börse focused its
data dissemination on Europe, but it achieves
worldwide distribution downstream via Reuters
and Bloomberg. Its data dissemination platform
CEF (Consolidated Exchange Feed) handles data
flows from other stock exchanges and trading
platforms as well. Clearstream, which is now whol-
ly owned by the Group, settles German securities
transactions which are processed on the Xetra®
platform, but also OTC securities transactions
Europe-wide. This means that no other settlement
organization is more active in the field of cross-
border securities trading in Europe than Deutsche
Börse Group. Clearstream is active internationally
in the settlement of OTC bond trading and in all
custodian services.
Stronger together
The range of areas it covers allows Deutsche
Börse to achieve Group-wide effects for the bene-
fit of its customers that other global exchange
and settlement organizations cannot match. This
means, for example, that the different product
areas covered and interrelations between these
products can be exploited: a cooperation with the
Finnish derivatives exchange allowed a substan-
tial proportion of the cash market liquidity of
Nokia shares to be transferred to the Xetra plat-
form. And with indices such as the Dow Jones
STOXX SM, the Eurex derivatives market became
the unbeatable market leader for European indices.
Since Deutsche Börse Group’s various services
can be accessed via a single network, market par-
ticipants can procure additional products and
services at low access costs. A London-based
Eurex participant, for example, can procure the
appropriate Xetra services. American market par-
ticipants, on the other hand, who are already
connected to Eurex and use it to trade European
interest-rate futures, can, should they wish, con-
nect easily to Eurex’s new US exchange, which
is to be built. By using interrelations between the
technologies used, Xetra and Eurex are able to
operate on other markets, too: Xetra serves as
the trading platform for Eurex Bonds, and while
the EEX® energy exchange is operated via Xetra,
Eurex enables trading in energy derivatives.
DEUTSCHE BÖRSE 023

Economies of scale with highest priority
The efficiency factor of fixed employee costs is
almost unlimited. One example: around 70 em-
ployees manage 17 different markets on a daily
basis, regardless of how stable these markets are
at any given moment, in real-time dialogue with
hundreds of customers worldwide. The same is
true for the technologies used: Eurex Bonds and
Eurex Repo, the EEX energy exchange, the stock
exchanges in Helsinki, Dublin and Vienna con-
tribute to the economies of scale of Xetra and
Eurex (see chart). This means that the Xetra
and Eurex trading systems could settle the entire
European transaction volume. As such, Deutsche
Börse Group should be seen as a highly-efficient
“transaction engine”: now that the relevant func-
tions have been consolidated under one roof and
under a single management, Deutsche Börse Group
can erect an almost unlimited number of new mar-
kets, target new regions and introduce products
and services without generating any significant
new fixed costs (see chart “Business Model” on
p. 14). With its agency agreement model, it can
ensure that new transactions incur lower fixed
costs than it is the case with competitors who
wish to enter the same sectors. Even though it has
improved efficiency, Deutsche Börse Group has
also created a considerable number of new jobs.
Thanks to its global sales success, higher produc-
tivity goes hand in hand with higher staff numbers.
DEUTSCHE BÖRSE024
1997 1998 1999 2000
Eurex Xetra
2001 2002 1998 1999 2000 2001 2002
100%
75%
54%
44%
35%30%
100%
70%
46%
30%
18%
Economies of scale: Again lower unit costs in the cash and derivates markets
Costs per contract Costs per trade

Numerous opportunities for growth
In its projects for organic growth, too, Deutsche
Börse relies on the positive effects of the areas
covered. One example of this is provided by the
outsourcing projects for intermediaries and insti-
tutional investors: the new settlement capabilities
resulting from the acquisition of Clearstream, and
the combined technical expertise of Deutsche
Börse Systems, Clearstream and entory make
Deutsche Börse Group a possible provider and,
as such, a point of contact for institutions who
wish to outsource. It is also using the infrastruc-
tures and competencies it has built up in capital
market transactions to acquire additional exchan-
ges and settlement organizations. The envisaged
transactions must allow significant “spill-over
effects” with the areas covered by the acquired
company, for example by providing additional
volume for an existing platform or by extending
the value chain by means of systems solutions
via entory AG for the rollout of infrastructures in
Europe. And with the Infobolsa cooperation with
the Madrid stock exchange, Deutsche Börse can
establish a new business in the German-speak-
ing countries before eventually internationalizing
further. Finally, it can use the establishment or
acquisition of derivatives exchanges in the USA
to enable its Information Products division to
expand its distribution network into an additional
timezone.
Keeping its distance from takeover euphoria
In spite of all of this, Deutsche Börse will not
be misled into paying inflated prices for acquisi-
tions. In its sector, more than in any other, the
“curse of victory” is a constant threat, because
the few acquisition opportunities which do exist
do not always create value: the “offering” of
acquisition opportunities is still very limited.
Most of the organizations are not sellable, and
even when they are, their shareholders are not
yet ready to sell. Certain combinations could,
after all, also give the regulators cause for con-
cern. And even when all of the conditions are
right, the targets are still partly too expensive
and the synergy effects to be expected do not
always compensate for the dilutive effects for
the shareholders. This means that the attainable
coverage effects must be sufficiently great to at
least compensate for the dilutive effects within a
few periods. This is why Deutsche Börse’s acqui-
sition strategy is a long-term one, although it is
always in a position, both from a financial and
an organizational point of view, to bid for an
attractive object at short notice.
DEUTSCHE BÖRSE 025

DEUTSCHE BÖRSE026
Opportunities for cross-selling
Since the integration of Clearstream International,
Deutsche Börse has connections to more than
2,000 wholesale customers worldwide. No other
exchange and settlement organization can draw
upon a larger customer base. At the same time,
only around 5 percent of these customers use
all of the types of services offered by Deutsche
Börse Group (see chart). This results in an enor-
mous cross-selling potential which will be sys-
tematically exploited in the years to come: via
Xetra customers to Eurex services and vice versa,
from Clearstream Banking Frankfurt to Clearstream
Banking Luxemburg and vice versa, from trading
to post-trade business and vice versa.
Orientation at straight-through processing
It therefore becomes clear that only a business
model based on vertical integration can use fixed
costs in the most efficient way possible and
exploit the vast range of areas covered for the
benefit of a larger, European capital market.
Deutsche Börse Group is committed to straight-
through processing (STP), the end-to-end process-
ing of an order: our analyses and the opinion of
market participants show that the existing cross-
process and cross-product STP efficiency in the
Group’s core function Customers/Markets corre-
sponds to best practice. In this environment,
Deutsche Börse Group is focusing on improving
its internal processes and reducing costs. The
STP initiatives aim to integrate the processes, the
collateral deposited and the risk position, and to
set standards for securities markets. These initia-
tives are based on an in-depth understanding of
the current and up-and-coming structures in the
sector, and the consequences on the Group and
its customers.
Huge cross-selling potential:Out of 2,050 customers1) only 110 use the entire service range
Number of customers
Xetra or Eurex 340
1,390 6080
110
1060
International Clearstream business
1)
Customers with business relationships to several areas within Deutsche Börse Group are counted only once.
DomesticClearstream
business

DEUTSCHE BÖRSE 027
Functional business model reflected inthe management structure
What’s unique about Deutsche Börse Group’s
business model is the “multiple use” of its fixed
costs, which it provides in the form of its exper-
tise and systems. Deutsche Börse sees itself as
a transactions engine, which operates beyond
geographical or political borders and uses the
resources it has to trade and settle everything
which can be traded and settled at the lowest
variable costs. In line with this functional pro-
cess model, its management has been organized
to focus systematically on the continuous im-
provement of the relevant processes.
Transformation of complexity into energy – a new management structure
With effect from 1 January 2003, Deutsche Börse
Group introduced a new management structure.
On the one hand, this structure takes account of
the growth of the Group and the demands which
come with it, including the further plans for inter-
nationalization and the readiness to break into
new businesses; on the other hand, it means that
the individual segments will be more closely inte-
grated in order to leverage synergy effects, to keep
the organizational structure as a whole lean, to
optimize decision-making processes and improve
cost controlling. At the level of the 15 managing
directors, the new structure is conceived in such
a way that tasks are allocated in a more function-
oriented manner. This move means that the Group
is parting with the organizational structure it has
had until now, which had been distinctly oriented
towards its legal entities.
■ R. Ferscha
Trading & ClearingServices
▲ C. Lammersdorf
Information Services
■ A. Roelants▲ V. Potthoff
Banking & Custody Services
▲ F. Gerstenschläger
Technology Services
New managment structure: Focus on core functions
Customers/MarketsCorporate Center
■ W. G. Seifert, CEO
■ M. Hlubek, CFO
▲ A. Nawrath
Loading
Operating
Building
▲ M. Reck
GroupFunctionality
▲ J. Röthig
Trading, Clearing, Info Operations
■ M. Ganz, COO
Settlement/ Custody Operations
Operations
■ M. Kuhn, CIO
Central Support
▲ Y. Baguet
Delivery
▲ G. Leßmann
Application DevelopmentClearing & Settle-ment, Custody
▲ U. Kastner
Application DevelopmentTrading and Consulting
Technology/Systems
■ Member of the Executive Committee▲ Managing Director

Adjusted to the core functions: Building, operating, loading
Deutsche Börse Group has developed a manage-
ment structure which reflects the three core func-
tions of its business model (that of a highly-effi-
cient transaction engine), namely the “building”
and “operating” of trading, clearing and settle-
ment systems and the “loading” of the systems
with transactions, in order to achieve economies
of scale and fully exploit its fixed costs. Since the
beginning of the year, the organization has been
divided into the core functions Customers /Markets
Operations and Technology/Systems (see chart
on p. 27). This new structure also signals the
completion of the full integration of Clearstream
International into Deutsche Börse Group.
■ The core function “Customers/Markets” com-
bines the former Xetra and Eurex segments
with their accompanying clearing services in
Trading and Clearing Services. This is Deutsche
Börse’s way of reflecting the convergence of
the cash and derivatives markets to be recog-
nized on the participants’ side. Further orga-
nizational areas in Customers/Markets are
Banking/Custody, Information Services and
Technology Services (entory AG). Customers/
Markets incorporates all of the Group’s mar-
keting operations, allowing it to offer the best
possible, one-stop service to its customers.
The near-market components of product and
service development are also contained in
this core function, in order to allow the Group
to respond quickly and effectively to the exis-
ting and future needs of its customers.
The Chief Executive Officer (CEO) of Deutsche
Börse heads this management function per-
sonally, thus underlining the increased im-
portance of product development, marketing
and sales, as well as the management of the
various sales channels.■ The core function “Operations” is split into
the three functional areas Settlement/Custody,
Trading/Clearing/Information and Group
Functionality. It is responsible for improving
the integration efficiency by means of straight-
through processing, further developing the
functionality of the Group’s systems and re-
ducing unit costs. Operations incorporates
all customer service functions for operative
day-to-day business, i. e. for the use and
operation of the trading and settlement
systems. Deutsche Börse Group hopes to
achieve maximum customer satisfaction by
means of its integrated customer services. ■ The core function “Technology/Systems” –
which, with more than half of all employees,
is the largest unit – deals with the centralized
further development and operation of all
trading, clearing and settlement systems
used by Deutsche Börse Group.
Management network by committees
A team of 15 managing directors leads the Group
in a committee structure comprising Management
Committees, Group Committees and an Executive
Committee. In accordance with German law, the
Executive Committee corresponds to the Executive
Board. The Management Committees reflect the
three core functions: the CEO is chairman of the
Customers/Markets Committee, the Chief Operating
Officer (COO) heads the Operations Committee
and the Chief Information Officer (CIO) leads the
Technology/Systems Committee. In order to link
DEUTSCHE BÖRSE028

the three core functions at Group level, four Group
Committees were created.
■ The Product Development Committee makes
sure that the most promising new products
and services get the go-ahead for use
throughout the organization. ■ The Investment Committee is responsible
for ensuring that the use of the required
resources is in harmony with the company’s
growth and earnings targets. ■ The Risk Management and Compliance
Committee monitors the Group’s risk position
and its integrity in everyday processes. ■ The Compensation and Policy Committee
ensures that Deutsche Börse’s management
system is always up to date.
Close to the customer
These management committees, which, particu-
larly in the Customers/Markets Committee, focus
systematically on improving the benefits for the
customer, consult with the customer committees
which Deutsche Börse has established over the
past few months. The cash market committees
are divided, for example, into primary markets
and secondary markets. A diverse range of target
groups are represented on these committees, from
institutional investors and asset managers, through
brokers and fund managers, to private investors.
The Group wants to work more closely and more
efficiently with market participants. The Advisory
Committees advise the Group on the further ex-
pansion of the market and help it to drive forward
development in the stock market environment.
The experience and expertise of the members
will allow integrated solutions to be elaborated
along the value chain. Regular discussions in the
advisory committees allow the Group to make its
intentions (be it in relation to new products or
improvements to the Rules and Regulations)
transparent for its customers in a timely fashion.
This brings us back to the remarks in the first
part of this text, in which the organizational form
of the public utility companies was criticized: no-
one is more interested in responding systemati-
cally and quickly to the wishes of the customer
than an organization which has to, and wants to,
bring maximum benefit to shareholders.
Deutsche Börse Group believes that the reasons
set out above make its business model a compel-
ling one. The wonderful thing about the free mar-
ket economy is that every theoretical solution,
regardless of how elegant it may be, also has
to work in practice. Europe should allow compe-
tition between the stock exchanges, also with
respect to their organizational forms, instead
of limiting customer choice through dirigisme.
May the best ideas and organizational forms
win! Deutsche Börse Group is confident that its
organizational form as a listed stock corporation
works, and will continue to work, in practice,
and it will again this year offer better products
at similar or lower prices in the interests of its
customers and shareholders.
DEUTSCHE BÖRSE 029

■ Shares outperform reference indices
■ Deutsche Börse AG included in the DAX
■ Earnings per share (EPS in accordance with DVFA/SG) amount to €2.18
■ Dividend payment to shareholders up 22 percent
■ Deutsche Börse receives excellent ratings from agencies
■ Further growth in proportion of international and institutional investors

In the second year after the IPO, Deutsche Börse
AG’s shares continued strongly outperforming the
market overall. Whereas the DAX and MDAX lost
2,267 points (44 percent) and 1,301 points (30
percent) respectively during the same period, and
the Dow Jones STOXXSM 600 Technology declined
by 291 points (57 percent), Deutsche Börse’s
share price amounted to €38.16 at 31 December
2002, a year-on-year decrease of 12 percent.
The highest price for the year amounted to €51.50
on 12 March, the lowest to €32.40 on 1 October
(Xetra® closing prices).
Share performance – and particularly the relative
development as compared with the market over-
all – is an indicator of the future growth that the
capital markets expect of companies. The relative
price performance of Deutsche Börse’s shares
demonstrates that the capital markets anticipate
greater growth potential for Deutsche Börse than
for most other German blue chips.
DEUTSCHE BÖRSE AG SHARES 033
The end of fiscal 2002 marks nearly two years since Deutsche Börse AG’s IPO
on 5 February 2001. In this short interval, the company has become firmly
established on the capital markets thanks to its diversified business model. After
performing well in the MDAX®, its shares have now been included in the DAX®
index. Coverage by analysts has also increased further: 28 analysts – including
representatives of almost all of the major investment banks – tracked Deutsche
Börse AG’s performance by issuing commentaries and reports in 2002. On the
one hand, this underscores the global interest in our company’s “transaction
service provider” business model; on the other, this broad share research has
been a key factor behind the changes in our shareholder structure: over 53
percent of Deutsche Börse AG’s shares are now held by non-German – primarily
institutional – investors. International rating agencies confirm this confidence in
Deutsche Börse’s business model: Moody’s rated the Group Aa1, while Standard &
Poor’s gave us an AA+ rating.
Deutsche Börse AG Shares:Capital Markets Reward SuccessfulBusiness Model

Excellent access to capital marketssimplifies financing
Deutsche Börse utilized the financial buffer gen-
erated by its IPO to expand the company by
acquiring Clearstream International, the securities
settlement and custody company, in which it
previously held half of the shares. This acquisi-
tion strengthens Deutsche Börse’s position as
a fully integrated transaction service provider
and represents another logical step toward further
diversifying the company’s sources of sales
revenue.
Capital increase oversubscribed three times
The value of the broad ownership structure and
the confidence that institutional investors place
in Deutsche Börse’s shares were evident in June
2002, when Deutsche Börse placed just over nine
million new shares from a capital increase on the
capital markets in order to finance the acquisi-
tion of Clearstream International. This placement
met with a great deal of interest among institu-
tional investors despite the difficult market environ-
ment: within a matter of hours, all shares had
been placed. The offering was oversubscribed
three times.
Financial flexibility maintained
The capital increase enabled Deutsche Börse
to maintain its high level of financial flexibility.
Thanks to the proceeds from the placement of
the new shares of almost €400 million, the need
for outside capital was low. After the acquisition
of Clearstream International, the Group’s net debt
amounts to less than €250 million. The excellent
ratings and the high level of institutional investor
demand for Deutsche Börse’s shares will enable
the company to continue to utilize the capital
markets for raising equity and outside capital to
finance value-building acquisitions.
DEUTSCHE BÖRSE AG SHARES034
■ BankgesellschaftBerlin
■ BayerischeLandesbank
■ Bear Stearns
■ Berenberg Bank
■ BNP Paribas
■ Cazenove
■ CommerzbankSecurities
■ Concord Effekten
■ Crédit AgricoleIndosuez/Cheuvreux
■ Deutsche Bank
■ Dresdner Klein-wort Wasserstein
■ DZ Bank
■ Goldman Sachs
■ Hauck & Aufhäuser
■ HSBC Trinkaus
■ HypoVereinsbank
■ ING BHF-Bank
■ JP Morgan
■ Julius Bär
■ Lehman Brothers
■ Merrill Lynch
■ M.M. Warburg
■ Morgan Stanley
■ Sal. Oppenheim
■ Schroder SalomonSmith Barney
■ SEB
■ UBS Warburg
■ WestLB
Analyst coverage (December 2002)

Inclusion in the DAX thanks todiversified business model
With effect from 23 December 2002, Deutsche
Börse AG was admitted to the DAX. The key
factors in the decision were market capitalization
and exchange volume, as with any other admis-
sion to or exclusion from the index.
This acceptance into the DAX only 22 months
after initial listing underscores Deutsche Börse’s
dynamism and successful strategy. Deutsche
Börse’s value-added business model enables it to
grow faster than its competitors – a factor that is
rewarded by the capital markets. As at 31 Decem-
ber 2002, the market capitalization of Deutsche
Börse AG was €4.3 billion, making the company
one of the twenty largest included in the DAX.
DEUTSCHE BÖRSE AG SHARES 035
Clearstream diversifies Deutsche Börse furtherSales revenue by segmentin percent
1) Sales revenue Deutsche Börse Systems and Xlaunch2) Sales revenue IT Division incl. Deutsche Börse Systems, entory and Xlaunch3) Clearstream pro forma for 2002 as a whole
15
11
43
8
23
2002 Xetra
Eurex
Information Products
Information Technology 2)
Clearstream3)
32
18
152)
35
2001 Xetra
Eurex
Information Products
Systems1)

Earnings per share reflect positivecompany performance
Beyond its highly traditional name, Deutsche
Börse (which means “German Stock Exchange”)
is much more than just a marketplace organizer
for trading in German equities: the company is
a transaction service provider that opens up the
global capital markets to companies and investors
with state-of-the-art technology. Deutsche Börse
is more diversified than its competitors, offering
a range of products and services that span the
entire customer process chain from front to back
office.
The positive performance of this diversified busi-
ness model is reflected in the earnings of Deutsche
Börse Group. The Group grew substantially,
with sales revenue up 15 percent (from €760.3
billion in 2001 to €1,106.5 billion in 2002) and
EBIT up 26 percent (from €278.1 billion in 2001
to €351.2 billion in 2002). In 2002, earnings
per share (EPS in accordance with DVFA/SG)
amounted to €2.18, an increase of 7 percent. The continuity in the company’s dividend policy
reflects the anticipated further growth of the Group.
Deutsche Börse intends to increase its dividend
per share by 22 percent year-on-year. A total of
€49.2 million will be distributed to shareholders
(€0.44 per share). The yield per share, which
includes the share price performance and divi-
dends, therefore amounted to –10.7 percent.
DEUTSCHE BÖRSE AG SHARES036
Earnings per share
1993 1) 231.2 49.4
1994 1) 245.8 28.3
1995 1) 268.1 26.8
1996 1) 296.4 46.6
1997 340.4 84.4
1998 455.1 123.3
1999 2) 599.0 131.5
2000 2)3) 648.9 218.9
2001 2) 760.3 319.2
2002 2) 1,106.5 374.4
Sales Profit before tax
from ordinary activities
€m €m
Development of Deutsche Börse’s sales revenueand profit in the last 10 years
Number of Deutsche Börse AG shares as at 31 Dec. 111,802,880 102,760,000
Average number of shares 107,615,903 99,763,014
Earnings per share in accordance with DVFA/SG (€) 2.18 2.04
Distribution to shareholders (€m) 49.2 1) 37.0
Distribution per share (€) 0.44 1) 0.36
1) Proposal for 2002
2002 2001
1) Consolidated financial statements in accordance with the HGB2) Deutsche Börse Clearing AG was fully consolidated until 1999. The 50 percent
interest in Clearstream International S.A. was carried at equity following themerger of Deutsche Börse Clearing AG with the operations of Cedel Internatio-nal S.A. to form Clearstream International S.A. Following the acquisition ofCedel International S.A., Clearstream International S.A. has been fully consoli-dated since 1 July 2002.
3) Sales revenue for fiscal 2000 restated to exclude net licence fees collected on behalf of the regional exchanges.

22%
47%
23%
6%
Proportion of international investors rises
The change in the shareholder structure also in-
dicates the value placed on Deutsche Börse’s
business model by the capital markets. In 2002,
the proportion of shareholders from other countries
increased significantly and now totals over 50 per-
cent. At the same time, the number of financial
investors, who are focusing on sustained value
growth, has grown as compared with the number
of strategic investors. This is a positive sign
for Deutsche Börse Group: the company’s market-
oriented approach strengthens its efforts to in-
crease shareholder value.
Paramount goal of Deutsche Börse AG is and will
remain the continuous improvement of the benefits
to be gained by the clients. Accompanying this is
the company’s aim to upgrade its own value along
the entire process chain. Deutsche Börse AG
anticipates continued growth again in 2003.
DEUTSCHE BÖRSE AG SHARES 037
22%
76%100%
Institutional investors hold majority of shares
International investors more strongly represented
Shareholder structure
Geographical distribution
Before the IPO End of 2001 End of 2002
68%
2%2%
47%
100%
Before the IPO End of 2001 End of 2002
Strategic investors (pre-IPO shareholders)
Europe
Private investors
USA
UK
Germany
51%
12%
12%6%
Other countries2% 2%
Institutionalinvestors

■ Number of staff increases almost threefold due to acquisitions of
Clearstream International and entory
■ Highly qualified international team
■ Attractive salaries and first-rate social benefits
■ Conscious promotion and development of qualified employees
■ Management recruited from own ranks
Deutsche Börse Group employees
Division 2002 2001
Number of employees as at 31 Dec. 3,318 1,123
Xetra 179 194
Eurex 142 116
Information Products 161 84
Information Technology 1,448 –
thereof: Deutsche Börse Systems 533 536
Clearstream TEC 571 n.a.
entory 336 388
Xlaunch 8 8
Corporate Services 449 185
Clearstream 939 n.a.
Sales revenue per employee1) (€ thousands) 481 748
Average age 35.9 36.4
Percentage of university-educated employees 68.0 64.4
1) Based on the average of full-time equivalent (FTE) employees

OUR STAFF 041
After the acquisition of the IT service provider entory and the clearing organiza-
tion Clearstream International in fiscal 2002, the number of staff employed by
Deutsche Börse Group increased almost threefold. For the company, this means
a substantial increase in highly qualified employees and therefore even better con-
ditions for its business success. Depending on their position in the value chain at
Deutsche Börse, employees have special skills due to their training as economists,
lawyers, computer scientists, or physicists, for example. They are highly analyti-
cal and result-oriented, and possess the social competence to take responsibility
early on. Deutsche Börse Group offers employees very attractive salaries and
above-average social benefits, while training staff via special courses as well as
directly on the job. In 2002, the Group became even more international, opening
up a whole new range of career development opportunities for employees.
2002 was dominated by volatile capital markets
and a weak labor market. This was the backdrop
against which Deutsche Börse successfully inte-
grated the employees of two newly acquired
companies into the Group. After the acquisition
of the IT service provider entory and the clearing
company Clearstream International, Deutsche
Börse Group employed 3,318 permanent staff as
at 31 December 2002 – almost three times as
many as the year before (see table on opposite).
1,738 of these employees were employed by
Clearstream International, and 336 by entory,
including its subsidiaries Finnovation GmbH and
Silverstroke AG. The employee turnover rate
amounted to 8.7 percent. Deutsche Börse
employs a young, especially well-educated
and international team. The average employee
age is 36 years, while 68 percent of the staff
are university-educated. At present, staff are
employed at 17 sites in 11 countries. As at
31 December 2002, the company employed
3,126 staff from the EU (Germany: 1,783,
France: 360, UK: 225, Luxembourg: 175,
other EU countries: 583) and 192 employees
from other European countries and overseas.
Our Staff: Skills Base Increases

Recruitment
Deutsche Börse is among the most attractive
employers in Germany. This has been confirmed
by various studies and surveys conducted among
staff members and university graduates. The
majority of Deutsche Börse’s employees are
recruited via the Internet. Both applicants and
employees value the company’s excellent training
and development opportunities, job security, and
market success. Deutsche Börse Group’s corporate
culture and image as an employer are a solid foun-
dation for the recruitment, development and long-
term commitment of employees to the company.
Training and development
The training options for employees of Deutsche
Börse Group were also influenced by the need
to integrate Clearstream International and entory
in 2002. Employees participated in more than
270 different seminars on topics such as soft-
ware applications, foreign languages, interper-
sonal skills, and specific stock exchange issues
at Deutsche Börse, entory and Clearstream Inter-
national. Starting in 2003 the internal training
program will also be accessible via the electronic
staff-training portal.
Deutsche Börse regularly proves that commitment
within and to the company is worth it: nearly
80 percent of management is recruited from the
company’s ranks as a result of the conscious
promotion of employees who stand out due to
their extraordinary skills, creativity, and high
level of commitment.
Deutsche Börse Group favors flexible structures,
flat hierarchies, and short decision-making chains.
Highly qualified beginners and experienced experts
work together in project teams to encourage know-
ledge transfer and accountability.
OUR STAFF042
Deutsche Börse Group offices and number of employeesas at 31 December 2002
Office Number ofemployees
Germany Frankfurt 1), 2), 3), 4) 1,593
Berlin 1) 1
Ettlingen 4) 232
Hamburg 4) 8
Cologne 4) 2
Munich 4) 17
Europe Luxembourg 2) 1,190
Lisbon 5) 6
London 1), 2) 98
Madrid 5) 68
Paris 1), 2) 13
Zurich 3) 16
America Chicago 1), 3) 36
New York 2) 11
São Paulo 2) 5
Asia Dubai 2) 3
Hong Kong 2) 19
Total 3,318
1) Deutsche Börse and Deutsche Börse Systems2) Clearstream3) Eurex4) entory5) Infobolsa

Performance and remuneration
Deutsche Börse offers highly attractive salaries
and above-average social benefits. An integrated
human resources system will be implemented in
the coming year to make employee development
and remuneration even more transparent. Skills
and performance are the key criteria here.
Deutsche Börse Group will introduce an employ-
ee stock program in 2003 to link remuneration
more directly to individual performance and the
success of the company.
OUR STAFF 043
The Infobolsa team:
Financial information for professionals
Within less than six months after the acquisition, the
ten-member project team succeeded in positioning
Infobolsa Deutschland GmbH as a supplier of up-to-
date capital and money market data. The new com-
pany is a subsidiary of Infobolsa S.A., a joint venture
between Deutsche Börse AG and Bolsa de Madrid;
within the past ten years, this company has developed
into the leading supplier of financial information in
Spain and Portugal (see p. 70).
Eight team members – three from Infobolsa S.A.
and five from the Information Products and Infor-
mation Technology divisions of Deutsche Börse –
first examined the technical conditions for the Ger-
man-Spanish partnership and analysed the require-
ments of the German market. The team then designed
the prototype for a financial information system,
which was ready for the first pilot implementation
at a customer’s company after only six months.
Michael Rode (31) is responsible for product devel-
opment within the Infobolsa project. “The team
worked hard to achieve this success, both in Frank-
furt and for several longer periods in Madrid”,
Michael Rode says. Infobolsa was his first inter-
national project of this dimension. And he was
thrilled by the challenge: “Which other company
gives you the opportunity to build something
completely new with a highly motivated team
while allowing you maximum freedom to do so”?
Thomas Book (31) and his team took care of
all the financial and legal issues surrounding the
establishment of Infobolsa. “It was great fun to
steer this team with colleagues from various cultures
toward a common goal”, concludes Book. What
fascinates him about the Infobolsa project are its
prospects: “The formation of Infobolsa Deutschland
GmbH is the first step toward building a major
European information supplier. The market should
watch out for us”!

■ Sales revenue of Xetra segment down by 13 percent to €210.8 million
■ EBIT down to €17.4 million (minus 55 percent)
■ Number of transactions on Xetra increased by 21 percent,
market share further enhanced
■ New segmentation of equity market increases transparency and legal certainty
■ Greater efficiency for market participants thanks to central counterparty
■ Position as one of the leading index funds trading platforms asserted
■ Launch of Xetra BEST: price guarantee and immediate order execution

XETRA 047
The slump on the equity markets continued in 2002. However, Deutsche Börse’s
Xetra Division was able to maintain its position in this difficult environment.
At the same time, it set standards and created structures that offer the potential
to increase its value when the markets pick up. These include establishing
a new structure for the German equity market, which has already been the
European leader in terms of transparency and investor protection. Other innova-
tions – such as the expansion of the equity market infrastructure to include an
equity central counterparty or the improved conditions for executing customer
orders on Xetra® (Xetra BEST®) – prepare the ground for future growth. Xetra is
also synonymous with the systematic automation and internationalization of
securities trading. The trading system bundles liquidity in a network spanning
16 countries. It operates independently of the trader’s location, substantially low-
ers transaction costs and provides deep insight into the order book by document-
ing the bids and asks for every security that can be traded. This ensures trans-
parency and fairness for all market players.
2002 again saw sharp setbacks in equity prices
around the world. International benchmark
indices hit all-time lows, and the DAX® was dis-
proportionately affected (see chart on p. 48). The
reasons for this include a global economic slow-
down spanning all sectors and the extreme restraint
being shown by private investors. Correspondingly,
the market was unreceptive to new issues in 2002.
With only four IPOs on the FWB® Frankfurter
Wertpapierbörse (the Frankfurt Stock Exchange),
issuing business remained muted. Despite the
adverse market environment, the Xetra Division
expanded its position in fiscal 2002.
The total number of transactions on Xetra rose to
60.0 million in 2002 (as against around 49.7
million in the previous year) – a year-on-year
increase of 21 percent. However, sales revenue
failed to match the previous year’s figures; in
total, it amounted to €210.8 million (as against
€243.1 million in 2001) which corresponds to
a decrease of 13 percent. This is because part of
the Xetra fees are measured in terms of the value
of traded shares, which has fallen in 2002. None-
theless, prices for trading in Xetra have remained
constant.
Xetra: Setting Standards, Creating Structures

-50
Jan. Feb. Mar. Apr. May Jun. Jul. Aug. Sep. Oct. Nov. Dec.
-40
-30
-20
-10
0
10
20
DAX underperformed other blue-chip indices
Performance of international benchmark indices in 2002
Nikkei
Dow Jones Industrial Average
in percent
FTSE DAX
CAC 40
In 2002, the Xetra Division continued to invest
in laying the foundations for future growth. Xetra
developed the central counterparty for securities
trading and founded the subsidiary Deutsche
Börse Computershare in October 2002 to tap the
German market for services geared to the issuers
of registered shares.
The division partially offset falling sales revenue
through savings in external and operating costs,
and by reintegrating Newex®, the market segment
for Central and East European securities. In 2002,
operating and network costs in the Xetra Division
amounted to €42.5 million, as against €47.3
million in the previous year. Earnings before inter-
est and taxes (EBIT) declined by 55 percent to
€17.4 million – particularly as a result of invest-
ments in the central counterparty (€15.8 million).
All in all, the Xetra Division contributed 5 percent
to Deutsche Börse Group’s total earnings.
XETRA048
German capital market pioneersinvestor protection and transparency in Europe
Over recent years, the German capital market
has experienced dynamic development at a regu-
latory level; in many cases, Deutsche Börse AG
was the agent of this change. In fiscal 2002, it
focused in particular on investor protection and
the modernization of stock exchange law.
Following the introduction of the “Viertes Finanz-
marktförderungsgesetz” (Fourth German Financial
Market Promotion Act), Deutsche Börse restruc-
tured the equity market. The new structure, which
is both clearer and more consistent, became
effective on 1 January 2003, and replaces the
previous mix of multiple markets, segments and
sector divisions. Deutsche Börse can now meet
the requirements of issuers and investors with
even greater precision.

XETRA 049
At the heart of this reform are two clearly differ-
entiated admission standards: the Prime
Standard and the General Standard.
■ In the Prime Standard, issuers must meet
transparency requirements that comply with
the information requirements of international
investors. A listing in the Prime Standard is
a precondition for admission to a Deutsche
Börse selection index. ■ The General Standard is based on legislative
requirements and acts as the entry segment
to the German capital market. Its regulations
are compulsory for all issuers.
Transparency and attractiveness on the one hand,
and legal certainty and integrity on the other are
preconditions for high-quality, efficient capital
markets. The new structure will make the German
equity market even more attractive for national
and international investors, while the greater
legal certainty will boost investor confidence.
New indices offer greater clarity
Parallel to the restructuring of the equity market,
Deutsche Börse has introduced an index system
that is oriented to different investment strategies.
The DAX still represents the 30 largest German
securities (blue chips). Below the DAX, a distinc-
tion is made between traditional and technology
sectors. Deutsche Börse’s index for the traditional
sectors is the MDAX®, which will be reduced
from 70 to 50 securities (mid caps). Technology
companies will be listed in the TecDAX®, the
new technology index, which will represent the
30 largest technology securities. The SDAX®
comprises 50 securities and comes directly
below the MDAX as a selection index for smaller
companies (small caps). The CDAX® (Composite
DAX) continues to comprise all German securities
in the Prime and General Standards across all
sectors and segments.
A company may only be admitted to one of
the selection indices – DAX, MDAX, SDAX and
TecDAX – if it meets the additional transparency
requirements of the Prime Standard and is con-
tinuously traded on Xetra. The three selection
indices below the DAX are also open to foreign
companies whose home market is Germany.
The NEMAX® 50 Neuer Markt Index will be
calculated until the end of 2004, in order to
ensure the continuity of the financial products
based on it.
One market – two standards
As of second quarter 2003, issuers can choose
between admission to the Prime or the General
Standard. The two standards each have different
transparency requirements that companies must
subsequently meet.
Prime Standard
Additional transparency through
■ quarterly reports
■ international accounting
(IFRS/IAS or US GAAP)
■ financial calendar
■ at least one analysts’ conference per year
■ ad hoc disclosures in German and English
General Standard
Statutory requirements, such as annual and half-
yearly reports and ad hoc disclosures in accor-
dance with German law

Neuer Markt: Role model for transparency and liquidity
As of the end of 2003, Deutsche Börse will dis-
continue Neuer Markt as an independent segment;
instead it will be fully integrated into the Prime
Standard. Companies can choose the new segment
as their IPO platform. All securities still listed on
Neuer Markt and in SMAX® may be traded without
restriction, regardless of the restructuring of the
equity market.
With the resegmentation of the equity market
and the introduction of a clearer set of indices,
Deutsche Börse drove forward key restructuring
processes in fiscal 2002. In future, it will exchange
its role as innovator for that of a moderator, help-
ing to coordinate the sometimes divergent inter-
ests of market participants and legislators.
Close coordination with customers
Products and services have to meet the require-
ments of different customer groups. Deutsche
Börse coordinates the central themes with its
customers in equally-represented committees.
In the Primary Markets Advisory Committee, for
example, employees of Deutsche Börse discuss
together with representatives of issuers, invest-
ment banks and investors the future structure
of the primary market. The Investors Advisory
Committee, which is made up of representatives
of leading institutional investors, advises Deutsche
Börse on the expansion of its spectrum of products
and services tailored specially to investor needs
(see also p. 96ff.).
Central counterparty: Fewer risks andgreater efficiency for market participants
Since 1998, there has been a Eurex central
counterparty for derivatives; in Q1/2003, Deutsche
Börse will also introduce the central counterparty
(CCP) for the Frankfurt Stock Exchange’s cash
market.
How does the central counterparty work? When
a securities transaction takes place, Eurex
Clearing AG acts as a counterparty for both the
buyer and the seller, who thus conclude the
transaction anonymously with the central coun-
terparty, rather than each other. This anonymity
simplifies complex trading strategies involving
equity market, derivatives market and index
products. Then, the central counterparty assumes
the default risk and offsets the participant’s pur-
chases against its sales (netting). Only the result-
ing balance is invoiced in line with the principle
of “delivery against payment”. To allow the CCP
to perform this function, cash market participants
deposit collateral with it in the form of cash,
securities, or book-entry securities.
New indices create the most transparent equity market in Europe Deutsche Börse selection indices
XETRA050
GENERAL STANDARD
PRIME STANDARD
FURTHER LISTED COMPANIES

With the CCP, Deutsche Börse is investing in the
sustained improvement of the securities trading
infrastructure: it is extending the two-link process-
ing chain of trading and settlement to include a
clearing component. The central counterparty is
Deutsche Börse’s answer to the growing demands
for standardization, risk management and effi-
ciency in the securities business.
The CCP product range is initially limited to Ger-
man collective custody shares tradable on Xetra.
The first release of the central counterparty pro-
vides the foundation for a fully integrated clear-
ing house that will consolidate Deutsche Börse’s
position as a one-stop provider of securities ser-
vices. With future releases, Deutsche Börse plans
to extend the product offering to include foreign
shares, exchange-traded funds and OTC business
(off-exchange trading), for example.
Xetra price model: Individual use of different services
Parallel to realizing the Equity CCP, the Xetra
Division will launch a new price model on
1 April 2003. In future, trading, clearing and
settlement are to be invoiced separately.
Compared with the previous all-in price for trad-
ing and settlement, the new system will make it
easier for customers to individually use the var-
ious services of Deutsche Börse and make price
comparisons with competitors.
Under the old pricing model, prices in Xetra trad-
ing were already linked to the volume of an
order, with a floor and a ceiling for each individ-
ual order. This principle will be retained in the
new Xetra pricing model, but a change in the
applicable limits will see small orders become
cheaper and large orders more expensive. Even
with this new pricing regime, Xetra will be the
price leader among the European exchanges.
Xetra BEST: Price guarantee for privateinvestors thanks to best execution ofcustomer orders
Xetra Best Execution – or Xetra BEST for short –
is a new service with which Deutsche Börse has
reinforced the competitive position of its Xetra
platform. Xetra BEST highlights Deutsche Börse’s
skill in reacting to market requirements quickly
and flexibly and in promoting the concentration
of liquidity on a single trading platform.
Since 2 September 2002, the Xetra Division has
been offering banks and securities trading houses
an additional alternative for order execution: they
can either execute orders on Xetra or use Xetra
BEST internally to net them against their portfolio.
However, a precondition is that they calculate a
better price for their customers than the current
Xetra price. Private investors have the advantage
of a price guarantee, and Xetra BEST also ensures
immediate execution of their orders.
XETRA 051
Order
Trade confirmationContract note
Order
Trade confirmationContract note
Disposition
Settlement confirmations,risk data
Settlement instructions,information on pending trades
Settlement confirmations,income and non-income events
Settlement confirmation
Settlement confirmation
Disposition
Trading data
Settlement confirmations,risk data
The CCP model: Anonymous trading at lower risk
Marketpartici-pant A
Marketpartici-pant B
SettlementSettlementEurex Clearing AG
(CCP)
Clearstream BankingFrankfurt
Trading TradingFrankfurt Stock
Exchange(Xetra, Floor)

Deutsche Börse Computershare: Professional issuer services
Deutsche Börse Computershare GmbH is a
joint venture between Deutsche Börse AG
and the Australian company Computershare Ltd.
The company’s core services are share register
management, general meeting services and
Internet voting.
In choosing Computershare Ltd., Deutsche Börse
partnered with the most efficient provider of
issuer services in the business. Computershare,
founded in 1979, manages data for around
68 million shareholders worldwide and provides
services to listed companies, investors, stock
exchanges and financial services providers.
Deutsche Börse Computershare, based in
Frankfurt/Main, was formed in the autumn
of 2002, and is currently managing data of
around six million registered shareholders.
XETRA052
Increased international significance of the Xetra platformTrading participants on Xetra as at 31 December 2002
Madrid 6
Milan 7
Vienna 23Zurich 14
Frankfurt 198
Athens 3
Hong Kong 1
Paris 16
Brussels 5
London 48
Dublin 5
Amsterdam 23
Oslo 2
Stockholm 3
Helsinki 2
Luxembourg 3
Host
Access point
Participant

XTF Exchange Traded Funds:Sales revenue growth with innovativeproducts
Two years ago, Deutsche Börse introduced a seg-
ment for exchange-traded funds (ETFs) under
the XTF® brand. In 2002, XTF was the most suc-
cessful segment in terms of order book volumes
on the Frankfurt Stock Exchange after the DAX,
and one of the strongest ETF markets in Europe
in terms of sales revenue (almost 45 percent).
Deutsche Börse offers investors major advantages
as against the competition: the largest network of
participants in the world, a link between the cash
and derivatives markets based on a standardized
technological infrastructure and the lowest trans-
action costs.
In addition to the ETFs themselves, the shares
the funds are based on are also traded on Xetra.
Parallel to this, the Eurex derivatives exchange
offers derivatives of the ETF base indices, and
became the world’s first exchange to offer trading
in ETF options and futures on 18 November
(see also p. 62).
In 2002, the funds generating the greatest sales
revenue were the DAXEX at €13.65 billion and
the Dow Jones Euro STOXX 50EX at €9.04 billion.
These two products alone accounted for 32 per-
cent of the European market for ETF trading.
Currently, 65 index funds and 23 actively man-
aged funds are listed on Deutsche Börse’s XTF
segment. In offering the pan-European sales
platform XTF, Deutsche Börse provides the invest-
ment funds with access to further markets and
customer groups.
Xetra expands into new markets
In 2001, Deutsche Börse began admitting inter-
national shares to Xetra trading under the name
“Xetra Global Markets” in order to further increase
its market share. Under this one-stop-shopping
concept, investors can trade in foreign blue chips
with a high degree of liquidity and at low cost on
Xetra, implement complex trading strategies with
international stock options on Eurex and settle all
their orders at domestic rates through Clearstream.
Xetra Global Markets currently comprise Xetra
US Stars® and Xetra European Stars® – i. e. the
Dow Jones Industrial Average, Dow Jones Global
Titans 50, S&P 100 and Nasdaq 100 securities,
as well as the Dow Jones Euro STOXX 50 SM’s
Dutch, French, Belgian and Finnish securities.
Today, the entire Euro STOXX 50 on Xetra has
already achieved a level of liquidity similar to
that of the MDAX.
XETRA 053

■ Eurex increases sales revenue by 23 percent to €331.6 million
■ EBIT grows to €158.3 million (plus 60 percent)
■ Leading position as derivatives exchange in the world
■ World market leader for capital market products and stock options
■ Index products record largest increases (plus 60 percent)
■ Eurex drives forward development of global network and taps US growth market
Eurex increases lead over competitorsAnnual transaction volume in million contracts
801
674
344
260
697
614
558
412
268
307
Eurex
Euronext. Liffe1)
CME2)
CBOT3)
CBOE4)
2002
2001
1) Joint venture of the derivatives exchanges in Paris, London, Brussels, andAmsterdam. The volume of the index contracts traded on Euronext in Paris is considerably smaller than that of the other exchanges.
2) Chicago Mercantile Exchange3) Chicago Board of Trade4) Chicago Board Options Exchange

EUREX 057
The Eurex derivatives exchange is the world market leader for trading and clear-
ing futures and options. Its global distribution network for derivatives market
products with 424 participants in 18 countries and over 10,000 trading screens,
the integration of trading and clearing and an attractive product portfolio make
the Eurex Division the largest growth driver in Deutsche Börse’s business model.
The Xetra and Eurex divisions are closely tied to one another. The cash markets
supply the underlyings for products on derivatives markets in the form of shares
and bonds. In 2002, the volatility of the equity markets boosted demand for deriv-
atives. It also further reinforced the trend towards risk management optimization
and neutral clearing platforms, which also help to reduce credit risk. In fiscal
2002, Eurex launched Europe’s fastest-growing derivatives market products by
introducing sector indices; it attracted new customer groups and expanded its
cooperation with off-exchange markets.
The Eurex derivatives exchange, a joint venture
between Deutsche Börse and SWX Swiss Exchange,
impressively confirmed its leading position for
trading and clearing financial derivatives in fiscal
2002: after increasing the volume of contracts
traded by almost 50 percent in 2001, Eurex went
on to improve this figure by a further 19 percent
in 2002. 801.2 million contracts were traded.
October 2002 was the most successful month
in Eurex’s history to date: it achieved a new
volume record with 86.5 million contracts, an
increase of 36 percent year-on-year (October
2001: 63.7 million contracts).
Eurex: Success in Volatile Markets

Eurex’s core business is trading in capital market
products: it is the world market leader in this field.
In 2002, it achieved a European market share of
more than 90 percent and a world market share
of around 60 percent, with a trading volume
of 446.6 million contracts. The most frequently
traded product was the Euro Bund Future, which
accounted for around 24 percent of trading
volume or 191.2 million contracts (a year-on-year
increase of 7 percent). This has been the world’s
most actively traded contract since January 1999.
EUREX058
Global distribution network: 424 Eurex participants with more than 10,000 trading screens in 18 countriesas at 31 December 2002and XX.XX.200X
Spain 15
Portugal 1
Gibraltar 2
Italy 11
Austria 5
Switzerland 39
Germany 125
Greece 4 Australia 1
France 30
Belgium 4
UK 71
Ireland 6
Netherlands 29
Denmark 2
Sweden 4
Finland 12
Host
Access point
Participant
Trading in the Euro Bobl Future amounted
to 114.6 million contracts in the past year,
corresponding to a 15-percent increase; Euro
Schatz Future contracts rose by 17 percent
to 108.7 million.
Even stronger trading volume growth was record-
ed for equity- and index-based derivatives. In
fiscal 2002, Eurex posted a trading volume of
354.0 million contracts for these products –
34 percent more than in the previous year. The
largest share (210.7 million contracts) related to
the equity index derivatives segment. On average,
Eurex generated a trading volume increase of
60 percent with these products, which include
USA 63

futures and options on the DAX®, Dow Jones
Euro STOXX 50SM and NEMAX® 50, among others.
The stock options segment recorded 8 percent
more contracts as against 2001, for a total of
143.3 million. In fiscal 2002, Eurex became the
largest stock options exchange in the world, based
on the value of the underlying shares, overtaking
the Chicago Board Options Exchange (CBOE), the
previous world leader.
What makes Eurex’s product portfolio particularly
interesting is its diversity, which has continued
to improve with rising volume. Despite Eurex’s
double-digit growth rates, Euro Bund Futures are
now only responsible for around 24 percent of
total volume (2000: 33 percent), while the pro-
portion accounted for by the equity index segment
rose from around 16 percent in 2001 to over
26 percent in 2002. This broader diversification
makes Eurex trading products more attractive
for investors.
EUREX 059
Rising trading volume in capital market, equity and index products
2000
150
0
300
450
600
750
900
2001 2002
Growth 2000 – 2002
Capital market products
89
7643
63
15131
133
132
93
100
17839
143
211
109
115
19132
The Eurex product range
■ Capital market products, e. g. Euro Bund,
Euro Bobl, Euro Schatz
■ Equity index products, e. g. futures and options
on the DAX, NEMAX, Dow Jones Euro STOXX
and exchange traded funds (ETFs)
■ Equity products, e. g. German, Swiss and
international equity options
■ Money market products, e. g. Euribor Futures,
Euribor Futures options
in million contracts
Eurex generated sales revenue totaling €331.6
million in fiscal 2002 with these trading
volumes, a 23-percent increase year-on-year.
80 percent of the German-Swiss joint venture’s
earnings are included in the income statement
of Deutsche Börse AG as earnings contributed
by the Eurex Division.
Other capital market products
+ 3 %
Euro Bund Future
+ 26 %
Euro Bobl Future
+ 83 %
Euro Schatz Future
+ 154 %
Equity index products
+ 178 %
Stock options
+ 61 %

1 2
55
6 7
Repo transactions allow low-cost, low-risk
management of short-term liquidity. A repurchase
agreement (repo) entails the sale of securities
with a simultaneous agreement to buy back
securities of the same kind at a later date.
Costs went down by 2 percent and stood at
€247.0 million in 2002 (2001: €252.6 million).
The Eurex Division’s earnings before interest and
taxes (EBIT) for 2002 were up roughly 60 percent
on the previous year’s figure at €158.3 million.
At 45 percent, they are the largest contributor to
Group EBIT. In 2002, Eurex was again the most
successful and fastest-growing segment of
Deutsche Börse Group.
Eurex Bonds and Eurex Repo: Newtrading platforms for new customers
On 22 May 2002, Bundesrepublik Deutschland
Finanzagentur GmbH (the German Finance
Agency, which is the German government’s cen-
tral service provider for credit financing issues)
started trading on the Eurex Bonds and Eurex
Repo platforms. The Agency’s involvement
emphasizes the growing significance of fully
electronic bond and repo trading. The German
Finance Agency brings the number of partici-
pants on Eurex Bonds to 23 banks and trading
houses and the total number of Eurex Repo
participants to 21.
EUREX060
Bank Bquotes
ConfirmationConfirmation
3Trading data
accepts
Confirmation
Margin deposit/Security deposit Margin deposit/Security deposit
Eurex Repo GmbH
Clearstream Banking Frankfurt Euroclear
Bank A
Processing a euro repo transaction
Settlementinformation Collateral Collateral
6
Eurex Clearing AG(CCP)1)
7
1) Contractual relationships exist between bank A and Eurex Clearing AG (CCP)as well as between bank B and Eurex Clearing AG (CCP).

Equity index derivatives: Internationalproducts for internationally orientedinvestors
From an investment strategy viewpoint, European
products will continue to grow in significance as
economic integration in Europe increases. While
only 10 percent of the equity index contracts
traded on European exchanges were European
at the beginning of 2001, Eurex’s Dow Jones
Euro STOXXSM contract has now achieved a mar-
ket share of more than one third of all European
EUREX 061
Eurex Bonds
is the fully electronic platform for OTC bond trad-
ing and is operated by Eurex and major bond trad-
ing houses. In addition to German government
bonds, Eurex Bonds offers issues by the Kredit-
anstalt für Wiederaufbau (KfW – German Devel-
opment Bank), the European Investment Bank and
individual German states, as well as Jumbo-Pfand-
brief (mortgage bond) issues.
Eurex Repo
is the European marketplace for repo trading (sale
and repurchase agreements) in German bonds and
Jumbo mortgage bond issues as general collateral
for secured fund-raising and special repos for
lending specific securities with terms from one to
365 days. In November 2002, the outstanding
volume on Eurex Repo totaled nearly €10 billion.
equity index contracts. Together with DAX, Dow
Jones STOXX and SMI index contracts, Eurex has
a European market share of almost 60 percent,
based on the value of the underlyings.
Derivatives contracts on sector indices
Institutional investors operating on a global scale
in particular have their sights set on the European
market as a whole; they prefer to invest in cross-
border sectors rather than in individual securities
on national markets. Reflecting the international-
ization of investment behavior, Eurex has intro-
duced a total of twelve additional futures and
options contracts on European sector indices.
On 22 April 2002, Eurex launched futures and
options on the Dow Jones Euro STOXX index’s
automotive, energy and insurance sectors,
followed by the financial services, media and
utilities sectors on 23 September. The leap in
volume can be taken as an indication of the
increased attractiveness of the index derivative
range: trading in Dow Jones STOXX sector index
futures and options rose to around 14,800
contracts per day in 2002 – seven times the
figure for the previous year.

Fully electronic trading a success factor
Eurex, just like its predecessors DTB and Soffex,
has been a fully electronic exchange since it was
founded in 1998. Its powerful and highly acces-
sible software contributes to the efficiency of trad-
ing and clearing; new releases constantly improve
on functionality and ensure consistently high
performance.
Eurex offers its customers a fully integrated trad-
ing and clearing platform for the settlement of
the entire derivatives trading process chain. As
no additional clearing fees are incurred, Eurex’s
all-in prices are unbeatable. In addition, extend-
ing integrated clearing services to include cash
market products (fixed-income securities and
shares) enables joint valuation of cash and
derivative positions. Thus, participants in both
markets can profit from lower costs.
The Eurex range of products is developed in close
coordination with the clients. Working groups are
held at regular intervals with market participants
to discuss new ideas and suggestions (see also
p. 96ff.).
Eurex taps US growth market
It’s not just the product range that is becoming
more international. For example, Finnish stock
options are traded at Eurex within the framework
of the cooperation with HEX (Helsinki Exchanges).
With some 20 million contracts (2001: 15 million),
the option on Nokia is one of the most frequently
traded stock options on the Eurex derivatives
exchange.
Options and futures on European ETFs
In 2001, Eurex became the first European exchange
to offer exchange-traded fund (ETF) derivatives.
Eurex was also the first exchange in the world to
introduce ETF futures in addition to options. The
derivatives exchange is reacting here to develop-
ments on the cash market, where the number and
transaction volume of ETFs is rising constantly
(volume increase in 2002 as against 2001:
around 41 percent).
Deutsche Börse’s Xetra Division commenced
trading in ETFs in 2000. On 18 November 2002,
Eurex launched ETF futures and options on the
market. These products supplement the range of
traditional hedging instruments. Institutional
investors welcome the possibility of diversifying
more greatly their investment activities, and use
these instruments for precise risk management.
ETF futures and options offer three key advantages:
■ Management of smaller risk positions
is optimized.■ They open up arbitrage and trading
opportunities between the derivatives
and cash markets.■ They are structured for physical delivery.
EUREX062

EUREX 063
Eurex is opening up a growing number of inter-
national markets and is experiencing above-aver-
age growth abroad: in 2002, Eurex generated
almost 70 percent of its trading volume with
international participants (companies headquar-
tered outside Germany or Switzerland). This corre-
sponds to year-on-year growth of 7 percentage
points. 41 percent of the trading volume was
accounted for by UK participants, up 8 percent-
age points from 33 percent in 2001. At the
same time, the share of the volume traded by
German participants declined to 25 percent
(2001: 31 percent).
Second, the restructuring of the a/c/e alliance
between Eurex and the Chicago Board of Trade
(CBOT) in July 2002 enables Eurex to extend its
current derivatives business in the US to include
products with US underlying, and to establish its
own exchange. These plans underpin Eurex’s
global growth strategy.
Eurex and CBOT agreed at that point to end
the alliance as it had originally been laid out in
January 2004 – nine months before its scheduled
end in October 2004. They also lifted all restric-
tions regarding products and areas of cooperation
which, initially, had not been supposed to be
reassessed before 2008. The new structure of
the alliance grants Eurex greater flexibility in its
products, technology and future strategy.
The restructuring of the a/c/e alliance allows
Eurex to establish its own exchange in the US
under US regulation. Trading in US interest rate,
index and equity product derivatives is expected
to commence on the new US exchange in early
2004. Customers will be able to use the current
Eurex® and a/c/e infrastructure for both US and
European products, thereby profiting from the
cost-efficient, direct access to the entire spectrum
of Eurex products.
UK
Eurex – Focus on business with international customers
41 %
Share of volume by region
Germany 25 %
10 %
France
8 %Switzerland
5 %Other countries
11 %
USA
Eurex reached two milestones on the US market
– a market made all the more important by its
growth potential. First, Eurex has been permitted
to offer European sector index products in the US
as well, from spring 2002. The approval for this
was granted on 2 April 2002 by the Commodity
Futures Trading Commission (CFTC) supervisory
authority. This means that Eurex participants in
the US can now trade these contracts directly
from the US.
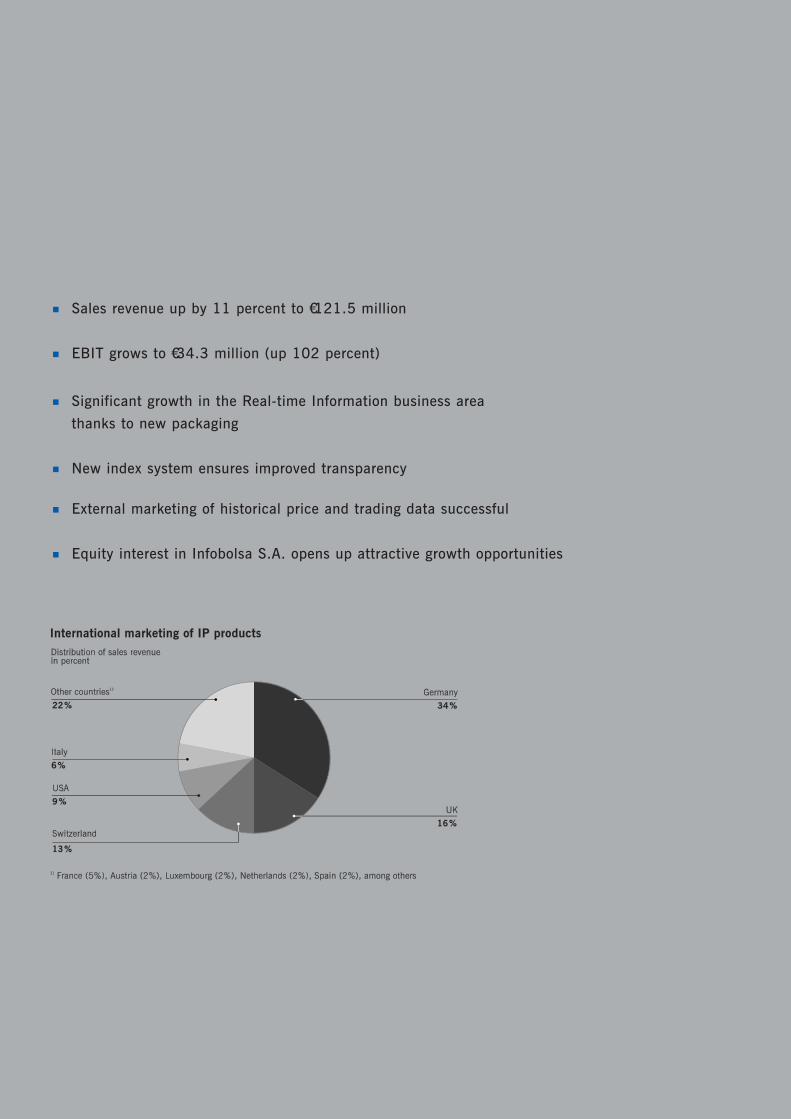
■ Sales revenue up by 11 percent to €121.5 million
■ EBIT grows to €34.3 million (up 102 percent)
■ Significant growth in the Real-time Information business area
thanks to new packaging
■ New index system ensures improved transparency
■ External marketing of historical price and trading data successful
■ Equity interest in Infobolsa S.A. opens up attractive growth opportunities

Information Products:No Information – No Trading
Despite the weak leads from the capital markets,
the Information Products Division grew strongly
in the 2002 reporting period, contributing sub-
stantially to the growth of the Group. Sales revenue
rose from €109.9 million in 2001 to €121.5
million in 2002, up 11 percent. The significant
increase in sales revenue combined with strict
cost management resulted in above-average EBIT
(€34.3 million, up 102 percent over the previous
year). In 2002, Information Products (IP) con-
tributed 10 percent of Deutsche Börse Group’s
overall earnings.
Although IP is distributing an ever-increasing
volume of data, the division’s costs remained
stable in the year under review. IP benefits from
the scalability of its systems, which are designed
to handle growth in data volumes – this is espe-
cially true for the Consolidated Exchange Feed
(CEF) central distribution system, which delivers
the division’s information. Another factor that
affected the cost structure positively in the past
fiscal year was the reuse of systems designed
to be utilized in-house to develop products for
external clients; the data warehouse StatistiX®
is one example of these systems.
Information is essential to all financial market transactions: no one would invest
in securities without company-specific reference data, prices, and index levels.
Often, however, market participants are confronted with a flood of information
that is difficult to sift through. The Information Products (IP) Division channels
these massive information flows by filtering out the most essential data, offering
customers focused products that are tailored to their individual needs. IP calcu-
lates, distributes, and markets classic cash market indices, such as DAX® , MDAX®
and, since March 2003, TecDAX® , which are well known to private investors
as well as professionals. However, the majority of the division’s sales revenue is
generated by prices and information for professional investors.
INFORMATION PRODUCTS 067

IP is relatively immune to economic volatility;
the division is primarily involved in the business-
to-business market, mostly and increasingly on
an international basis: around 70 percent of the
terminals to which IP supplies the “Cash Market
Germany (Frankfurt/Xetra)” product are located
in European countries other than Germany or in
the USA. As a result, IP generates more than
two thirds of its revenue outside of Germany.
Precisely tailored information for investors
Information Products is Deutsche Börse Group’s
information factory, and its raw material is finan-
cial data. The data is collected from Deutsche
Börse’s electronic trading platforms and other
sources, compiled into a uniform format, pro-
cessed to produce premium products, and mar-
keted to clients. All five of IP’s business areas
– Real-time Information, Indices, Research
Services, Back-office Services, and Information
Solutions – are integral to this process chain.
These business areas develop and distribute
products that are tailored precisely to clients’
information needs.
Market players view Information Products as their
partner: they can rely on the quality of the prod-
ucts, the service and advice. Focusing on the
customers’ needs is a central task for all seg-
ments of the division – from product design to
distribution and administration. The price struc-
ture also reflects the notion of partnership; in
some cases, they lie way below those of interna-
tional competitors.
Real-time Information
At 9 percent, Real-time Information generated
the highest sales revenue growth in the division
in 2002. This business area distributes and mar-
kets the trading data of Deutsche Börse Group
and its international cooperation partners. Its hit
product “Cash Market Germany (Frankfurt/Xetra)”,
which was relaunched in a new format in 2002,
documents the performance of Germany’s central
cash markets (FWB® – the Frankfurt Stock Ex-
change – and Xetra®). This data package contains
price information on German shares, German
and international bonds, warrants and exchange-
traded funds. In combination with the “Regional
Exchanges Germany” package, this product covers
the German cash market.
Indices
In fiscal 2002, demand for index-based products
increased sharply. IP’s sales revenue from licen-
ses for index funds, index certificates, and index-
based futures and options grew in the year under
review. The DAXEX index fund managed by Index-
change Investment AG advanced to become the
largest exchange-traded fund in Europe in 2002
with a fund volume of €1.1 billion. The succes-
ses of IP’s partners are shared by the division:
INFORMATION PRODUCTS068
Germany
UK
International terminal connections
15 %
35 %
Distribution of terminals for the“Cash Market Germany (Frankfurt/Xetra)” real-time productin percent
Switzerland
18 %
20 %
USA 8 %
France 4 %
Other countries

license income increases in line with the relevant
fund’s volume. This is why IP was able to boost
2002 license income by a healthy 12 percent to
approximately €8.3 million.
In parallel with the restructuring of the stock
exchange, the Information Products Division
designed an index system oriented to investment
strategies. In addition to selection indices, a
series of benchmark indices offer investors yard-
sticks for use in assessing the performance of
their portfolios. The new range of indices to be
launched in March 2003, makes the German
capital markets more transparent and therefore
more attractive to German and international
investors (see also p. 49f.).
Research Services
Excellent service levels, data updated daily and
regular information quality assurance form the
cornerstones of the StatistiX data warehouse.
Since 2002, products based on this data ware-
house have been available to external clients.
StatistiX combines current and historical price
and trading data from more than ten systems
operated by Deutsche Börse Group and generates
statistics and analyses on all aspects of the
German financial markets from these sources.
StatistiX clients are financial services providers
who require this information for sales, investor
relations, risk management, compliance, or
financial management functions. The content of
StatistiX data is comparable and can be struc-
tured as needed. As a result, financial services
providers can analyse their in-house trading
activities in detail thanks to StatistiX.
In the year under review, the first two products
from the StatistiX product family were launched:
the “Ranking” and “Internal” info cubes. The
Ranking Info Cube calculates the market share
and market position of a trading participant in all
relevant market segments and periods as com-
pared with other market participants. It documents
the strengths and weaknesses of the market posi-
tion of the relevant company’s trading desks and
supports the development of trading strategies.
The Internal Info Cube is an interactive analysis
tool for flexibly analysing companies’ securities
trading activities. It enables users to prepare
sophisticated analyses of the activities of indi-
vidual departments and traders.
INFORMATION PRODUCTS 069
Products by IP’s main business areas
Business area Products Sales revenue 2002€m
Real-time Information Price information on German equities, German and international bonds, options, 99.4and exchange-traded funds
Indices Licenses for index products (index funds and index certificates, among others) 9.5
Back-office Services Wertpapier-Service-System (securities service systemsWSS and WSS Online) and service system for fulfilling notification requirements (TRICE) according to § 9 WpHG (German Securities Trading Law) 10.0

Back-office Services
In 2002, IP greatly simplified access to Deutsche
Börse’s information products for banks, thereby
expanding the customer base for its back-office
services. One example of this is “WSS Online via
Internet”, which was launched in October 2002.
WSS Online provides access to real-time and
historical information updated daily from the Wert-
papier-Service-System (WSS) via the Internet.
The information provided includes data from all
German stock exchanges, WM Datenservice,
Reuters and the International Securities Market
Association (ISMA) on over 250,000 securities
listed in Germany and abroad. No additional
investments in technical infrastructure on the
customer side are required for access to this
information via the Internet.
For securities listed in Germany, the relevant
cash settlement and closing prices, their time of
origination and sales revenue according to order
book statistics are available in addition to real-
time information. Securities that are listed abroad
are also included in “WSS Online via Internet”.
Users can access closing prices from foreign
stock exchanges that are transferred to WSS
after the bell on the American exchanges.
Information Solutions
The acquisition of an equity interest in Infobolsa
S.A. (Spain) enabled the Information Solutions
business area to expand its value chain in fiscal
2002 and to take advantage of new potential
for growth.
Infobolsa, which was formed in 1990, has quickly
become the leading supplier of real-time financial
information in Spain and Portugal, where the
company reduced the market share of established
providers. In November 2002, Deutsche Börse
acquired a 50-percent interest in Infobolsa and
appoints the chairman of the Supervisory Board.
Deutsche Börse aims to penetrate the entire Euro-
pean market for financial information terminals
and services in cooperation with the Madrid stock
exchange, which owns the remaining 50-percent
interest in Infobolsa. Infobolsa S.A. and its subsi-
diaries were fully consolidated as at 1 November.
Infobolsa’s proven, stable business model also
underpins this partnership. Infobolsa Deutschland
processes real-time financial information and
distributes it via terminals or a consolidated data
feed. This service includes German and interna-
tional stock, bond, and derivatives markets,
money and commodities markets, as well as
financial news. Moreover, Infobolsa supplies fund
information, company master data, and analyses
of more than 40,000 companies. It specially
designs its information products to meet customer
requirements and sells them at an attractive
price-performance ratio. These products are
mostly intended for professional end customers
at banks and providers of financial services.
INFORMATION PRODUCTS070

New information on fixed-income securities
The Information Products Division has been
distributing data from the Eurex Bonds electronic
trading platform on an exclusive basis since
1 September 2002. Eurex Bonds is a leading
platform for electronic bond trading and has been
operated jointly by Eurex and top bond market
participants since October 2000 (see also p. 60).
INFORMATION PRODUCTS 071
International partnerships
The international orientation of the Information
Products Division is also evident in the new
product and service ideas developed in coopera-
tion with highly qualified international partners.
Examples from recent years are the iBoxx® index
family (real-time bond prices and indices), which
IP calculates with the help of leading investment
banks, or the joint venture STOXX Ltd., in which
Information Products now holds a one-third interest.
The iBoxx indices are successful the world over;
so much so that the fund management company
Xavex created a fund based on iBoxx in May 2002,
which has generated an unusually high level of sales
revenue. Its volume rose to around €1.8 billion in
the year under review. Information Products signed
an agreement on the development of ETFs (exchange-
traded funds) based on iBoxx indices to be marketed
globally in conjunction with Barclays Global Investors
(BGI), the market leader in ETFs based on fixed-
income securities in the USA. Initial products will
be launched in the first six months of 2003.
The link between the Eurex Bonds trading plat-
form and the Xetra and Eurex® system architecture
connects the cash and derivatives markets so
that bond trading and basis trading can be com-
bined in a single centralized quote book.
Mid-December 2002 marked the launch of
eb.rexx®, a new index family for fixed-income
securities. These indices are based on prices
from the Eurex Bonds trading platform. eb.rexx
is the world's first index family whose underlyings
are publicly accessible, tradable and traded prices.
The easily reproducible and transparent indices
serve as the foundation for attractive financial
market instruments such as exchange-traded
funds on the institutional market.
Growth prospects and further internationalization
Information Products continually aims to expand
its data sources in order to provide all trading
participants with information about as many
markets as possible. The North American market
in particular holds a great deal of potential, both
as a source and as a consumer of data. IP plans
to expand its central distribution system (Consol-
idated Exchange Feed, CEF) in order to optimally
supply this target market. In addition to further
pursuing internationalization of CEF, the division
is working on alternative delivery channels to
simplify access to high-quality data for end
customers in particular.

■ Integration of Clearstream makes Deutsche Börse only full-service
securities infrastructure provider
■ Clearstream’s results fully consolidated since 1 July 2002
■ Gross revenue of Clearstream International down 7 percent to
€908.0 million for full-year 2002
■ EBIT up 19 percent to €197.0 million thanks to increased efficiency
■ Clearstream offers world’s largest network of domestic links
■ Further improvements in service and easier access
39 markets worldwide linked to Clearstream
Uruguay
Argentina
USA
China
Canada
Japan
South Africa
Thailand
Hong Kong
Malaysia
Singapore
Indonesia
New Zealand
Australia
South Korea
Mexico
• Austria
• Belgium
• Czech Republic
• Denmark
• Estonia
• Finland
• France
• Germany
Europe
• Greece
• Hungary
• Ireland
• Italy
• Luxembourg
• Netherlands
• Norway
• Poland
• Portugal
• Slovakia
• Spain
• Sweden
• Switzerland
• Turkey
• UK
Clearstream

CLEARSTREAM 075
The acquisition of Europe’s leading clearing and settlement organization Clear-
stream International in July 2002 marked a milestone for Deutsche Börse
Group: thus, the Group has become the pre-eminent provider of integrated
trading and settlement services for both fixed-income and equity instruments.
With a fully integrated Clearstream, Deutsche Börse Group is the only securities
service provider to offer access to all key products and services, from trading
and information products through to clearing, settlement and custody of securi-
ties. Since 2002, Clearstream has been focusing on improving the efficiency of
its processes and has systematically extended its functionality and network to
markets and customers, as well as improving service levels and facilitating access.
Due to difficult market conditions, the number of
securities transactions in 2002 decreased by 4.2
percent to 82.1 million transactions, compared
with 85.7 million in 2001 (excluding so called
Reg-Über transactions). The value of the assets
held on deposit at Clearstream declined by 8 per-
cent to a total value of €6.9 trillion at 31 Decem-
ber 2002. The value of fixed-income securities
remained stable – in fact increasing slightly by
0.3 percent to €5 trillion. In contrast, the slump
in global equity markets led to a reduction of
26 percent in the value of equities held on deposit
by Clearstream. The total number of equities held
in custody, however, roughly remained the same.
In the year under review, Clearstream recorded
gross revenue of €908.0 million, down 7 percent
on the 2001 figure of €980.0 million. This means
that the company has held its ground well in the
face of difficult market conditions.
Clearstream launched a large-scale cost cutting
program, improving productivity by increasing
automation of tasks previously performed man-
ually, for example. This focus on operational
efficiency across all business areas allowed Clear-
stream to cut its operating expenses by 20 per-
cent, to €462.1 million compared with €576.4
million in 2001.
The improved efficiency levels enabled Clear-
stream to record an EBIT for 2002 of €197.0
million, up by 19 percent compared with 2001
(€166.1 million). Before 30 June 2002, Clear-
stream International contributed €39.0 million
to Deutsche Börse Group’s earnings on an at
equity basis; following the completion of the
acquisition and consolidation in the second half
of the year, the Clearstream segment contributed
€86.4 million.
Clearstream: Efficient Processes

The confirmation in 2002 of Clearstream’s AA+
long-term rating by Standard & Poor’s and the
AA+ long-term rating by Fitch for Clearstream
Banking Luxembourg is proof of the long-term
stability of Clearstream’s business.
Expanding network reach and functionality
Clearstream has extended its network of domestic
links and has expanded the functionality of its
systems.
39 markets worldwide linked to Clearstream
In addition to its main business centres in Frank-
furt and Luxembourg, Clearstream has five regional
offices in Dubai, Hong Kong, London, New York
and São Paulo. As of year-end 2002, more than
2,500 customers – banks, custodians and broker/
dealers – in 94 countries were connected to Clear-
stream’s global network.
CLEARSTREAM076
Clearstream’s business is becoming more and
more international. In January 2002, Clearstream
launched automated domestic links via new depos-
itory banks to the domestic markets in China and
South Korea, bringing the total number of markets
covered to 39 and further extending its competi-
tive lead.
Including the new links, Clearstream now serves
a total of ten domestic markets in Asia and Pacific
Rim countries.
Direct link to Hong Kong
In January 2003, Clearstream introduced a direct
link to the Hong Kong Monetary Authority (HKMA).
Asian investors can now overcome market barriers
by clearing, settling and holding Clearstream eligi-
ble debt securities via their Central Moneymarkets
Unit (CMU) accounts. In this way, Clearstream
is strengthening the cross-border settlement infra-
structure.
Optimizing the process chain for German equities
While European domestic markets are highly
efficient, investors and issuers face high costs for
cross-border trading and equity holdings. Clear-
stream has developed a solution targeted at
the international market for German securities,
CASCADE RTS (Real-Time Settlement). This
new service provides an efficient gateway for
the international investment community to settle
domestic transactions with German securities
through Clearstream’s settlement system.
5.64.7
6.6
Falling share prices cause decrease in value of securities held on deposit
Transactions in millions
Fixed-income
Equity
1) Diversification of total value not available before 2001
19981) 19991) 20001) 2001 2002
5.0
2.5
5.1
1.8
150
120
90
60
30
0
Transaction volume excluding Reg-Über transactions (single counted, in millions)
Total value of securities held on deposit as at 31 December (in ¤ trillions)

CLEARSTREAM 077
It streamlines the processes between Clearstream’s
ICSD platform (Creation) and the German CSD
platform (CASCADE) for domestic securities.
This makes it possible to use the full range of
functionality, with or without accounting for
the countervalue. Clearstream is one of the first
settlement organizations to apply the ISO 15022
standard, which was initiated by SWIFT, to its
own systems. In addition, custody processes have
been automated and are now available via SWIFT.
Settlement and custody: an infrastructure
for international capital markets
The three core business areas of Clearstream are:
■ Eurobond and international bond business,
where Clearstream acts as an International
Central Securities Depository (ICSD)
■ the cross-border domestic securities business
■ German and Luxembourg Central Securities
Depository (CSD) business. As a CSD, Clear-
stream Banking Luxembourg implements mone-
tary policy measures affecting Luxembourg for
the European Central Bank and Banque centrale
du Luxembourg.
Clearstream provides appropriate processing services
required for each of these business areas (see chart
below). Clearstream’s business focuses on fixed-
income instruments – mainly international bonds.
A major part of its domestic bonds business is in Ger-
man government debt securities, which are among
the most frequently traded instruments in Europe,
and for which Clearstream has the specialist role
of a Central Securities Depository. Clearstream has
also achieved a strong position in providing services
for government debt securities issued by other major
European countries, such as France, Italy, Switzer-
land and the Benelux countries. Clearstream also
provides the German market in particular with settle-
ment and custody services for equities traded via
Xetra, floor trading and cross-border trading.
Main steps in the processing chain and their share in revenue
30% 46% 24%
Clearing and settlement
■ Match making and netting between two counterparties
■ Transferring securities and cashrespectively to the buyer and the seller
■ Safekeeping and servicing of financial assets on behalf of the owner
■ Providing liquidity and financingto counterparties for their settle-ment needs
■ Arranging securities financingservices
■ Providing collateral management services
CustodyBanking and securities financing

High quality and efficiency of custody services
In the custody area, Clearstream is systematically
increasing both customer benefit and its own
efficiency. Optimized services allow customers to
settle and process corporate actions, taxes and
income payments more easily. This applies both
to securities clearing and to the collective safe
custody of Xetra Stars®. The improved services
in these areas enable Clearstream to support
Deutsche Börse Group’s objective of offering cus-
tomers high-quality straight-through processing
(STP) capabilities. For example, new data feeds
have been added to supplement information cov-
erage for custody customers. Clearstream has
also enhanced customer reporting by standardiz-
ing text input for custody management and the
use of transaction reference numbers.
The market obviously appreciates Clearstream’s
quality initiative. The number of corporate
actions in STP mode rose noticeably in 2002,
and 2003 will see substantial improvements in
this area.
New service provided for BundesrepublikDeutschland Finanzagentur
In September 2002, Bundesrepublik Deutsch-
land Finanzagentur GmbH, the German govern-
ment’s finance agency, commissioned Clearstream
exclusively to provide liquidity in German govern-
ment debt securities via the Automated Securities
Lending and Borrowing (ASL) program.
ASL is an integral part of Clearstream’s settle-
ment processing. It enables borrowers to avoid
the consequences of settlement failures while
allowing lenders to earn an additional return
from their portfolios. Based on the daily liquidity
requests from Clearstream’s customers, the Ger-
man government’s finance agency effectively
monitors and acts upon market conditions. Both
customers and the whole market benefit from the
ability to inject liquidity into German government
bond trading with this innovative solution.
International issues now easier
At the end of May 2002, Clearstream, Euroclear
and the Depository Trust and Clearing Corporation
(DTCC) launched a new service, called European
Pre-Issuance Messaging (EPIM). It ensures the
secure exchange of issuing information between
market participants, including banks, dealers,
issuing and paying agents, securities depositories
and numbering agencies. EPIM automates the
processing of new issues of European commer-
cial paper and related money-market instruments
in international capital markets. EPIM’s central
messaging hub links all parties involved in issu-
ing European securities.
CLEARSTREAM078

Improving service quality
Clearstream’s customers throughout the world
benefit in many ways from the services offered
by the company for equities and bonds:
■ Via a single access point, they gain access
to the infrastructure and the global network
of 39 markets to which Clearstream main-
tains links.■ They can settle their transactions using com-
mercial bank money (credit and liquidity pro-
vided by a bank, for example, Clearstream
Banking), or central bank money (money
provided by a central bank connected to Clear-
stream).■ They save time and money in their back of-
fices because they can harmonize internal
workflows for all financial instruments.■ They can use their cash collateral more
efficiently since all their assets and trans-
actions are pooled in Clearstream’s systems.
By continually improving its services, Clearstream
was able to halve the number of claims brought
against it last year, for example.
In order to meet market requirements, Clearstream
introduced additional functionality with its Cus-
tomer Focus Initiative at the beginning of 2002.
This has led to an increase in efficiency (STP)
and improved risk management, on the one hand
by passing on information regarding final benefi-
ciaries and standardized reporting for corporate
actions, and on the other hand by enabling
back-to-back transactions in essential markets.
In addition, an automatic conversion option for
foreign currency transactions was introduced.
CLEARSTREAM 079
Listening to the customer
In November 2002, Clearstream again held a
meeting of the User Advisory Board, which brings
together 15 key financial market players round
a single table. The User Advisory Board provides
market feedback and enables market players to
discuss the strategic direction of the industry and
suggest how Clearstream can further improve its
process efficiency. Issues addressed during the
past year include the consolidation of European
capital markets, the daytime bridge, the new
connectivity services and market liquidity.
In December 2002, Clearstream International
announced changes to its Board of Directors.
Each of the new members is a well-known in-
dustry expert. Clearstream has also changed
its articles of association in order to be able to
include further members from other countries,
regions or industries in the Board (see also
p. 96ff.).
Awards for customer care and global securities financing
In 2002, Clearstream again provided the market
with outstanding customer service. Clearstream
came first in the ICSD category in last year ’s Glo-
bal Custodian Survey, which regularly measures
customer satisfaction, reaching the highest score
on a raw data basis. Additionally, in April 2002,
Clearstream received the award “Top Rated
Provider in the 2002 Global Custodian Tri-Party
Securities Financing Survey” and outranked
all other custodians in 15 out of the 26 service
categories.

Clearstream’s success in the area of global secu-
rities financing is also reflected in its performance
during 2002. In particular the area of Collateral
Management Services showed continuous growth
during 2001 and 2002 in terms of collateral
management levels (the average value of loans
granted per week).
Providing easy access
Clearstream’s goal is to ensure maximum efficien-
cy of the securities infrastructure. This entails
giving participants easy access to all services,
regardless of whether the securities are held at
Clearstream itself or another CSD or ICSD.
Daytime bridge initiated
In October 2002, Clearstream reached an agree-
ment with Euroclear on the functional aspects of
the daytime bridge between the two companies.
The daytime bridge is a highly sophisticated link
between Clearstream and Euroclear that allows
trades to be settled between counterparties in
different systems during the day.
Currently, only a night-time bridge is available to
Clearstream’s and Euroclear ’s customers. The
combination of the daytime and night-time bridges
offers customers greatly enhanced trading oppor-
tunities, by providing access to more counterpar-
ties and to a wider pool of securities.
Clearstream and Euroclear aim to provide partici-
pants with a fully automated 24-hour bridge in
2004. The manual daytime bridge that has already
been implemented offers risk-free settlement.
However, in order to optimize efficiency for cus-
tomers, the daytime bridge now has to be auto-
mated, and Clearstream is currently performing
the preparatory work for this.
New settlement model developed
Clearstream and the German Market Rules Com-
mittee have been working together with Deutsche
Bundesbank (the German central bank) and twelve
key financial institutions since November 2000
to deliver a new settlement model for the German
securities business that is designed to change the
cash settlement procedures for securities trans-
actions. The model will be introduced in phases
starting in autumn 2003. Its core advantages are:
■ Finality will be achieved directly on opening
of TARGET (Trans-European Automated Real-
Time Gross Settlement Express Transfer Sys-
tem) on the settlement day, making securities
and cash available much earlier.■ Liquidity management will become more
efficient for all customers.■ The unwinding risk in the case of the default
of a market participant will be eliminated.■ Collateral held at central banks during the
night-time processing cycle on settlement
will be utilized efficiently.
CLEARSTREAM080
2001 2002
40
50
60
70
80
90
Constant growth in global securities financing
Value of loans granted per week, on averagein ¤ billions

Clearstream is now working on the daytime pro-
cessing aspects of the new model. Further central
banks are expected to be included in 2004.
Service for investment funds extended
In December 2002, Clearstream International
acquired Filinks with the goal of further develop-
ing Vestima®, its investment funds service, in
order to make the investment funds market as
efficient as the securities market. Filinks has
developed a unique technology that incorporates
STP efficiencies in the order routing process for
the investment funds industry and is complemen-
tary to Clearstream’s existing Vestima service.
Thanks to its broad customer base and location
in Luxembourg, one of the main centres of the in-
vestment fund industry, Clearstream is in a posi-
tion to offer high-quality services to this industry.
Clearstream also intends to expand its services to
all domestic European markets following its suc-
cessful launch on the offshore market segment.
Improved access to international settlement
Clearstream works continuously to improve the
efficiency of its processes. This applies in partic-
ular to Creation, the central processing platform
for international trading, and the electronic link
provided by CreationConnect.
This provides customers with rapid, secure and
efficient communication with Clearstream and its
network of depository banks. Depending on their
respective cost/benefit analyses, customers can
choose between three complementary connec-
tion options: CreationDirect, Creation via SWIFT
(an automated system-to-system interface based
on the SWIFT network), and CreationOnline, the
secure interactive browser interface introduced
by Clearstream in September 2002. This gives
customers real-time access to Clearstream’s broad
range of clearing, settlement and custody ser-
vices as well as to a series of value-added services.
Customers can check the status of all pending
and settled instructions, receive automatic warn-
ings and perform specific queries, as well as
downloading data from the network to their PCs
for further processing. The system is fully com-
pliant with the ISO 15022 standard and there-
fore offers maximum STP functionality.
CreationConnect allows customers to communi-
cate quickly, securely and efficiently with Clear-
stream Banking and its network of depository
banks. The key benefits offered by CreationConnect
are the flexibility of the link provided, comprehen-
sive reporting and the use of the ISO standard,
as well as real-time validation.
Like all other measures designed to improve
the efficiency of Clearstream’s processes,
CreationConnect is intended to improve flexi-
bility, standardization and speed of processing.
This allows customers to improve risk control
and freer use of their cash funds.
CLEARSTREAM 081

■ Clearstream TEC, entory and Xlaunch consolidated with Deutsche Börse
Systems for the first time as IT Division
■ IT Division (internal and external) sales revenue increases to €388.3 million
(plus 6 percent)
■ EBIT down by 39 percent to €53.0 million due to exceptional effects
■ Synergies from integration of Clearstream TEC in the double-digit millions region
■ Equity central counterparty (CCP) software successfully implemented
■ Conversion of German securities code numbers to ISIN standard completed
Information Technology Division offers broad service range
Business area Core competencies/functions Products/services
Deutsche Börse Systems and Clearstream TEC
Developing, building and operating IT infra-structures for Deutsche Börse Group and third parties
Xetra, Eurex, Creation, CASCADE, CCP
Developing customer-specific IT solutions,sales channel for the IT Division
Trading, post trading, asset management, risk management, customer management
Organizing marketplaces for standardized goodsand services
Technology and consulting services
entory
Xlaunch

INFORMATION TECHNOLOGY 085
Deutsche Börse Group has been more than just a marketplace organizer for
securities transactions for a long time now: it is a transaction service provider
that uses cutting-edge technology to open up global capital markets to compa-
nies and investors. Developing, building and operating the technological infra-
structure are among its core competencies and play a key role in the value chain.
Deutsche Börse Group’s IT Division comprises the wholly owned subsidiaries
Deutsche Börse Systems AG, entory AG and Xlaunch AG, as well as the IT
departments of Clearstream Services S.A. and Clearstream Banking AG Frankfurt
(together: “Clearstream TEC”). A total of around 1,600 employees – around one
half of all the people employed by the Group – implement business strategies
in technology applications. In addition, they provide IT solutions for international
financial services providers, including trading and settlement systems for
17 exchange organizations worldwide.
In fiscal 2002, Deutsche Börse Group’s IT Division
generated sales revenue totaling €388.3 million
with internal and external customers (2001:
€368.2 million). For the first time, the figures for
Deutsche Börse Systems AG, entory AG, Xlaunch
AG and Clearstream TEC (since 1 July 2002) have
been fully consolidated, whereby sales revenue
of Clearstream TEC has been recorded as other
operating income. The division generated more
than 42 percent of its sales revenue (€165.6
million) with services for customers outside
Deutsche Börse Group, an increase of 20 percent
due to the consolidation of entory. Almost two
thirds of this sales revenue was generated by
Deutsche Börse Systems, and one third by entory.
Taken individually, sales revenue of Deutsche
Börse Systems declined by 11 percent, and that
of entory by 28 percent. This drop as against the
previous year is due to the difficult market envi-
ronment, falling trading volumes and the consoli-
dation of previously external revenue from entory
services and the operation of Clearstream systems,
which are both now recorded as internal revenue.
Information Technology:Infrastructure for Deutsche Börse and International Financial Markets

Lean cost management made a significant contri-
bution to the success of the IT Division. As against
the previous year, Deutsche Börse Systems, for
example, cut its costs by a total of 11 percent.
Operating costs for computing centres, network
and technical customer support, which at 59
percent represent the largest cost item, also fell
by 11 percent, communication costs by 38 per-
cent. In addition, the division cut its expenses for
external consultants by an average of 7 percent
per consultation hour.
The IT Division also increased its profitability as
against the previous year, with the initial syner-
gies from Clearstream’s integration having a posi-
tive effect on earnings. At €89.4 million before
goodwill, the division’s earnings increased by
2 percent as against 2001. However, goodwill
amortization totaling €36.4 million, including
an exceptional impairment loss of €33.0 million,
had to be made relating to the acquisition of entory.
Due to the goodwill write-down, EBIT of the IT
Division reached €53.0 million, corresponding to
a contribution of 15 percent to total Group EBIT.
Process-oriented IT organization
The structure of the IT Division is strictly process-
oriented. The individual subsidiaries and busi-
ness areas fulfil clearly defined functions along
the Deutsche Börse Group value chain:
■ Deutsche Börse Systems AG and Clearstream
TEC primarily design, build and operate
Deutsche Börse Group’s trading and settle-
ment systems. In addition to internal busi-
ness, Deutsche Börse Systems also develops
and operates complex IT infrastructures for
third parties, thereby generating a substantial
share of the IT Division’s external revenue.■ Xlaunch AG, the practical “research laboratory”,
specializes in the organization of market-
places for standardized goods and services
above and beyond the finance industry. It
operates as the “spearhead” of the IT Division
for the marketing of IT services.■ entory AG combines technology and finance
market expertise, extending Deutsche Börse’s
value chain to include IT for financial instru-
ments. Together with Deutsche Börse Systems,
it develops customized solutions for insurance
companies, banks and financial services pro-
viders. As a result of its established market
position, entory operates as the sales channel
for the entire division.
INFORMATION TECHNOLOGY086

INFORMATION TECHNOLOGY 087
Synergies from Clearstream integration
The integration of Deutsche Börse Systems and
Clearstream TEC enables the two companies to
leverage a large number of synergies, as they are
very similar to one another in terms of technology
and organization. For example, the joint use of
platforms such as Unix systems and IBM main-
frames generates economies of scale in the oper-
ation of trading, settlement and information
systems. Thanks to the technological parallels,
the IT Division can also improve and harmonize
its software development processes substantially.
The division has identified concrete synergies in
the use of software components and tools in par-
ticular, as well as in the consolidation of operating
departments and locations. Central procurement
of hardware, software and consulting services
will also lower purchase prices further.
In fiscal 2002, cost synergies were already gen-
erated in the IT Division of more than €6 million.
The division will continue exploiting these poten-
tials, gradually raising the cost synergies to €45
million per year from 2006. Altogether, the group
will generate synergies from 2006 of some €80
million p.a.
IT Division operates 17 exchanges worldwide
Manifold synergies from integration of Clearstream
Exchange Type of market Launch Participants Countries
Eurex Derivatives market 1/90 424 17
Xontro1) Spot market 6/92 500 4
Frankfurt Stock Exchange (Xetra) Spot market 11/97 352 15
Helsinki Exchanges Derivatives market 9/99 424 19
Vienna Stock Exchange Spot market 11/99 58 4
Irish Stock Exchange Spot market 5/00 17 2
a/c/e Derivatives market 8/00 92 7
Eurex Bonds Spot market 10/00 22 3
EEX Spot and 8/00derivatives market + 3/01 113 12
1) Electronic, broker-supported trading system for floor trading at the Berlin, Bremen, Dusseldorf, Frankfurt, Hamburg,Hanover, Munich and Stuttgart stock exchanges
■ Joint utilization of software components/tools
■ Standardization of software inventory
■ Consolidation of computing centres■ Consolidation of operating units
and platforms■ Joint operations of networks
■ Bundling of competencies and the relating resources
■ Optimization of purchasing power throughconsolidation of purchasing units
Infrastructure
Organization
Purchasing
Applications

Research and development
With its subsidiary Xlaunch AG, Deutsche Börse
Group is tapping new growth fields in electronic
markets. Thanks to its Research and Innovation
Center, the IT Division benefits from the advan-
tages of a powerful in-house consulting team.
Xlaunch specializes in organizing and operating
young electronic markets with high development
potential. It offers market operators an attractive
cost and risk profile. The opportunity to utilize
the Deutsche Börse Group network guarantees
market participants efficient access and the
highest level of system security.
From Q2/2003, Xlaunch will operate a market-
place for standardized interest rate derivatives for
the English financial services provider Swapstream.
Its trading participants are banks and brokers. In
addition, the IT Division builds and operates the
participant network and provides the technical
helpdesk.
Xlaunch was also involved in the “Hesse Tender”
project for CO2 emissions certificates. The joint
initiative by the Hesse Ministry of Environment,
Agriculture and Forestry and a group of renowned
companies is preparing the ground for trading in
CO2 emission rights.
In 2002, the Research and Innovation Center
drove forward the introduction of various Web
technologies, e. g. in connection with develop-
ment of the central counterparty (CCP) and the
Wertpapier-Service-System WSS (securities ser-
vice system). In addition, the EXOTIC (EXchange
cOmpeTitive IntelligenCe) system was developed
ready for production. Above all, EXOTIC supports
competition and technology analyses, thereby
significantly improving Deutsche Börse Group’s
knowledge management.
One service level of EXOTIC is the “Xpider” search
engine, which combines three functions: users
can search for documents, categorize files found
by topic areas and download them in various
formats. Xpider has been available internally to
all Deutsche Börse employees since Q1/2003.
In Q2, the IT Division will also supply the tool
to the Bundesamt für Finanzen (German Federal
Finance Office); together with entory, the division
beat off several international competitors in a
pan-European tender.
Expertise in building and operating systems
As providers of complex IT solutions, Deutsche
Börse Systems and Clearstream TEC once again
demonstrated the superior performance of their
systems in fiscal 2002. For example, the Xetra®
and Eurex® platforms were able to handle even
large trading volumes reliably and quickly. At the
same time, Systems and TEC made significant
progress with one of their key cash market proj-
ects, construction of the central counterparty,
and converted their applications from Wertpapier-
kennnummer (WKN), the German securities code
number standard, to the International Securities
Identification Number (ISIN) standard.
INFORMATION TECHNOLOGY088

Reliable and fast: Trading and settlement systems continue to set standards
With its modern system architecture, maximum
availability and extremely low transaction costs,
Eurex sets the international benchmark for the
trading and settlement of derivatives market prod-
ucts such as futures and options. In 2002, the
derivatives exchange once again clearly exceeded
the record volumes it achieved in 2001. The
highest daily volume to date – 6.1 million con-
tracts – was recorded on 24 July.
The growth of the derivatives market is also
reflected in the continuous increase in the
amount of price information provided by the
Eurex system in real-time to all exchange partici-
pants around the world. The amount of price
information has risen roughly 25-fold over the
last ten years; over the same period, contract
volume has risen by a factor of 23. In 2002,
despite the high level of growth, the system was
available to participants for a monthly average
of 99.98 percent of the time. This corresponds
to average downtime per month of a mere three
minutes or so. Response times were kept to
below 0.1 seconds at all times.
In order to cope with the expected further rise
in transaction volumes, particularly on Eurex,
Deutsche Börse Systems will consistently increase
its system capacity over the coming years.
INFORMATION TECHNOLOGY 089
Eurex: Consistently fast performance despite sharp rise in transactions
Seconds
1992 1993 1994 1995 1996 1997 1998 1999 2000 2001 2002
0.45
0.05
0.10
0.15
0.20
0.25
0.30
0.35
0.40
0
Eurex transactions per day in millions
Response times (host processing time)
3.05
2.24
1.401.08
0.720.61
0.550.500.370.230.16

In fiscal 2002, Xetra, like Eurex, was able to
meet rising demands reliably. Although the
average number of Xetra trades per day rose by
around 20 percent, the average host response
time was reduced by 36 percent to 0.05 sec-
onds. The system had an average availability
of 99.92 percent.
The reason why the systems work so reliably
despite rising volumes is the performance moni-
toring tool, which was implemented in 2002.
This tool monitors and documents the availability
and performance of all components in the entire
system, from the host through the network to the
customer. It can localize potential bottlenecks
and incidents, which makes it a key component
in monitoring the systems’ infrastructure, both
as a precautionary measure and in the event of
a disruption.
The new S.W.I.F.T. ISO 15022 standard is a
milestone on the way to straight-through process-
ing in the finance industry. Clearstream TEC
played a significant role in its development and
has converted all its relevant applications, such
as the settlement systems Creation and CASCADE.
In addition, the new access infrastructure for
Creation (Creation Online), offers customers a
cutting-edge, graphics-oriented human-machine
interface for Deutsche Börse Group’s international
clearing and settlement systems. The enhanced-
functionality customer front end is based on
state-of-the-art Internet technology and combines
the latest security mechanisms with a high degree
of flexibility. At the end of 2002, more than
2,500 customers in over 90 countries were con-
nected to the global Clearstream network.
ISIN conversion
Even before the ISIN system is officially intro-
duced by Wertpapier-Mitteilungen – Germany’s
central institution for issuing and managing secu-
rities – on 22 April 2003, Deutsche Börse Group
has completed the conversion of its trading,
information and settlement systems. The twelve-
digit ISIN will replace the six-digit German secu-
rities code number WKN. The uniform interna-
tional format will allow investors to identify
securities quickly and reliably all over the world.
The introduction of the ISIN will make cross-
border securities trading, clearing, and settlement
as well as the admission of securities to trading
significantly easier.
An ISIN number consists of three elements: a
two-character country code, e.g. DE for Germany,
followed by a national ID with nine digits; the
third element is a single-digit numerical check
number. ISIN numbers are issued centrally in
each country.
INFORMATION TECHNOLOGY090

Deutsche Börse began its ISIN project in November
2000. Following a preliminary study of all rele-
vant systems and interfaces, step-by-step conver-
sion started at the end of Q4/2001. A smooth
transition to the new code numbers was guaran-
teed by extensive internal and external testing
with customers. Since the end of November 2002,
the ISIN has been the relevant identification
number for the entire process chain – from trad-
ing through to settlement. Customers will still
be able to use WKNs in parallel to the new ISINs
until Wertpapier-Mitteilungen implements the
changeover on 22 April 2003.
For the securities sector, the complexity, the scope
and the effects of this conversion are comparable
to those of the Y2K conversion for the IT industry
as a whole.
Central counterparty in development
The central counterparty was Deutsche Börse
Systems’ largest and most demanding project in
2002. On 19 December 2001, the Exchange
Council of the FWB® Frankfurter Wertpapierbörse
(the Frankfurt Stock Exchange) had resolved
to introduce a central counterparty (CCP) for
German equities. Deutsche Börse uses this
functionality to act as a counterparty for buyers
and sellers on the cash market (see also p. 50f.).
A total of around 180 employees designed and
implemented a system architecture that takes all
functional requirements into consideration, and
that is compatible with the existing Xetra, Eurex
and Clearstream system environments. The IT
specialists at Systems designed a CCP architec-
ture that combines the advantages of a high-
performance transaction system with the latest
in database technology. Deutsche Börse Systems
delivered the software on 31 October 2002,
after a development phase of just six months.
The successful implementation of the software
is further proof of Systems’ core competence
in major application and system development
projects.
Customized technology solutions for financial services providers
In fiscal 2002, the IT environment in the finance
sector was characterized by high cost pressure,
falling margins and significantly greater reluc-
tance to make investments. In recent years, most
companies invested in the latest hardware and
software and acquired a complex IT infrastruc-
ture. Many of these companies now have to cut
costs, simplify their existing systems and gener-
ally reduce vertical integration by outsourcing
INFORMATION TECHNOLOGY 091

and using standard software. By providing
technical solutions to precisely these challenges,
entory AG – a wholly owned subsidiary of
Deutsche Börse Group – was able to consolidate
its strong position with major financial services
providers in this difficult market environment.
The following sample projects provide an insight
into entory’s work in fiscal 2002:
■ The foreign subsidiary of a major German
bank commissioned entory to reduce the
heterogeneity of media and communications
used in its different IT applications. Prior to
doing this, entory analysed the individual
tools and conducted trial runs in different
departments of the bank.
INFORMATION TECHNOLOGY092
Deutsche Börse Systems Inc.:
North American market presence
Early in 2000, Deutsche Börse Systems was com-
missioned to adapt the Eurex system to the require-
ments of the American market; in addition, it was
to establish a trading network and ensure the opera-
tional readiness of market participants at a technical
level. Seven months later “a/c/e” – the “alliance/cbot/
Eurex” – went live with 86 participants from the US,
Europe and Asia. After just four days, a/c/e was trad-
ing over 108,000 contracts – two and a half times
the average daily volume on CBOT’s previous sys-
tem, “Project A”. Today, nearly 70 percent of key US
financial contracts are traded on a/c/e.
Since a/c/e trading began, Deutsche Börse Systems
has been successively bundling its US activities in its
newly founded American subsidiary Deutsche Börse
Systems Inc. (DBS Inc.). DBS Inc. employs nearly
30 people, predominantly Americans, who do not
just operate the a/c/e platform, but also manage
IT activities in the US, provide support for the Xetra
and Eurex systems and act as a technical helpdesk
for German cash market participants after close of
trading in Frankfurt. Depending on the time of day,
operating responsibility for the network, the technical
helpdesk and back-end operations switches between
the teams in Frankfurt and Chicago. 24-hour opera-
tion is already a reality for these sectors; thanks to
the time difference, expensive and unpopular night
shifts are avoided at both locations. At the same
time, the exchanges and their trading participants
appreciate receiving support from a local contact
during standard office hours in their own time zone.
In future, the distribution of labor between Chicago
and Deutsche Börse Group’s other IT operational
locations will continue to leverage new synergies.
Systems’ technical infrastructure in Chicago and its
experience with US trading participants and suppli-
ers is a key strategic advantage in the technical
realization of new initiatives on the US capital
market.

■ entory implemented the company-wide admin-
istration of user rights as part of a leading
insurance company’s Internet/intranet portal
for office and field staff. It was based on the
entory UPM (user permission management)
component with the additional implementa-
tion of a public-key infrastructure for the por-
tal. The central and unambiguous administra-
tion of user rights allowed entory to increase
access and data security while at the same
time cutting its customer’s administrative costs.■ A European administrative authority commis-
sioned entory to develop a new smart-card-
protected Internet portal for an online con-
nection for authorities and applicants. Several
existing and new Web services had to be
bundled under a uniform interface. The aim
was to design a common look-and-feel stan-
dard for internal and external applications
and to improve software interfaces.■ Working for a data centre serving a network
of banks, entory is completely redeveloping
the interface between the bank system and
the portfolio management system. To do
this, entory is using a component developed
in-house that makes it possible to implement
integration projects with a fast return on
investment for the customer and on a fixed-
price basis. The redevelopment will improve
data quality and increase processing speed
significantly.
The situation on the IT market remains tense in
fiscal 2003. entory is continuing to focus its
activities on segments such as investment com-
panies, the insurance sector and private banks.
entory is increasingly offering solutions and com-
petences that can be deployed cross-sector to
non-financial services providers. The focus lies
on the notion of being able to reuse solutions
and on the innovation transfer between sectors.
In doing this, entory will not just be marketing
its own developments; it is also increasingly
using its sales expertise for products and services
from Deutsche Börse’s IT Division.
INFORMATION TECHNOLOGY 093
entory combines technology and financial markets know-how
Business processes/business areas
Services
■ Focus on the financial sector■ Large number of reference products■ Focus on customer satisfaction
■ Trading, post trading, asset management,risk management, customer management
■ Utilization of the skills of Deutsche BörseGroup
■ Project management■ IT solutions■ Business consulting, process management■ Sourcing
Competencies ■ Know-how focus on financial markets■ Reliability■ Tried-and-tested technology■ Guaranteed solutions
Market/ customers

CUSTOMER GOVERNANCE096
Deutsche Börse’s predecessor was a public law
institution with an obligation to benefit its mem-
bers, and hence its owners – who were also its
customers. When Deutsche Börse AG was found-
ed ten years ago, a lot of customers still also
numbered among the owners, but it became
possible to be a customer without holding any
shares in the stock corporation. However, cus-
tomers’ interests became increasingly divergent,
and finding the greatest common denominator
grew more and more difficult. In 2001, Deutsche
Börse took the only logical decision: it floated
itself on the equities market. The IPO unbundled
originally interwoven relations with owners and
customers. Financial investors now account for
a majority of the owners, with more than 80 per-
cent of shares in Deutsche Börse AG.
However, the IPO was not intended to influence
customer relations, nor did it. On the contrary,
it is only by wholly devoting itself to its customer
interests that Deutsche Börse Group can also
create value added for its shareholders. The sus-
picion often voiced by interested parties that user
governance is neither desired nor possible in the
case of listed exchanges or settlement organiza-
tions is not true.
Deutsche Börse Group promotes customer gover-
nance more than ever, because if you aim to
increase the efficiency of the markets, you have
to understand the markets. If you aim to offer
customers long-term superior cost/benefit, you
have to understand their business models and
strategies. This is why Deutsche Börse Group
maintains a closely woven network of customer
relations, which is expressed in the form of
supervisory and advisory committees in partic-
ular. This is not restricted to the supervisory
boards prescribed by the Aktiengesetz (AktG –
German Stock Corporation Act) or the public
law exchange councils where a large number of
customers have a voice; rather, Deutsche Börse
Group initiated by far the greater share of its
executive bodies and working committees itself.
Some of the committees are formed to fulfil
functions for a limited period of time, others
meet regularly on a permanent basis to work
together on products and services. One thing
they all have in common is that their members
reflect the increasingly international customer
base of Deutsche Börse Group, that more and
more nationalities are represented – and that
they are increasingly choosing English as the
language of negotiation. Of course, the fact that
Deutsche Börse Group is working together with
international customer representatives does not
mean that it is turning its back on its roots:
Customer Governance:The Closest Possible Cooperation with Customers
the Chairman of the Advisory Board of Deutsche
Börse AG, for example, is the Frankfurt-based
broker Dieter Heinemann, and the President of
the Netherlands Bankers’ Association and member
of the executive board of the ING Group, Hessel
Lindenbergh, has a seat on Deutsche Börse’s
Supervisory Board; Jean Meyer, Président du
Comité de Direction of the Banque Générale du
Luxembourg is also an advisor on the Board
of Directors of Clearstream International, as is
Charles S. McVeigh of Schroder Salomon Smith
Barney; Allianz’s Dr. Joachim Faber sits on the
Primary Markets Advisory Committee as an in-
vestor, as does Alexander von Witzleben of Jen-
optik as an issuer. However, law firms, auditors,
venture capital companies, asset managers, cen-
tral banks, academics, supervisory authorities,
other exchanges and data vendors also play their
part in the committees.
The fact that key decisions are subject to inten-
sive consultation with customers is shown by a
recent example: during the planning phase of
the restructuring of the equities market, Deutsche
Börse discussed the topic in several committees
and at various levels with its customers. The
Exchange Council discussed the regulatory frame-
work of the General Standard and the Prime
Standard from a public law perspective, while
the Primary Markets Advisory Committee (PMAC)
mainly dealt with the topic from a market view-
point; finally, in the Working Committee for
Equity Indices, Deutsche Börse and market par-
ticipants considered the index environment needed
to model the equities market’s new structure. In
addition, Deutsche Börse contacted the CFOs of
leading German companies to discuss the details
of the new concept in person.
The list of committees and represented customers
on the following pages of this annual report reflects
our conviction that customers are the number
one priority in Deutsche Börse Group’s thoughts
and actions. Deutsche Börse Group would like
to thank all the companies which have sent dele-
gates and all the members of the committees for
their work and commitment.
CUSTOMER GOVERNANCE 097097

DEUTSCHE BÖRSE GROUP98 CUSTOMER GOVERNANCE098
Supervisory Board of Deutsche Börse AGStatutory supervisory body
Dr. Rolf-E. Breuer (Chairman), Deutsche BankFriedrich von Metzler, B. Metzler seel. Sohn & Co.Sandra S. Jaffee, CitibankKlaus M. Patig, CommerzbankManfred Zaß, DGZ DekaBankUwe E. Flach, DZ BankLeonhard H. Fischer Fritz Nols, Fritz Nols Global Equity ServicesHarold Hörauf, HSBC Trinkaus & BurkhardtDr. Stefan Jentzsch, HypoVereinsbankRainer Roubal, ICF Intermediär Center FrankfurtKursmaklerHessel Lindenbergh, ING GroupDr. Peter Coym, Lehman BrothersGerhard Roggemann, WestLB
Advisory Board of Deutsche Börse AGFurther development of stock exchange concept
B. Metzler seel. Sohn & Co.Commerzbank; Deutsche BankDGZ DekaBank; Dresdner BankDZ Bank; HSBC Trinkaus & BurkhardtHypoVereinsbank; ING BHF-BankKursmakler Service GesellschaftWestLB
Exchange Council of the Frankfurt Stock ExchangeSupreme control and supervisory body of the public stock exchange
Dr. Lutz Raettig (Chairman), Morgan StanleyFriedrich von Metzler, B. Metzler seel. Sohn & Co.Jürgen Walter, Baader SecuritiesDirk Schaper, Concord EffektenDr. Manfred Gentz, DaimlerChryslerHermann-Josef Lamberti, Deutsche BankAxel Weber, DGZ DekaBankHeinrich Linz, Dresdner BankUlrike Diehl, DVFA Deutsche Vereinigung fürFinanzanalyse und AnlageberatungUwe E. Flach, DZ BankDr. Hans-Jörg Frantzmann, Frankfurt-TrustInvestment-GesellschaftHarold Hörauf, HSBC Trinkaus & BurkhardtDr. Stefan Jentzsch, HypoVereinsbank
Rainer Roubal, ICF Intermediär Center FrankfurtKursmaklerJörg D. Reuter, Jörg D. Reuter Wertpapier-handelsgesellschaftDr. Heiner Hasford, Münchener Rückversicherungs-gesellschaftHenning von der Forst, Nürnberger Beteiligungs AGPeer M. Schatz, QiagenRalph Ristau, Resource Trading Group RTGHeinz-Joachim Neubürger, SiemensStefan Winter, UBS WarburgProf. Dr. Wolfgang Gerke, University of Erlangen-Nuremberg – Chair of Banking and Stock MarketsGerhard B. Roggemann, WestLB
Primary Markets Advisory Committee (PMAC)Design of the primary market, in particular reflectingchanges in the Exchange Rules and Regulations
Aixtron; Allianz; Apax Partners; BASFCredit Suisse First Boston; Deutsche BankDeutsche LufthansaDeutsche Schutzvereinigung für WertpapierbesitzDresdner Bank; DWS; DZ Bank; equinet Ernst & Young WirtschaftsprüfungsgesellschaftGoldman Sachs; HypoVereinsbankInvesco; Jenoptik; Loewe; Merrill LynchQiagen; SAP; Shearman & Sterling; TechemT-Online International; UBS WarburgUnion Asset Management HoldingWestLB Asset Management
Secondary Markets Advisory Committee (SMAC)Functions and service levels of the Xetra platform
BNP Paribas; Commerzbank; Concord EffektenConsors Discount Broker; DGZ Deka BankDeutsche Bank; Dresdner Bank; DZ BankGoldman Sachs; Hesse Ministry of Economics,Transport and Regional Development; HypoVereinsbankICF Intermediär Center Frankfurt KursmaklerMerrill Lynch; Morgan Stanley; N.M. FleischhackerUBS Warburg; Van der Moolen Training; WestLB
Working Committees and Executive Bodies as at 31 Dec. 2002

CUSTOMER GOVERNANCE 099099
Working Committee for Practices and Rules for Price Determination in Floor TradingDetails of and amendments to the rules for price deter-mination in floor trading on the Frankfurt Stock Exchange
Commerzbank; Deutsche Bank; Deutsche BundesbankDresdner Bank; ICF Intermediär Center FrankfurtKursmakler; Fritz Nols Global Equity ServicesHesse Ministry of Economics, Transport and RegionalDevelopment; KS Privat Consult
Designated Sponsors WorkshopFurther development of the Designated Sponsor model,discussion of new models and clarification of currentissues at an operational level
Archelon Deutschland; CommerzbankConcord Effekten; Deutsche BankDresdner Bank; equinet SecuritiesHypoVereinsbank, N.M. FleischhackerSeydler; Timber Hill EuropeUBS Warburg; WestLB
Investors Advisory Committee(First meeting in January 2003)Further development of the product and service portfolioof Deutsche Börse Group for institutional investors
Allianz Dresdner Asset ManagementBVI Bundesverband Investment und Asset Management1)
Cleary, Gottlieb, Steen & Hamilton 1)
Credit Suisse First Boston; Deka InvestmentDeutsche Bank; DWS; FEFSI, Fédération Européennedes Fonds et Sociétés d’Investissement 1)
FERI Trust; Fidelity Investments InternationalFreshfields Bruckhaus Deringer 1)
Gassner Stockmann & Kollegen 1)
Goldman SachsHengeler Mueller Weitzel Wirtz 1)
Linklaters O&R Oppenhoff & Rädler 1)
Morgan Stanley; Morley Fund ManagementSchroders Investment ManagementT. Rowe Price InternationalThreadneedle Investment ManagersUBS Global Asset ManagementUnion Investment Luxembourg
Administrative Board of Eurex Zürich AGSupervisory Board of Eurex Frankfurt AGSupervisory Board of Eurex Clearing AGStatutory supervisory bodies
Dr. Markus Granziol (Chairman)Mehmet Dalman, CommerzbankWalter Berchtold, Credit Suisse First BostonDr. Hugo Bänziger, Deutsche BankLeonhard H. FischerJacques de Saussure, Pictet & Cie.
Exchange Council of Eurex DeutschlandSupreme control and supervisory body of the public stock exchange
Dr. Peter Coym (Chairman since March 2003), Lehman Brothers Horst Marschall, Baden-Württembergische BankFriedrich v. Metzler, B. Metzler seel. Sohn & Co.Rolf Birkert, Birkert & Fleckenstein Wertpapier-handelshausEric Martin, BNP ParibasKlaus M. Patig, CommerzbankNorbert Dülks, Delta WertpapierhandelHermann-Josef Lamberti, Deutsche BankAxel Weber, DGZ DekaBankHeinrich Linz (since March 2003), Dresdner BankUlrike Diehl, DVFA Deutsche Vereinigung fürFinanzanalyse und Asset ManagementUwe E. Flach, DZ BankChristian Schaffer, First FuturesRudolf Reil, Fritz Nols Global Equity ServicesHans Joachim Goehtz, Garban Intercapital SecuritiesDeutschlandGustav Gass, Gass Capital MarketsStephan Bub, HypoVereinsbankProf. Dr. Christian Schlag, J.W. Goethe UniversitätFrankfurt, Chair of Derivatives and FinancialEngineeringMatthias Hofinger, MH Trading WertpapierhandelDietrich Heidtmann, Morgan StanleyChristoph Lampert, Salomon BrothersGerhard Roggemann, WestLB
1) Guest

Working Committee for Equity and Index Products (Eurex)Eurex equity and index products
Archelon Deutschland; Aurel LevenBank of America; Bear Stearns InternationalBNP Paribas; CMT Capital Markets TradingCommerzbank; Credit Suisse First BostonDeutsche Bank; Dresdner BankDTS Derivative Trading SystemEXANE; Fimat International BanqueHEX Helsinki Stock ExchangeHull Trading; HSBC Trinkaus & Burkhardt HypoVereinsbank; JP Morgan SecuritiesMako Global Derivatives TradingMorgan Stanley; Société GénéraleTimber Hill; Warburg Dillon ReadWestLB
Working Committee for Interest Rate Products (Eurex)Eurex interest rate products
ABN Amro; BarclaysCargill Investors ServicesCommerzbank; Credit Suisse First BostonDeutsche Bank; Dresdner BankDZ Bank, Fimat International BanqueFortis; Goldenberg, Heymeyer & Co.Goldman Sachs; HypoVereinsbankJP Morgan; Lehman BrothersMako Global; Marquette ProprietaryMorgan Stanley; Tradition SecuritiesUBS Warburg; WestLB
Working Committee for Clearing (Eurex)Eurex clearing infrastructure
ABN Amro; Bank VontobelBarclays; BNP ParibasCommerzbankCredit Suisse First BostonDeutsche Bank; Dresdner BankDZ Bank; Fimat International BanqueFortis; HypoVereinsbankMorgan Stanley; Salomon BrothersUBS Warburg; WestLB
Working Committee for Equity Clearing (Eurex)Clearing of cash market products
BNP Paribas; Citibank; CommerzbankCredit Suisse First BostonDeutsche Bank; Dresdner BankDZ Bank; Fimatex; FortisHSBC Trinkaus & BurkhardtHypoVereinsbank; InstinetLandesbank Hessen-ThüringenLehman BrothersMorgan Stanley; WestLB
Working Committee for Equity IndicesIndex rebalancing and index changes
BNP Paribas; CommerzbankDeutsche Bank; Dresdner BankDZ Bank; HypoVereinsbankING BHF-Bank; Sal. OppenheimUBS Warburg; WestLB
Clearstream International Board of DirectorsAnglo-American-style single board
Robert B. Douglass (Chairman), Milbank, Tweed,Hadley & McCloyGordon Sangster, Bank of AmericaJean Meyer, Banque Générale du LuxembourgAndrew Bruce, BarclaysRoberto Vicario Montoya, BBVADavid Van PeltDominique Hoenn, BNP ParibasRenato Tarantola, Cassa di Compensazione e GaranziaErnst-Wilhelm Contzen, Deutsche BankMarc Hoffmann, Dexia-BILEric Hollanders, ING GroupDr. Lutz Raettig, Morgan StanleyGian Franco Mattei, San Paolo/IMICharles S. McVeigh, Schroder Salomon Smith BarneyJosef Landolt, UBS
CUSTOMER GOVERNANCE100

Clearstream Banking LuxembourgAnglo-American-style single board
Gordon Sangster, Bank of AmericaPierre Ahlborn, Banque de LuxembourgJean Thomazeau, BNP ParibasSusan C. Livingston, Brown Brothers Harriman & Co.Joachim von Eiberg, CommerzbankMarc Hoffmann, Dexia-BILEric Hollanders, ING Group
User Advisory Board – Clearstream Banking LuxembourgDiscussion forum for leading Clearstream customers
ABN AMRO Mellon; Banca Intesa BCI Banque de Luxembourg; Barclays; BNP Paribas CDC IXIS; Crédit AgricoleCredit Suisse Financial Services; CitigroupDexia-BIL; Dredner Bank Financial Markets Service Bank; Fortis ING Group; Kredietbank Luxembourgoise; UBS
Credit Advisory Group – Clearstream Banking LuxembourgMarket development and credit risk
Banca Intesa Spa; Barclays; BNP Paribas Citibank; Dresdner Bank
Advisory Board – Clearstream Banking FrankfurtAll key projects
Bayerische LandesbankBNP Paribas; bws bankCommerzbank; Dresdner Banketb european transaction bankFinancial Markets Service BankING BHF-Bank; Morgan StanleyWord Wide Securities Services CitibankWPS WerpapierService Bank
Straight-Through Processing CommitteeVertical integration issues
Archelon; BNP Paribasbws bank; CitibankDeutsche Bank; Dexia-BILDresdner Bank; DWSFimat International BanqueFortis; HypoVereinsbankING BHF-Bank; JP MorganMorgan Stanley; ReutersSeydler; TXB LB TransaktionsserviceUBS
Technical Advisory CommitteeFurther development of the IT infrastructure
BNP Paribas; bws bankCommerzbankCredit Suisse First BostonDGZ DekaBank; Deutsche BankDresdner Bank; DZ BankEEX European Energy Exchange Fimat International BanqueGoldman SachsHSBC Trinkaus & BurkhardtHypoVereinsbank Systems; ING BHF-BankJP Morgan; Morgan StanleySWX Swiss ExchangeUBS Warburg; WestLB SystemsVienna Stock Exchange
Technology Advisory BoardStrategic IT development
Bayerische LandesbankCommerzbank; Deutsche Bankdvg Hannover DatenverarbeitungsgesellschaftDresdner Bank; DZ BankHypoVereinsbankING BHF-Bank; WestLB
CUSTOMER GOVERNANCE 101

102
In February 2002, a government commission
appointed by the German Ministry of Justice
presented the German Corporate Governance
Code. Deutsche Börse AG was a member of
this commission from the outset, and actively
campaigned for improved codes of conduct
and disclosure requirements.
Corporate Governance means the responsible
management and simultaneous supervision of
companies. It includes factors such as efficient
cooperation between executive boards and super-
visory boards, transparency in corporate commu-
nications and the safeguarding of shareholders’
interests. These principles have always been a
top priority at Deutsche Börse, which is why
the Executive Committee (which corresponds to
the Executive Board in the terms of the Aktien-
gesetz, the German Stock Corporation Act) and
the Supervisory Board of Deutsche Börse AG
resolved to implement the recommendations and
suggestions of the German Corporate Governance
Code, insofar as this is possible without a resolu-
tion by the General Meeting.
Deutsche Börse AG will therefore implement the
following recommendations, among other things:
■ The compensation for members of the
Executive Board of Deutsche Börse AG will
include both fixed and variable, performance-
related components. The variable components
are based on predefined comparative para-
meters; performance targets may not be
altered retroactively (see p. 199).■ The Supervisory Board will establish an Audit
Committee to replace the existing Finance
Committee. The Audit Committee will assume
additional responsibilities, relating to account-
ing and risk management, the independence
of the auditor, the engagement of the auditor,
the definition of focal points of the audit and
the agreement on the audit fee in particular. ■ The dates of regular publications (such as
interim reports) and General Meetings will
be published sufficiently in advance in a
financial calendar (see p. 211). ■ Deutsche Börse AG has taken out a D&O
(Directors and Officers’) liability insurance
policy for members of the Executive Board
and the Supervisory Board. The deductible
for each member amounts to 50 percent
of his or her fixed annual compensation.■ Deutsche Börse AG supports shareholders
wishing to exercise their rights personally.
Shareholders’ voting rights in the General
Meeting may be exercised in person, by a
proxy of their own choosing, or by a proxy
appointed by the company and acting on
the instructions of the shareholders.
CORPORATE GOVERNANCE
Corporate Governance:Transparency and Responsible Management

103CORPORATE GOVERNANCE
Deutsche Börse AG complies with the following
suggestions of the German Corporate Governance
Code in particular:
■ Details of the compensation received by
individual members of the Executive Board
are included in the notes to the consolidated
financial statements (see p. 199). ■ The Chairman of the Audit Committee may
neither be the Chairman of the Supervisory
Board nor a former Executive Board member
of Deutsche Börse. ■ As in 2002, excerpts of the Annual General
Meeting 2003 will be transmitted via the
Internet. ■ As before, information on the company will
also be published in English.
Deutsche Börse AG cannot yet implement some
of the provisions of the German Corporate Gover-
nance Code, as a resolution on these issues must
first be passed by the General Meeting. On 10
December 2002, Deutsche Börse AG published
these exceptions on its web site in a declaration
of conformity in accordance with section 161 of
the German Stock Corporation Act.
Wording of the declaration of conformity
“Deutsche Börse AG complies with the recom-
mendations of the Government Commission on
the German Corporate Governance Code with
the following exceptions:
■ To date, the chair and members of the
Supervisory Board committees have not
received separate compensation for their
activities. ■ To date, the members of the Supervisory
Board have not received performance-related
compensation.■ Furthermore, there is no stipulated upper age
limit to date for membership of the Executive
Board or the Supervisory Board.
The Executive Board and the Supervisory Board
will propose the following additions to the
Articles of Association of Deutsche Börse AG
at the next Annual General Meeting:
■ A provision governing the compensation of the
chair and members of the Supervisory Board
committees (Code section 5.4.5 (1) sentence 3)
will be added to Article 13 (6).■ A provision governing the performance-related
compensation of Supervisory Board members
(Code section 5.4.5 (2)) will be added to
Article 13 (5).■ Provisions for an upper age limit for member-
ship of the Executive Board and the Supervisory
Board (Code section 5.1.2 and Code section
5.4.1) will be added to Articles 6 and 9”.

In the year under review, the Supervisory Board performed its duties in accordance with the law and
the Articles of Association. We monitored the Executive Board’s work and regularly advised it on the
management of the Company. We were directly involved in all key decisions affecting the Company.
The Executive Board provided detailed, comprehensive and timely information on the course of business,
the position of the Company as well as its strategy and planning in a total of five meetings. Individual
issues were also addressed in discussions between these meetings and reported on by the Executive
Board in writing. In addition, the Chairman of the Executive Board maintained regular contact with
the Chairman of the Supervisory Board and informed him of current developments in the Company’s
position, key transactions and upcoming decisions. The Supervisory Board thoroughly examined,
discussed and voted on all proposals made by the Executive Board requiring the approval of the
Supervisory Board as stipulated by law or the Articles of Association. All members of the Supervisory
Board participated in more than half of the Supervisory Board meetings held during their term of
office in 2002.
Focus of discussion by the Supervisory Board
Our discussions focused mainly on Deutsche Börse Group’s strategic orientation and internationalization.
In particular, the legal, financial and strategic aspects of the acquisition of Clearstream International
S.A. were discussed in depth. We granted our approval for the acquisition of 100 percent of the shares
in Cedel International S.A., which – alongside Deutsche Börse AG – held a 50-percent holding in
Clearstream International S.A. In this context, we formed a ”Capital Increase 2002” Supervisory
Board Committee. In addition, we granted our approval for the acquisition of 50 percent of the
shares in Infobolsa S.A., a subsidiary of Bolsa de Madrid (the Spanish Stock Exchange). We were
comprehensively informed about the reorganization of Deutsche Börse Group in connection with the
integration of Clearstream International S.A. and entory AG. Finally, we addressed human resources
issues concerning the Executive Board in two meetings.
Work of the committees
In the year under review, a total of five committees were formed. Their task is to prepare the issues
to be dealt with in the plenary meetings and our resolutions. In addition – to the extent that this is
legally permissible – we have delegated individual decision-making powers to committees, in order
to increase our efficiency. For example, the Staff Committee is responsible for completing, amending
and terminating contracts of service with Executive Board members, defining annual bonuses, making
allocations under the stock option program and making occupational pension commitments in place
of the Supervisory Board. A list of the members of the individual committees can be found on p. 209
of this Annual Report. The Chairman of the Supervisory Board also chairs the Staff Committee and
the Strategy Committee.
REPORT OF THE SUPERVISORY BOARD104
Report of the Supervisory Board

■ The Supervisory Board’s Staff Committee met three times in 2002. It primarily dealt
with compensation for Executive Board members and the reorganization of the Company’s
management structure. In addition, the Committee resolved to convert retirement provisions for
the Executive Board and senior executives from a defined benefit plan to a performance-oriented
defined contribution plan. In addition, pension assets are to be transferred to a trustee.■ The Supervisory Board’s Strategy Committee advises the Executive Board on issues relating to
fundamental business policy and corporate orientation, as well as on key projects for Deutsche
Börse Group. Particular subjects of discussion at the Committee’s three meetings were the
strategy and development of the Xetra and Eurex business areas, as well as growth options for
the Information Products business area. In addition, the Executive Board presented Deutsche
Börse Group’s strategic planning for the coming years. In its first two meetings, the Committee
also addressed the acquisition of Clearstream International S.A. in depth.■ The Supervisory Board’s Finance Committee, which had already performed the functions of an
accounting and auditing committee in the past, was renamed the Audit Committee by way of a
resolution by the Supervisory Board on 9 December 2002. The Committee convened four times
in the period under review. It closely examined the Group’s financial and economic situation and
discussed the annual and the consolidated financial statements, and the proposal for the appro-
priation of the unappropriated surplus, in particular. The members made recommendations for
the Supervisory Board plenary meeting dealing with budget planning for the new fiscal year and
gained an overview of Deutsche Börse Group’s value-at-risk management.■ The Supervisory Board’s Committee for IT Issues met twice to discuss preparations for the
introduction of the central counterparty for equity trading and the coordination of cooperation
between the Group’s IT companies Deutsche Börse Systems AG, entory AG and Clearstream
Services S.A., in particular.■ A Supervisory Board’s Committee formed in the context of the capital increase in 2002 convened
twice and approved the Executive Board’s utilization of the capital authorized by the Annual
General Meeting (authorized capital II), including the details of the conditions for issuing new
shares. This Committee was dissolved again after the completion of the capital increase.
Regular reports on the work of the Supervisory Board’s Committees were in each case provided
at the subsequent plenary meeting of the Supervisory Board.
Corporate Governance and Declaration of Compliance
The Supervisory Board sees the German Corporate Governance Code, published by the Government
Commission in February 2002, as a vital step in the ongoing development of corporate management
and control in practice. We discussed the implementation of the Code at Deutsche Börse AG in two
meetings. On 9 September 2002, we declared our fundamental approval of the Code’s recommenda-
tions and suggestions, and – together with the Executive Board – we issued our first declaration of
REPORT OF THE SUPERVISORY BOARD 105

conformity in accordance with section 161 of the Aktiengesetz (German Stock Corporation Act) on
9 December. This declaration has been published on the Company’s Internet page.
The by-laws of the Supervisory Board and the Executive Board were revised and adopted by us, in
order to reflect the provisions of the Code and the changes in our general situation (e.g. the acquisi-
tion of Clearstream International S.A. and entory AG in particular). For example, the by-laws of the
Supervisory Board now oblige members to declare to the plenary meeting any conflicts of interest,
particularly those that could arise as a result of an advisory function or executive body position at
a customer, supplier, lending body, or other business partner. In addition, we undertake to provide
information about conflicts of interest that arise, and the way they are handled, in our report to the
Annual General Meeting. No such conflicts of interest arose during the period under review. In addi-
tion, the remuneration of the Executive Board and the Supervisory Board will be disclosed separately
in the notes to the consolidated financial statements. Further details on corporate governance and
the exact wording of our declaration of conformity are included in a separate section of this Annual
Report on p. 102f.
Adoption of the Annual Financial Statements
The Annual General Meeting 2002 appointed KPMG Deutsche Treuhand-Gesellschaft Aktiengesellschaft
Wirtschaftsprüfungsgesellschaft, Berlin and Frankfurt/Main, as the auditor. KPMG audited Deutsche
Börse AG’s accounting principles, its annual financial statements and management report, as well as
the consolidated annual financial statements and the Group management report. The auditor issued
unqualified audit opinions for each of these.
The financial statement documents and reports by KPMG were presented to us for examination in a
timely manner. The auditor was present at the relevant meetings of the Audit Committee as well as
at the meeting of the entire Supervisory Board convened to adopt the accounts. The auditor reported
on the key results of the audit, and elaborated on the net assets, financial position and results of
operations of the Company and the Group in particular, and provided us with supplementary information.
On the basis of our own audit of the annual financial statements, the consolidated financial state-
ments, the management report and the Group’s management report, we agreed with the findings
of the audit performed by the auditor. No objections were raised. The Supervisory Board today
approved the annual financial statements prepared by the Executive Board; they are thereby adopted.
We also approve the proposal for the appropriation of the unappropriated surplus.
REPORT OF THE SUPERVISORY BOARD106

Changes in the Executive Board and the Supervisory Board
In its meeting on 9 September 2002, the Supervisory Board appointed Mr. André Roelants to the
Executive Board as its Deputy Chairman with immediate effect. In addition, the Supervisory Board
appointed Mr. Matthias Ganz to the Executive Board in its meeting on 9 December 2002, with effect
from 1 January 2003.
Messrs. Frank Gerstenschläger (a member of the Executive Board since 1 January 2001), Christoph
Lammersdorf (a member of the Executive Board since 1 January 1999) and Volker Potthoff (a member
of the Executive Board since 1 April 2000) resigned from the Executive Board by mutual agreement
as of 31 December 2002. They have now assumed other executive responsibilities within the Group.
We would like to thank them for their unwavering commitment and successful work on the Executive
Board. They will continue to contribute to the success of the Company in their new capacities.
There were also changes in the Supervisory Board. Dr. Norbert Juchem resigned from the Board with
effect from 15 May 2002, Dr. Peter Gloystein and Dr. Claus Löwe with effect from 9 September
2002 and 19 September 2002 respectively. We would like to thank these gentlemen for their valuable
contribution. In the Annual General Meeting on 15 May 2002, Dr. Stefan Jentzsch was appointed to
the Supervisory Board. Ms. Sandra S. Jaffee and Mr. Jan Hessel Marie Lindenbergh were appointed
to the Supervisory Board by way of a court ruling, with effect from 22 November 2002.
The term of office of the current Supervisory Board ends with the Annual General Meeting on 14 May
2003. I would personally like to thank all Board members for their commitment and their constructive
support of the Company and the Executive Board over the years. In addition, the Supervisory Board
would like to thank the Executive Board and all the employees and employee representatives for their
work in the year under review.
Frankfurt/Main, 26 March 2003
On behalf of the Supervisory Board:
Dr. Rolf-E. Breuer
Chairman
REPORT OF THE SUPERVISORY BOARD 107

DVFA/SG earnings are the net profits calculated according to the methodologypublished by the Deutsche Vereinigung für Finanzanalyse und Anlageberatung e.V.and the Schmalenbach-Gesellschaft.
EBIT margin The EBIT margin is calculated by dividing EBIT (less income fromequity investments and write-downs of noncurrent financial assets) by the salesrevenue for the year.
CF1 ROI “Cash Flow 1 Return on Investment” is calculated as the pre-tax earn-ings according to the methodology published by DVFA/SG, plus depreciation andamortization expenses, divided by total assets, less technical closing date liabilities.
CF2 ROI “Cash Flow 2 Return on Investment” is calculated as for CF1 ROI, but adds back to the numerator the increase in pension liabilities charged to net profit.
Return on equity The return on equity is calculated as net profit, calculated inaccordance with the methodology published by DVFA/SG, divided by averageequity for the year, based on the quarter-end equity balances.
Trade creditors days 1 The first measure of trade creditors days is calculated as trade payables divided by total sales revenue, multiplied by 360 days.
Trade creditors days 2 The second measure of trade creditors days is calculated as trade payables divided by sales revenue and net interest income from banking business, multiplied by 360 days.
Trade Creditors ratio The creditors ratio is calculated as current liabilities, including bank liabilities, trade payables and other current liabilities, divided by sales revenue.
Equity ratio 1 Equity ratio 1 is calculated as the ratio of equity less intangibleassets, land and buildings, to total assets including intangible assets, land andbuildings and cash assets, less technical closing date liabilities.
Equity ratio 2 Equity ratio 2 is calculated as for Equity ratio 1, but with theinclusion of noncurrent provisions in the nominator.
Debt /equity ratio The debt/equity ratio is calculated as the ratio of current liabi-lities to total assets (excluding technical closing date liabilities).
Cash ratio The cash ratio is calculated as the ratio of unrestricted cash balancesto current liabilities (excluding technical closing date liabilities).
Current ratio The current ratio is calculated as the ratio of unrestricted cashbalances and other current assets to current liabilities (excluding technical closing date liabilities).
Debt coverage Debt coverage is calculated as the DVFA/SG pre-tax earnings plusdepreciation and amortization (cash earnings) divided by total liabilities.
Equity/net tangible assets Economic capital divided by plant and equipment.
Consolidated income statement ratios
Sales revenue €m 455.1 599.0 648.9 760.3 1,106.5
Earnings before interest and taxes (EBIT) €m 106.3 106.2 216.5 278.1 351.2
DVFA/SG earnings €m 53.4 70.0 142.9 203.7 235.1
EBIT margin (excl. income from equity investments) % 24 19 24 31 29
CF1 ROI % 36 32 35 20 20
CF2 ROI % 37 32 35 21 19
DVFA/SG earnings per share € 0.73 0.95 1.95 2.04 2.18
Return on equity % 27 29 40 16 13
Consolidated balance sheet ratios
Trade creditors days 1 days 28.2 37.2 33.0 28.1 32.7
Trade creditors days 2 days 32.4 42.0 39.4 33.2 37.8
Trade creditors ratio % 20 24 27 29 47
Equity ratio 1 % 30 23 41 203 42
Equity ratio 2 % 68 64 56 220 61
Debt/equity ratio % 31 36 30 14 22
Cash ratio % 37 46 27 372 37
Current ratio % 117 121 86 430 72
Debt coverage % 66 55 70 101 67
Equity/net tangible assets 6.4 6.6 8.5 37.1 7.9
Deutsche Börse Group: Five-year review
1998 1999 2000 2001 2002

Deutsche Börse AG’s consolidated financial state-
ments have been prepared in accordance with the
International Financial Reporting Standards (IFRSs)
and the International Accounting Standards (IASs)
and supplemented by a group management report
in accordance with section 315 of the HGB
(Handelsgesetzbuch – German Commercial Code).
These are exempting consolidated financial state-
ments as defined by section 292a of the HGB. This
mangement report contains additional disclosures
on the course of business of Deutsche Börse Group.
Business review 2002
2002 saw the financial markets feeling the effects
of the growing deterioration in the global economy.
The upturn predicted for the western European
markets at the beginning of the year failed to
materialize, and economic growth in the USA
also lost momentum during the course of the
year. GNP growth in most markets was far lower
than expected. The slow pace of economic
growth was accompanied by declining capital
market expectations for mid-term corporate prof-
its – one of the prime reasons why the world’s
major cash markets suffered a sharp drop in
prices for the third year in succession.
Financial markets impacted by poor state of the global economy
The recovery in the global economy that many
had predicted for the beginning of 2002 did not
emerge, and preliminary estimates put growth in
global economic output at a mere 1.5 percent,
with some key industrial nations – especially in
the euro zone – falling well short of this figure.
Full-year US GNP grew by an estimated 2.1 per-
cent, although the growth curve flattened rapidly
after a strong first quarter. In the first three quar-
ters of 2002, euro-zone GNP grew by less than
1 percent year-on-year. According to preliminary
figures released by the Federal Statistical Office,
the German economy recorded a paltry 0.2 per-
cent growth – the lowest rise in nine years.
The worsening economic prospects, coupled with
increasingly negative overall sentiment, took their
toll on all the major stock markets. During the
course of the year, the US Dow Jones lost 17 per-
cent, for example, the UK FTSE fell by 25 per-
cent, the Japanese Nikkei was off 19 percent
and the French CAC 40 ended the year 34 per-
cent down. The DAX®, the German blue chip
index, lost 44 percent of its value, causing strong
volatility and low valuations. At the same time,
new issues of German stocks fell to their lowest
level since 1990. Private investors demonstrated
their uncertainty about future market developments
by almost ceasing trading altogether. This had a
particularly adverse effect on floor trading, whose
activity indicators have dropped continuously
since March 2000.
GROUP MANAGEMENT REPORT
Group Management Report
109

Cash and derivatives markets diverge
Business development at Europe’s leading stock
exchange operators was uneven last year. Inves-
tor trading activity fell on all major cash markets
to below 2001 levels. The market operated by
Deutsche Börse is heavily dependent on trading
in German blue chips, so it suffered particularly
from the slide in the leading index for German
standards, the DAX, which recorded a very sharp
fall by international standards. Trading volume –
measured by order book turnover – declined by
36 percent.
Trading volume on the major European cash markets
By contrast, trading activity on the European deriv-
atives markets recorded strong growth to reach
new record levels. In particular the increased need
for hedging by institutional investors, especially
insurers, resulted in buoyant derivates exchange
trading. Growth was further boosted by the general
increase in the use of derivatives and the gain in
market share by exchange-traded derivatives at
the expense of OTC derivative products.
Trading activity on major derivatives exchanges
Overall positive course of business
Despite the weak macroeconomic environment,
Deutsche Börse Group succeeded in reaching its
ambitious growth targets last year. Now that the
Group has broadly diversified its business activities
and focused its business model primarily on the
turnover activity of financial products, it was able
to successfully build on the growth achieved in
previous years: sales revenue rose by 46 percent
in 2002 to €1,106.5 million (2001: €760.3 mil-
lion). Organic growth, i. e. excluding the sales
revenue of the newly acquired companies Clear-
stream, entory and Infobolsa, was 3 percent in
this period.
Earnings before interest and taxes (EBIT) rose
by 26 percent to €351.2 million (2001: €278.1
million). Strong demand for derivatives and in-
formation products more than offset the weaker
development in the Xetra and Information Technol-
ogy segments, where Deutsche Börse was unable
to escape recessionary trends.
GROUP MANAGEMENT REPORT110
Deutsche Börse –36
Euronext –16
London Stock Exchange –21
Stockholmsbörsen (OM Gruppe) –39
Source: FESE
Order book turnover
2002 vs. 2001
%
Eurex 19
Euronext.Liffe 14
CME 35
CBOT 32
Source: The exchanges listed
Increase in contract volumes
2002 vs. 2001
%

Deutsche Börse’s key performance figures
1) Excluding entory
The business activities of Deutsche Börse Group
are classified under the Xetra (cash market: elec-
tronic order book and floor trading), Eurex (deriv-
atives market), Information Products (sales of
price information and information distribution),
Information Technology (systems and service pro-
vider) and Clearstream (settlement of transactions
and custody of securities) segments.
The Xetra (cash) and Eurex (derivatives) markets
operated by Deutsche Börse are closely interlinked.
In the cash market, equities are traded and indi-
ces are calculated that then form the basis for
trading on the derivatives market. The level of
activity on the two markets tends to diverge, for
example because high volatility on the cash mar-
ket on the one hand unsettles investors, leading
to lower order flows from certain investor groups.
On the other hand, however, this results in higher
order volumes on the derivatives market.
Trading activity in the Xetra cash market segment
in 2002 fell short of the previous year’s level
primarily because of the sharp decline in trans-
actions by private investors. At the same time,
though, trading activity grew on the Eurex deriv-
atives market segment. This resulted in more
widespread demand for derivative trading data
and additionally boosted the business of the
Information Products segment.
The Information Technology segment was also hit
by the cyclical weakness and the difficult situa-
tion on the stock markets: the earnings position
of most German financial service providers dete-
riorated considerably, forcing them to implement
far-reaching cost-cutting measures. As a result,
order books fell sharply at entory, the subsidiary
which specializes in providing services to the
German finance industry; the average margin
generated from IT consulting also declined ap-
preciably. Because the operations of the former
Xlaunch segment are now allocated to Information
Technology, its sales revenue is no longer report-
ed separately, but under Information Technology.
The impact on the business of the Clearstream
segment was minor. The segment felt the effects
of its partial dependence on short-term US and
euro-zone interest rates, plus lower volumes of new
equity and bond issues: the number of securities
transactions fell by 4 percent. At the same time,
the value of the securities held in deposit by
Clearstream fell by 8 percent, due in the most
part to the sharp slide in stock prices.
Sales revenue by segment
GROUP MANAGEMENT REPORT 111
2002 2001 Change
%
Sales revenue (€m) 1,106.5 760.3 46
EBIT (€m) 351.2 278.1 26
DVFA/SG earnings (€m) 235.1 203.7 15
DVFA/SG earnings per share (€) 2.18 2.04 7
Employees as at 31 Dec. 3,318 1,123 195
2002 2001 Change
€m €m %
Xetra 210.8 243.1 –13
Eurex 331.6 268.8 23
Information Products 121.5 109.9 11
Information Technology 165.61) 138.52) 20
Clearstream 277.0 0 –
Total 1,106.5 760.3 46
Internal revenue Information Technology 222.71) 229.72) –3
1) Deutsche Börse Systems, entory, Clearstream TEC and Xlaunch2) Deutsche Börse Systems and Xlaunch

Q 12001
Q 2 Q 3 Q 4 Q 12002
Q 2 Q 3 Q 4
million
0
5
10
15
20
Xontro contract notes in Frankfurt floor trading
Xetra transactions
Q 12001
Q 2 Q 3 Q 4 Q 12002
Q 2 Q 3 Q 4
Average order size (¤)
0
20,000
40,000
60,000
80,000
Business development in the segments
Business development in the segments was
heterogeneous. The weak state of the economy,
coupled with low trading activity by investors,
depressed business in the Xetra and Clearstream
segments, while hedging considerations boosted
business in the Eurex segment.
Xetra segment
Gloomy economic forecasts and an increasingly
pessimistic underlying sentiment led to high
volatility on all major international equities mar-
kets in 2002. Uncertainty about future develop-
ments and a correspondingly low level of interest
from private investors cast a shadow over the
German equities market, whose leading index,
the DAX, fell by 44 percent. Revenue in the
Xetra cash market segment dropped by a total of
13 percent to €210.8 million (2001: €243.1
million).
In floor trading, which is predominantly used by
private investors, trading activity (measured by
the number of contract notes), the main revenue
driver in the Xetra segment, fell 32 percent year-
on-year. Because the volume of floor trading fees
depends solely on the number of contract notes,
to the exclusion of any volume-related compo-
nent, revenue from floor trading fell by 33 per-
cent to €59.4 million (2001: €88.7 million).
More transactions on Xetra, less transactions in floor trading
At the Xetra® electronic order book, the lower turn-
over rate of institutionally managed assets, a
higher percentage share of small volume private
investor orders and the sharp slide in valuation
levels led to a decline in average trading volumes.
Due to the partly volume-driven fee model, the
average revenue recorded by Deutsche Börse per
transaction also declined.
Volume of trades executed on Xetra
GROUP MANAGEMENT REPORT112

0
Turnover in millions of contracts
160
170
180
190
200
210
220
230
240
Q 12001
Q 2 Q 3 Q 4 Q 12002
Q 2 Q 3 Q 4
By contrast, the number of trades on Xetra rose
by 21 percent over the same period. In addition
to the splitting of orders into several sub-orders
in pursuit of certain trading strategies, the grow-
ing shift in the private investor business (with
substantially lower order sizes) away from floor
trading towards the Xetra electronic order book
also played a role. The growing uncertainty on
the cash market starting in July reinforced this
trend, which has been observed for some time
now. The higher number of transactions more
than offset the lower trading volume: the revenue
generated from the operation of the Xetra trading
system rose slightly by 1 percent to €127.5 million.
Xetra: Revenue share of electronic order book goes up
Eurex segment
Trading activity on Eurex grew by 19 percent
in the year under review to 801 million traded
contracts (2001: 674 million). This growth
was attributable primarily to international orders,
whose share of the total trading volume rose
to 75 percent (2001: 69 percent). Overall, the
Eurex derivatives exchange grew its sales revenue
by 23 percent to €331.6 million
(2001: €268.8 million).
Eurex: Increasing trading volume
Following modest growth in the first half of the
year, exchange volumes rose sharply starting in
July, repeatedly reaching new record levels in
the months to October. Both capital market and
index products recorded particularly high growth
rates in this period, with the latter reaching good
double-digit year-on-year growth rates in every
month of the year.
The growth in trading activity on Eurex is due to
a variety of factors, some of which overlap. First,
volumes on the Eurex derivatives exchange, where
derivatives contracts on euro-denominated under-
lyings are traded, have been rising steadily for years.
GROUP MANAGEMENT REPORT 113
Xetra electronic order book
Frankfurt floor trading
Other
Distribution of sales revenue (%)
20022001
61
28
11
52
37
11

Second, the overall market for trading “European”
derivatives contracts, which includes bilateral or
over-the-counter (OTC) trading in addition to
exchange trading on Eurex and other European
derivatives exchanges, is also recording strong
growth. The primary reason for this is the fact
that the European capital market is “catching
up”, as derivatives products were used far less
in Europe in the past than, for example, in the
North American market. Thirdly, Eurex is gaining
significant market share from the OTC market
because in addition to high transparency, trading
on an exchange platform also offers the advantage
that all trades are automatically settled via the
Eurex clearing house as the central counterparty
(CCP). Compared with OTC trading, the CCP
reduces the risk that a counterparty will default;
this risk has grown due to the volatility of the
markets in the second half of the year.
Contract volumes in individual Eurex segments and products
A broad-based product range and high liquidity
in a number of benchmark products have enabled
Eurex to extend its leading position in derivatives
trading in this market environment and to expand
its lead over Euronext.Liffe, the second largest
exchange.
Information Products segment
The Information Products segment increased its
sales revenue by 11 percent year-on-year to
€121.5 million (2001: €109.9 million). Growth
in this segment is due primarily to the positive
development of sales of real-time prices, which
accounted for 82 percent of total revenue. The
data, which is distributed via Reuters and Bloom-
berg, among others, not only contains information
about cash markets, but increasingly also about
derivatives markets. Around 70 percent of the data
packages went to international customers in 2002.
Information Technology segment
The Information Technology segment comprises
the Deutsche Börse Systems subgroup and
Xlaunch (both of which were separate segments
until 2001), the entory subgroup (new in 2002),
and the IT services of the Clearstream subgroup
in the form of Clearstream TEC (since H2/2002).
This segment increased its sales revenue in
2002 by 20 percent to €165.6 million (2001:
€138.5 million).
The external sales revenue generated by the
Deutsche Börse Systems subgroup declined year-
on-year. One of the reasons for this is the col-
lapse in trading activity at the regional stock
exchanges, whose trading systems are operated
by Deutsche Börse Systems. The fees for this
service depend on trading volumes, and fell con-
siderably as these volumes slid. The second half
of the year also saw the loss of external sales
revenue from the IT services provided by Deutsche
Börse Systems for Clearstream. Because Clear-
stream is now fully consolidated, these services
are now classified as internal revenue.
GROUP MANAGEMENT REPORT114
Index products 211 132 60
Stock options 143 133 8
Capital market products 447 409 8
Euro Bund futures 191 178 7
Euro Bobl futures 115 100 15
Euro Schatz futures 109 93 17
Other capital market products 32 39 –18
Total 801 674 19
2002 2001 Change
milions milions %

Business development at entory, whose custom-
ers include a number of major German banks,
was also hit by the situation in the financial ser-
vices industry. 2002 saw high cost pressures,
falling margins and a growing reluctance to invest.
The industry had invested heavily in its IT in the
preceding years, and now held back clearly from
launching new projects. This also resulted in
an appreciable decline in sales revenue at entory,
which was fully consolidated for the first time
in 2002. In this troubled market environment,
entory generated its new business primarily from
projects to cut IT costs.
Clearstream segment
The Clearstream segment generated sales revenue
of €277.0 million in 2002. This figure relates
solely to the consolidated external sales revenue
of the second half of the year. Until 30 June
2002, Deutsche Börse held half the shares of
Clearstream International; only the Group’s
interest in Clearstream’s after-tax earnings was
reported in the Group’s income from equity
investments.
The settlement business was hit by the lower level
of trading activity, in particular by private inves-
tors: the number of international settlement trans-
actions fell by 51 percent year-on-year. The set-
tlement of German equity transactions suffered
especially from the slide in floor trading volumes.
By contrast, the rising number of transactions on
the Xetra electronic trading system led to an
equivalent increase in the volume at Clearstream
Banking AG, Frankfurt, from the settlement of
these trades. Overall, this saw the domestic set-
tlement volume remain more or less unchanged.
However, the full consolidation of the Clearstream
subgroup’s earnings meant that the share of ex-
ternal sales revenue from the settlement of Xetra
trades was no longer included in the second half
of the year. Trading participants pay a standard
trade and settlement fee for this to Xetra, which
is forwarded in part by Xetra to Clearstream as
payment for settlement. This cash flow repre-
sented external sales revenue for Clearstream in
the first half of the year, and is now fully consoli-
dated as internal sales revenue.
The value of the securities deposited, which is
the main factor for sales revenue in the custody
business, fell by 8 percent to €6.9 trillion (at
31 December 2002). The value of fixed-income
securities rose slightly by 0.3 percent to €5 tril-
lion, but the value of equities deposited – mostly
German – fell by 26 percent.
Clearstream segment: Key indicators
GROUP MANAGEMENT REPORT 115
Q1 Q2 Q3 Q4
2002 2002 2002 2002
€bn €bn €bn €bn
Average cashfunds 3,714 3,562 2,839 3,217
Value of securities deposited 7,633 7,410 7,183 7,145
Clearstream Banking S.A., international 2,565 2,454 2,513 2,501
Clearstream Banking AG, international 235 226 234 237
Clearstream Banking AG, domestic 4,833 4,730 4,436 4,407
Transactions millions millions millions millions
Clearstream Banking S.A, international 2.9 2.9 2.7 2.8
Clearstream Banking AG, international 1.2 1.1 0.9 0.8
Clearstream Banking AG, domestic 16.1 15.9 18.0 17.1

Sustained earnings growth
Deutsche Börse AG’s earnings before interest and
taxes (EBIT) rose by 26 percent year-on-year to
€351.2 million (2001: €278.1 million). 2002
EBIT contains write-downs on the goodwill gene-
rated from the acquisition of the entory IT subsid-
iary and, for the first time, goodwill amortization
from the acquisition of Clearstream; together, this
reduced earnings by €68.7 million. EBITA, which
excludes this goodwill amortization, rose in the
same period by 51 percent to €419.9 million
(2001: €278.3 million). The like-for-like EBIT
margin fell slightly from 29 percent in 2001 to
28 percent in the year under review (comparison
excluding the net profit of Clearstream – for the
period when Clearstream was not fully consoli-
dated, this figure is contained in Group EBIT).
EBIT and profitability
Xetra
Xetra segment EBIT fell to €17.4 million, primar-
ily because of the lower volume in floor trading.
However, the increase in trades on the Xetra seg-
ment also had a negative impact. The substantial
decrease in order sizes there resulted in lower
sales revenue per order, although the settlement
fee forwarded to Clearstream remained constant,
at €0.40. This saw margins fall for Deutsche
Börse, despite almost constant sales revenue for
business on the Xetra system.
Eurex
Eurex segment EBIT rose by 59 percent to €158.3
million (2001: €99.3 million). The sharp rise in
the EBIT margin to 48 percent demonstrates the
economies of scale that can be achieved as trad-
ing activity increases. Segment costs fell despite
the strong revenue growth. For Eurex trading
system operation, only higher license fees for
trading certain derivatives were incurred. By
contrast, the increase in network costs was dis-
proportionately low.
Information Products
The Information Products segment also recorded
a significant increase in its EBIT margin to 28 per-
cent, while EBIT itself soared by 102 percent to
€34.3 million. This reflected the investment in
the Consolidated Exchange Feed (CEF) system:
after its launch in 2001, costs fell appreciably
in 2002, and the higher revenue due to the
economies of scale inherent in this segment
resulted in strong profit growth.
GROUP MANAGEMENT REPORT116
Xetra 17.4 8 38.4 16
Eurex 158.3 48 99.3 37
Information Products 34.5 28 17 15
Information Technology 1) 53.0 143) 87.5 24
Clearstream2) 125.4 314) 56.25) n. a.
2002 2001
EBIT EBIT EBIT EBITmargin margin
€m % €m %
1) Figures for 2001 relate to the Systems segment which was renamed “IT” in 2002
2) Figures contain the Settlement segment until Q2/2002; this was renamed “Clearstream” in Q3/2003
3) EBIT/(internal + external sales revenue)4) Includes H2 only, when Clearstream International S.A.’s earnings
were fully consolidated5) Deutsche Börse AG’s share in the after-tax earnings of
Clearstream International S.A.

Information Technology
Information Technology segment EBIT fell to
€53.0 million in 2002 (2001: €87.5 million).
The reason for this decline was the entory sub-
sidiary, which recorded an operating loss as a
result of the collapse of the market for IT servi-
ces. Because of the difficult software development
market environment, in particular in the financial
services sector, entory’s sales revenue and profi-
tability fell well short of expectations. Contingent
earn-out payments to former entory shareholders
amounting to €15.9 million that would have
been due in September 2003 under certain con-
ditions will not be paid now because the criteria
were not met. The provision established for these
payments was therefore released directly to equity.
Although entory’s business model and its position
in Deutsche Börse Group’s portfolio remains stable,
the company will have to grow from a consider-
ably lower base. For this reason, an impairment
loss was charged on the goodwill resulting from
the acquisition of entory, which depressed ear-
nings in the Information Technology segment by
€33.0 million in 2002.
By contrast, profits rose at Deutsche Börse Systems,
where the cost base was lowered through consis-
tent cost management, for example by a substan-
tial reduction in the average hourly rates paid to
external service providers.
Clearstream
The Clearstream segment generated an EBIT
contribution of €125.4 million. Deutsche Börse
Group’s share in Clearstream’s after-tax earnings
reported in the Settlement segment for the
first half of the year is contained in this figure.
Profitability rose further in the second half of the
year, when Clearstream was fully consolidated,
thanks to the rigorous management of external
service providers and IT costs.
Profitability growth
Deutsche Börse’s return on equity, the ratio of
after-tax earnings to the average equity available
to the company in 2002, fell to 12.7 percent
(2001: 15.9 percent). The lower ratio in 2002
is due to the goodwill write-downs that depressed
earnings in the second half of 2002 for the first
time.
Cost of capital
GROUP MANAGEMENT REPORT 117
Risk-free rate 5.0 5.0
Risk premium 5.0 5.0
Beta 1) 0.9 2) 0.9 2)
Cost of equity (after taxes) 9.5 9.5
Cost of debt (before taxes) 3.3 5.6
Tax shield (36%)3) 1.2 2.0
Cost of debt (after taxes) 2.1 3.6
Equity ratio 88.0 95.0
Debt/equity ratio 12.0 5.0
WACC (after taxes) 8.6 9.2
WACC (before taxes) 8.8 9.3
2002 2001
% %
1) A statistical measure of the sensitivity of the price of an individual share to changesin the entire market. A beta of 1.0 means that the performance of the share ismoving strictly parallel to the reference market. A beta above 1.0 denotes greatervolatility than the overall market, while a beta below 1.0 is less volatile.
2) Estimate; the actual value is calculated from 50 consecutive monthly data points. Because Deutsche Börse has only been listed on the FrankfurtStock Exchange for around two years, the necessary data is not yet available.
3) Tax shield denotes and quantifies the reduction in tax paid that arises from thedeductibility of interest payments on debt and is factored into the calculation of the cost of capital.

Deutsche Börse Group is highly profitable. This is
also evident from its return on capital employed
(“ROCE”). The ROCE of 38.5 percent exceeded
the WACC (weighted average cost of capital) of
8.6 percent several times over. WACC represents
the minimum return on equity and debt contri-
buted to the Company by investors. The year-on-
year decline is due primarily to the fact that the
2001 value was affected by high cash reserves of
€752.2 million excluding restricted bank balances
(at 31 December 2001).
Return on Capital Employed (ROCE)
1) Average values for the year
Dividend
The dividend is distributed from the unappropri-
ated surplus of Deutsche Börse AG, which rose
by 19 percent year-on-year to €138.2 million
in 2002 (2001: €116.6 million). A proposal
will be put to the Annual General Meeting to pay
a dividend of €0.44 (2001: €0.36) per no-par
value share for 2002, a 22 percent increase as
against the previous year. For 111,802,880 issued
shares carrying dividend rights for 2002, this
produces a total distribution of €49.2 million.
Sharp rise in operating cash flow
Deutsche Börse AG generated cash flows from
operating activities of €466.2 million in 2002
(2001: €248.8 million). In addition to the 15
percent increase in consolidated net profit, the
complete acquisition of Clearstream International
S.A., whose earnings have been consolidated
since the second half of the year, made a partic-
ular contribution to this increase. In the first six
months of the year, when Clearstream’s earnings
were not consolidated, only the dividend pay-
ment to Deutsche Börse AG from the 50 percent
interest reported in the Clearstream segment
affected Group cash flow. Cash flows from
operating activities in H1 were €180.1 million.
Following the consolidation of Clearstream’s
earnings, cash flows from operating activities
in H2 were €286.1 million, an increase of
59 percent.
GROUP MANAGEMENT REPORT118
EBIT 351.2 278.1
+ Goodwill depreciation/write-downs 68.7 0.2
= EBITA 419.9 278.3
Intangible assets, property, plant and equipment 1) 1,008.7 267.6
+ Equity investments 1) 245.6 366.3
+ Cumulative goodwill amortization/write-downs 1) 24.8 0
+ Trade receivables and other non-interest-bearing current assets 1) 204.1 175.3
– Non-interest-bearing provisions 1) 207.5 135.9
– Non-interest-bearing liabilities 1) 184.5 120.8
= Capital employed 1,091.3 552.5
ROCE: EBITA / Capital employed 38.5% 50.3%
2002 2001
€m €m

Investing activities resulted in cash payments
of €1,734.1 million, of which €1,515.0 million
was attributable to the net acquisition cost
(purchase price of €1,758.6 million less cash
and cash equivalents acquired of €243.6 million)
for Cedel International S.A. (including its 50 per-
cent interest in Clearstream International S.A.).
Investments were funded in part by cash generat-
ed from financing activities amounting to €555.6
million. These cash receipts resulted from the
placement of shares in the amount of €390.8
million following the capital increase, and from
a commercial paper program. Investments were
also funded from cash resources. These amounted
to around €1,062 million at 1 January 2002 and
were generated largely by the placement of shares
at the time of the IPO on 5 February 2001.
Cash flow statement (condensed)
Cash and cash equivalents amounted to €104.8
million at the end of 2002. Group liquidity is
assured by strong cash flows from operating
activities and the existing commercial paper
program, whose refinancing is also secured by
a backup facility.
Deutsche Börse AG’s noncurrent assets amount-
ed to €2,656.4 million at 31 December 2002.
Shareholders’ equity at the same date amounted
to €2,152.2 million, plus debt from the commer-
cial paper program at €288.1 million. Deutsche
Börse AG has a €400 million credit facility to
refinance the current commercial paper program,
if required. It also allows us to borrow additional
funds if required. This credit facility was made
available by a banking syndicate and gives us
access to a sufficient level of debt.
The following ratios illustrate Deutsche Börse
AG’s healthy financial position:
Financial indicators
Since 2001, Deutsche Börse AG has commis-
sioned the rating agencies Standard & Poor ’s and
Moody’s to rate its creditworthiness. Moody’s has
awarded Deutsche Börse AG a long-term rating of
Aa1, and Standard & Poor ’s has given a rating of
AA+. These exceptional good ratings underscore
the high financial strength of Deutsche Börse AG.
As in the previous year, Deutsche Börse AG re-
ceived no government grants or other assistance
in 2002.
GROUP MANAGEMENT REPORT 119
2002 2001
% %
2002 2001
€m €m
Cashflow from operating activities 466.2 248.8
Cashflow frominvesting activities –1,734.1 –160.3
Cashflow from financing activities 555.6 921.0
Cash and cash equivalents at 31 Dec. 2002 104.8 1,062.0
Equity/net tangible assets 7.9 37.1
Equity ratio 1 42.0 203.0
Equity ratio 2 61.0 220.0
Debt/equity ratio 22.0 14.0
Cash ratio 36.8 372.4
Current ratio 72.0 430.2
Debt coverage 67.0 101.0

Deutsche Börse shares
As in 2001, Deutsche Börse shares substantially
outperformed the German equity market in 2002,
beating the DAX by 32 percent and the MDAX®
by 18 percent. This put Deutsche Börse firmly
in the top tier of German blue chips. However,
its share price also fell by 12 percent over the
course of the year, closing 2002 at a price of
€38.16 (2001 year-end close: €43.21). The
high for the year was recorded on 12 March at
€51.50, and the low on 1 October at €32.40
(Xetra closing prices). The relative price perfor-
mance shows that Deutsche Börse shares per-
formed well in a weak market environment.
In June 2002, Deutsche Börse implemented a
capital increase, authorized by the Annual Gene-
ral Meeting, to fund the acquisition of Cedel
International S.A. and its 50 percent share at
Clearstream International S.A. and placed just over
9 million new shares on the capital market. In
a difficult market environment, the offering met
substantial interest from institutional investors
and was three times oversubscribed. This capital
increase and the placement proceeds of around
€390 million enabled Deutsche Börse to main-
tain its high financial flexibility.
Deutsche Börse was included in the DAX equity
index effective 23 December. Deutsche Börse
met the inclusion criteria in the market capitali-
zation (€4.3 billion at 31 December 2002) and
trading volume categories. The shareholder struc-
ture has also changed successively. Originally,
it was mostly strategic, especially German, inves-
tors who were invested in the shares, but interest
from international, mainly institutional, investors
has grown steadily since the IPO. These latter
investors now hold 53 percent of Deutsche Börse
shares.
Broad-based product and systems development
In its core business, Deutsche Börse AG develops
infrastructure services for the capital markets and
operates the technical systems needed to do this.
Expanding the product portfolio and continuously
developing the trading and settlement systems
are critical success factors. Research and devel-
opment spend is targeted mostly on developing
new products, with research only taking a minor
share. Product innovations mainly demand modifi-
cations to existing IT systems, or the development
of new ones, so product development and invest-
ment in software are closely linked.
Deutsche Börse invested €151.0 million in 2002
(2001: €106.9 million) in product and systems
development. Under the IFRSs/IASs, the share of
costs directly attributable to internal development
of new software is capitalized and normally amor-
tized over five years. €110.1 million of development
costs was capitalized in 2002 (2001: €62.6
million). The Information Technology segment
incurred pure research costs of €6.2 million
(2001: €17.7 million) that do not relate to the
development of specific products and are not
capitalized.
GROUP MANAGEMENT REPORT120

Development costs and own expenses capitalized per segment
Product development is not centralized but is
implemented throughout the company. In the
case of critical or substantial new or further
developments, the individual measures are
combined to form cross-segment projects under
uniform management and supervision.
The trading systems were again developed fur-
ther in the Xetra and Eurex trading segments
in 2002. The Xetra segment saw two significant
innovations: with Xetra BEST®, Xetra received
an additional service that allows intermediaries
to execute matching buy and sell orders of their
customers internally, but without dispensing with
execution in a regulated market. The expenses
for Xetra BEST are contained in the Xetra soft-
ware development costs of €17.4 million. The
functions of Eurex software were also developed
further at a cost of €28.2 million, including
investments in the Eurex Bonds trading system.
The most significant development project was the
development of the Central Counterparty (CCP)
for the cash market. The development costs of
€40.4 million were allocated to the Xetra seg-
ment. There had already been preliminary work
on this project in 2001 and 2000, which was
mostly allocated to the Eurex segment.
GROUP MANAGEMENT REPORT 121
Xetra software 17.4 16.7 12.1 11.6
Central Counterparty 40.4 4.3 24.4 0
Common Internet Access 0 2.3 0 0
Xetra 57.8 23.3 36.5 11.6
Eurex software 28.2 36.7 22.5 27.2
Integrated Clearer 10.3 21.6 3.3 11.6
Eurex 38.5 58.3 25.8 38.8
Consolidated Exchange Feed 6.2 9.6 5.8 5.6
Xebos/Fixed Income Benchmark 1.6 2.2 1.5 2.2
Index-Engine releases 1.1 1.8 0.9 1.6
Internet and Xetra Live 0 1.8 0 1.1
StatistiX 3.0 3.5 0 0
Consolidation Engine 0.4 2.3 0 0
Information Products 12.3 21.2 8.2 10.5
Components business 0.3 0 0.3 0
Xentric 3.9 2.1 1.1 0.7
Integriertes Aktienbuch1) 2.0 0 1.0
Information Technology 4.2 4.1 1.4 1.7
Connectivity 13.1 – 13.1 –
Customer Focus 8.1 – 8.1 –
Custody 4.7 – 4.7 –
Creation 24 7.3 – 7.3 –
Daytime Bridge 0.5 – 0.5 –
NCB Link 2.2 – 2.2 –
Other 2.3 – 2.3 –
Clearstream 38.2 – 38.2 –
Total 151.0 106.9 110.1 62.6
1) Integrated Share Register
Development thereof: own costs expenses caitalized
2002 2001 2002 2001
€m €m €m €m

Overall, Deutsche Börse Group invested €199.7
million (2001: €107.9 million) in 2002, for an
85 percent increase over the previous year. The
sharp increase is due largely to the first-time
consolidation of Clearstream International S.A. In
addition, investments in the Corporate Services
segment grew to €66.0 million, primarily to
equip the new Clearstream headquarters in
Luxembourg.
Investments by segment
Employees
The number of employees in Deutsche Börse Group
rose sharply in 2002. Deutsche Börse Group had
3,318 employees at 31 December 2002, 2,195
more than a year before. This strong increase is
due largely to the first-time consolidation of Clear-
stream, entory and Infobolsa, whose employees
(Clearstream: 1,738, entory: 336, Infobolsa: 74)
were not contained in the prior-year figure. How-
ever, the orientation on information technology
was maintained: following the consolidation of
these companies, 43 percent of all employees work
in IT. 44 percent of the employees now work
outside Germany.
Employees by segment
1) Excluding entory
Human resources management is strategically
important for Deutsche Börse AG, because its
critical innovative strength as a capital market
services provider depends solely on the employ-
ees and the level of their qualification. Good
advanced training and continuing professional
development opportunities, a high level of job
security and a chance to work in a successful
company give us an image as an employer that
enables Deutsche Börse Group to recruit highly
qualified staff worldwide.
GROUP MANAGEMENT REPORT122
Xetra 179 194 –8
Eurex 142 116 22
Information Products 161 84 92
Information Technology 1,448 – –
Deutsche Börse Systems 533 536 0
Clearstream TEC 571 n. a. –
entory 336 388 –13
Xlaunch 8 8 0
Corporate Services 449 185 143
Clearstream 939 n. a. –
Total 3,318 1,123 1) 195
2002 2001 Change
%
Xetra 38.5 28.5
Eurex 26.0 39.5
Information Products 8.4 14.7
Information Technology 21.3 19.7
Clearstream 39.5 n. a.
Corporate Services 66.0 5.5
Total 199.7 107.9
2002 2001
€m €m

Utilization of net value added in 2002
Employees(staff costs)
39%
Company(additions to reserves)
30 %
22 %
Government(taxes)
6 %
Shareholders (dividend)
3%
Lenders (interest)
The outcome is a young, highly qualified team:
68 percent of employees are graduates, and the
average age last year was 36. Most of the gradu-
ate employees have degrees in business studies,
law, IT or physics. The fluctuation rate in 2002
was 8.7 percent.
Deutsche Börse Group offers a highly attractive
compensation package and above-average bene-
fits. An integrated human resources system will
make compensation even more transparent start-
ing in 2003. In addition, starting this year, the
compensation of all employees will be even more
heavily linked to individual performance and the
achievement of corporate targets. Among other
things, this will see the introduction of an
employee stock option plan.
The acquisition of Clearstream has brought
Deutsche Börse a network of international re-
presentative offices in which a growing number
of employees are available on-site for the global
customer base.
Deutsche Börse Group places great emphasis on
the thorough continuing professional develop-
ment of its employees. More than 270 seminars
were held in 2002 on such diverse topics as
software training, foreign languages, interper-
sonal competence and stock-exchange know-
how. Starting in 2003, an internal professional
development program will be available on the
intranet via the electronic “Staff Training Portal”.
Promoting management development is another
key concern of Deutsche Börse Group. 80 per-
cent of management positions are recruited inter-
nally. Promising young managers are selectively
trained in a fast-track “High Potentials” program.
In 2003, Deutsche Börse Group will again use
targeted recruitment measures to attract qualified
employees, in particular for customer relationship
development.
Net value added
GROUP MANAGEMENT REPORT 123
Employees (staff cost) 245.3 112.0
thereof: salaries 209.0 94.4
social security contributions 36.3 17.6
Lenders (interest) 18.1 7.3
Government (taxes) 141.2 116.2
Deutsche Börse shareholders(dividend) 37.0 30.8
Company (additions to reserves) 188.1 154.7
Total 629.7 421.0
2002 2001
€m €m

End-to-end environmental protection
Caring for the environment and its natural re-
sources has always been a core component of
Deutsche Börse Group’s activities. Its business
operations – developing, building and operating
electronic systems and networks – do not entail
any direct environmental risk. All environmental
protection measures therefore relate to the infra-
structure of its office buildings in Frankfurt,
Ettlingen and Luxembourg, and to the selection
and monitoring of suppliers.
The Frankfurt headquarters of Deutsche Börse AG
that opened in 2000, as well as entory AG’s new
head office (opened in early 2003) and the head
office of the Luxembourg subsidiary Clearstream
International S.A., that is currently under construc-
tion, were all designed to take advantage of state-
of-the-art energy saving concepts. Environmental
protection also plays a role in day-to-day opera-
tions, in particular through consistent waste sepa-
ration and the specific selection and monitoring of
supply and disposal companies. Deutsche Börse
Group chooses office materials on the basis of
their suitability for recycling and re-use in return
systems.
Diverse social and cultural commitment
Deutsche Börse Group is aware of its responsibil-
ity to its employees and its locations. It commu-
nicates its corporate values and culture to the
outside world through its involvement in the areas
of arts/culture and education/training.
The occasion of the move into the new “Neue
Börse” head office in Frankfurt-Hausen in 2000
was used to start building up a collection of con-
temporary photography. The works are accessible
to all employees and visitors as a permanent
exhibition. For the new buildings in Ettlingen
(entory AG) and Luxembourg (Clearstream
International S.A.), Deutsche Börse Group will
extend its art collection as part of this concept.
Frankfurt as a city of culture is promoted by
supporting individual museums and galleries (the
Städel and Schirn art galleries, the Museum of
Modern Art) and their projects. The employees
benefit from these alliances in the form of free
special guided tours and reduced tickets to the
museums and galleries supported.
Deutsche Börse Group also supports top-ranking
academic institutions such as Duke University or
the European Business School. The main focus
of its charitable donations is on education for
children and youths.
Deutsche Börse Group takes its responsibility as
an expert partner, adviser and opinion leader very
seriously. It promotes national and international
frameworks that ensure investor protection and
competition through maximum transparency and
fairness. That is why experts from the Group are
involved as advisers in the development of stan-
dards, laws and directives for stock exchanges
and capital markets. Examples of this are the parti-
cipation in the German Government Commission
on Corporate Governance or the support for the
Committee of Stock Exchange Experts.
GROUP MANAGEMENT REPORT124

Risk report
Deutsche Börse reports on operating environment
risks, industry and information technology risk,
as well as financial and other risks. A risk mana-
gement function has been established for this
purpose.
Operating environment risks, industry risks
(a) General risks
Deutsche Börse currently operates systems for
17 cash and derivatives markets. Its commercial
success is thus contingent upon the development
of activities on the capital markets. In the Xetra,
Eurex and Clearstream segments, sales revenues
are directly linked to activity on the capital mar-
kets, while the sales revenues of the Information
Products and Information Technology segments
are indirectly linked. Trading and settlement-relat-
ed revenue in these segments may also decline if
liquidity migrates to other financial marketplaces,
or if a prolonged bear market results in a sharp
downturn in trading.
Market structures and their business environment
are also constrained by the regulatory environ-
ment, changes which may adversely affect the
business, financial and earnings position of
Deutsche Börse Group. Any legal or tax changes
may effect the behavior of participants and thus
its financial position and results of operations.
This indirect impact means that Deutsche Börse
Group cannot quantify the effects of individual
scenarios.
(b) Risk of loss of institutional liquidity
Deutsche Börse Group’s core business involves
the operation of highly liquid markets, primarily
for the institutional trading of standardized in-
vestment instruments. From the perspective of
an investor issuing trading orders, these trading
platforms offer the particular advantage of low
transaction costs. The difference between bid
and ask prices (the spread), which accounts for
the bulk of actual trading costs, is very low
because of the high – mostly institutional – liquid-
ity on all the systems. Price discovery is also
highly transparent, particularly for investors: auto-
matic order execution in an open order book,
meaning that it is visible to all parties. Because
of the crucial unique selling points from the per-
spective of the market – neutrality, i. e. indepen-
dence from individual intermediaries, and efficient,
transparent price discovery in Deutsche Börse
Group’s trading systems – the risk that significant
institutional liquidity will be lost is very low.
(c) Product innovation risk
The launch of new products is always accompa-
nied by the risk that they will be rejected by
customers. If this risk were to materialize, it would
reduce projected revenues and require the invest-
ments made, which may be considerable, to be
written down or off. At present, these compre-
hensive new products include the introduction
of the Central Counterparty for equities, and the
possible move into the US derivatives market.
To reduce the market risk from these expansion
projects, all activities are implemented only after
comprehensive consultation and agreement with
the market participants, i. e. the subsequent
customers.
GROUP MANAGEMENT REPORT 125

Information technology risks
Information technology risks arise from the oper-
ation of Deutsche Börse Group’s computer-based
markets, and from the operation of applications
for customers by the IT segment.
Both Eurex, the world’s largest derivatives ex-
change, and Xetra, the cash market system via
which, among other things, over 96 percent of
DAX equity trading volumes are executed, are
fully computerized. The other exchanges operated
by Deutsche Börse Systems AG (CBOT, Vienna
Stock Exchange, Helsinki Exchanges, Irish Stock
Exchange, etc.), ECNs (Eurex Bonds, Eurex Repo)
and the clearing and settlement systems of Clear-
stream Banking AG, Frankfurt, and Clearstream
Banking S.A., Luxembourg, are computerized.
This requires analysis of the information technol-
ogy risks – i. e. the availability risk, integrity risk
and confidentiality risk. These risks could give
rise to obligations to pay compensation, as well
as revenue shortfalls.
In addition to these direct adverse effects, system
problems may also have indirect effects in the
form of loss of reputation and the resulting loss
of customers and their business.
(a) Availability risk
Availability risk arises because the systems re-
quired for smooth operations must be continuously
available. However, this availability may be im-
paired by hardware failure, operator errors or the
physical destruction of the data centre facilities.
The overall systems availability of Deutsche Börse
Group’s host systems was again over 99.9 percent
in 2002, and thus complied with the high stan-
dards specified for security and reliability. Certain
systems even achieved an availability of 99.99
percent.
Deutsche Börse Systems AG and Clearstream
Services S.A., the systems providers of Deutsche
Börse Group, protect themselves from availability
risk through the redundant design of all their
systems.
(b) Integrity risk
The risk of processing errors, data loss or data
storage errors due to software errors (integrity
risk) did not result in major interruptions in
market trading or settlement processes for par-
ticipants in 2002. The impact of software errors
is minimized by comprehensive testing and
simulations in the run-up to each release, as
well as by 24x7 availability of IT specialists.
GROUP MANAGEMENT REPORT126

(c) Confidentiality risk
Confidentiality risk incorporates the risk of data
interception and penetration of the systems envi-
ronment of Deutsche Börse Systems AG and Clear-
stream Services S.A. Deutsche Börse Group uses
a special network, firewall and authentication
architecture to thwart potential attempts to obtain
unauthorized access to the data in its systems.
For example, access to the Xetra and Eurex trad-
ing systems via the Internet is controlled by a
state-of-the-art smartcard-based architecture for
logon, encryption and digital security. Deutsche
Börse Systems AG and Clearstream Services S.A.
also invest permanently and heavily to ring-fence
their network and systems: for instance, the
systems are examined regularly for weak points
by specialist external agencies.
Financial risks
(a) Funding risks
Deutsche Börse Group has a low debt/equity
ratio. Because its debt is covered by a commer-
cial paper program, the funding risk is low.
(b) Credit risks
Investing cash and cash equivalents entails a
risk that a debtor will not repay the funds made
available to it. Deutsche Börse Group’s debtors
are prime-rated banks (direct), governments,
and public- and private-sector enterprises (indirect
in the case of investments via mutual funds).
As an ICSD, Clearstream International provides
short-term credit facilities to its customers to
maximize settlement efficiency. The exposure
per counterparty and per country is monitored
centrally by the Credit Group in Luxembourg.
Most lending activities are secured by collateral
and are legally based in Luxembourg, where the
legal framework is favorable to secured lenders.
Clearstream has never experienced any credit
losses since its establishment.
GROUP MANAGEMENT REPORT 127
(c) Liquidity risks
Sufficient liquidity must be available at all times
to meet Deutsche Börse Group’s payment obliga-
tions. Clearstream Banking S.A. and Eurex Clearing
AG bear the most important liquidity risks in
Deutsche Börse Group. Clearstream Banking S.A.,
a subsidiary of Clearstream International S.A. that
focuses on the treasury business, faces the largest
liquidity risk and has an average monthly liquidity
ratio in excess of 70 percent. To reduce the liquid-
ity risk, Clearstream Banking S.A. has established
a revolving credit facility of US$1 billion that
has never been used. Clearstream Banking S.A.
also benefits from uncommitted short-term inter-
bank lines that amount to €16.3 billion and are
regularly used to ensure their availability.
Eurex Clearing faces liquidity risk as the cash
deposits by clearing members (the variation mar-
gins for settling daily transactions) and the pre-
mium payments, which may be as much as
several hundred million euros, are due at sight.
Such variation margins are held on overnight
deposit at a number of banks of very high finan-
cial credit quality. The business operations of
Group companies result in timing and monetary
differences, especially on an intra-month basis.
(d) Risk from operating a central counterparty
in the Eurex derivatives market
Material risks may arise from Eurex Clearing AG’s
function as the central counterparty for all trades
executed on Eurex. Counterparty risk denotes the
risk that one of the two parties involved in a trans-
action will default. However, Eurex Clearing’s
counterparties are exclusively Eurex market par-
ticipants who are also approved clearing members.
The risk that one of these clearing members will
default is covered by the margins deposited by
clearing members in the form of cash or securi-
ties. These margins ensure that all positions of
a defaulting clearing member will be closed out
on the following market day, assuming the 99
percent worst-case movement in prices. If these
margins were to prove insufficient in the event
that a counterparty defaults, Eurex Clearing AG
could have recourse to the clearing fund estab-
lished for this purpose, to the reserves of Eurex
Clearing AG earmarked for such cases, to equity,
and, finally, to the comfort letters issued by
Deutsche Börse AG and SWX Swiss Exchange.
Simulations have established that even in an
exceptional crisis, these collateral systems would
be sufficient to assume in full the obligations
from trading activities.
On 17 May 2002, the first Eurex Clearing mem-
ber defaulted. Thanks to the above-mentioned
security measures, Eurex Clearing did not suffer
losses on the elimination of open derivative posi-
tions. The margins deposited by the market par-
ticipant were sufficient to cover all open positions.
The clearing fund, as the next “line of defense”,
thus remained unaffected.
GROUP MANAGEMENT REPORT128

Other risks
(a) Risks from participant support
and market supervision
Although the trading and settlement processes
are automated as far as possible and come close
to the ideal of straight-through processing, man-
ual intervention in market and system manage-
ment is necessary in special cases. These rare
occasions entail a risk of errors and omissions
and can consequently lead to claims by affected
customers.
(b) Dependence on key accounts
Deutsche Börse Group provides its services to
around 3,000 customers overall. In the Xetra
and Eurex segments, a substantial proportion of
trading volumes is accounted for by a few key
accounts. Clearstream has over 2,000 customers,
and its key accounts differ from those of Eurex
and Xetra. This leads to diversification and thus
to a reduction in dependencies. However, the
Group would expect to suffer revenue shortfalls
if these key accounts were to default, with a
consequent loss of business.
(c) Litigation risks
Due to the nature of its business, Deutsche Börse
Group is involved in litigation and arbitration
proceedings in Germany arising in the ordinary
course of business. While it is not feasible to
predict or determine the ultimate outcome of all
pending or threatened legal proceedings, the
Group does not believe that the outcome of these
proceedings will have a material adverse affect
on the Group’s financial condition or results
of operations. The total number of proceedings
as well as the amounts in dispute do not entail
significant risks.
Risk management
General risk management
In line with the risk classification, risk manage-
ment at Deutsche Börse Group is broken down
into strategic competition and regulatory risks,
project risks and operating risks.
At weekly meetings with internal and external
experts, the Executive Board is kept informed
about the development of core competition risk
indicators on the basis of business developments.
Organizational units that liaise with the bodies
involved in the legislative process identify and
report at an early stage on potential regulatory
risks.
The Executive Board is also kept informed on a
weekly basis and in meetings of the project steer-
ing committees about the project risks resulting
from Deutsche Börse Group’s strategic projects.
The operating risk is measured, analysed and
reported regularly or on an ad-hoc basis to the
Executive Board by the central Group Risk
Management. This process ensures that the
managers responsible are continuously and com-
prehensively informed about the risk position.
Risk assessments track the business process and
indicate where risks arise. In the risk analysis
phase, scenarios and process analysis are used
to determine the probability and impact of the
associated risk. Moreover, a Group-wide value-at-
risk model provides quantitative evaluation of
risks, established mitigation measures such as
insurances, and the possible impact on profit-
ability. Early-warning indicators are developed and
established in the course of risk identification.
GROUP MANAGEMENT REPORT 129

A database is used to produce statistical reports
and to provide near-real time identification of
both direct increases in risk and medium- to long-
term trends. If such a development is identified,
the process manager immediately initiates risk
control measures.
Eurex Clearing AG initially limits the risk of default
by a counterparty that arises from its function as
central counterparty by ensuring that only institu-
tions with substantial liable capital are admitted
as clearing participants.
The risk borne by Eurex Clearing AG is further
reduced by the fact that clearing members who
are liable for the performance of trades executed
via them on Eurex are subject to margin calls.
Eurex Clearing recalculates the margins to be
provided by the participants to the trades exe-
cuted during the course of the day in near-real
time, and can thus reduce its residual risk.
Eurex Clearing AG can calculate margins every
fifteen minutes. The advantage of this is that
the level of any potential shortfall in the cover of
counterparty risk can be continuously established
and eliminated, if required, by intraday margin
calls and the margin provisions. If this collateral
should prove insufficient in the case of the insol-
vency of a participant, Eurex Clearing can also call
on a clearing fund established for this purpose.
Deutsche Börse’s own funds are invested in euros,
US dollars and Swiss francs. These investments
are mostly in money market instruments with
counterparties of very high credit quality (at least
investment grade) and AA rated bonds. The prin-
cipal money market instruments used comprise
term money deposits with prime-rated banks
protected by German deposit insurance funds or
third-party bank guarantees. The systematic use
of market information systems and the analysis
of the Clearstream credit department enables
Deutsche Börse Group to take countermeasures
at an early stage if risks arise.
The company’s liquidity is projected on a monthly
basis for the current and the following year.
This in turn determines the maturity structure
of cash investments. In the event of liquidity
crises, term deposit investments may be liquidated
(against payment of early repayment interest
penalties). In addition, Deutsche Börse AG has
a €400 million loan facility from a syndicate
of banks, which serves as a backup liquidity
facility in case the Group is unable to raise short
term funding in the commercial paper market.
Eurex Clearing AG has intraday credit facilities
amounting to €700 million, and an overnight
line of credit amounting to €350 million is
maintained at banks. These are earmarked
specifically to hedge the liquidity risks from the
management of Eurex Clearing AG’s accounts
used to settle the activities of Eurex Frankfurt
AG, Eurex Bonds GmbH and Eurex Repo GmbH
handled by Eurex Clearing AG.
GROUP MANAGEMENT REPORT130

Clearstream International
Clearstream International’s risk management
procedures, particularly as they relate to bank-
ing operations, are detailed below.
Risk measurement and monitoring
Clearstream International measures and monitors
the level of risk arising throughout its activities;
the risk management process of the company
currently classifies risk into these major cate-
gories: market and liquidity risk, credit risk and
compliance risk.
Risk governance
While the overall responsibility for the setting
and monitoring of risk policy remains with the
executive management of Clearstream Interna-
tional, each risk segment is delegated to sub-
committees of the executive management of
Clearstream International as follows:
(a) Market and liquidity risk: Assets
and Liabilities Committee (“ALCO”)
The ALCO is responsible for the enforcement
of risk policy in the area of market and liquidity
risk and includes representatives of the banking
business, treasury, finance, operations, customer
relations and risk management departments. It
meets monthly.
Clearstream International’s 2002 month-end aver-
age capital adequacy ratio (closely linked to the
size of the balance sheet) is close to 50 percent
– well above the internal target of 15 percent and
the minimum regulatory requirement of 8 percent.
Clearstream International’s 2002 average liquid-
ity reached 70 percent, well above the regulatory
requirement of 30 percent.
In accordance with Luxembourg and German law,
Clearstream Banking S.A., Luxembourg, and
Clearstream Banking AG, Frankfurt (“the Banks”),
are required to ensure they have sufficient ‘eligi-
ble’ capital, as defined by applicable regulation,
to cover the credit and the market risks arising
from their activities. Since the Banks do not enter
into trading activities, the ‘simplified’ ratio is
applied.
(b) Credit risk: Internal Credit Group (“ICG”)
The ICG is responsible for the enforcement of
risk policy in the area of credit risk and includes
representatives of the banking business, credit,
operations, customer relations and risk manage-
ment departments. It meets monthly.
The amount of unsecured (uncollateralized)
credit lines was reduced by almost one third in
2002, with an average utilization rate slightly
above 1 percent. Clearstream International kept
its zero credit default record.
GROUP MANAGEMENT REPORT 131

Due to the nature of Clearstream’s business, it
experiences large swings in its short-term liquid
assets. In order to alleviate the associated risks,
Clearstream maintains a substantial surplus of
capital at all times against which the financial
position is reviewed. This process is defined in
accordance with the principles proposed by the
Bank for International Settlements (BIS) in its
draft revision of the Basel Capital Accord.
(c) Compliance risk: Compliance Steering
Committee (“CSC”)
The CSC is responsible for the enforcement of
risk policy in the area of compliance. It includes
representatives of compliance, legal, operations,
customer relationships, credit and risk manage-
ment departments. It meets monthly.
Review of NCCTs (Non-Cooperative Countries and
Territories) and high-risk country transactions
have been continuously performed, and no OTC
market nor suspicious customer transactions
have been detected. Only one account has been
added to the watch list.
No event relating to insider dealing or breach of
data protection has been reported.
Following the acquisition of 100 percent of
Clearstream International, the Group’s risk moni-
toring and reporting will be harmonized in 2003.
New management structure effective 1 January 2003
Deutsche Börse Group’s management structure
changed on 1 January 2003. The Executive Board
was reduced to six members, nine Managing
Directors complement the leadership team. The
aim of this restructuring is to ensure the stronger
functional orientation of the Group, whose man-
agement structure was formerly classified along
formal divisional lines. This aims to integrate the
new subsidiary Clearstream International into the
Group structure, as well as achieve the greater
integration of Xetra, Eurex and Clearing. Strategic
decisions will be made by the Executive Board,
and operating decisions will be made by function-
ally driven, cross-functional committees.
GROUP MANAGEMENT REPORT132

Outlook for 2003
Ambivalent environment for further business growth
Activity on the cash market grew appreciably
in the first few weeks of 2003 compared with
Q4/2002. The derivatives market also started
the new year with very strong growth.
Political risks and the muted prospects for any
economic recovery in the near future suggest
that the environment for the European and global
financial markets will continue to be difficult in
2003. As in 2002, Deutsche Börse AG’s econo-
mic development is contingent on how activity
on the markets develops, and this is something
that is very difficult to predict in any level of de-
tail. However, broadly diversified revenue sources
and a range of linear and stable mid-term trends
allow us to make certain fundamental assump-
tions for future activity developments. For exam-
ple, the trend away from OTC business and to-
wards regulated trading platforms in both the cash
and the derivatives markets continues unabated
in many European markets.
Based on experience at other trading centres from
the introduction of a Central Counterparty (CCP),
which gives buyers and sellers total anonymity
before and after the transaction, Deutsche Börse
Group believes that the launch of the CCP on the
German cash market will further enhance the
attractiveness of exchange trading.
In the Information Technology segment, on the
other hand, the current level of order books and
the low hourly rates in the consulting business
will see a sideways or even declining trend.
The Information Products has plans to move into
the terminal business this year via its Infobolsa
joint venture, which should further reinforce the
pace of growth in this segment.
By contrast, stable growth in Clearstream’s settle-
ment and custody business is expected, driven
primarily by growth in the eurobond segment
because of the low short-term interest rates ex-
pected in the near to mid-term. Another factor
will be the decline in settlement transactions
from the launch of the CCP and the expected
netting efficiency. Management factored this
estimate into the valuation of Clearstream at the
time of the acquisition of the outstanding shares
in early 2002, and reiterates this opinion in view
of actual market developments.
GROUP MANAGEMENT REPORT 133

Stable growth through diversification
Deutsche Börse AG expects to be able to achieve
its ambitious growth targets in 2003. Given the
market conditions outlined above, revenue growth
is expected to continue in the mid-term target
corridor of between 10 and 15 percent in the
core Group – excluding the newly added subgroups
Clearstream and entory. In view of the more modest
revenue growth at Clearstream and entory, this
produces overall revenue growth of an expected
5 to 8 percent. However, the ongoing cost-cutting
programs at Clearstream and entory, the cost
synergies expected in 2003 from the integration
of settlement and custody services, coupled with
the economies of scale generated by the business
model, should enable us to maintain earnings
growth at Group level in the order of 15 to 20
percent.
Employees
Due to normal fluctuation rates, the number of
employees in the Group is likely to drop slightly
in 2003.
Investment and financing
It is expected that planned capital projects in 2003
will be financed from Group cash flow while exist-
ing indebtedness may be refinanced on a longer
term basis. The main focus of capital spending in
the first quarter will be on introducing the Central
Counterparty for the cash market in the Xetra
segment, and in the rest of the year, on invest-
ments needed for Eurex’s market entry in the USA.
GROUP MANAGEMENT REPORT134

CONSOLIDATED INCOME STATEMENT 135
Consolidated Income Statement for the period 1 January to 31 December 2002
Sales revenue 6 1,106.5 760.3
Net interest income from banking business 7 64.4 0
Own expenses capitalized 8 110.1 62.6
Other operating income 9 70.6 77.3
1,351.6 900.2
Fee and commission expenses from banking business –66.3 0
Staff costs 10 –245.3 –112.0
Depreciation and amortization expense 11 –223.6 –83.3
Other operating expenses 12 –500.0 –471.6
Income from equity investments 13 41.0 58.0
Write-downs of noncurrent financial assets 14 –6.2 –13.2
Earnings before interest and taxes (EBIT) 351.2 278.1
Net financial income 15 23.2 41.1
Profit before tax from ordinary activities (EBT) 374.4 319.2
Income tax expense 16 –141.2 –116.2
Minority interests 1.9 0.7
Net profit for the period and DVFA/SG earnings 44 235.1 203.7
DVFA/SG earnings per share (€) 44 2.18 2.04
Note 2002 2001€m €m

CONSOLIDATED BALANCE SHEET136
Consolidated Balance Sheetas at 31 December 2002
NONCURRENT ASSETS
Intangible assets
Software 337.4 207.7
Goodwill 1,248.6 51.3
Payments on account 110.4 0.8
1,696.4 259.8
Property, plant and equipment
Land and buildings 27.7 0
Leasehold improvements 20.4 15.2
Computer hardware, operating and office equipment 80.2 41.7
Payments on account and construction in progress 192.6 0.4
320.9 57.3
Noncurrent financial assets
Investments in subsidiaries 0 1.2
Investments in associates 10.3 382.8
Other equity investments 12.8 2.5
Noncurrent receivables and securities from banking business 335.8 0
Other noncurrent financial instruments 8.1 32.1
Other long-term loans 261.4 1.5
Investment property 10.7 0
639.1 420.1
Total noncurrent assets (excl. miscellaneous and deferred tax assets) 17 2,656.4 737.2
Miscellaneous and deferred tax assets
Deferred tax assets 18 13.2 11.2
Other noncurrent assets 8.8 6.3
22.0 17.5
Total noncurrent assets 2,678.4 754.7
CURRENT ASSETS
Receivables and other assets
Current receivables and securities from banking business 19 3,085.0 6.9
Trade receivables 20 139.3 112.7
Intragroup receivables 0 0.8
Associate receivables 2.3 2.2
Receivables from other investors 4.3 2.9
Other current assets 21 83.1 35.1
3,314.0 160.6
Current financial instruments 0 302.9
Restricted bank balances 22 303.7 164.7
Other cash and bank balances 23 248.1 752.2
Total current assets 3,865.8 1,380.4
Total assets 6,544.2 2,135.1
ASSETS Note 2002 2001€m €m

CONSOLIDATED BALANCE SHEET 137
SHAREHOLDERS’ EQUITY 24
Subscribed capital 111.8 102.8
Share premium 1,330.2 945.5
Legal reserve 0.4 0.3
Other retained earnings 630.8 446.0
Revaluation surplus 9.0 5.7
Unappropriated surplus 70.0 60.0
2,152.2 1,560.3
Minority interests 26 23.1 10.6
PROVISIONS AND LIABILITIES
Noncurrent provisions 27
Provisions for pensions and other employee benefits 28 64.5 31.2
Deferred tax liabilities 29 99.3 47.6
Other noncurrent provisions 30 37.9 26.3
201.7 105.1
Current provisions 27
Tax provisions 31 124.1 26.9
Other current provisions 32 28.6 25.4
152.7 52.3
Noncurrent liabilities 33
Interest-bearing liabilities 9.2 0
Other noncurrent liabilities 8.3 11.1
17.5 11.1
Current liabilities 33
Liabilities from banking business 34 3,257.9 0
Cash deposits by Eurex participants 35 217.2 164.7
Other bank loans and overdrafts 0 90.0
Other commercial paper 288.1 0
Trade payables 122.9 70.2
Payables to other investors 6.2 12.6
Other current liabilities 36 104.7 58.2
3,997.0 395.7
Total provisions and liabilities 4,368.9 564.2
Total shareholders’ equity and liabilities 6,544.2 2,135.1
SHAREHOLDERS’ EQUITY AND LIABILITIES Note 2002 2001€m €m

CONSOLIDATED CASH FLOW STATEMENT138
Consolidated Cash Flow Statementfor the period 1 January to 31 December 2002
Net profit for the period excluding minority interests 233.2 203.0
Depreciation and amortization expense 229.8 96.5
Decrease in noncurrent provisions –3.1 –0.7
Deferred tax expense/income 16.4 19.8
Other non-cash income and expense –8.6 –36.0
DVFA/SG cash flow 467.7 282.6
Change in working capital, net of non-cash items:
Decrease in receivables and other assets 80.5 4.7
(Decrease)/increase in current provisions –2.3 13.3
(Decrease)/increase in noncurrent liabilities –16.5 1.5
Decrease in current liabilities –47.1 –21.3
Adjustments for interest and taxes contained in net profit for the period 101.6 55.3
Interest and income received from other noncurrent financial instruments and long-term loans 32.9 48.4
Interest paid –14.3 –7.3
Income tax paid –134.2 –128.9
Net loss on disposal of property, plant and equipment –2.1 0.5
Cash flows from operating activities 40 466.2 248.8
Payments to acquire noncurrent assets –189.2 –113.0
Payments to acquire subsidiaries1) –1,569.0 –41.0
Payments to acquire noncurrent financial instruments –8.0 0
Proceeds from disposal of noncurrent assets 24.5 1.2
Proceeds from net disposals of available-for-sale financial instruments 7.6 0
Cash flows from investing activities 41 –1,734.1 –152.8
Net proceeds from capital increases 390.8 961.8
Net cash received from other shareholders 8.1 0
Dividends paid –37.0 –30.8
Proceeds from short-term financing 286.7 0
Repayment of long-term borrowings –93.0 –10.0
Cash flows from financing activities 42 555.6 921.0
Net change in cash and cash equivalents –712.3 1,017.0
Cash and cash equivalents at beginning of period 1,062.0 45.0
First-time consolidation of current receivables and liabilities from banking business –244.9 0
Cash and cash equivalents at end of period 43 104.8 1,062.0
DVFA/SG earnings per share (€) 4.35 2.83
1) Purchase prices of first-time consolidated subsidiaries net of cash and cash equivalents acquired amounting to €254.2 million (2001: €7.9 million).
Note 2002 2001€m €m

CONSOLIDATED STATEMENT OF CHANGES IN SHAREHOLDERS’ EQUITY 139
Consolidated Statement of Changes in Shareholders’ Equityfor the period 1 January to 31 December 2002
Subscribed capital
Balance as at 1 January 102.8 18.8
Issue of new shares 9.0 7.5
Capital increase from share premium and retained earnings 0 76.5
Balance as at 31 December 111.8 102.8
Share premium
Balance as at 1 January 945.5 44.8
Issue of new shares 388.8 976.1
Cost of capital increases –7.0 –36.8
Deferred taxes on cost of capital increases 2.9 15.1
Capital increase from share premium 0 –53.7
Balance as at 31 December 1,330.2 945.5
Retained earnings
Balance as at 1 January 446.3 306.6
Appropriations from unappropriated surplus (incl. any IAS adjustments) 188.1 154.7
Measurement of interest rate swaps 3.8 –3.8
Adjustments from deferred taxes 0.8 2.4
Change in carrying amount of equity-accounted investments taken directly to equity –2.4 9.0
Change due to purchase of and purchase rights for shares of employees of Clearstream Banking S.A. –4.0 0
Partial spin-off of Integriertes Aktienbuch (Integrated Share Register) –1.4 0
Capital increase from retained earnings 0 –22.8
Other adjustments 0 0.2
Balance as at 31 December 631.2 446.3
Revaluation surplus
Balance as at 1 January 5.7 7.8
Remeasurement of noncurrent financial assets 6.5 –2.1
Deferred taxes on remeasurement of noncurrent financial assets –3.2 0
Balance as at 31 December 9.0 5.7
Unappropriated surplus
Balance as at 1 January 60.0 41.8
Dividends paid –37.0 –30.8
Net profit for the period 235.1 203.7
Appropriation to retained earnings (incl. any IAS adjustments) –188.1 –154.7
Balance as at 31 December 70.0 60.0
Shareholders’ equity as at 31 December 2,152.2 1,560.3
2002 2001€m €m
Net profit for the period, including gains and losses recognized directly in equity, amounted to
€234.6 million (2001: €186.8 million).

NOTES TO THE CONSOLIDATED FINANCIAL STATEMENTS140
Notes to the ConsolidatedFinancial Statements
Basis of preparation
1. General principles
The consolidated financial statements of Deutsche Börse AG, Frankfurt/Main, for the year ended
31 December 2002 were prepared in accordance with the International Financial Reporting Stan-
dards (IFRSs) and International Accounting Standards (IASs) issued by the International Accounting
Standards Board (IASB), and comply with the significant accounting policies of the company as
presented in these Notes.
Deutsche Börse AG’s IFRS/IAS consolidated financial statements for the year ended 31 December
2002 contain the following significant differences in accounting policies and presentation compared
with those used in the previous year:
Balance sheet structureTo enhance the distinction between current and noncurrent items in accordance with IAS 1.53
(Presentation of Financial Statements), receivables and other assets are presented in separate cate-
gories in the balance sheet. To comply with IAS 1.54, receivables and other assets are presented
as current and noncurrent items if it is expected that they will be monetarized within or after a period
of twelve months from the reporting date. The amounts in the prior-year balance sheet as at
31 December 2000 have been restated accordingly.
The balance sheet items affected were restated as follows:
Miscellaneous and deferred tax assets
Other noncurrent assets – 6.3 6.3
Current assets
Other current assets 41.4 –6.3 35.1
Reported in Restatement Comparatives for 20012001 in this report
€m €m €m

NOTES TO THE CONSOLIDATED FINANCIAL STATEMENTS 141
First-time consolidation of Clearstream InternationalCedel International S.A., Cedel’s 50 percent interest in Clearstream International S.A. and its sub-
sidiaries, acquired in July 2002 (see note 2), apply IFRSs/IASs and mainly use the same accounting
policies as the other companies of Deutsche Börse Group. The assets, liabilities, equity and profit or
loss of companies acquired have been fully consolidated since 1 July 2002. The accounting policies
are described in note 4.
The following new headings are presented in the consolidated balance sheet and consolidated
income statement as a result of the acquisitions:
■ Receivables and securities from banking business■ Liabilities from banking business■ Net interest income from banking business■ Fee and commission expenses from banking business■ Investment property
Receivables and securities from banking business comprise term deposits, equities, fixed-rate instru-
ments and derivatives held by Clearstream Banking S.A. and Clearstream Banking AG.
Liabilities from banking business comprise deposits by other banks and amounts owed to other
depositors, commercial paper issued by Clearstream Banking S.A. and derivative financial liabilities.
Net interest income from banking business is recognized in the income statement as it arises on
the basis of the effective yield of the asset or a corresponding variable rate of interest. Net interest
income from banking business also contains the amortization of any premium or discount or other
differences between the initial carrying amount of an interest-bearing instrument and its amount at
maturity calculated using the effective interest method.
Fee and commission expenses from banking business are recognized in the income statement for
settlement services and for securities custody and related services when the expenses are incurred.
Fee and commission income from banking business is contained in sales revenue.
Interest income and expenses from banking business is presented as a net amount because the
corresponding amounts are closely linked. By contrast, fee and commission income and expenses
from banking business are closely separately because the corresponding transactions are not directly
linked. As a rule, the contracting parties from whom fee and commission income is generated are
different to those to whom fee and commission expenses are paid.
Investment property consists of undeveloped land that was not used as at 31 December 2002.

2. Basis of consolidation
Deutsche Börse AG’s interests in subsidiaries, associates and joint ventures as at 31 December 2002
are presented in the following tables:
NOTES TO THE CONSOLIDATED FINANCIAL STATEMENTS142
Fully consolidated subsidiaries as at 31 December 2002
Cedel International S.A. Luxembourg 100.00
Clearstream International S.A. Luxembourg (100.00)
Clearstream Banking S.A. Luxembourg (100.00)
Clearstream Banking AG Germany (100.00)
Clearstream Services S.A. Luxembourg (99.93)
Clearstream Services (UK) Ltd. UK (99.93)
Clearstream Properties S.A. Luxembourg (100.00)
Filinks S.A.S. France (100.00)
Immobilière Espace Kirchberg A S.A. Luxembourg (100.00)
Immobilière Espace Kirchberg C S.A. Luxembourg (100.00)
Immobilière Espace Kirchberg D S.A. Luxembourg (100.00)
Deutsche Börse Systems AG Germany 100.00
Deutsche Börse Systems Inc. USA (100.00)
Deutsche Börse IT Holding GmbH3) Germany 100.00
entory AG Germany (100.00)
entory (UK) Ltd. UK (100.00)
Finnovation GmbH Germany (100.00)
Silverstroke AG Germany (100.00)
atec GmbH Germany (100.00)
entory ventures GmbH Germany (100.00)
projects IT-Projektbörse GmbH Germany (100.00)
Xlaunch AG Germany (100.00)
Xlaunch Erste Verwaltungsgesellschaft mbH Germany (100.00)
Xlaunch Zweite Verwaltungsgesellschaft mbH Germany (100.00)
Eurex Zürich AG Switzerland 49.97
Eurex Frankfurt AG Germany (49.97)
Eurex Beteiligungen AG Switzerland (49.97)
Eurex Clearing AG Germany (49.97)
Eurex Repo GmbH Germany (49.97)
Eurex Bonds GmbH Germany (38.28)
Deutsche Gesellschaft für Wertpapierabwicklung mbH Germany 100.00
DeuBö Vermögensverwaltungs AG Germany 100.00
Fördergesellschaft für Börsen und Finanzmärkte in Mittel- und Osteuropa mbH Germany 100.00
Deutsche Börse Computershare GmbH Germany 51.00
Infobolsa S.A. Spain 50.00
Infobolsa Internet S.A. Spain (50.00)
Difubolsa, Serviços de Difusão e Informaçao de Bolsa S.A. Portugal (50.00)
1) Thousands2) Before profit transfer or loss absorption3) Beta Centaurus Vermögensverwaltungs GmbH was renamed Deutsche Börse IT Holding GmbH on 17 January 2003
Company Domicile Equity interest at31 Dec. 2002
direct (indirect)%

NOTES TO THE CONSOLIDATED FINANCIAL STATEMENTS 143
88,507 2,034,477 2,040,095 0 13,538 1 July 2002
150,000 581,457 797,977 3,491 81,794 1 July 2002
56,056 451,041 3,983,540 402,227 112,319 1 July 2002
25,000 88,176 618,858 208,859 32,620 1 July 2002
30,000 43,883 284,576 5,091 2,652 1 July 2002
GBP 2 10,102 12,785 151 86 1 July 2002
1,700 37,755 101,467 0 189 1 July 2002
4,449 –1,542 1,960 94 –3,187 31 Dec. 2002
73 –92 28,170 0 –16 1 July 2002
54 –72 30,281 0 –15 1 July 2002
52 –72 17,960 0 –16 1 July 2002
2,000 2,415 62,173 339,971 96,6232) 1993
USD1) 400 862 2,055 7,723 356 2000
1,000 59,339 59,352 0 –36,910 30 Nov. 2002
8,000 8,964 22,566 68,819 –4,513 17 Dec. 2001
GBP 1) 50 9 10 176 1,385 17 Dec. 2001
25 25 35 10 102) 17 Dec. 2001
300 788 2,151 3,637 280 17 Dec. 2001
26 82 90 468 2 17 Dec. 2001
462 0 1 0 108 17 Dec. 2001
511 49 54 79 575 17 Dec. 2001
500 4,000 4,370 0 –4,243 2) 2000
25 25 25 0 0 31 Dec. 2002
25 25 25 0 0 31 Dec. 2002
CHF1) 10,000 21,119 36,626 30,474 315 1998
6,000 19,380 33,743 1,076 2,876 1998
CHF1) 100 535 535 0 0 2000
5,113 8,823 232,350 62,648 1,002 2) 1998
50 50 1,299 508 –4,8262) 27 Feb. 2001
3,600 5,900 6,691 3,615 –2,512 1 Nov. 2001
540 556 783 0 6 31 Dec. 2002
50 42 42 0 –8 31 Dec. 2002
256 256 712 0 0 31 Dec. 2002
50 4,830 6,236 2,773 –1,511 1 Oct. 2002
331 9,966 11,994 10,002 1,666 1 Nov. 2002
60 74 164 821 16 1 Nov. 2002
50 43 675 849 2 1 Nov. 2002
Ordinary Equity Total assets Sales revenue Net profit/loss First consolidatedshare capital 2002 2002
€ thousands € thousands € thousands € thousands € thousands
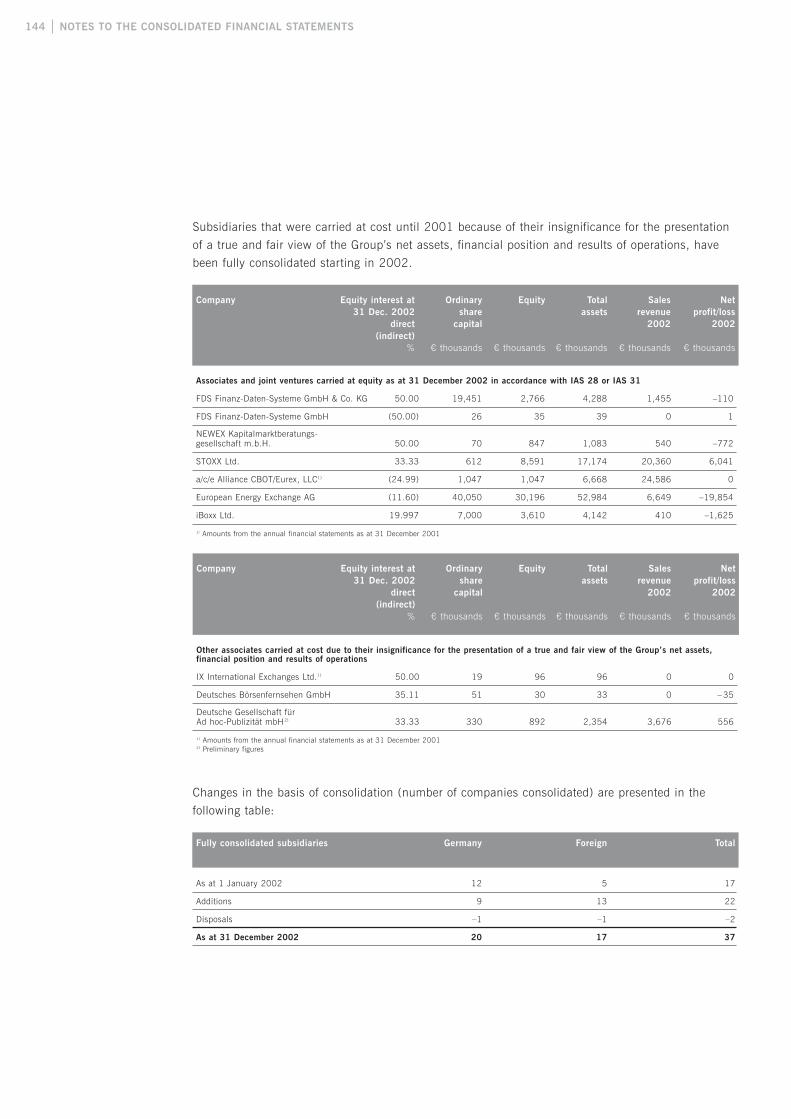
Subsidiaries that were carried at cost until 2001 because of their insignificance for the presentation
of a true and fair view of the Group’s net assets, financial position and results of operations, have
been fully consolidated starting in 2002.
Changes in the basis of consolidation (number of companies consolidated) are presented in the
following table:
NOTES TO THE CONSOLIDATED FINANCIAL STATEMENTS144
Associates and joint ventures carried at equity as at 31 December 2002 in accordance with IAS 28 or IAS 31
FDS Finanz-Daten-Systeme GmbH & Co. KG 50.00 19,451 2,766 4,288 1,455 –110
FDS Finanz-Daten-Systeme GmbH (50.00) 26 35 39 0 1
NEWEX Kapitalmarktberatungs-gesellschaft m.b.H. 50.00 70 847 1,083 540 –772
STOXX Ltd. 33.33 612 8,591 17,174 20,360 6,041
a/c/e Alliance CBOT/Eurex, LLC1) (24.99) 1,047 1,047 6,668 24,586 0
European Energy Exchange AG (11.60) 40,050 30,196 52,984 6,649 –19,854
iBoxx Ltd. 19.997 7,000 3,610 4,142 410 –1,625
1) Amounts from the annual financial statements as at 31 December 2001
Company Equity interest at Ordinary Equity Total Sales Net31 Dec. 2002 share assets revenue profit/loss
direct capital 2002 2002(indirect)
% € thousands € thousands € thousands € thousands € thousands
Other associates carried at cost due to their insignificance for the presentation of a true and fair view of the Group’s net assets,financial position and results of operations
IX International Exchanges Ltd.1) 50.00 19 96 96 0 0
Deutsches Börsenfernsehen GmbH 35.11 51 30 33 0 –35
Deutsche Gesellschaft für Ad hoc-Publizität mbH2) 33.33 330 892 2,354 3,676 556
Company Equity interest at Ordinary Equity Total Sales Net31 Dec. 2002 share assets revenue profit/loss
direct capital 2002 2002(indirect)
% € thousands € thousands € thousands € thousands € thousands
1) Amounts from the annual financial statements as at 31 December 20012) Preliminary figures
As at 1 January 2002 12 5 17
Additions 9 13 22
Disposals –1 –1 –2
As at 31 December 2002 20 17 37
Fully consolidated subsidiaries Germany Foreign Total

Deutsche Börse AG successfully completed the acquisition of Cedel International S.A. and of Cedel’s
50 percent interest in Clearstream International S.A. on 11 July 2002. Deutsche Börse thus now
holds all shares of Cedel International S.A., which it purchased for €1,742.9 million, plus transac-
tion costs of €15.7 million. Cedel International S.A., Clearstream International S.A. and its sub-
sidiaries have been fully consolidated since 1 July 2002. On 30 December 2002, Deutsche Börse
AG contributed its direct 50 percent interest in Clearstream International S.A., less one share, and
Cedel International S.A. now holds 100 percent (less one share) of Clearstream International S.A.
The consolidation of Cedel International S.A., Clearstream International S.A. and its subsidiaries
effective 1 July 2002 materially affects Deutsche Börse Group’s consolidated financial statements.
Receivables and securities, and liabilities from banking business, amount to €3,420.8 million and
€3,257.9 million respectively as at 31 December 2002, and are reported separately in the balance
sheet. The acquisition cost of €1,758.6 million was paid in cash, which resulted in a corresponding
reduction in the Group’s cash reserves. In addition, Deutsche Börse AG issued commercial paper
for the first time in conjunction with this acquisition, which resulted in corresponding liabilities of
€288.1 million as at 31 December 2002. The consolidation produced acquisition-related goodwill
of €1,215.8 million.
The effects on the income statement were also significant in the second half of 2002. The Clearstream
subgroup’s gross fee and commission income (less intercompany revenue) amounted to €277.0 mil-
lion and is contained in consolidated sales revenue, while net interest income from banking business
amounting to €64.4 million was reported separately. Net fee and commission expenses from banking
business totaling €66.3 million were also reported separately. In addition, the costs of the Clear-
stream subgroup were fully consolidated in the corresponding headings in the consolidated financial
statements.
The Clearstream subgroup contributed €100.0 million to Deutsche Börse Group’s EBIT in the sec-
ond half of 2002, as well as goodwill amortization of €30.4 million. In the first half of 2002, the
then 50 percent interest in Clearstream International S.A. was measured at equity, generating income
from equity investments of €39.0 million for Deutsche Börse Group. The total contribution to earn-
ings was thus €108.6 million.
If Cedel International S.A. had not been acquired, the Group would have reported its 50 percent
interest in the after-tax profit of Clearstream International S.A. for the second half of 2002. This
interest would have amounted to around €36.1 million.
During the course of 2002, Deutsche Börse AG increased its interest in entory AG by 48 percent to
100 percent at a cost of €43.6 million, generating goodwill of €33.2 million. Since 1 January 2002,
all income and expenses of the entory subgroup have been fully consolidated in Deutsche Börse
Group’s consolidated income statement. Sales revenue in 2002 amounted to €71.0 million, and the
net loss after taxes was €4.4 million. The entory subgroup’s balance sheet has been fully consolidated
since 31 December 2001.
NOTES TO THE CONSOLIDATED FINANCIAL STATEMENTS 145

To expand its activities in the Information Products segment, Deutsche Börse AG acquired 50 percent
of the Spanish financial information vendor Infobolsa S.A. from Bolsa de Madrid S.A. in November
2002. The purchase price was €20.0 million. This transaction generated goodwill amounting to
€15.2 million. Infobolsa S.A. and its subsidiaries were fully consolidated as at 1 November 2002.
Sales revenue in the final two months of the year amounted to €1.9 million, while the net profit after
taxes was €0.2 million.
In December 2002, Clearstream International S.A. purchased all shares of Filinks S.A.S. for €1.0
million from the French financial services company CDC Ixis Capital Markets S.A., resulting in nega-
tive goodwill of €0.9 million. This negative goodwill will be amortized to income over the average
useful life (five years) of the depreciable assets acquired. The company was fully consolidated as at
31 December 2002.
Deutsche Börse AG’s direct equity interest in Eurex Zürich AG, including the 0.02 percent interest
held by members of its Executive Board, amounts to 49.97 percent. On the basis of the profit partic-
ipation rights granted to Deutsche Börse AG – comprising not only a threefold dividend right, but also
a corresponding share in any liquidation proceeds – its actual beneficial interest in Eurex Zürich AG’s
profit or loss is 79.99 percent. Capital consolidation is based on this figure. After allowance for vot-
ing trust and pooling arrangements, the share of voting rights is 50 percent.
The reporting date of the single-entity financial statements of the companies consolidated is the
same as the reporting date of the consolidated financial statements.
3. Consolidation methods
Capital consolidationCapital consolidation uses the purchase method of accounting by eliminating acquisition costs
against the acquiree’s equity attributable to the parent company at the acquisition date. Consolidation
differences are allocated to the subsidiaries’ balance sheet items at their fair value, and a correspon-
ding item for minority interests is recognized. Any remaining excess of acquisition costs over net
assets acquired is recognized in intangible assets as goodwill and amortized against income over its
expected useful life. Any negative goodwill from first-time consolidation is allocated to reserves or
provisions, depending on its origin. In the event of permanent impairment, any goodwill already
carried as an intangible asset is immediately written down to income.
Other consolidation adjustmentsIntragroup receivables and liabilities are eliminated. Income from intercompany transactions is elimi-
nated against the corresponding expenses during the consolidation of income and expense. Inter-
company profits or losses from deliveries of intragroup goods and services are eliminated. Deferred
tax assets or liabilities are recognized for consolidation adjustments where these are expected to
reverse in subsequent years.
Interests in equity and earnings attributable to minority shareholders are carried under “Minority
interests”.
NOTES TO THE CONSOLIDATED FINANCIAL STATEMENTS146

NOTES TO THE CONSOLIDATED FINANCIAL STATEMENTS 147
4. Accounting policies
The annual financial statements of certain consolidated subsidiaries have been prepared on the basis
of different accounting policies; these have been largely adjusted during the course of consolidation.
The single-entity financial statements of associates were not adjusted to comply with uniform Group
accounting policies.
Revenue recognitionTrading and settlement fees on cash and derivatives markets are recognized immediately at the trade
date and billed on a monthly basis. Custodian and settlement fees and fees from the sale of informa-
tion products and system operation services are generally billed and recognized ratably on a monthly
basis. That portion of the revenue of the entory subgroup that is due to fixed-price contracts negotiated
for software development is recognized using the percentage of completion method. Interest income
from banking business is recognized when it arises and accrued.
Intangible assetsPurchased intangible assets are carried at cost and reduced by systematic amortization. Amortization
is charged using the straight-line method over the expected useful life or until the proprietary right in
question has expired. Assumed useful lives are presented in the following table. The custom software
developed since 2000 is amortized uniformly over five years, with the exception of training programs.
Purchased goodwill, including goodwill from the first-time consolidation of subsidiaries, is capitalized
and reduced by straight-line amortization. The goodwill that can be recognized is regularly estimated
in accordance with IAS 36, and impairment losses are charged where required.
Research costs are expensed in the period in which they are incurred. Development costs are capital-
ized at production cost, provided that they satisfy all the recognition criteria set out in IAS 38. Such
development costs include direct labor (internal staff and external consultants) and workstation costs,
including proportionate overheads and software development environment costs. Borrowing costs are
not included in production costs.
Capitalized development costs are reduced by straight-line amortization over the expected useful life
amounting to three to five years, starting on the date of first use. Internally developed software that
is no longer used, or whose future useful life is shorter than originally assumed, is written down.
Purchased goodwill Straight-line 6 or 20 years Ratable
Standard software Straight-line 3 years Ratable
Custom software Straight-line 3 to 6 years Ratable
Asset Amortization method Useful life Recognition

Property, plant and equipmentProperty, plant and equipment is carried at cost and reduced by depreciation for wear and tear.
Depreciation of property, plant and equipment is based largely on the following useful lives:
Low-value assets are written off immediately. Repair and maintenance costs are expensed when they
are incurred. The cost of refurbishment and significant improvements is capitalized.
Leased plant and equipment is capitalized and depreciated in accordance with IAS 17 if the criteria
for finance leases are satisfied.
Noncurrent financial assetsThere are seven categories of noncurrent financial assets: investments in subsidiaries; investments in
associates; other equity investments; receivables and liabilities from banking business; other noncur-
rent financial instruments; other long-term loans; and real property.
Investments in subsidiaries are those investments not consolidated in accordance with IAS 27.11
because they are insignificant for the presentation of a true and fair view of the Group’s net assets,
financial position and results of operations. In accordance with IAS 27.13 in conjunction with IAS
39.69 (c), investments in unconsolidated subsidiaries are carried at cost. All subsidiaries were fully
consolidated as at 31 December 2002.
In the case of investments in associates, we make a distinction between joint ventures and other
associates, depending on the equity interests held. Joint ventures and other associates are generally
carried at equity in accordance with IAS 31.32 or IAS 28.8. Where joint ventures or other associates
are not measured at equity, they must be carried at their fair values in accordance with IAS 39.69.
Other associates are carried at cost because of their insignificance and because it is not possible to
measure their fair value reliably.
Other equity investments are equity interests of less than 20 percent that are designed to establish a
permanent relationship with the company concerned. In accordance with IAS 39.69, financial assets
are generally measured at their fair values. An exception to this rule arises in the case of financial
assets that do not have a quoted market price in an active market, and whose fair value cannot be
reliably measured. Because no reliable fair value can be established for Deutsche Börse Group’s
interests in other equity investments, they are measured at cost.
NOTES TO THE CONSOLIDATED FINANCIAL STATEMENTS148
Computer hardware Straight-line 3 years Simplification option
Office equipment Straight-line/ Based on useful life Simplification optiondeclining balance of 5 to 25 years
Leasehold improvements Straight-line Based on lease term Ratable
Asset Amortization method Useful life Recognition

Receivables and securities from banking business are described in further detail below.
Other noncurrent financial instruments are classified as available-for-sale financial assets and carried
at their fair values in accordance with IAS 39.69. In accordance with IAS 39.103, gains or losses on
noncurrent financial instruments are therefore taken directly to the revaluation surplus in the state-
ment of changes in shareholders’ equity until the financial asset is sold, collected or otherwise dis-
posed of, or until the financial asset is determined to be impaired, at which time the cumulative gain
or loss previously recognized in equity is included in net profit or loss for the period. Changes in the
fair values of noncurrent financial instruments are therefore taken directly to the revaluation surplus.
Other long-term loans relate to reverse repurchase agreements with remaining maturities of between
one and five years; these form part of a structured product that also contains a cross-currency swap
and two matching forward currency swap transactions. The difference between the purchase price
and the repurchase price of these reverse repurchase agreements is accrued over the period of the
transaction and is contained in interest and similar expenses.
In accordance with IAS 40.24 und 40.50, investment property is carried at the lower of cost less
accumulated depreciation and the recoverable amount. As at 31 December 2002, investment property
related exclusively to unused land that is not depreciated.
Based on the expected future cash flows, noncurrent assets are examined to establish whether their
market or fair value is lower than their carrying amount. If this is the case, the assets are written
down to their market or fair value in accordance with IAS 36.
Receivables, securities, and liabilities from banking businessThe financial instruments contained in the receivables and securities from banking business and in
the liabilities from banking business are accounted for in accordance with IAS 39. In particular, the
available-for-sale assets (financial assets not held for trading) and originated loans (loans created by
providing funds to a debtor, excluding loans originated with the intent of generating a profit immedi-
ately or in the short term) are recognized at the settlement date. Financial assets held for trading
(instruments held for the purpose of generating a profit immediately or in the short term, or deriva-
tives not to be classified as hedging instruments according to IAS 39) are recognized at the trade
date. Reverse repurchase agreements (securities purchase agreements under which essentially identi-
cal securities will be sold again at a certain date in the future at an agreed price) are not recognized.
The amounts paid are reported as loans to banks or to customers. The difference between the pur-
chase price and the repurchase price is accrued over the period of the transaction and is contained
in interest and similar income.
NOTES TO THE CONSOLIDATED FINANCIAL STATEMENTS 149

All financial instruments are initially measured at cost, including transaction costs. Subsequent to
initial recognition, all financial instruments held for trading and available-for-sale financial assets are
remeasured at their fair values. Exceptions to this rule relate to assets whose fair value cannot be
reliably determined. Such assets must be recognized at cost, less any write-downs for impairment.
All financial liabilities not held for trading, originated loans and receivables and held-to-maturity
investments are carried at amortized cost, less any write-downs for impairment. Amortized cost is
determined using the effective interest method. Premiums and discounts are contained in the carry-
ing amount of the instrument concerned, and are amortized using the effective interest method.
Financial assets and liabilities are offset and the net amount is reported in the balance sheet when
there is a legally enforceable right to set off the recognized amounts and the intention to settle on a
net basis.
Other current assetsReceivables, other assets, and cash and cash equivalents are carried at their principal amount.
Adequate valuation allowances take account of identifiable risks.
Current financial instruments are classified as financial assets held for trading and are carried at their
fair values in accordance with IAS 39.69. Gains or losses on current financial instruments are recog-
nized in net financial income in accordance with IAS 39.103.
ProvisionsProvisions for pension obligations are measured using the projected unit credit method on the basis
of actuarial reports, in accordance with IAS 19. The obligations are measured at the balance sheet
date each year using actuarial methods that conservatively estimate the relevant parameters. The
pension benefits expected on the basis of projected salary growth are spread over the remaining length
of service of the employees. Staff turnover trends are not reflected.
The calculations were based on the 1998 mortality tables produced by Prof. Dr. Klaus Heubeck.
The following assumptions were applied in the calculation of the actuarial obligations for the pension
plans:
NOTES TO THE CONSOLIDATED FINANCIAL STATEMENTS150
Discount rate 5.75 6.0
Salary growth 3.5 3.5
Pension growth 2.0 2.0
1) The entory subgroup applied different rates.
31 Dec. 2002 31 Dec. 20011)
% %

Retirement provision for Group employees is ensured by a variety of retirement benefit plans, the use
of which varies from country to country.
To standardize retirement provision for employees of Deutsche Börse Group in Germany (excluding
entory subgroup employees), a deferred compensation plan was introduced effective 1 July 1999.
Since this date, new commitments are only entered into on the basis of this deferred compensation
plan; the existing pension plans were closed as at 30 June 1999. Employees with pension commit-
ments on the basis of the old retirement benefit arrangements were given an option to participate in
the deferred compensation plan by converting their existing pension rights.
entory AG established a defined benefit occupational pension plan for its employees and members of
its executive board in 1986. The provision for pension obligations was measured on the basis of an
actuarial report by Gerling Pensionsmanagement GmbH using the projected unit credit method. The
employees of the Clearstream subgroup in Luxembourg participate in an occupational pension plan.
The provision for pension obligations was calculated on the basis of the actuarial report by Mercer
HR Consulting S.A.
Deutsche Börse Group does not use an external fund to finance its pension obligations; rather, it
establishes a provision in the amount of the annual net pension expense for which the Group com-
panies are liable on the basis of their pension obligations. The pension obligations of Deutsche Börse
Group are secured in part by reinsurance policies. The capitalized surrender value of these reinsur-
ance policies is carried under other noncurrent assets.
There are defined contribution pension plans for employees working in Switzerland, the UK or the
USA. Contributions are paid to the employees’ private pension funds.
In accordance with IAS 37, the other provisions take account of all identifiable risks and uncertain
obligations and are measured in the amount of the probable obligation.
Deferred tax assets and liabilitiesDeferred tax assets and liabilities are computed using the balance sheet approach in accordance with
IAS 12. The deferred tax calculation is based on temporary differences between the carrying amounts
in the tax accounts and the carrying amounts in the IFRS/IAS financial statements that lead to a
future tax liability or benefit when assets are used or sold or liabilities are settled. The deferred tax
assets or liabilities are measured using the tax rates currently expected to apply when the temporary
differences reverse. They are recorded as deferred tax assets or in provisions for deferred tax liabilities.
NOTES TO THE CONSOLIDATED FINANCIAL STATEMENTS 151

LiabilitiesLiabilities are generally carried at their redemption amount. One exception to this rule involves the
commercial paper issued that is reported under “Other commercial paper” and in liabilities from
banking business. These instruments are treated as non-trading financial liabilities and are therefore
carried at their redemption amount less accrued interest expenses. Derivatives, which with one
exception are used solely to hedge recognized underlying instruments, are carried at their fair values.
This exception relates to the hedge of a loan that was repaid in full in January 2002, and for which
interest rate swap agreements with a notional volume of €80 million and a maturity of no later than
11 January 2010 were still reported as at 31 December 2002. To offset the interest rate risk from
these agreements, Deutsche Börse AG entered into matching interest rate swap agreements in
January 2002. These additional interest rate swap agreements eliminate the risk from the original
agreements. Receivables and liabilities under all these interest rate swap agreements are carried in
other assets or other noncurrent liabilities at their fair value of €6.5 million at the reporting date.
Currency translationIn accordance with IAS 21, foreign currency transactions are translated at the middle rate prevailing
at the transaction date. At the balance sheet date, monetary balance sheet items are measured at the
exchange rate at the balance sheet date, while non-monetary balance sheet items are measured at
historical cost. Currency translation differences are recorded as income or expense in the period in
which they arose unless the underlying transactions were hedged. Such income or expenses are con-
tained in other operating expenses.
For reasons of materiality, the single-entity financial statements of the consolidated foreign sub-
sidiaries are also translated at the closing date for the consolidated financial statements. Currency
translation differences from capital consolidation are taken directly to other retained earnings.
The following euro exchange rates were used:
With the exception of Clearstream, the revenues and expenses of Deutsche Börse Group are mainly
settled in euros. Around 20 percent of Clearstream’s revenue is settled in US dollars. After deduction
of all US dollar expenses, this revenue is hedged against exchange rate movements against the euro
where it is estimated that such transactions will benefit Deutsche Börse Group.
NOTES TO THE CONSOLIDATED FINANCIAL STATEMENTS152
Swiss francs (CHF) 1.4552 1.4829
US dollars (USD) 1.0471 0.8813
Pounds sterling (GBP) 0.6525 0.6085
Closing date Closing date31 Dec. 2002 31 Dec. 2001

Consolidation of the Eurex derivatives exchangeThe Eurex derivatives exchange is operated jointly by Eurex Frankfurt AG, Eurex Zürich AG and Eurex
Clearing AG; Eurex Clearing AG is responsible for clearing.
All Eurex transaction fees are collected by Eurex Clearing AG, which remits 80 percent of them to
Deutsche Börse AG and 20 percent to SWX Swiss Exchange in accordance with the contractual
arrangements. In 2002, Deutsche Börse AG received transaction fees generated from derivatives
market trades amounting to €313.1 million (2001: €258.5 million). These fees are carried under
sales revenue. The transaction fees of €78.3 million (2001: €64.6 million) attributable to SWX are
not included in the consolidated financial statements.
20 percent of the net expenses incurred by the Eurex companies to operate the Eurex derivatives
exchange – totaling €134.4 million in 2002 (2001: €134.4 million) – are borne by SWX (2002:
€26.9 million; 2001: €26.9 million), and are contained in other operating income.
Eurex Zürich AG is fully consolidated as a subsidiary in Deutsche Börse AG’s IFRS/IAS consolidated
financial statements. SWX also holds an equity interest in Eurex Zürich AG, which is recognized as a
minority interest item. This item is adjusted to reflect proportionate changes in capital and annual
results. As at 31 December 2002, SWX’s interest was valued at €4.0 million (2001: €3.9 million).
5. Significant differences in the financial reporting of Deutsche Börse Group between theIFRSs/IASs and the German Commercial Code (HGB)
Because Deutsche Börse Group does not prepare consolidated financial statements in accordance
with the HGB, it is not possible to estimate the amount of any differences between net profit and
total assets in the IFRS/IAS financial statements and comparable HGB financial statements.
Intangible assetsIn contrast to the HGB, IAS 38 requires internally generated intangible assets to be capitalized if
certain criteria are satisfied. The software development expenses of Deutsche Börse Group are
capitalized at cost.
Financial instrumentsThe HGB prohibits financial investments from being remeasured at an amount higher than the origi-
nal acquisition cost. IAS 39.69 generally requires financial assets to be measured at their fair values,
even if this means carrying financial investments at an amount higher than their original acquisition
cost.
Under the HGB, anticipated losses on financial instruments must be recognized as an expense. In
accordance with IAS 39, changes in value of financial instruments used as hedging instruments must
be recognized directly in equity.
NOTES TO THE CONSOLIDATED FINANCIAL STATEMENTS 153

Pension provisionsHGB measurement of pension provisions normally uses the 6 percent discount rate prescribed by the
German Income Tax Act. The IFRSs/IASs require the application of the current capital market rate as
the discount rate, and also require pension provisions to reflect future salary and pension increases.
Deferred taxesUnder the HGB, deferred taxes are computed using the income statement method. Companies have
an option to carry deferred taxes as assets in their single-entity financial statements. The IFRSs/IASs
require deferred taxes to be computed using the balance sheet approach, and also require the recog-
nition of deferred tax assets.
Revenue recognitionUnder the HGB, revenue from construction contracts is recognized when the contract is completed
(“completed contract method”). Under the IFRSs/IASs, these revenues are recognized using the per-
centage of completion method.
Acquisition costsUnder the HGB, only the costs incurred to complete the acquisition are capitalized. Under the
IFRSs/IASs, the costs incurred for preparation of the acquisition are also capitalized.
Costs of capital increasesThe HGB requires the cost of raising capital to be expensed. In accordance with the IFRSs/IASs
(Interpretation SIC 17), external costs directly attributable to an equity transaction should be
accounted for as a deduction from equity, net of any related income tax benefit.
Amortization of purchased goodwillUnder the HGB, there is an option to capitalize goodwill from first-time consolidation, or to deduct it
from reserves on the face of the balance sheet. If goodwill is capitalized, it is amortized either over
four years or over the expected useful life. Under the IFRSs/IASs, purchased goodwill must be amor-
tized over its useful life. The amortization period should reflect the best estimate of the period during
which future economic benefits are expected to flow to the enterprise. There is a rebuttable presump-
tion that the useful life of goodwill will not exceed 20 years from the date of initial recognition.
NOTES TO THE CONSOLIDATED FINANCIAL STATEMENTS154

Consolidated income statement disclosures
6. Sales revenue
A breakdown of external sales revenue by segment is presented below:
NOTES TO THE CONSOLIDATED FINANCIAL STATEMENTS 155
Xetra
Floor trading fees 59.4 88.7
Xetra trading fees 127.5 126.8
Listing fees 11.8 13.9
Income from cooperation agreements 6.3 8.1
Other sales revenue 5.8 5.6
210.8 243.1
Eurex
Trading and clearing fees 313.1 258.5
Other sales revenue 18.5 10.3
331.6 268.8
Information Products
Sales of price information 99.4 91.1
Other sales revenue 22.1 18.8
121.5 109.9
Clearstream1)
Custody fees 174.1 –
Transaction fees 51.9 –
Global Securities Financing 27.9 –
Other sales revenue 23.1 –
277.0 –
Information Technology2)
Systems development 77.2 24.4
Systems operation 88.4 106.6
Other sales revenue 0 7.5
165.6 138.5
Total sales revenue 1,106.5 760.3
2002 2001€m €m
Xetra and Eurex sales revenue is composed principally of trading and clearing fees earned per trans-
action or per contract. The other sales revenue in the Xetra and Eurex segments includes revenue
from training and events. The fall in sales revenue in the Xetra segment is due primarily to a decline
in floor trading activity. The rise in Eurex revenue is principally a result of the sharp increase in
turnover on the derivatives exchange.
1) Second half of 2002 only2) Contains the sales revenue allocated to the Systems and Xlaunch segments in 2001
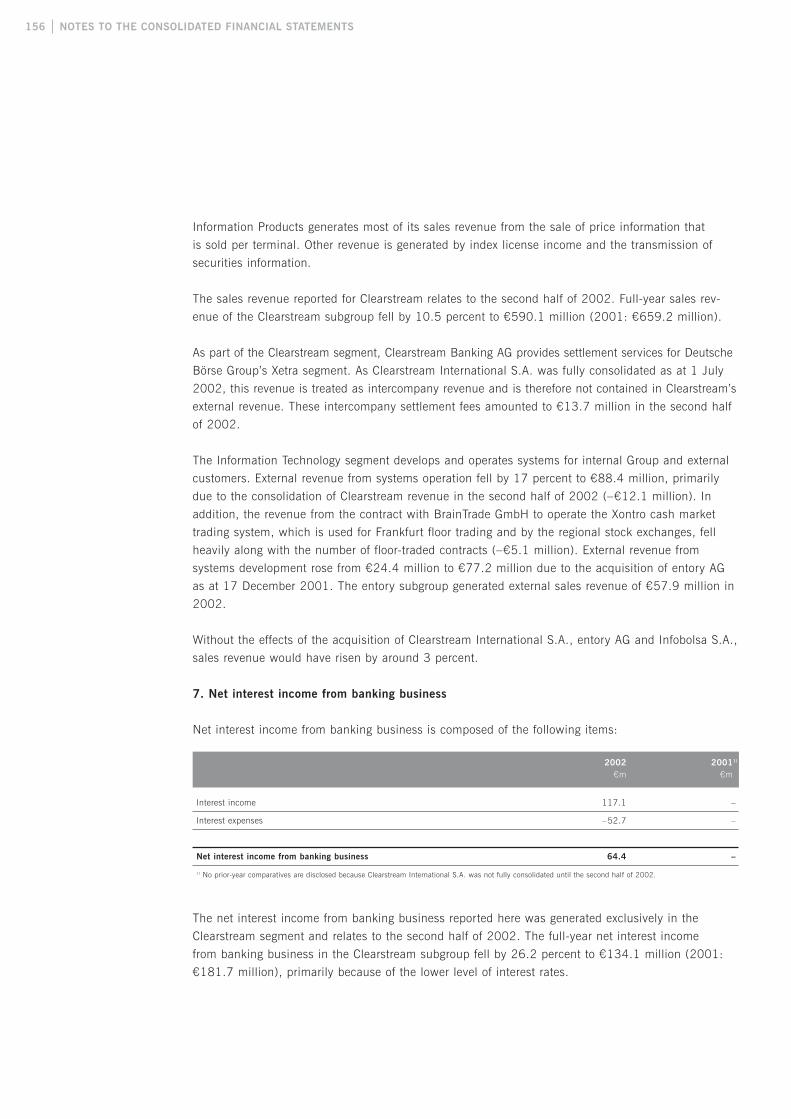
NOTES TO THE CONSOLIDATED FINANCIAL STATEMENTS156
Information Products generates most of its sales revenue from the sale of price information that
is sold per terminal. Other revenue is generated by index license income and the transmission of
securities information.
The sales revenue reported for Clearstream relates to the second half of 2002. Full-year sales rev-
enue of the Clearstream subgroup fell by 10.5 percent to €590.1 million (2001: €659.2 million).
As part of the Clearstream segment, Clearstream Banking AG provides settlement services for Deutsche
Börse Group’s Xetra segment. As Clearstream International S.A. was fully consolidated as at 1 July
2002, this revenue is treated as intercompany revenue and is therefore not contained in Clearstream’s
external revenue. These intercompany settlement fees amounted to €13.7 million in the second half
of 2002.
The Information Technology segment develops and operates systems for internal Group and external
customers. External revenue from systems operation fell by 17 percent to €88.4 million, primarily
due to the consolidation of Clearstream revenue in the second half of 2002 (–€12.1 million). In
addition, the revenue from the contract with BrainTrade GmbH to operate the Xontro cash market
trading system, which is used for Frankfurt floor trading and by the regional stock exchanges, fell
heavily along with the number of floor-traded contracts (–€5.1 million). External revenue from
systems development rose from €24.4 million to €77.2 million due to the acquisition of entory AG
as at 17 December 2001. The entory subgroup generated external sales revenue of €57.9 million in
2002.
Without the effects of the acquisition of Clearstream International S.A., entory AG and Infobolsa S.A.,
sales revenue would have risen by around 3 percent.
7. Net interest income from banking business
Net interest income from banking business is composed of the following items:
The net interest income from banking business reported here was generated exclusively in the
Clearstream segment and relates to the second half of 2002. The full-year net interest income
from banking business in the Clearstream subgroup fell by 26.2 percent to €134.1 million (2001:
€181.7 million), primarily because of the lower level of interest rates.
Interest income 117.1 –
Interest expenses –52.7 –
Net interest income from banking business 64.4 –
1) No prior-year comparatives are disclosed because Clearstream International S.A. was not fully consolidated until the second half of 2002.
2002 20011)
€m €m

8. Development costs and own expenses capitalized
Own expenses capitalized relate solely to development costs of internally developed software, involv-
ing the following systems and projects in the individual segments:
NOTES TO THE CONSOLIDATED FINANCIAL STATEMENTS 157
Xetra
Central Counterparty1) 40.4 4.3 24.4 0
Xetra software 17.4 16.7 12.1 11.6
Common Internet Access 0 2.3 0 0
57.8 23.3 36.5 11.6
Eurex
Eurex software 28.2 36.7 22.5 27.2
Integrated Clearer1) 10.3 21.6 3.3 11.6
38.5 58.3 25.8 38.8
Information Products
Consolidated Exchange Feed (CEF) 6.2 9.6 5.8 5.6
StatistiX 3.0 3.5 0 0
Xebos/Fixed Income Benchmark 1.6 2.2 1.5 2.2
Index Engine releases 1.1 1.8 0.9 1.6
Consolidation Engine 0.4 2.3 0 0
Internet and Xetra Live 0 1.8 0 1.1
12.3 21.2 8.2 10.5
Information Technology
Xentric 3.9 2.1 1.1 0.7
Components business 0.3 0 0.3 0
Integriertes Aktienbuch (Integrated Share Register) 0 2.0 0 1.0
4.2 4.1 1.4 1.7
Clearstream 2)
Connectivity 13.1 – 13.1 –
Customer Focus 8.1 – 8.1 –
Creation 24 7.3 – 7.3 –
Custody 4.7 – 4.7 –
NCB Link 2.2 – 2.2 –
Daytime Bridge 0.5 – 0.5 –
Other 2.3 – 2.3 –
38.2 – 38.2 –
Total development costs and own expenses capitalized 151.0 106.9 110.1 62.6
Development costs of which own expenses capitalized
2002 2001 2002 2001€m €m €m €m
1) The Central Counterparty and Integrated Clearer systems are managed as part of a joint project; the development costs were allocated to the Xetra and Eurexsegments on the basis of the resources used.
2) No prior-year comparatives are disclosed because Clearstream International S.A. was not fully consolidated until the second half of 2002.

The development costs and own expenses capitalized that are reported for the Clearstream segment
are the amounts for the second half of 2002. Clearstream’s full-year development costs and own
expenses capitalized for 2002 fell by 27.5 percent to €63.4 million (2001: €87.4 million).
Research costs not capitalized in the Information Technology segment in 2002 totaled €6.2 million
(2001: €17.7 million).
9. Other operating income
Other operating income is composed of the following items:
The income from agency agreements results from the operational management of the Eurex Zürich
derivatives market for SWX Swiss Exchange, and from centralized functions performed for certain
companies, including Clearstream Banking AG (until 30 June 2002). The income from agency agree-
ments for the assumption of centralized functions for Clearstream Banking AG for the first half of
2002 amounted to €7.1 million (full year 2001: €7.9 million).
Miscellaneous other operating income relates primarily to income from cooperation agreements and
from training.
10. Staff costs
Staff costs are composed of the following items:
NOTES TO THE CONSOLIDATED FINANCIAL STATEMENTS158
Income from agency agreements 40.0 48.1
Income from the release of other provisions and liabilities 11.3 10.3
Rental income 4.7 5.0
Capital consolidation of Deutsche Börse Computershare GmbH 3.1 0
Recoveries on receivables previously written off 1.1 0
Reimbursement of external suppliers 1.6 2.0
Reimbursement of costs charged to partner exchanges 0 3.6
Miscellaneous 8.8 8.3
Total other operating income 70.6 77.3
2002 2001€m €m
Wages and salaries 209.0 94.4
Social security contributions, retirement and other benefit costs 36.3 17.6
Total staff costs 245.3 112.0
thereof:
Clearstream subgroup 91.5 –
entory subgroup 27.8 –
Infobolsa subgroup 0.6 –
Other Deutsche Börse Group 125.4 112.0
2002 2001€m €m

Without the effects of acquisitions, staff costs would have risen by 12.0 percent, reflecting the 5.2
percent rise in the average number of employees.
The staff costs reported for 2002 contain the staff costs of the Clearstream subgroup for the second
half of 2002 amounting to €91.5 million. Clearstream’s full-year staff costs for 2002 fell by 1.0 per-
cent to €171.7 million (2001: €173.4 million).
11. Depreciation and amortization expense
The depreciation and amortization expense is broken down as follows:
The amortization expense for intangible assets includes exceptional write-downs of €17.6 million
(2001: €2.7 million). These result primarily from impairment losses of €11.6 million charged on the
“Integrated Clearer” software, which is expected to be replaced by another program that will be intro-
duced when the central counterparty is launched for equities trading. In addition, impairment losses
of €5.1 million were charged on software in the Information Products segment (Xebos €3.5 million,
Global Index Engine €0.9 million and Internet €0.7 million), and impairment losses of €0.9 million
were charged in the Information Technology segment.
The depreciation and amortization expense reported for 2002 contains the expense of the Clearstream
subgroup amounting to €43.3 million for the second half of 2002. Clearstream’s full-year depreciation
and amortization expense for 2002 rose by 7.2 percent to €85.1 million (2001: €79.4 million).
NOTES TO THE CONSOLIDATED FINANCIAL STATEMENTS 159
Intangible assets
Software 113.6 55.7
Goodwill 68.7 0.2
Property, plant and equipment 41.3 27.4
Total depreciation and amortization expense 223.6 83.3
thereof:
Clearstream subgroup 43.3 –
entory subgroup 2.1 –
Infobolsa subgroup 0.1 –
Other Deutsche Börse Group 178.1 83.3
2002 2001€m €m

12. Other operating expenses
Other operating expenses are composed of the following items:
Legal and consulting costs relate mainly to expenses in conjunction with software development. An
analysis of development costs is presented in note 8. Legal and consulting costs also contain costs of
user support and software operation, as well as strategic and legal consulting services.
The legal and consulting costs in 2002 contain €22.2 million from the Clearstream subgroup. Excluding
the fully consolidated costs of the Clearstream subgroup for the second half of the year, the legal and
consulting costs would have risen by 7.3 percent (€11.0 million), primarily as a result of purchased
contract labor services in the Information Technology segment.
NOTES TO THE CONSOLIDATED FINANCIAL STATEMENTS160
Legal and consulting costs 183.5 150.3
IT costs 51.2 40.3
Premises expenses 49.7 43.1
Communication costs (incl. network costs) 27.3 36.6
Non-recoverable input tax 26.9 28.6
Purchase of price information 22.5 19.7
Xontro system operation 18.7 26.3
Advertising and marketing costs 18.1 20.6
Insurance premiums, contributions and fees 13.7 5.9
Fees payable to Helsinki Exchanges (HEX) 13.2 15.4
Xetra settlement fees1) 10.7 20.6
Travel, entertainment and corporate hospitality expenses 9.8 6.0
Cost of agency agreements 8.2 6.4
Non-wage labor costs and voluntary social benefits 6.9 6.9
External labour 5.8 6.2
Specific and general bad debt allowances 3.0 6.0
Postage and transport costs 3.0 3.9
Office supplies 2.3 1.5
Rent and leases (excl. IT) 1.8 1.6
Maintenance (excl. IT) 1.0 2.1
Additions to provision for litigation and interest rate risks 0.5 9.7
Miscellaneous 22.2 13.9
Total other operating expenses 500.0 471.6
thereof:
Clearstream subgroup 94.3 –
entory subgroup 47.6 –
Infobolsa subgroup 1.0 –
Other Deutsche Börse Group 404.5 471.6
Consolidation of intercompany services –47.4 –
1) Amounts for the first half of 2002 only; thereafter reported as intercompany services
2002 2001€m €m

IT costs contain the costs for rental, leasing and maintenance of hardware and software.
IT costs for 2002 contain €9.9 million from the Clearstream subgroup. Excluding the fully consoli-
dated costs of the Clearstream subgroup for the second half of the year, IT costs would have risen
by 2.5 percent (€1.0 million).
Premises expenses relate primarily to the costs of the Neue Börse and other buildings in Frankfurt
leased by Deutsche Börse Group. €10.4 million was attributable to premises expenses of the Clear-
stream subgroup, and a further €1.8 million to costs for buildings of the entory subgroup. Provisions
for anticipated losses from rental expenses have been set up for rented buildings no longer used by
Deutsche Börse Group. €3.1 million was utilized in 2002 (2001: €2.8 million), and a further net
€0.2 million (2001: €0.7 million) was released.
Excluding the fully consolidated costs of the Clearstream subgroup for the second half of the year,
the premises expenses would have fallen by 8.8 percent (€3.8 million), primarily as a result of
one-time costs incurred in 2001.
Communication costs, which also include the costs of the participant network, fell by 25.4 percent
in 2002 to around €27.3 million due to the technical consolidation of the network infrastructure and
corresponding price negotiations with external network providers. They contain €3.9 million from
the Clearstream segment in 2002. Excluding the fully consolidated costs of the Clearstream segment
for the second half of the year, the communication costs would have fallen by 36.1 percent (€13.2
million).
Non-recoverable input tax results from the VAT-free income from Eurex trading and clearing fees, and
from interest income and payment services income.
Costs for the purchase of price information are incurred by the Information Products segment for data
and information from other stock exchanges. These costs rose 14.2 percent to €22.5 million. Overall,
these variable costs are correlated with this segment’s revenue.
Xetra settlement fees are commissions paid to Clearstream Banking AG to settle transactions on the
Xetra electronic trading platform. Xetra charges its customers an “all-in” price, which includes these
settlement fees. Since the full consolidation of the Clearstream subgroup as at 1 July 2002, these
expenses are reported under the consolidation of intercompany expenses.
The cost of agency agreements includes the costs of SWX Swiss Exchange, which renders services
for the Eurex subgroup.
Miscellaneous other operating expenses are composed of smaller items, including leasing costs,
license fees, and donations.
NOTES TO THE CONSOLIDATED FINANCIAL STATEMENTS 161

13. Income from equity investments
The income from equity investments is attributable to the following items:
As Cedel International S.A. and Clearstream International S.A. were fully consolidated as at 1 July
2002, the carrying amount adjustments and dividend income for these formerly equity-accounted
investments relate to the first half of 2002.
14. Write-downs of noncurrent financial assets
Write-downs of noncurrent financial assets are broken down as follows:
NOTES TO THE CONSOLIDATED FINANCIAL STATEMENTS162
Proportionate net losses of equity-accounted investees 2.7 12.6
Write-downs of interests in Monte Titoli S.p.A. 2.0 –
Write-downs of the investment in European Energy Exchange AG1) 1.2 –
Miscellaneous 0.3 0.6
Total write-downs of noncurrent financial assets 6.2 13.2
1) Resulting from the merger of European Energy Exchange AG and Leipzig Power Exchange GmbH
2002 2001€m €m
Associates and joint ventures
Clearstream International S.A. (carried at equity) 15.6 41.5
Clearstream International S.A. (dividend) 23.2 14.5
STOXX Ltd. (carried at equity) 0.8 0.5
STOXX Ltd. (dividend) 0.6 0.3
Deutsche Gesellschaft für Ad hoc-Publizität mbH (dividend) 0.3 0.5
Other equity investments
Cedel International S.A. (dividend) 0.2 0.2
BrainTrade GmbH (dividend) 0 0.4
Subsidiaries
Deutsche Gesellschaft für Wertpapierabwicklung mbH (dividend) 0.3 0.1
Total income from equity investments 41.0 58.0
2002 2001€m €m

15. Net financial income
Net financial income is composed of the following items:
Other interest and similar income is composed of the following items:
Interest and similar expenses is composed of the following items:
The cash acquisition of Cedel International S.A. resulted in a reduction in interest income.
This acquisition also required the issue of commercial paper under the commercial paper program
launched in December 2001, which increased interest expenses.
NOTES TO THE CONSOLIDATED FINANCIAL STATEMENTS 163
Income from noncurrent financial instruments and long-term loans 10.0 4.0
Other interest and similar income 29.3 44.4
Interest and similar expenses –16.1 –7.3
Total net financial income 23.2 41.1
2002 2001€m €m
Interest on foreign bank balances 21.1 42.3
Income from interest rate swaps 5.7 0
Interest income from taxes under section 233 of the AO (German Tax Code) 1.7 0.2
Interest on nostro accounts 0.3 0.3
Interest on term deposits 0.1 1.2
Other interest income 0.4 0.4
Total interest and similar income 29.3 44.4
2002 2001€m €m
Interest on current liabilities 6.7 0
Expenses from interest rate swaps 5.6 0
Interest on long-term loans 2.9 5.5
Interest on nostro accounts 0 0.4
Interest on tax arrears 0 1.4
Other interest expenses 0.9 0
Total interest and similar expenses 16.1 7.3
2002 2001€m €m

16. Income tax expense
The following table presents a breakdown of the income tax expense:
The income tax expense relates solely to the profit before tax from ordinary activities. As in 2001,
a tax rate of 41 percent was used to calculate deferred taxes for the German companies. This reflects
trade income tax at an assessment rate of 490 percent on the tax base value of 5 percent, corporation
tax of 25 percent and 5.5 percent solidarity surcharge on the corporation tax. An increased corpora-
tion tax rate of 26.5 percent is applied to temporary differences relating to 2003 in accordance with
the Flood Victims Solidarity Act. A tax rate of 30 percent was used for the Luxembourg companies,
reflecting trade income tax at the rate of 7.5 percent and corporation tax of 23 percent.
The deferred tax expense relates to the following items:
NOTES TO THE CONSOLIDATED FINANCIAL STATEMENTS164
Current income taxes
of the year under review 132.4 81.3
from previous years –4.4 0
Deferred tax expense 13.2 34.9
Total income tax expense 141.2 116.2
2002 2001€m €m
Intangible assets 14.2 17.7
Current financial instruments –1.2 1.2
Taxes on cost of capital increases 2.9 15.1
Equity investments –1.1 0.1
Provisions for anticipated losses from rental expenses 0.6 0.8
Pension provisions, provisions for pension obligations to IHK 1)
and provisions for early retirement benefits –1.0 –0.2
Property, plant and equipment –2.2 0
Other provisions 1.0 0.2
Deferred tax expense 13.2 34.9
1) Industrie- und Handelskammer (Chamber of commerce)
2002 2001€m €m

The following table presents a reconciliation between the expected and the actual tax expense. To
determine the expected tax expense, the profit before tax has been multiplied by the composite tax
rate of 41 percent assumed for 2002 (2001: 41 percent).
NOTES TO THE CONSOLIDATED FINANCIAL STATEMENTS 165
Balance as at 1 January
Deferred tax assets 11.2 10.0
Deferred tax liabilities –47.6 –28.7
–36.4 –18.7
Changes in deferred taxes taken directly to equity 0.5 17.5
Deferred tax expense for the year –13.2 –34.9
First-time consolidation –37.0 –0.3
Balance as at 31 December
Deferred tax assets 13.2 11.2
Deferred tax liabilities –99.3 –47.6
–86.1 –36.4
2002 2001€m €m
Expected income taxes derived from net profit before taxes 153.5 130.9
Tax reduction due to dividends and income from foreign equity investments carried at equity –16.3 –22.9
Effect of tax rate changes1) –22.9 0
Tax increases due to non-tax deductible goodwill amortization 16.8 0
Tax increases due to other non-tax deductible expenses 3.1 0.4
Risk provision 4.5 3.0
Non-tax deductible losses carried forward 3.6 5.4
Miscellaneous –1.1 –0.6
Actual tax expense 141.2 116.2
1) The Luxembourg tax rates were applied to the proportionate net profit of the Luxembourg companies.
2002 2001€m €m
The following table presents the deferred tax assets and liabilities recognized in the balance sheet,
as well as the deferred taxes for the year. Changes taken directly to equity relate to deferred taxes on
changes in the measurement of noncurrent financial assets carried at fair value, and to deferred taxes
on the costs of the capital increase in June 2002 and on the costs of the IPO in February 2001.

NOTES TO THE CONSOLIDATED FINANCIAL STATEMENTS166
Intangible assets
Software 438.6 82.0 0 57.6 1.5 104.5 681.2
Goodwill 75.0 1,266.0 0 0 0 0 1,341.0
Payments on account 0.8 35.2 0 –56.7 0 131.1 110.4
514.4 1,383.2 0 0.9 1.5 235.6 2,132.6
Property, plant and equipment
Land and buildings 0 0 0 0 0 27.7 27.7
Leasehold improvements 18.9 1.1 0 0 0.1 7.9 27.8
Computer hardware, operating and office equipment 149.5 21.3 0 0.4 11.3 54.9 214.8
Payments on account and construction in progress 0.4 60.2 0 –1.3 0 133.3 192.6
168.8 82.6 0 –0.9 11.4 223.8 462.9
Noncurrent financial assets
Investments in subsidiaries 8.4 0 0 0 0.2 –8.2 0
Investments in associates:
Clearstream International S.A. 370.2 0 13.2 0 0 –383.4 0
Others 32.2 0.7 0.9 0 0 0 33.8
Other equity investments 2.5 0 0 0 6.4 18.8 14.9
Receivables and securities from banking business 0 0 10.2 0 2.5 328.1 335.8
Other noncurrent financial instruments 35.3 8.0 0 0 32.2 0 11.1
Other long-term loans 1.5 0.3 0 0 0.6 261.4 262.6
Investment property 0 0 0 0 0 10.7 10.7
450.1 9.0 24.3 0 41.9 227.4 668.9
Total 1,133.3 1,474.8 24.3 0 54.8 686.8 3,264.4
Historical cost
Balance as at Additions Revalu- Reclassifi- Disposals Changes Balance as at1 Jan. 2002 ations cations from first-time 31 Dec. 2002
consolidation€m €m €m €m €m €m €m
Consolidated balance sheet disclosures
17. Statement of changes in noncurrent assets

NOTES TO THE CONSOLIDATED FINANCIAL STATEMENTS 167
230.9 113.6 0.7 0 343.8 337.4 207.7
23.7 68.7 0 0 92.4 1,248.6 51.3
0 0 0 0 0 110.4 0.8
254.6 182.3 0.7 0 436.2 1,696.4 259.8
0 0 0 0 0 27.7 0
3.7 3.7 0 0 7.4 20.4 15.2
107.8 37.6 10.8 0 134.6 80.2 41.7
0 0 0 0 0 192.6 0.4
111.5 41.3 10.8 0 142.0 320.9 57.3
7.2 0 0.2 –7.0 0 0 1.2
0 0 0 0 0 0 370.2
19.6 4.0 0 –0.1 23.5 10.3 12.6
0 2.2 0 –0.1 2.1 12.8 2.5
0 0 0 0 0 335.8 0
3.2 1.8 2.0 0 3.0 8.1 32.1
0 1.2 0 0 1.2 261.4 1.5
0 0 0 0 0 10.7 0
30.0 9.2 2.2 –7.2 29.8 639.1 420.1
396.1 232.8 13.7 –7.2 608.0 2,656.4 737.2
Cumulative depreciation and amortization Carrying amount
Balance as at Additions Disposals Changes Balance as at as at as at1 Jan. 2002 from first-time 31 Dec. 2002 31 Dec. 2002 31 Dec. 2001
consolidation€m €m €m €m €m €m €m

Intangible assetsAdditions and reclassifications of software relate principally to the expansion of the Eurex and Xetra
electronic trading systems and to the development of software products for the Information Products
and Clearstream segments. Payments on account relate primarily to advance payments on software.
Capitalized development costs include the costs of in-progress development at 31 December 2002
amounting to €34.0 million (2001: €47.5 million).
Impairment losses are charged where necessary and are subsequently reversed if the original reasons
for the impairment no longer apply. The amortization expense for intangible assets includes exceptional
impairment losses of €17.6 million (2001: €2.7 million).
GoodwillDuring the course of 2002, additional goodwill of €33.2 million arose in conjunction with the acqui-
sition of entory AG, corresponding to the proportionate differences between the assets and liabilities
to be recognized at the corresponding acquisition dates. On account of the difficult market environ-
ment for software development, in particular in the financial services sector, entory AG’s revenue
and profitability fell well behind expectations in 2002. Of the total amount recognized as goodwill
from the acquisition of entory AG, €36.4 million was written down in 2002, including €33.0 million
recognized as an exceptional impairment loss.
The acquisition of Cedel International S.A. and its 50 percent interest in Clearstream International
S.A., completed on 11 July 2002, generated goodwill of €1,215.8 million. This amount corresponds
to the excess of the purchase price of €1,760.9 million, over the carrying amounts of identifiable
assets and liabilities amounting to €549.1 million and €4.0 million respectively. €30.4 million of
the goodwill was reduced by systematic amortization in 2002.
NOTES TO THE CONSOLIDATED FINANCIAL STATEMENTS168
entory AG 51.3 33.2 36.4 48.1
Cedel International S.A. 0 1,215.8 30.4 1,185.4
Infobolsa S.A. 0 15.2 0.1 15.1
STOXX Ltd. 0 1.8 1.8 0
Total goodwill 51.3 1,266.0 68.7 1,248.6
Changes in goodwill Balance as at Generated by Amortization and Balance as at 1 Jan. 2002 acquisitions in 2002 write-downs in 2002 31 Dec. 2002
€m €m €m €m

Property, plant and equipmentAdditions of hardware, operating and office equipment in 2002 rose by 25 percent year-on-year,
mainly as a result of the first-time consolidation of the Clearstream.
Payments on account for construction in progress relate largely to the new Clearstream building in
Luxembourg.
Noncurrent financial assetsThe investments in associates and joint ventures have a carrying amount of €10.3 million as at
31 December 2002 (2001: €382.8 million). The reduction is due primarily to the full consolidation
of the Clearstream subgroup.
As available-for-sale financial assets, noncurrent financial instruments are carried at their fair values.
Gains or losses on noncurrent financial instruments are reported in the revaluation surplus in the
statement of changes in shareholders’ equity. Gains of €6.5 million (2001: losses of €2.1 million)
were credited directly to the revaluation surplus in 2002.
Receivables and securities from banking business include debt securities held for resale.
Other long-term loans relate to reverse repurchase agreements. These are described in greater detail
in note 4.
Investment property not currently used was recognized in the balance sheet at its cost of €10.7
million. The estimated fair value as at 31 December 2002 was €16.6 million.
18. Deferred tax assets
Deferred tax assets resulting from differences between the carrying amounts in the IFRS/IAS consoli-
dated financial statements and in the tax accounts are composed of the following items:
NOTES TO THE CONSOLIDATED FINANCIAL STATEMENTS 169
Pension provisions, provisions for pension obligations to IHK1) and provisions for early retirement benefits 6.8 3.5
Provisions for anticipated losses from rental expenses 5.0 5.6
Property, plant and equipment 0.5 0
Noncurrent financial instruments 0.2 0
Interest rate swaps 0 1.6
Other 0.7 0.5
Total deferred tax assets 13.2 11.2
1) Chamber of commerce
31 Dec. 2002 31 Dec. 2001Mio. € Mio. €

19. Receivables and securities from banking business
In addition to noncurrent receivables from banking business (see note 17, noncurrent financial
assets), the following receivables and securities from the banking business were classified as current
assets as at 31 December 2002:
The fixed-income and non-fixed-income securities held as at 31 December 2002 are all listed. None
of the fixed-income securities held at this date were issued by sovereign or semi-sovereign issuers,
and all of them had maturities of between one and five years. All loans to other banks and customers
at the reporting date had a maximum maturity of three months. There were generally no early call
rights on the loans extended.
DerivativesThe Clearstream subgroup generally hedges interest rate risks.
Interest rate swaps under which the Group companies pay a fixed interest rate and receive a variable
rate are used to hedge fixed rate available-for-sale financial instruments (fair value hedges).
NOTES TO THE CONSOLIDATED FINANCIAL STATEMENTS170
Loans to banks and customers
Money market lendings 1,011.3 3,183.1 2,255.7
Securities repurchase agreements 1,087.0 1,616.0 1,322.3
Overdrafts from settlement business 473.5 1,345.4 978.5
Balances on own accounts at other banks 334.8 450.8 428.8
2,906.6 6,595.3 4,985.3
Interest receivable 121.5 77.6 98.4
Available-for-sale fixed-income securities 31.2 12.0 29.0
Available-for-sale equities and other non-fixed-income securities 11.1 37.9 13.1
Derivatives 14.6 12.4 12.1
Total 3,085.0 6,735.2 5,137.9
Fair value as at Fair value as at Average fair value31 Dec. 2002 1 July 20021) in H2/20022)
€m €m €m
1) Receivables and securities from banking business are attributable solely to the companies of the Clearstream subgroup acquired as at 1 July 2002.2) The average amounts are calculated from the arithmetic mean of the end-month amounts.

The following table gives an overview of the average notional amount of the positions covered by fair
value hedges, and the corresponding weighted average interest rates:
Interest rate swaps under which the Group companies pay a variable interest rate and receive a fixed
rate are used to hedge available-for-sale variable rate financial instruments (cash flow hedges).
Deutsche Börse AG entered into a forward interest rate swap agreement in 2002 to hedge interest
income from expected cash flows of €0.7 billion and US$ 0.6 billion. These cash flows account for
around 50 percent of the total expected cash flows from the reinvestment of customer deposits. This
swap has a term from January 2003 to January 2004. In addition, there were cash flow hedges at
31 December 2002 as follows:
Cross-currency swaps at 31 December 2002 were as follows:
20. Trade receivables
Specific valuation allowances of €3.0 million (2001: €5.5 million) were charged on receivables in 2002.
As at 31 December 2002, there were no trade receivables with more than one year to maturity.
NOTES TO THE CONSOLIDATED FINANCIAL STATEMENTS 171
Notional amount of pay-fixed interest rate swaps (€m) (expiry July 2004/ April 2006) 81.8
Average pay rate (%) 3.78
Average receive rate (%) 3.34
as at 31 Dec. 2002
Notional amount of pay-variable interest rate swaps (€m) (expiry January 2003) 1,777.5
Average pay rate (%) 2.85
Average receive rate (%) 4.20
as at 31 Dec. 2002
Notional amount of pay-fixed interest rate swaps (€m) (expiry January 2003) 260.1
Average pay rate (%) 3.92
Average receive rate (%) 3.07
as at 31 Dec. 2002

21. Other current assets
Other current assets are composed of the following items:
22. Restricted bank balances
Amounts reported separately as at 31 December 2002 under liabilities as cash deposits by Eurex
participants amounting to €217.2 million (2001: €164.7 million) are restricted and mainly invested
in interest-bearing accounts at banks. Cash funds amounting to €86.5 million and attributable to the
Clearstream segment are also for the most part restricted due to minimum reserve requirements at
central banks.
23. Other cash and bank balances
Cash funds of €248.1 million were available as at 31 December 2002; €172.9 million of these
funds were credited to bank accounts of the companies of the Cedel subgroup.
24. Shareholders’ equity
Changes in shareholders’ equity are presented in the statement of changes in shareholders’ equity.
The subscribed capital was increased on 19 June 2002 by €9,042,880 to 111,802,880 shares by
issuing new no-par value registered shares against cash contributions. The newly issued shares were
mainly placed with institutional investors in the UK, Germany and the US at a price of €44.00 per
share under the terms of a private placement; shareholders’ subscription rights were suspended.
At the General Meeting on 3 May 2001, the shareholders approved a resolution to increase Authorized
Capital I and Authorized Capital II. The Executive Board was correspondingly authorized, with the
consent of the Supervisory Board, to increase the subscribed capital by up to €41.104.000
(Authorized Capital I), and by a further €10.276.000 (Authorized Capital II) by issuing new no-par
value registered shares against cash and/or non-cash contributions. The Executive Board was also
authorized, with the consent of the Supervisory Board, to suspend shareholders’ subscription rights
where Authorized Capital I is increased against non-cash contributions for the purpose of acquiring
NOTES TO THE CONSOLIDATED FINANCIAL STATEMENTS172
Recoverable taxes 48.9 17.8
Prepaid expenses 12.3 7.1
Interest receivable from interest rate swaps 7.2 0
Collection business of Deutsche Börse Systems AG 2.1 2.2
Creditors with debits 1.1 0.6
Miscellaneous 11.5 7.4
Total other current assets 83.1 39.1
31 Dec. 2002 31 Dec. 2001€m €m

companies, parts of companies or interests in companies. The Executive Board was authorized to
suspend shareholders’ subscription rights to the increased Authorized Capital II in order to issue new
shares against cash contributions at an issue price that is not materially lower than the market price.
Following the aforementioned capital increase on 19 June 2002, the share capital can still be
increased by the remaining €1,233,120 from Authorized Capital II.
There were no further subscription rights for shares at either 31 December 2002 or 31 December
2001.
Following the discontinuation of the underlying, the costs of the interest rate swaps that had been
charged to retained earnings to hedge the interest expense were reversed and recognized in the
income statement.
The revaluation surplus results from the net remeasurement of noncurrent financial instruments at
their fair values totaling €9.0 million net. Instruments held by Deutsche Börse AG were marked
down by €1.6 million while instruments held by the Clearstream subgroup were revalued upwards
in the amount of €10.6 million.
25. Shareholders’ equity of Deutsche Börse AG, appropriation of net profit
The annual financial statements of the parent company Deutsche Börse AG, prepared as at
31 December 2002 in accordance with the provisions of the HGB, and for which an unqualified
audit opinion has been granted, report net profit for the year of €138.2 million (2001: €116.6 million)
and shareholders’ equity of €1,770.8 million (2001: €1,271.8 million).
The Executive Board proposes that the unappropriated surplus amounting to €70.0 million reported
in the annual financial statements of Deutsche Börse AG be appropriated as follows:
NOTES TO THE CONSOLIDATED FINANCIAL STATEMENTS 173
Share capital 111.8 102.8
Share premium 1,367.5 978.7
Other retained earnings 221.5 130.3
Unappropriated surplus 70.0 60.0
Shareholders’ equity 1,770.8 1,271.8
31 Dec. 2002 31 Dec. 2001€m €m
Net profit 138.2 116.6
Appropriation to retained earnings in the annual financial statements –68.2 –56.6
Unappropriated surplus 70.0 60.0
Proposal by the Executive Board:
Distribution of a dividend to the shareholders on 15 May 2003 of €0.44 per no-par value share for 111,802,880 no-par value shares (in 2002 from net profit for 2001: €0.36) 49.2 37.0
Appropriation to retained earnings 20.8 23.0
31 Dec. 2002 31 Dec. 2001€m €m

NOTES TO THE CONSOLIDATED FINANCIAL STATEMENTS174
The proposed dividend for 2002 corresponds to a dividend rate of 20.9 percent of the consolidated
net profit (2001: 18.2 percent). €138.2 million or 58.8 percent of the consolidated net profit
was generated in the HGB annual financial statements of the parent company Deutsche Börse AG
(2001: €116.6 million or 57.2 percent).
26. Minority interests
Minority interests include the equity interest and proportionate interest in consolidated net profit of
the following subgroups and companies:
27. Provisions
The composition and development of provisions are presented in the following statement of changes
in provisions:
1) Reclassification of the provision for phantom stock options. This amount was carried under noncurrent liabilities in the previous year.
Clearstream Banking S.A. 10.0 –
Infobolsa S.A. 4.8 –
Eurex Zürich AG 4.0 3.9
Deutsche Börse Computershare GmbH 2.9 –
Eurex Bonds GmbH 1.4 2.0
entory AG 0 4.7
Total minority interests 23.1 10.6
31 Dec. 2002 31 Dec. 2001€m €m
Noncurrent provisions
Provisions for pensions and other employee benefits 31.2 0 –14.9 –2.1 9.5 40.8 64.5
Deferred tax liabilities 47.6 0 –0.8 –6.2 15.6 43.1 99.3
Other noncurrent provisions 26.3 1.51) –3.2 –1.0 7.1 7.2 37.9
105.1 1.5 –18.9 –9.3 32.2 91.1 201.7
Current provisions
Tax provisions 26.9 0 –46.8 –7.3 56.2 95.1 124.1
Other current provisions 25.4 0 –15.6 –5.5 18.8 5.5 28.6
52.3 0 –62.4 –12.8 75.0 100.6 152.7
Total provisions 157.4 1.5 –81.3 –22.1 107.2 191.7 354.4
1 Jan. 2002 Adjustment Utilized Released Additions First-time 31 Dec. 2002consolidation
€m €m €m €m €m €m €m

The maturity structure of the noncurrent provisions is shown below:
28. Provisions for pensions and other employee benefits
The provisions for pensions and other employee benefits contain provisions for early retirement
payments granted and obligations from pension payment reimbursements to the IHK (chamber of
commerce). Changes in these provisions were as follows:
The actuarial present value of the pension obligations corresponds to the provisions reported.
Expenses in conjunction with redundancies in the entory subgroup were carried as other exceptional
expenses. There was no other exceptional expense or income in the year under review resulting from
the termination of pension plans or from the curtailment and transfer of pension payments.
NOTES TO THE CONSOLIDATED FINANCIAL STATEMENTS 175
Balance as at 1 January 31.2 24.5
Past service cost 1.3 3.1
First-time consolidation 40.8 2.6
Interest cost 3.4 1.5
Current service cost 4.6 1.1
Transferred assets –1.4 0
Current benefit payments –15.4 –1.6
Total provisions for pensions and other employee benefits as at 31 December 64.5 31.2
2002 2001€m €m
Maturities between one and five years 89.8 60.2
Maturities in excess of five years 111.9 44.9
Total noncurrent provisions 201.7 105.1
31 Dec. 2002 31 Dec. 2001€m €m

29. Deferred tax liabilities
Deferred tax liabilities are composed of the following items:
The deferred tax liabilities recognized from the measurement of noncurrent financial instruments
were taken directly to equity.
30. Other noncurrent provisions
Other noncurrent provisions with more than one year to maturity comprise the following items:
The provisions for anticipated losses from rental expenses that are not expected to be settled until
2004 and thereafter are discounted at the rate of 5.5 percent. They were estimated on the basis of
existing rental agreements and take account of expected rental income if the properties can be sublet.
Provisions for early retirement benefits are estimated on the basis of the active and former employees
involved. Provisions for pension obligations to the IHK are recognized on the basis of the number of
eligible employees.
NOTES TO THE CONSOLIDATED FINANCIAL STATEMENTS176
Provisions for anticipated losses from rental expenses 12.1 13.8
Other provisions:
Provision for early retirement benefits 10.0 2.6
Provision for pension obligations to IHK (Chamber of commerce) 9.8 9.6
Provision for stock options 5.9
Other noncurrent provisions 0.1 0.3
Total other noncurrent provisions 37.9 26.3
1) Provisions for phantom stock options were reported under other noncurrent liabilities in the annual financial statements 2001 in the amount of €1.5 million.
31 Dec. 2002 31 Dec. 2001€m €m
0 1)
Intangible assets 56.6 42.1
Risk provisions 25.7 0
Current financial instruments 10.9 1.2
Noncurrent financial instruments 4.9 2.4
Other noncurrent assets 1.6 0
Investments in associates 0 1.1
Miscellaneous –0.4 0.8
Total deferred tax liabilities 99.3 47.6
31 Dec. 2002 31 Dec. 2001€m €m

31. Tax provisions
The tax provisions contain the following items:
32. Other current provisions
The other current provisions are composed of the following items:
The provision for restructuring costs amounting to €4.3 million was established for the integration of
the Clearstream subgroup. The miscellaneous other current provisions include provisions for payroll
tax and redundancy scheme obligations.
NOTES TO THE CONSOLIDATED FINANCIAL STATEMENTS 177
Income tax expense: previous years 63.4 8.2
Income tax expense: current year 58.5 17.1
Wealth tax 2.2 0
Foreign income taxes 0 0.8
VAT: previous years 0 0.8
Total tax provisions 124.1 26.9
31 Dec. 2002 31 Dec. 2001€m €m
Litigation and interest rate risks 8.0 12.0
Rent and incidental rental costs 7.1 6.6
Restructuring costs 4.3 0
Jubilee benefits 2.7 1.1
Miscellaneous 6.5 5.7
Total other current provisions 28.6 25.4
31 Dec. 2002 31 Dec. 2001€m €m

33. Liabilities
The composition and development of liabilities are presented in the following statement of liabilities:
The noncurrent interest-bearing liabilities contain a subsidized loan by the state-owned Luxembourg
investment agency “Société Nationale de Crédit et d’Investissement” to Clearstream Services S.A.
amounting to €5.3 million; this loan is due on 30 June 2004.
The noncurrent liabilities also contain finance lease obligations amounting to €1.6 million.
Closing out interest rate and cross-currency swaps resulted in liabilities of €8.3 million as at 31
December 2002. These swaps have a term of up to eight years.
All other liabilities have less than one year to maturity.
There were no liabilities as at 31 December 2002 that were secured by liens or similar rights.
NOTES TO THE CONSOLIDATED FINANCIAL STATEMENTS178
Noncurrent liabilities
with one to five years to maturity 17.5 0
with more than five years to maturity 0 11.1
Total 17.5 11.1
31 Dec. 2002 31 Dec. 2001€m €m
Noncurrent liabilities
Interest-bearing liabilities 0 12.2 –3.0 9.2
Other noncurrent liabilities 11.1 25.0 –27.8 8.3
11.1 37.2 –30.8 17.5
Current liabilities
Liabilities from banking business 0 6,970.1 –3,712.2 3,257.9
Cash deposits by Eurex participants 164.7 0 52.5 217.2
Other bank loans and overdrafts 90.0 0 –90.0 0
Other commercial paper 0 0 288.1 288.1
Trade payables 70.2 66.5 –13.8 122.9
Payables to other investors 12.6 0 –6.4 6.2
Other current liabilities 58.2 68.1 –21.6 104.7
395.7 7,104.7 –3,503.4 3,997.0
Total liabilities 406.8 7,141.9 –3,534.2 4,014.5
31 Dec. 2001 First-time Change 31 Dec. 2002consolidation
€m €m €m €m

34. Liabilities from banking business
The liabilities from banking business are composed of the following items:
As at 31 December 2002, all liabilities from banking business had a maximum maturity of three
months.
35. Cash deposits by Eurex participants
The cash deposits are liabilities of Eurex Clearing AG from margin payments by clearing members of
the Eurex derivatives exchange.
36. Other current liabilities
The other current liabilities are composed of the following items:
The miscellaneous other current liabilities are composed principally of accruals for products or ser-
vices that had already been delivered or rendered, but for which no invoice has yet been received.
NOTES TO THE CONSOLIDATED FINANCIAL STATEMENTS 179
Customer deposits from settlement business 2,476.8 5,975.7 4,602.8
Overdrafts on own accounts at other banks 476.4 432.8 401.8
Issued commercial paper 238.7 391.4 330.4
Interest liabilities 36.7 32.4 34.0
Money market borrowings 29.3 137.8 73.8
Total liabilities from banking business 3,257.9 6,970.1 5,442.8
As at As at Average in 31 Dec. 2002 1 July 20021) H2/2002 2)
€m €m €m
1) The liabilities from banking business are attributable solely to companies of the Clearstream subgroup acquired as at 1 July 2002.2) The average amounts are calculated from the arithmetic mean of the end-month amounts.
Liabilities relating to the Employee Share Option Plan of the Clearstream subgroup 25.6 0
Special payments and bonuses 23.5 6.8
Vacation entitlements, flexitime and overtime credits 9.0 7.8
Tax liabilities 8.7 8.1
Reimbursements 7.5 4.3
Loan interest payable 7.2 5.7
Debtors with credits 3.4 5.6
Deferred income 1.3 2.3
Liabilities from purchase of shares of entory AG 0 2.0
Miscellaneous 18.5 15.6
Total other current liabilities 104.7 58.2
31 Dec. 2002 31 Dec. 2001€m €m

37. Interest rate gap analysis
The following table indicates the effective interest rates for the banking business as at 31 December
2002 and the period in which financial assets and liabilities reprice:
NOTES TO THE CONSOLIDATED FINANCIAL STATEMENTS180
Assets
Cash and bank balances – 91.7
Money market lendings and loans to banks and customers 2.88 2,176.9
Bonds and other fixed-income securities 5.60 –
Other assets – –
Total cash and cash equivalents 2,268.6
Liabilities
Deposits from other banks and from customers 0.36 –2,992.6
Commercial paper 1.38 –
Other liabilities – –
Total liabilities –2,992.6
Asset/liability gap –724.0
Derivatives affecting interest rate sensitivity
Pay-fixed interest rate swaps: –
Average pay rate 3.78
Average receive rate 3.34
Receive-fixed interest rate swaps: –
Average pay rate 2.85
Average receive rate 4.20
Other derivatives –
Average pay rate 3.92
Average receive rate 3.07
Total derivatives –
Net interest sensitivity gap –724.0
Effective Sightinterest rate
% €m

NOTES TO THE CONSOLIDATED FINANCIAL STATEMENTS 181
– – – – – 91.7
1,111.4 – – – – 3,288.3
– 5.1 219.8 142,1 – 367.0
– – – – 145.3 145.3
1,111.4 5.1 219.8 142.1 145.3 3,892.3
–18.9 –4.6 –3.1 – – –3,019.2
–238.7 – – – – –238.7
– – – – –320.1 –320.1
–257.6 –4.6 –3.1 – –320.1 –3,578.0
853.8 0.5 216.7 142.1 –174.8 314.3
– – 81.8 – – 81.8
1,777.5 – – – – 1,777.5
260.1 – – – – 260.1
2,037.6 – 81.8 – – 2,119.4
2,891.4 0.5 298.5 142.1 –174.8 2,433.7
Not more than More than 3 months More than 1 year Over 5 years Non-interest Total3 months but not more but not more bearing
than 12 months than 5 years€m €m €m €m €m €m
Fixed-rate instruments

Cash flow disclosures
38. Cash flow statement
The cash flow statement presents the balance of and changes in Deutsche Börse Group’s cash and
cash equivalents. In compliance with IAS 7 (Cash Flow Statements), cash flows are classified by
operating, investing and financing activities. Cash and cash equivalents are composed of cash, bank
balances, current financial instruments and the receivables from banking business classified as cur-
rent assets, net of current liabilities from banking business and the cash deposits by Eurex partici-
pants. Reflecting their consolidation, the cash flows of Cedel International S.A. and the Clearstream
subgroup have been included since 1 July 2002, and the cash flows of the Infobolsa subgroup have
been included since 1 November 2002.
39. Restrictions on cash funds
There were restricted bank balances of €86.5 million (2001: €0) as at 31 December 2002 in the
form of balances of the Clearstream subgroup in central bank accounts, most of which are based
on minimum reserve requirements. The remaining restricted bank balances are not included in
cash and cash equivalents because they were offset by current liabilities from cash deposits of Eurex
clearing participants amounting to €217.2 million (2001: €164.7 million).
40. Cash flows from operating activities
After adjustments to net profit for the period for non-cash items and the inclusion of net financial
income, cash flows from operating activities amounted to €466.2 million (2001: €248.8 million).
The entire cash provided by net financial income (net interest and investment income) is allocated
to operating activities. DVFA/SG cash flow was €467.7 million (2001: €282.6 million).
Depreciation and amortization expense contains the following items:
NOTES TO THE CONSOLIDATED FINANCIAL STATEMENTS182
Amortization of intangible assets and depreciation of plant and equipment 223.6 83.3
Write-downs of noncurrent financial assets 6.2 13.2
Total depreciation and amortization expense 229.8 96.5
2002 2001€m €m

The decrease in noncurrent provisions can be explained as follows:
Other non-cash income and expense results from the following items:
The decrease in receivables and other current assets is composed of the following items:
NOTES TO THE CONSOLIDATED FINANCIAL STATEMENTS 183
Measurement at equity:
Clearstream International S.A. 15.6 41.5
STOXX Ltd. 0.8 0.5
Specific and general valuation allowances on receivables –3.0 –6.0
Net expenses for interest rate swaps –2.5 0
Miscellaneous –2.3 0
Total other non-cash income and expense 8.6 36.0
2002 2001€m €m
Provisions for pensions and other employee benefits 31.2 –7.5 40.8 64.5
Other noncurrent provisions 26.3 4.4 7.2 37.9
Decrease in noncurrent provisions –3.1
Balance as at Increase /(decrease) First-time Balance as at 31 Dec. 2001 in cash flow consolidation and 31 Dec. 2002
other adjustments€m €m €m €m
Trade receivables 112.7 –21.5 48.1 139.3
Intragroup receivables 0.8 –0.8 0 0
Associate receivables 2.2 0.1 0 2.3
Receivables from other investors 2.9 –2.6 4.0 4.3
Other current assets 41.4 –57.9 108.4 91.9
Receivables from banking business: derivatives 0 2.2 12.4 14.6
Decrease in receivables and other current assets –80.5
Balance as at (Increase)/decrease First-time Balance as at 31 Dec. 2001 in cash flow consolidation and 31 Dec. 2002
other adjustments€m €m €m €m

The decrease in current provisions is composed of the following items:
The decrease in noncurrent liabilities is composed of the following items:
The decrease in current liabilities is composed of the following items:
41. Cash flows from investing activities
The payments to acquire noncurrent assets are composed of the following items:
Further payments to acquire noncurrent assets amounting to €11.6 million (2001: €5.4 million)
relate to non-cash items.
NOTES TO THE CONSOLIDATED FINANCIAL STATEMENTS184
Other current provisions 25.4 –2.3 5.5 28.6
Increase in current provisions –2.3
Balance as at Decrease in First-time Balance as at 31 Dec. 2001 cash flow consolidation and 31 Dec. 2002
other adjustments€m €m €m €m
Trade payables 70.2 –14.5 67.2 122.9
Payables to other investors 12.6 –9.2 2.8 6.2
Other current liabilities 58.2 –23.4 69.9 104.7
Decrease in current liabilities –47.1
Balance as at Decrease in First-time Balance as at 31 Dec. 2001 cash flow consolidation and 31 Dec. 2002
other adjustments€m €m €m €m
Other noncurrent liabilities 11.1 –16.5 13.7 8.3
Decrease in noncurrent liabilities –16.5
Balance as at Decrease in First-time Balance as at 31 Dec. 2001 cash flow consolidation and 31 Dec. 2002
other adjustments€m €m €m €m
Payments to acquire intangible assets 105.6 88.8
Payments to acquire property, plant and equipment 82.6 19.2
Payments to acquire noncurrent financial assets 1.0 5.0
Total payments to acquire noncurrent assets 189.2 113.0
2002 2001€m €m

The payments to acquire subsidiaries comprise the following items:
The payments to acquire noncurrent financial instruments amounted to €8.0 million (2001: €0).
The net cash proceeds from the sale of available-for-sale noncurrent financial instruments and
from the disposal of other items of noncurrent assets amounted to €7.6 million and €24.5 million
respectively (2001: €0 and €1.2 million respectively). These transactions relate in the most part
to the liquidation of a special fund jointly held by Clearstream Banking AG and Deutsche Börse AG
and the reinvestment of the resulting funds.
42. Cash flows from financing activities
The proceeds from Deutsche Börse AG’s capital increase, less costs incurred, amounted to €390.8
million. Deutsche Börse Group also received €8.1 million from cash contributions by external share-
holders. A dividend of €37.0 million was distributed in 2002 for 2001 (in 2001 for 2000: €30.8
million). In addition to own funds, debt was used to finance the investments mentioned above,
in particular the acquisition of Cedel International S.A., by issuing commercial paper under a €2.5
billion program launched in December 2001. The issue of commercial paper generated cash of
€286.7 million net in 2002. Long-term loans amounting to €100.0 million were raised in January
2000 to finance the merger of the business operations of Cedel International S.A. and Deutsche
Börse Clearing AG to form Clearstream International S.A. €10.0 million of these loans was contractu-
ally repaid in January 2001, and the remaining €90.0 million was repaid in January 2002. A further
€3.0 million was used to repay other noncurrent liabilities and for lease payments.
NOTES TO THE CONSOLIDATED FINANCIAL STATEMENTS 185
Cedel International S.A. 1,758.6 0
entory AG 43.6 48.9
Infobolsa S.A. 20.0 0
Filinks S.A. 1.0 0
less: cash and cash equivalents acquired –254.2 –7.9
Total payments to acquire subsidiaries 1,569.0 41.0
2002 2001€m €m

43. Reconciliation to cash and cash equivalents
The reconciliation to cash and cash equivalents is shown in the following table:
To prevent receivables and liabilities from banking business from distorting the cash flow statement,
these amounts are offset in cash and cash equivalents, even though some of the amounts involved
have an original maturity of more than three months. Exceptions to this are available-for-sale securi-
ties and derivatives, which are treated as operating or investing activities.
Bank balances as at 31 December 2002 include €87.4 million (2001: €13.4 million) held at cen-
tral banks.
NOTES TO THE CONSOLIDATED FINANCIAL STATEMENTS186
Cash and bank balances 551.8 916.9
Other current financial instruments 0 302.9
551.8 1,219.8
Reconciliation to cash and cash equivalents
Current receivables from banking business 3,085.0 6.9
less: available-for-sale fixed-income securities –31.2 0
less: available-for-sale equities and other non-fixed-income securities –11.1 0
less: derivatives –14.6 0
Current liabilities from banking business –3,257.9 0
Current liabilities from cash deposits by Eurex participants –217.2 –164.7
–447.0 –157.8
Cash and cash equivalents 104.8 1,062.0
Liquidity 31 Dec. 2002 31 Dec. 2001€m €m

Other disclosures
44. DVFA/SG earnings
Earnings according to the methodology published by the Deutsche Vereinigung für Finanzanalyse und
Anlageberatung e.V. and the Schmalenbach-Gesellschaft (DVFA/SG) were calculated as follows:
Under IAS 33, earnings per share are calculated by dividing the net profit for the year by the weight-
ed average number of shares outstanding. DVFA/SG earnings per share are calculated by dividing
consolidated net profit for the period by the weighted average number of shares outstanding.
Due to a capital increase on 19 June 2002, the number of shares rose by 9,042,880 from
102,760,000 to 111,802,880.
There were no further rights to subscribe for shares that could have potentially diluted earnings per
share at either 31 December 2002 or 31 December 2001. The reported DVFA/SG earnings per share
correspond to the IFRS/IAS earnings per share.
DVFA/SG earnings per share were calculated as follows:
NOTES TO THE CONSOLIDATED FINANCIAL STATEMENTS 187
Profit before tax from ordinary activities (EBT) 374.4 391.2
Income tax expense –141.2 –116.2
Minority interests in net profit 1.9 0.7
Net profit for the period and DVFA/SG earnings 235.1 203.7
2002 2001€m €m
Number of shares of Deutsche Börse AG as at 31 December 111,802,880 102,760,000
Average number of shares 107,615,903 99,763,014
DVFA/SG earnings per share (€) 2.18 2.04
Dividend distributed to shareholders (€m) 49.21) 37.0
Dividend per share (€) 0.441) 0.36
1) Proposal for 2002
2002 2001

NOTES TO THE CONSOLIDATED FINANCIAL STATEMENTS188
45. Segment reporting
Segment reporting is governed by the Group’s internal organizational and reporting structure, which
is broken down by markets and services into the Xetra, Eurex, Information Products, Clearstream,
Information Technology and Corporate Services segments.
Until 30 June 2002, the Clearstream segment included the 50 percent interest in the net profit of
Clearstream International S.A. for the first half of 2002. This was reported under “Income from equi-
ty investments” (H1/2002: €39.0 million, full-year 2001: €56.2 million). Since 1 July 2002, the
results of the Clearstream subgroup have been fully consolidated and are allocated as follows to the
Clearstream, Information Technology and Corporate Services segments:
Xetra Cash market: electronic order book and floor trading
Eurex Derivatives exchange
Information Products Sales of price information and information distribution
Clearstream Settlement of transactions and custody of securities
Information Technology Development, implementation and operation of technical infrastructure and provision of IT solutions
Corporate Services Group strategy, provision of centralized functions for the other segments, and integration of theentory and Clearstream subgroups
Segment Activity
Segments:
Clearstream 290.7 116.8
Information Technology 0 3.0
Corporate Services 0 –19.8
Clearstream subgroup 290.7 100.0
Sales revenue EBIT€m €m

NOTES TO THE CONSOLIDATED FINANCIAL STATEMENTS 189
In accordance with IAS 14, the Systems and Xlaunch segments were merged to form the new Infor-
mation Technology segment. The Clearstream TEC and entory activities are also combined in this
segment. The Integriertes Aktienbuch (IAB) activities were removed from Information Technology and
contributed to Deutsche Börse Computershare GmbH (DBCS). On the basis of the new extended
business model, DBCS is allocated to the Xetra segment. The corresponding activities in the acquired
entory and Clearstream subgroups were allocated to Corporate Services.
Sales revenue is presented separately by external sales revenue and internal (inter-segment) revenue.
Inter-segment services are charged on the basis of measured quantities. Services to be measured at
a market price are measured on an arm’s length basis; these include services of the Information
Technology segment, such as application development hours or data centre services. Other services
are billed to users on the basis of fully absorbed costs using an allocation key, for example the billing
of building usage at fully absorbed cost, using square metres as the basis. Services are also billed on
the basis of fixed prices between the segments, e. g. the provision of data by Eurex to Information
Products. The system used did not change between 2001 and 2002. The adjustment of the underly-
ing quantities corresponds to the relevant usage; price changes are driven by changes in costs. There
were no material changes in the aggregate required to be reported under IAS 14.75.
Deutsche Börse Group uses earnings before interest and taxes (EBIT) as a key internal earnings indi-
cator that also serves as a measure of a segment’s long-term earnings power.

NOTES TO THE CONSOLIDATED FINANCIAL STATEMENTS190
External sales revenue 210.8 243.1 331.6 268.8 121.5 109.9 277.0
Internal sales revenue 0.1 0.5 0 0 5.2 4.9 13.7
Total sales revenue 210.9 243.6 331.6 268.8 126.7 114.8 290.7
Net interest income from banking business 0 0 0 0 0 0 64.4
Own expenses capitalized 36.5 11.6 25.8 38.8 8.2 10.5 38.2
Other operating income 19.5 16.9 50.3 54.1 0.3 1.9 1.6
Fee and commission expenses from banking business 0 0 0 0 0 0 –66.3
Staff costs –17.5 –19.0 –16.8 –13.6 –9.5 –7.7 –38.6
Depreciation and amortization expense (excl. goodwill amortization) –35.6 –31.2 –27.3 –9.9 –14.7 –7.6 –28.9
Goodwill amortization 0 0 0 0 –1.9 0 –30.4
Other operating expenses –195.6 –183.1 –202.9 –229.1 –75.8 –94.3 –144.3
Total expenses – 248.7 –233.3 –247.0 –252.6 –101.9 –109.6 –308.5
Income from equity investments 0.3 0.5 0 0 1.4 1.3 39.0 56.2
Write-downs of equity investments –1.1 –0.9 –2.4 –9.8 –0.4 –1.9 0
Earnings before interest and taxes (EBIT) 17.4 38.4 158.3 99.3 34.3 17.0 125.4 56.2
Net financial income 0.3 –0.1 5.0 7.7 0.1 0 2.5 –5.6
Profit before tax from ordinary activities 17.7 38.3 163.3 107.0 34.4 17.0 127.9 50.6
Assets
Intangible assets 90.4 85.1 66.3 67.4 48.6 39.7 1,432.2
Property, plant and equipment 0.3 0.5 0.9 1.0 1.0 0.1 7.0
Other noncurrent assets 29.5 52.7 291.0 226.9 31.3 23.3 3,791.5 370.2
Total Assets 120.2 138.3 358.2 295.3 80.9 63.1 5,230.7 370.2
Provisions and liabilities 22.0 31.4 251.1 208.6 12.8 20.5 3,436.1 95.5
Net assets 98.2 106.9 107.1 86.7 68.1 42.6 1,794.6 274.7
Investments in intangible assets, property, plant and equipment 38.5 28.5 26.0 39.5 8.4 14.7 39.6
Employees 179 194 142 116 161 84 939
EBIT margin (%) 8.3 15.8 47.7 36.9 28.2 15.5 31.22) n. a.
The Reconciliation column shows:■ Elimination of intercompany sales revenue and expenses■ Assets not attributable to the segments (noncurrent financial assets less equity-accounted investments, deferred tax assets)
and certain liabilities (minority interests, tax provisions, deferred tax liabilities)
1) Formerly Systems2) EBIT margin excluding measurement at equity3) EBIT margin based on external and internal sales revenue
Xetra Eurex Information Clearstream Products
Segment reporting for the year ended 31 December
2002 2001 2002 2001 2002 2001 2002 2001€m €m €m €m €m €m €m €m

NOTES TO THE CONSOLIDATED FINANCIAL STATEMENTS 191
165.6 138.5 0 0 1,106.5 760.3 0 0 1,106.5 760.3
222.7 229.7 0 0 241.7 235.1 –241.7 –235.1 0 0
388.3 368.2 0 0 1,348.2 995.4 –241.7 –235.1 1,106.5 760.3
0 0 0 0 64.4 0 0 0 64.4 0
1.4 1.7 0 0 110.1 62.6 0 0 110.1 62.6
102.0 14.4 186.5 113.2 360.2 200.5 –289.6 –123.2 70.6 77.3
0 0 0 0 –66.3 0 0 0 –66.3 0
–110.7 –49.5 –52.2 –22.2 –245.3 –112,0 0 0 –245.3 –112.0
–38.4 –28.2 –10.0 –6.2 –154.9 –83.1 0 0 –154.9 –83.1
–36.4 –0.2 0 0 –68.7 – 0.2 0 0 –68.7 –0.2
–253.2 –218.9 –159.5 –104.5 –1.031.3 –829.9 531.3 358.3 –500.0 –471.6
– 438.7 –296.8 –221.7 –132.9 –1.566.5 –1.025.2 531.3 358.3 –1.035.2 –666.9
0 0 0.3 0 41.0 58.0 0 0 41.0 58.0
0 0 –2.3 –0.6 –6.2 –13.2 0 0 –6.2 –13.2
53.0 87.5 –37.2 –20.3 351.2 278.1 0 0 351.2 278.1
0.8 –1.0 14.5 40.1 23.2 41.1 0 0 23.2 41.1
53.8 86.5 –22.7 19.8 374.4 319.2 0 0 374.4 319.2
56.0 65.1 2.9 2.5 1,696.4 259.8 0 0 1,696.4 259.8
60.8 29.7 250.9 26.0 320.9 57.3 0 0 320.9 57.3
41.4 55.7 36.0 1,023.8 4,220.7 1,752.6 306.2 65.5 4,526.9 1,818.1
158.2 150.5 289.8 1,052.3 6,238.0 2,069.7 306.2 65.5 6,544.2 2,135.1
74.0 84.2 349.4 45.5 4,145.4 485.7 246.6 89.2 4,392.0 574.9
84.2 66.3 –59.6 1,006.8 2,092.6 1,584.0 59.6 –23.7 2,152.2 1,560.3
21.3 19.8 66.0 5.5 199.8 108.0 0 0 199.8 108.0
1,448 544 449 185 3,318 1,123 0 0 3,318 1,123
13.63) 23.8 n. a. n. a. n. a. n. a. n. a. n. a. 31.7 36.6
Information Corporate Total for all Reconciliation GroupTechnology1) Services segments
2002 2001 2002 2001 2002 2001 2002 2001 2002 2001€m €m €m €m €m €m €m €m €m €m

Exceptional impairment losses arose in the following segments:
Non-cash specific valuation allowances result from the following segments:
Assets and liabilities are allocated to the individual segments on the basis of objective criteria. Assets
that cannot be allocated to the segments, as well as minority interests, are disclosed in the reconcili-
ation column. The assets of Cedel International S.A. and its 50 percent interest in the Clearstream
subgroup, acquired in July, were allocated to the Information Technology, Clearstream and Corporate
Services segments.
The primary segments were not classified further into secondary segments (geographical segments),
because Deutsche Börse Group’s business model, and in particular that of its Xetra, Eurex, Infor-
mation Products and Clearstream segments, is focused on an internationally operating participant
base. From a price, margin and risk perspective, this means that it is unimportant whether revenue
is generated from German or non-German participants.
NOTES TO THE CONSOLIDATED FINANCIAL STATEMENTS192
Eurex 11.6 0
Information Products 5.1 2.7
Information Technology 0.9 0
Total exceptional impairment losses 17.6 2.7
2002 2001€m €m
Xetra 1.3 0.3
Information Products 0.5 3.4
Eurex 0.5 0
Information Technology 0.4 1.8
Corporate Services 0.3 0
Total specific valuation allowances 3.0 5.5
2002 2001€m €m

46. Completion of the acquisition of entory AG
The shareholders of entory AG resolved in December 2001 to accept a purchase offer by Deutsche
Börse AG. After acquiring 52 percent of the shares of entory for €50.9 million at the end of 2001,
Deutsche Börse AG acquired the remaining 48 percent of entory shares for €43.6 million in 2002.
This produced a total purchase price of €94.5 million, plus transaction costs of €1.9 million in 2001.
Due to the difficult market environment for software development, in particular in the financial ser-
vices sector, entory AG’s revenue and profitability fell well behind expectations in 2002. Although
entory’s business model and position in Deutsche Börse Group’s portfolio are still stable, the compa-
ny now operates from a lower base.
In view of these developments, an earn-out component of maximum €15.9 million agreed with the
original shareholders in addition to the aforementioned purchase price and originally due to be paid
out in September 2003 will not be paid out because the defined conditions have not been satisfied.
A provision of €5.8 million established for this earn-out component as at 31 December 2001 was
released directly against goodwill with no expense impact.
The acquisition resulted in goodwill of €84.7 million (€51.5 million in 2001 and €33.2 million
in 2002), which will be amortized over 20 years. An exceptional impairment loss of €33.0 million
was charged against this goodwill in the third quarter of 2002. This exceptional impairment loss and
the systematic goodwill amortization charge of €3.4 million are contained in the IT segment in the
preceding segment reporting.
47. Acquisition of Cedel International S.A.
Deutsche Börse AG successfully completed the acquisition of Cedel International S.A. and its 50
percent interest in Clearstream International S.A. on 11 July 2002. Deutsche Börse AG now holds
100 percent of the shares of Cedel International S.A., which it acquired for €1,758.6 million. Cedel
International S.A., Clearstream International S.A. and its subsidiaries were fully consolidated as at
1 July 2002. The transaction was financed from existing cash reserves and the issue of commercial
paper.
48. Acquisition of Infobolsa S.A.
Deutsche Börse AG acquired 50 percent of the shares of Infobolsa S.A. at a total purchase price of
€20.0 million (including a capital increase of €5.0 million) in cash on 6 November 2002, generat-
ing goodwill of €15.2 million. The acquisition was financed by the positive operating cash flow in
the fourth quarter.
NOTES TO THE CONSOLIDATED FINANCIAL STATEMENTS 193

49. Credit lines
The Group companies had the following credit lines as at 31 December 2002, none of which had
been drawn down:
A multi-currency commercial paper program was established in December 2001. This program,
which offers Deutsche Börse Group an opportunity for flexible and short-term financing at favorable
terms, involves a total facility of €2.5 billion in various currencies. Funds from the issue of program
tranches were received for the first time in July 2002. As at 31 December 2002, there were current
liabilities of €288.1 million from euro commercial paper with a remaining maturity of less than one
year.
Moody’s Investors Service and Standard & Poor’s have awarded Deutsche Börse AG long-term credit
ratings of Aa1 and AA+ respectively (31 December 2001: Aa1/no rating). Deutsche Börse AG’s com-
mercial paper program was awarded the best possible short-term rating by both Moody’s Investors
Service (P-1) and Standard & Poor’s (A-1+) (31 December 2001: no rating in either case).
Fitch and Standard & Poor’s confirmed their long-term credit ratings of AA+ for Clearstream Banking
S.A. (31 December 2001: AA+/AA+). Fitch awarded an F1+ rating to Clearstream Banking S.A.’s
commercial paper program, and Standard & Poor’s awarded an A-1+ rating (31 December 2001:
F1+/A-1+).
50. Off-balance-sheet contingencies and commitments
Eurex Clearing AGAccording to the “Clearing Conditions for Trading at Eurex Deutschland and Eurex Zürich”, transac-
tions on the Eurex exchanges must be executed between Eurex Clearing AG and a clearing member.
Deutsche Börse AG has issued a comfort letter with an unlimited term in favor of Eurex Clearing AG,
by which Deutsche Börse AG undertakes to provide Eurex Clearing AG with 80 percent of the funds
it needs to meet its obligation as the central counterparty to settle derivatives contracts traded on Eurex.
NOTES TO THE CONSOLIDATED FINANCIAL STATEMENTS194
Deutsche Börse AG Working capital – interday 400
Working capital – interday 35
Eurex Clearing AG Working capital – interday 20
Eurex settlement1) – intraday 700
Eurex settlement1) – interday 350
Clearstream Banking S.A. Working capital – interday 1,000
Immobilière Espace Kirchberg A S.A. Property finance – interday 66
Immobilière Espace Kirchberg D S.A. Property finance – interday 54
entory AG Working capital – interday 5
1) Credit lines for risks from the settlement of transactions for the Eurex companies
Company Purpose of credit line Amount in €m

To safeguard against possible losses from any default by its contracting parties, the clearing condi-
tions, as most recently amended on 27 January 2003, provide for certain conditions of membership.
Among other things, each clearing member must provide cash or securities collateral to secure its
entire contractual obligations each exchange day in the amount stipulated by Eurex Clearing AG. The
institutions must also provide clearing guarantees as the basis for the clearing business.
The risk inherent in the executed trades in the event of default by a contracting party was valued at
€10,540 million (2001: €9,246 million) at the balance sheet date.
The risk is offset by collateral in the amount of €15,851 million (2001: €14,108 million), com-
posed as follows:
There were also third-party bank guarantees for clearing members of Eurex Clearing AG amounting to
€298 million at the year-end (2001: €264 million).
Clearstream Banking AGDeutsche Börse AG has issued an unlimited letter of comfort for Clearstream Banking AG in accor-
dance with section 5 (10) of the statutes of the Einlagensicherungsfonds (deposit insurance fund),
by which Deutsche Börse has undertaken to indemnify Bundesverband Deutscher Banken e.V.
against all losses.
51. Financial risk management
Deutsche Börse Group’s cash reserves are mostly invested in unsecuritized and securitized money
market instruments with very high credit quality. The instruments used principally comprise term
money deposits with banks, some of which are protected by deposit insurance funds, and securities
repurchase agreements. The systematic use of market information systems also enables the Group
to take countermeasures at an early stage if risks arise.
Compulsory compliance with the Luxembourg capital adequacy rules ensures that the default risk is
managed in the Clearstream subgroup.
NOTES TO THE CONSOLIDATED FINANCIAL STATEMENTS 195
Cash collateral (cash deposits) 217.2 164.7 217.2 164.7
Securities and book-entry securities collateral 15,634.1 13,942.8 19,630.8 18,170.2
Total collateral 15,851.3 14,107.5 19,848.0 18,334.9
31 Dec. 2002 31 Dec. 2001 31 Dec. 2002 31 Dec. 2001Carrying amount Carrying amount Fair value Fair value
€m €m €m €m

The liable own funds calculated to determine capital adequacy for the Clearstream subgroup amount-
ed to €688.3 million (2001: €633.4 million). The minimum capital requirements under Luxembourg
GAAP are €97.1 million (2001: €145.3 million), giving Clearstream a capital adequacy of 709 per-
cent (2001: 436 percent).
The following table discloses the risk weighting of the loans extended by the Clearstream subgroup
as at 31 December 2002:
52. Other financial obligations
Group expenses in connection with long-term contracts in the coming years relating to rental agree-
ments, leases and maintenance contracts, and to other contracts, amount to €470.9 million (2001:
€279.3 million). Future obligations in subsequent years are shown in the table below:
Insurance policies result in obligations in 2003 amounting to €4.8 million (2002: €4.1 million).
In addition, a performance-related purchase price component of up to €15.9 million is contingently
payable in 2003 to original shareholders of entory AG, which was acquired in full in 2002. However,
Deutsche Börse Group expects that this contingent purchase price component will not be payable
at all.
NOTES TO THE CONSOLIDATED FINANCIAL STATEMENTS196
Up to 1 year 110.9 49.3
1 to 5 years 181.7 131.1
More than 5 years 178.3 98.9
Total future financial obligations 470.9 279.3
31 Dec. 2002 31 Dec. 2001€m €m
0% Sovereign debtors and central banks 1,352.9 –
20% Banks in OECD countries 2,228.1 445.7
Banks in non-OECD countries and maturities ≤1 year
Regional and local authorities
Financial institutions
50% Transit accounts 195.0 97.5
100% Non-banks 596.5 596.5
Total items recognized on balance sheet 4,372.5 1,139.7
Total off-balance-sheet items 10.0
Total risk-weighted capital requirement 1,149.7
Risk weighting Balance sheet item Loan principal Risk-weightedcapital requirement
€m €m

53. Finance leases
Finance leases relate to IT hardware components with a carrying amount of €3.9 million as at 31
December 2002. The hardware components are used operationally in Deutsche Börse Group and are
not sublet. The minimum lease payments are shown in the following table:
No contingent rent is provided for under the terms of the leases. The corresponding agreements do
not contain any escalation clauses. Deutsche Börse Group is entitled to purchase the hardware com-
ponents at the end of the lease term for €0.5 million. These lease agreements do not restrict the
activities of Deutsche Börse Group above and beyond the obligations set out above.
54. Executive bodies
The members of the Company’s executive bodies are listed in the “Managing Directors” and
“Supervisory Board” sections of this annual report.
The composition of Deutsche Börse AG’s Executive Board changed on 1 January 2003: Matthias
Ganz was appointed to the Executive Board as Chief Operating Officer. Frank Gerstenschläger,
Christoph Lammersdorf and Volker Potthoff left the Executive Board as at the same date, but continue
to be available to the company in senior management positions.
NOTES TO THE CONSOLIDATED FINANCIAL STATEMENTS 197
Up to 1 year 2.2 0
1 to 5 years 1.7 0
More than 5 years 0 0
Total minimum lease payments 3.9 0
Discount –0.3 0
Present value of minimum lease payments 3.6 0
31 Dec. 2002 31 Dec. 2001€m €m

55. Shareholdings of members of the Executive and Supervisory Boards
The Company was notified of the following holdings of Deutsche Börse AG shares as at 31 December
2002:
NOTES TO THE CONSOLIDATED FINANCIAL STATEMENTS198
Shareholding Shareholdingas at 31 Dec. 2002 as at 31 Dec. 2001
Executive Board
Werner G. Seifert 0 0
André Roelants 0 0
Rudolf Ferscha 18,290 18,290
Frank Gerstenschläger 745 745
Mathias Hlubek 5,000 5,000
Michael Kuhn 0 0
Christoph Lammersdorf 2,380 2,380
Volker Potthoff 660 660
Supervisory Board
Dr. Rolf-E. Breuer 0 0
Manfred Zaß 0 0
Ralf Arnemann 0 0
Herbert Bayer 0 0
Dr. Peter Coym 0 0
Leonhard H. Fischer 0 0
Uwe E. Flach 0 0
Hans-Peter Gabe 410 410
Dr. Peter Gloystein1) 0 0
Harold Hörauf 0 0
Sandra S. Jaffee 0 n. a.
Dr. Stefan Jentzsch 0 n. a.
Dr. Norbert Juchem1) 0 0
Dr. Claus Löwe1) 0 0
Hessel Lindenbergh 0 n. a.
Friedrich von Metzler 0 0
Fritz Nols 0 0
Klaus M. Patig 0 0
Roland Prantl 0 0
Sadegh Rismanchi 0 430
Gerhard B. Roggemann 0 0
Rainer Roubal 0 0
Johannes Witt 100 100
Silke Zilles 0 0
1) Left the Supervisory Board during the course of 2002. The shareholdings of former Supervisory Board members in 2002 relate to the date on which they left theSupervisory Board (see also note 57 “Related party disclosures”).

NOTES TO THE CONSOLIDATED FINANCIAL STATEMENTS 199
56. Corporate Governance
On 10 December 2002, the Executive and Supervisory Boards issued the first declaration of con-
formity in accordance with section 161 of the AktG (German Stock Corporation Act) and made it
available to shareholders on the company’s web site. The declaration of conformity is also repro-
duced in the “Corporate Governance” chapter of this annual report.
57. Related party disclosures
Related parties as defined by IAS 24 are the members of the executive bodies of Deutsche Börse AG
and those companies classified as its associates. Transactions with individuals classified as related
parties are presented in the table below:
Remuneration of the Executive Board in 2002Members of the Executive Board are paid annual compensation with a fixed and a variable compo-
nent, including stock options.
The members of the Executive Board received total compensation of €5,742 thousand in 2001.
Since the IPO on 5 February 2001, Deutsche Börse AG has established a phantom stock option
program for Executive Board members and senior executives of Deutsche Börse AG and its sub-
sidiaries. These phantom stock options have a maximum term of five years and a lock-up period of
three years. The options can be exercised in each quarter of the subsequent two years in 14-day
exercise windows. The amount of the cash payout depends on the relative performance of Deutsche
Börse AG shares versus the Dow Jones STOXX 600 Technology Index (EUR) (Return) as the bench-
mark index (€1 per 1 percent outperformance).
Werner G. Seifert 642.9 818.3 170.4 1,631.6
André Roelants2) 222.3 0 0 222.3
Rudolf Ferscha 361.9 179.0 0 540.9
Frank Gerstenschläger 331.8 347.8 34.1 713.7
Mathias Hlubek 321.4 332.5 35.3 689.2
Michael Kuhn 325.7 396.4 76.7 798.8
Christoph Lammersdorf 283.1 191.6 35.8 510.5
Volker Potthoff 333.3 268.5 51.1 652.9
Total Executive Board remuneration 2,822.4 2,534.1 403.4 5,759.9
Fixed Performance related Long-term incentive Totalcompensation1) compensation components
€ thousands € thousands € thousands € thousands
1) The fixed compensation includes the fixed salary and other taxable salary components, such as health and long-term care insurance premiums and company car arrangements.
2) Appointed to the Executive Board on 9 September 2002; the remuneration given corresponds to the amounts received between this date and the end of the fiscal year.

The following overview shows changes in the allocated stock options:
A noncurrent provision of €5.9 million (2001: €1.5 million) (of which €2,346 thousand relates to
the Executive Board (2001: €568 thousand)) was recognized within staff costs being the intrinsic
value of the allocated phantom stock options at the closing date 31 December 2002.
Employees of Clearstream International S.A. and its subsidiaries who hold options and shares from
the ESOP program will return these to Clearstream International S.A.
Remuneration of the Supervisory Board in 2002For the duration of their membership in 2002, the Supervisory Board members received a ratable
fixed remuneration without any variable performance-related components.
The members of the Supervisory Board received total remuneration of €442 thousand for their activi-
ties in 2002 (2001: €484 thousand).
NOTES TO THE CONSOLIDATED FINANCIAL STATEMENTS200
To the Executive Board 8,292 38,919 0 47,211
To other senior executives 13,360 61,126 4,253 70,233
Total stock options allocated 21,652 100,045 4,253 117,444
Number of stock Balance as at Additions Disposals Balance as atoptions allocated 31 Dec. 2001 31 Dec. 2002
Annual remuneration€ thousands
Full-year Chairman of the Supervisory Board Dr. Rolf-E. Breuer 40.0
Full-year Deputy Chairman of the Supervisory Board Manfred Zaß 30.0
Full-year members of the Supervisory Board 16 members each at €20.0 thousand 320.0
Ratable remuneration of members who left the Dr. Norbert Juchem,Supervisory Board during the year left on 15 May 2002 7.4
Dr. Peter Gloystein,left on 9 Sep. 2002 13.8
Dr. Claus Löwe,left on 19 Sep. 2002 14.3
Ratable remuneration of members who joined the Dr. Stefan Jentzsch,Supervisory Board during the year joined on 15 May 2002 12.5
Sandra S. Jaffee, 2.2joined on 22 Nov. 2002
Hessel Lindenbergh,joined on 22 Nov. 2002 2.2

Other transactions with individuals classified as related parties are shown in the following table:
Material transactions with companies classified as related parties are presented below. All trans-
actions were effected on an arm’s length basis.
NOTES TO THE CONSOLIDATED FINANCIAL STATEMENTS 201
Remuneration of the Advisory Board 90 92
Pension obligations to members of the Executive Board 5,558 4,627
Pension obligations to former members of the Executive Board or their surviving dependents 5,886 4,395
Pensions paid to former members of the Executive Board or their surviving dependents 266 248
2002 2001€ thousands € thousands
Operation of the floor trading system by Braintrade GmbH for Deutsche Börse AG 19.6 28.5
Xetra settlement fees paid by Clearstream Banking AG to Deutsche Börse AG 10.71) 20.6
Systems operating services provided by Deutsche Börse Systems AG to Clearstream Banking AG 8.41) 21.1
Operation of the Xetra trading system by Deutsche Börse AG for European Energy Exchange AG 2.6 3.5
Services provided by Deutsche Börse Systems AG:
Operation and development of Xontro software for Braintrade GmbH 31.5 30.1
Development of Eurex software for Swiss Exchange (SWX) 8.8 13.1
Operation of Xetra software for European Energy Exchange AG 0.6 0
Specific agency agreements for the provision of office and administrative services:
by Eurex Zürich AG to Swiss Exchange (SWX) 26.9 24.8
by Deutsche Börse AG to Clearstream Banking AG 7.11) 7.9
by Eurex Frankfurt AG to European Energy Exchange AG 5.1 5.1
by Swiss Exchange (SWX) to Eurex Zürich AG 3.6 1.6
by Eurex Frankfurt AG to Eurex Bonds GmbH 1.2 7.1
by Deutsche Börse AG to European Energy Exchange AG 0 1.6
by entory AG to Deutsche Börse Systems AG – 8.4
1) Amounts are shown for the first half of 2002 only.
2002 2001€m €m

58. Employees
There was an average of 2,302 full-time equivalent (FTE) employees during the year (2001: 1,030).
Please refer also to the “Employees” section in the group management report.
Frankfurt/Main, 25 February 2003
Deutsche Börse AG
NOTES TO THE CONSOLIDATED FINANCIAL STATEMENTS202
Average number of employees during the year 2,428 1,085
Employed at the balance sheet date
Deutsche Börse Group excluding Clearstream subgroup and Infobolsa S.A. 1,506 1,511
Clearstream subgroup 1,738 –
Infobolsa S.A. 74 –
Total Deutsche Börse Group 3,318 1,511
2002 2001
Werner G. Seifert
Rudolf Ferscha
Mathias Hlubek
Michael KuhnMatthias Ganz
André Roelants

AUDITORS’ REPORT 203
We have audited the consolidated financial statements, comprising the balance sheet, the income state-
ment and the statements of changes in shareholders’ equity and cash flows as well as the notes to
the financial statements prepared by Deutsche Börse AG, Frankfurt/Main, for the business year from
1 January to 31 December 2002. The preparation and the content of the consolidated financial state-
ments in accordance with International Financial Reporting Standards (IFRS) are the responsibility
of the Company’s management. Our responsibility is to express an opinion on these consolidated
financial statements based on our audit.
We conducted our audit of the consolidated financial statements in accordance with German auditing
regulations and German generally accepted standards for the audit of financial statements promulgated
by the Institut der Wirtschaftsprüfer (IDW) and in supplementary compliance with International
Standards on Auditing (ISA). Those standards require that we plan and perform the audit such
that it can be assessed with reasonable assurance whether the consolidated financial statements
are free of material misstatements. Knowledge of the business activities and the economic and legal
environment of the Group and evaluations of possible misstatements are taken into account in the
determination of audit procedures. The evidence supporting the amounts and disclosures in the
consolidated financial statements are examined on a test basis within the framework of the audit.
The audit includes assessing the accounting principles used and significant estimates made by
management, as well as evaluating the overall presentation of the consolidated financial state-
ments. We believe that our audit provides a reasonable basis for our opinion.
In our opinion, the consolidated financial statements give a true and fair view of the net assets,
financial position, results of operations and cash flows of the Group for the business year in accor-
dance with International Financial Reporting Standards.
Our audit, which also extends to the group management report prepared by the Company’s manage-
ment for the business year from 1 January to 31 December 2002, has not led to any reservations.
In our opinion, on the whole, the group management report provides a suitable understanding of the
Group’s position and suitab-ly presents the risks of future development. In addition, we confirm that
the consolidated financial statements and the group management report for the business year from
1 January to 31 December 2002 satisfy the conditions required for the Company’s exemption from
its duty to prepare consolidated financial statements and the group management report in accordance
with German law.
Frankfurt/Main, 25 February 2003
KPMG Deutsche Treuhand-Gesellschaft
Aktiengesellschaft
Wirtschaftsprüfungsgesellschaft
Auditors’ Report
Mock
German Public Auditor
Wohlmannstetter
German Public Auditor

A summary of Deutsche Börse AG’s single-entity financial statements prepared in accordance with
the provisions of the HGB (German Commercial Code) is presented below. Note that the information
is not presented in the legally required form of publication in accordance with section 328 (2) of the
HGB. A copy of the complete financial statements can be obtained from Deutsche Börse AG, Investor
Relations, 60485 Frankfurt/Main, Germany.
SINGLE-ENTITY FINANCIAL STATEMENTS – HGB204
Sales revenue 658.9 625.2
Other operating income 110.5 92.1
Total expenses –621.2 –643.5
Income from equity investments 24.7 16.0
Income from profit pooling agreements 96.6 93.4
Cost of loss absorption –4.2 –16.7
Write-downs of noncurrent financial assets and current financial instruments –48.9 –0.6
Net financial income 9.0 27.7
Profit before tax from ordinary activities 225.4 193.6
Taxes –87.2 –77.0
Net profit for the period 138.2 116.6
Income statement 2002 2001for the period 1 January to 31 December €m €m
Assets
Noncurrent assets
Intangible assets 62.7 94.0
Property, plant and equipment 24.8 26.7
Noncurrent financial assets 2,006.8 267.1
2,094.3 387.8
Current assets
Receivables and other current assets 85.8 133.6
Current financial instruments 0 300.0
Cash and bank balances 21.5 715.0
Prepaid expenses 1.0 0.8
108.3 1,149.4
Total assets 2,202.6 1,537.2
Shareholders’ equity and liabilities
Shareholders’ equity
Subscribed capital 111.8 102.8
Share premium 1,367.5 978.7
Other retained earnings 221.5 130.3
Unappropriated surplus 70.0 60.0
1,770.8 1,271.8
Provisions 95.6 85.6
Liabilities 336.2 179.8
Deferred income 0 0
431.8 265.4
Total shareholders’ equity and liabilities 2,202.6 1,537.2
Balance sheet as at 31 December 2002 2001€m €m
Single-Entity Financial Statements in Accordance with the HGB

PROPOSAL ON THE APPROPRIATION OF THE UNAPPROPRIATED SURPLUS 205
Distribution of a dividend to the shareholders on 15 May 2003 of €0.44 per no-par value share for 111,802,880 no-par value shares (in 2002 from net profit for 2001: €0.36 for 102,760,000 no-par value shares) 49.2 37.0
Appropriation to retained earnings 20.8 23.0
Unappropriated surplus 70.0 60.0
2002 2001€m €m
The Executive Board proposes that the unappropriated surplus amounting to €70.0 million reported
in the annual financial statements of Deutsche Börse AG be appropriated as follows:
Proposal on the Appropriation of the Unappropriated Surplus

APPOINTMENTS OF EXECUTIVE BOARD MEMBERS206
Executive Board Members and their Appointments to Supervisory Committees as at 31 December 2002
Werner G. SeifertChief Executive Officer Deutsche Börse AGResponsible for the Group Coordination, Group Strategy and Risk Management Division
APPOINTMENTS WITHIN THE GROUPAppointments to Supervisory Boardsa/c/e Alliance CBOT/Eurex LLC. (Member of the Supervisory Board)Deutsche Börse Systems AG (Chairman) entory AG (Chairman)Eurex Frankfurt AG (Deputy Chairman)Eurex Clearing AG (Deputy Chairman)Xlaunch AG (Chairman) Appointments to Administrative BoardsEurex Zürich AG (Vice Chairman)Other AppointmentsClearstream International S.A. (Vice Chairman of the Board of Directors)
André RoelantsDeputy Chief Executive Officer Deutsche Börse AGPresident and Chief Executive Officer Clearstream International S.A. Chief Executive Officer Clearstream Banking S.A.
APPOINTMENTS WITHIN THE GROUPAppointments to Supervisory BoardsClearstream Banking AG (Chairman)Other AppointmentsClearstream International S.A.(Member of the Board of Directors)Clearstream Banking S.A.(Member of the Board of Directors)
EXTERNAL APPOINTMENTSOther AppointmentsBlue Orchard Finance (Member of the Board of Directors)
Rudolf FerschaMember of the Executive Board Deutsche Börse AGChairman of the Executive Board Eurex Frankfurt AGChairman of the Executive Board Eurex Zürich AG Chairman of the Executive Board Eurex Clearing AGResponsible for the Eurex Division
APPOINTMENTS WITHIN THE GROUPAppointments to Supervisory BoardsDeutsche Börse Systems AG Xlaunch AG
Frank Gerstenschläger Member of the Executive Board Deutsche Börse AG(until 31 December 2002)Chairman of the Executive Board entory AGResponsible for the IT Division
Mathias HlubekMember of the Executive Board Deutsche Börse AGMember of the Executive Board Deutsche BörseSystems AGResponsible for the Finance, Corporate Center Division
APPOINTMENTS WITHIN THE GROUPAppointments to Supervisory Boardsentory AGOther AppointmentsClearstream International S.A. (Member of the Board of Directors)Clearstream Services S.A. (Member of the Board of Directors)
Michael KuhnMember of the Executive Board Deutsche Börse AG Chairman of the Executive Board Deutsche BörseSystems AGResponsible for the IT Division
APPOINTMENTS WITHIN THE GROUPAppointments to Supervisory BoardsClearstream Services S.A. entory AGEurex Frankfurt AGEurex Clearing AGAppointments to Administrative BoardsEurex Zürich AG
Christoph Lammersdorf Member of the Executive Board Deutsche Börse AG(until 31 December 2002)Responsible for the Information Products Division
APPOINTMENTS WITHIN THE GROUPAppointments to Supervisory BoardsDeutsche Börse Systems AGOther AppointmentsiBoxx Limited (Member of the Board of Directors)Infobolsa S.A. (Member of the Board of Directors)
Volker Potthoff Member of the Executive Board Deutsche Börse AG(until 31 December 2002) Responsible for the Xetra Division
APPOINTMENTS WITHIN THE GROUPAppointments to Supervisory BoardsDeutsche Börse Systems AGXlaunch AGOther AppointmentsClearstream International S.A. (Member of the Board of Directors)

Dr. Rolf-E. BreuerChairman of the Supervisory BoardChairman of the Supervisory BoardDeutsche Bank AG, Frankfurt/Main
Appointments to Supervisory BoardsBertelsmann AGDeutsche Lufthansa AGE.ON AGMünchener Rückversicherungs-Gesellschaft AG (until 6 December 2002)Siemens AG (Deputy Chairman)Appointments to Administrative BoardsCompagnie de Saint-Gobain S.A. Kreditanstalt für WiederaufbauLandwirtschaftliche Rentenbank
Manfred ZaßDeputy Chairman of the Supervisory BoardChairman of the Executive Board(until 31 January 2002)DGZ DekaBank Deutsche Kommunalbank,Frankfurt/Main Appointments to Supervisory BoardsDeutsche EuroShop AG (Chairman)
Ralf ArnemannStaff member in the Information ProductsApplications Section Deutsche Börse Systems AG, Frankfurt/Main
Herbert BayerTrade Union Secretary ofver.di e.V., Area Frankfurt/Main and Region, FB Financial Services, Frankfurt/Main Appointments to Supervisory Boardsetb AGEurohypo AG
Dr. Peter CoymMember of the Executive BoardLehman Brothers Bankhaus AG, Frankfurt/Main
Leonhard H. FischerMember of the Executive Board (until 31 October 2002)Dresdner Bank AG, Frankfurt/Main, andMember of the Executive Board (until 31 October 2002)Allianz AG, MunichAppointments to Supervisory BoardsAxel Springer Verlag AG (since 26 June 2002)Deutscher Investment-Trust Gesellschaft fürWertpapieranlagen mbH (until 30 April 2002) Eurex Clearing AG Eurex Frankfurt AG Fördergesellschaft für Börsen und Finanzmärkte in Mittel- und Osteuropa mbHItelligence AG (until 5 February 2002)K+S Aktiengesellschaft NorCom Information Technology AG (until 15 February 2002)Other AppointmentsDresdner Bank Luxembourg S.A. (until 11 Nov. 2002)(Conseil d’administration)Dresdner Kleinwort Benson North America Inc. (Chairman of the Board of Directors)Dresdner Kleinwort Wasserstein (Japan) Inc. (until 12 December 2002)(Chairman of the Board of Directors)Dresdner Kleinwort Wasserstein Group Inc. (Board of Directors)Eurex Zürich AG (Administrative Board)
Uwe E. FlachDeputy Chairman of the Executive BoardDZ BANK AG, Deutsche Zentral-Genossenschaftsbank,Frankfurt/MainAppointments to Supervisory BoardsAGAB Aktiengesellschaft für Anlagen und Beteiligungen(Chairman)Andreae-Noris-Zahn AG (Deputy Chairman)DVB Bank AG (Chairman) Stada Arzneimittel AGUnion Asset Management Holding (Deputy Chairman)Other Appointmentsdebis AirFinance B.V.
Hans-Peter GabeStaff member in the Personnel Services Section Deutsche Börse AG, Frankfurt/Main
Dr. Peter Gloystein (until 9 September 2002)Spokesman for the Executive Board (until 31 Aug. 2002)ING BHF-Bank AG, Frankfurt/MainAppointments to Supervisory BoardsAllgemeine Deutsche Direktbank AG (until 17 December 2002)BHW Invest GmbH (until 9 October 2002)STRABAG AG (until 30 September 2002)Appointments to Administrative BoardsBHF-Immobilien GmbH (Chairman) (until 31 Aug. 2002)
APPOINTMENTS OF SUPERVISORY BOARD MEMBERS 207
Supervisory Board Members and their Appointments to Supervisory Committeesas at 31 December 2002

Harold HöraufPersonally liable partnerHSBC Trinkaus & Burkhardt KGaA, DüsseldorfAppointments to Supervisory BoardsBörse Düsseldorf AG (Chairman) BVV Versicherungsverein des Bankgewerbes a.G. BVV Versorgungskasse des Bankgewerbes e.V. HSBC Trinkaus Capital Management GmbH (Chairman) INKA Internationale Kapitalanlagegesellschaft mbH(Chairman) Appointments to Administrative BoardsHSBC Investment Managers S.A. (Chairman)HSBC Trinkaus & Burkhardt (International) S.A. (Deputy Chairman)
Sandra S. Jaffee (since 22 November 2002)Executive Vice President Citibank N.A. President and CEO Global Securities Services, New York
Dr. Stefan Jentzsch (since 15 May 2002)Member of the Executive BoardHypoVereinsbank AG, MunichAppointments to Supervisory BoardsBank Austria Creditanstalt AG DAB-bank AG (Deputy Chairman) HVB Informations-Verarbeitungs-GmbH (Chairman)HVB Systems GmbH (Chairman) INDEXCHANGE Investment AG (Chairman)Infineon Technologies AGVereins- und Westbank AG (Deputy Chairman)Appointments to Administrative BoardsBank von Ernst & Cie. AG (Deputy Chairman)HVB Wealth Management Holding (Chairman)
Dr. Norbert Juchem (until 15 May 2002)Member of the Executive Board (until 31 January 2002)HypoVereinsbank AG, MunichAppointments to Supervisory Boards (until 31 January 2002)D.A.S. Deutscher Automobil Schutz AllgemeineRechtsschutz-Versicherungs-AG Fördergesellschaft für Börsen und Finanzmärkte inMittel- und Osteuropa mbH HVB Systems GmbHINDEXCHANGE Investment AG (Chairman)Appointments to Administrative Boards(until 31 January 2002)HVB Asset Management GmbHHVB Banque Luxembourg S.A.
APPOINTMENTS OF SUPERVISORY BOARD MEMBERS208
Hessel Lindenbergh (since 22 November 2002)Member of the Executive BoardING Group, AmsterdamAppointments to Supervisory Boards Banque Bruxelles Lambert S.A.(Vice Chairman)ING BHF-Bank (until 23 August 2002)(Chairman)
Dr. Claus Löwe (until 19 September 2002)Senior Partner arsago ACM GmbH, Bad Homburg
Friedrich von MetzlerPersonally liable partnerB. Metzler seel. Sohn & Co. KGaA, Frankfurt/MainAppointments to Supervisory BoardsDWS Investment GmbHMetzler-Payden LLC.Philipp Holzmann AG
Fritz NolsChairman of the Supervisory BoardFritz Nols Global Equity Services AG, Frankfurt/MainAppointments to Supervisory Boardsda Vinci Asset Management AG (Chairman)
Klaus M. PatigMember of the Executive BoardCommerzbank AG, Frankfurt/MainAppointments to Supervisory BoardsBVV Versicherungsverein des Bankgewerbes a.G.BVV Versorgungskasse des Bankgewerbes e.V. COMINVEST Asset Management GmbH (Chairman)Degussa AG efiport AGFerrostaal AG Fördergesellschaft für Börsen und Finanzmärkte inMittel- und Osteuropa mbH G. Kromschröder AG (Deputy Chairman) Pensor Pensionsfonds AG (Deputy Chairman)VINCI Deutschland GmbH Other AppointmentsCaisse Centrale de Réescompte S.A. (Président du Conseil de Surveillance)Commerz Asset Management plc. (Chairman of the Board of Directors)Jupiter International Group plc. (Chairman of the Board of Directors)Montgomery Asset Management LLC. (Member of the Board of Directors)

Roland PrantlStaff member in the Configuration Management SectionDeutsche Börse Systems AG, Frankfurt/Main
Sadegh RismanchiStaff member in the Configuration Management Section Deutsche Börse Systems AG, Frankfurt/MainAppointments to Supervisory BoardsDeutsche Börse Systems AG
Gerhard B. RoggemannMember of the Executive BoardWestdeutsche Landesbank Girozentrale,Düsseldorf/MünsterAppointments to Supervisory BoardsAXA Investment Managers Deutschland GmbH AXA Lebensversicherung AG Börse Düsseldorf AG (Deputy Chairman) Fresenius AG Hapag-Lloyd AGSolvay Deutschland GmbH VHV Autoversicherungs-AGWest Pensionsfonds AG (Deputy Chairman)West Pensionskasse AG (Deputy Chairman)WestAM Holding GmbH (Chairman)WestLB Asset Management Kapitalanlage-gesellschaft mbH (Chairman) WPS WertpapierService Bank AG Appointments to Administrative BoardsWestLB International S.A. (Chairman)Other AppointmentsBanque d’Orsay S.A. (Chairman of the Board of Directors)International University of Bremen GmbH (Board of Governors)
Rainer RoubalChairman of the Executive BoardICF Intermediär Center Frankfurt Kursmakler AG,Frankfurt/Main
Johannes WittStaff member in the Financial Accounting and Controls SectionDeutsche Börse AG, Frankfurt/Main
Silke ZillesStaff member in the IP Marketing & Sales SectionDeutsche Börse AG, Frankfurt/Main
APPOINTMENTS OF SUPERVISORY BOARD MEMBERS 209
Committee Members
Supervisory Board Finance CommitteeLeonhard H. Fischer (Chairman) Dr. Peter Gloystein (until 9 September 2002)Fritz NolsFriedrich von Metzler (since 1 November 2002)Johannes Witt
Supervisory Board Personnel CommitteeDr. Rolf-E. Breuer (Chairman) Hans-Peter GabeKlaus M. PatigFriedrich von Metzler
Supervisory Board Strategy CommitteeRalf ArnemannHerbert BayerDr. Rolf-E. Breuer (Chairman) Uwe E. FlachRainer RoubalManfred Zaß
Supervisory Board Technology CommitteeDr. Peter Coym (Chairman since 13 September 2002)Dr. Stefan Jentzsch (since 13 September 2002)Dr. Norbert Juchem (Chairman until 15 May 2002)Sadegh RismanchiGerhard B. Roggemann

INVESTOR RELATIONS / PUBLICATIONS210
Deutsche Börse provides investors with extensive
company information, current and historical
financial data as well as information on planned
corporate measures (the latter in the form of
investor presentations).
You can order or download the relevant docu-
ments at the Internet address shown below.
Most documents, including the annual report,
are available in German and English.
Investor Relations /Publications
Downloads: www.deutsche-boerse.com/ir
General documents and statistics for investors
Prospectus ■
Proposals with supporting arguments ■ ■
Voting results ■
Monthly statistics for the cash and derivatives markets ■
Factbook ■ ■
Financial reports
Annual reports 1997 to 2002 ■ ■ ■
Interim reports ■ ■
Financial calendar ■
Investor presentations
Analyst presentations ■ ■ ■
Videostreams of analyst conferences ■
Recording of analyst conference calls ■
Analyst Q&A – transcript ■
Videostreams of important speeches by the CEO and CFO ■
One-on-ones with investors/analysts ■
Presentations at investor conferences ■
Medium Internet HTML Print In persondownload
IR communications and media

FINANCIAL CALENDAR / CONTACT 211
Financial Calendar / Contact
Financial calendar of Deutsche Börse Group in 2003
27 March Annual Press Briefing for fiscal 2002
8 May Q1/2003 results
14 May Annual General Meeting
15 May Distribution of dividend for fiscal 2002
8 August Q2/2003 results
10 November Q3/2003 results
Investor RelationsEmail [email protected] +49-(0) 69-21 01- 43 21
Further copies of this annual report and subsequentinterim reports can be ordered from our PublicationsService.
Order number of this annual report 1010-1511
Phone +49-(0) 69-21 01-15 10Fax +49-(0) 69-21 01-15 11
Contact

DEUTSCHE BÖRSE GROUP WORLDWIDE212
Europe
BerlinRepresentative Office BerlinUnter den Linden 3610117 BerlinPhone +49-(0) 30-5 90 04-100
Ettlingen 1)
Ludwig-Erhard-Straße 276275 EttlingenPhone +49-(0)72 43-570-0
Frankfurt/MainNeue Börsenstraße 160487 Frankfurt/MainPhone +49-(0) 69-21 01- 0
Börsenplatz 460313 Frankfurt/MainPhone +49-(0) 69-21 01-0
Niedenau 13-191)
60325 Frankfurt/MainPhone +49-(0) 69-9 72 61-0
LondonUK Representative OfficeOne Canada SquareFloor 42Canary WharfLondon E14 5DRPhone +44-(0)20-78 62-72 20
Luxembourg 2)
3-5 Place Winston Churchill2964 LuxembourgPhone +352-45 11 01
as of July 2003:42, Av John F. Kennedy1855 Luxembourg
ParisRepresentative Office France17, rue de Surène75008 ParisPhone +33-(0)1-155 27 67 67
Zurich 3)
Selnaustrasse 30P. O. Box8021 ZurichPhone +41-(0)1-229-29 42
America
ChicagoUS Representative Office311 South Wacker DriveSuite 3750Chicago, IL 60606Phone +1-312-408-45 00
Deutsche Börse Systems Inc. 4)
141 West Jackson BoulevardSuite 1580Chicago, IL 60604Phone +1-312-408-30 88
New York 2)
350 Madison AvenueFloor 23New York, NY 10017Phone +1-(1)2 12-3 09 88 88
São Paulo 2)
Alameda Campinas 57914° andarCj 141 Edificio Silver Tower01404-000 São Paulo SPPhone +55 11 3175 1255
Asia
Dubai 2)
City Tower 2Sheikh Zayed RoadP.O. Box 27250DubaiPhone +971-(0)43 31-06 44
Hong Kong (Representative Office) 2)
2606-7 Two Exchange Square8 Connaught PlaceCentralHong KongPhone +852 25 23 07 28
1) entory2) Clearstream3) Eurex4) Deutsche Börse Systems
Deutsche Börse Group Worldwide

A a/c/e Alliance/CBOT/Eurex 63, 92Appropriation of the unappropriated surplus 173, 205
B Business model Deutsche Börse 14, 20, 28
C Capital increase 172f.CDAX® 49Cedel International > Clearstream
Central Counterparty (CCP) 50f., 91, 121Clearstream– Acquisition/integration 75, 87, 141, 145– EBIT 117– Sales revenue 115, 155f.– Segment 23, 75ff.– Transaction volume 75, 115– Volume of deposits 75, 115Commercial paper program 119, 194Contact 211, 212Corporate Governance 102f., 199,Cross-Border Securities Trading 17ff.Customers Deutsche Börse 50, 96ff.
D DAX® 48, 49, 109f.Deutsche Börse Computershare 52, 189Deutsche Börse Systems 86, 88ff., 114Dividend 118, 173
E eb.rexx® 71EBIT Deutsche Börse 116entory 86, 92f., 115, 168– Acquisition/integration 86, 145, 193Eurex Bonds 60f.Eurex Clearing 23, 51, 153, 194Eurex – Customers/participants 58, 63– Division/segment 57ff.– EBIT 116– Products 59– Sales revenue 113, 155– Trading volume 22, 59, 113f.Eurex Repo 60f.Executive Board (> also: Executive Committee)
6f., 197ff., 206 Executive bodies 98ff.Executive Committee 8, 27
G General Standard 49
I iBoxx® 71Infobolsa 43, 70, 146, 193Information Products – Business areas/products 68ff.– Customers 68– Division/segment 67ff.– EBIT 116– Sales revenue 114, 155Information Technology– Business areas/products 86– Division/segment 85ff., 189– EBIT 117– Sales revenue 112f., 155f.ISIN conversion 90f.
M MDAX® 49Management structure 8, 27, 132Managing Directors 6f., 27f.
N Neuer Markt 50
P Prime Standard 49
R Reference indices of Deutsche Börse 32Restructuring of the equity market 48ff.Risk report 125ff.
S SDAX® 49Sales revenue Deutsche Börse 36, 110Share price 32f., 120Shareholder structure 37Staff 41ff., 122f., 202StatistiX® 69Straight-through processing (STP) 26Supervisory Board 9, 104ff., 198, 207ff.
T TecDAX® 49
W Working Committees 98ff.
X Xetra– Division/segment 47ff.– EBIT 116– Participants 52– Price model 51– Sales revenue 112– Trading system 112– Trading volume 112Xetra BEST® 51Xetra Stars® 53Xlaunch 86, 88XTF Exchange Traded Funds® 53
INDEX 213
Index

Published byDeutsche Börse Group
60485 Frankfurt/Main
Germany
www.deutsche-boerse.com
March 2003
Order number: 1010-1511
PhotographyWolfgang Bellwinkel
(Cover, “Focus on Process” photography)
Andreas Herzau
(Deutsche Börse impressions
including international locations)
Barbara Klemm
(Managing Directors and Chairman
of the Supervisory Board)
List of photographsCover:
Entrance hall of Neue Börse
Frankfurt/Main, Germany
“Focus on Process” photography:
Market Supervision of Deutsche Börse
Frankfurt/Main, Germany
Boeing, Seattle, USA
Commerzbank, Frankfurt/Main, Germany
ESSO, Ingolstadt, Germany
ERCO, Lüdenscheid, Germany
Construction site, Shanghai, China
Deutsche Post, Berlin, Germany
Europoort, Rotterdam, Netherlands
Volkswagen, Dresden, Germany
LSG Sky Chefs, Munich, Germany
We thank the companies mentioned
above for their kind support.
Registered trademarksCDAX®, DAX®, eb.rexx®, EEX®, Eurex®,
iBoxx®, FWB® Frankfurter Wertpapierbörse,
MDAX®, NEMAX®, Newex®, SDAX®, SMAX®,
StatistiX®, TecDAX®, Xetra®, Xetra BEST®,
Xetra Stars® and XTF Exchange Traded
Funds® are registered trademarks of
Deutsche Börse AG.
Xentric® is a registered trademark
of Deutsche Börse Systems AG.
Vestima® is a registered trademark
of Clearstream International S.A.
Dow Jones STOXXSM and
Dow Jones Euro STOXX 50SM are
registered trademarks of STOXX Ltd.
The German version of this report is
legally binding. The company cannot
be held responsible for any misunder-
standings or misinterpretation arising
from this translation.
Reproduction – in total or in part –
only with the written permission of
the publisher.
Registration court:
Frankfurt/Main HRB 32 23 2
Inside back cover: Five-Year Review
ACKNOWLEDGEMENTS214
Acknowledgements

Annual Report 2002Focus on ProcessD
euts
che
Bör
se G
roup
Ann
ual R
epor
t 20
02
Glossary
At equity Measurement of an equity interest using the equity method,
under which the shares acquired are initially recognized at cost. In
subsequent periods, the carrying amount of the shares increases or
decreases in line with the investor’s share in the investee’s net profit
or loss for the period. Distributions received from the investee reduce
the carrying amount of the shares.
CCP ➔ Central Counterparty
CDAX® An index comprising all German securities in the ➔ Prime
and General Standards across all sectors and segments.
Central Counterparty For cash market trading: a central counterparty
for exchange and off-exchange transactions that acts as a legal inter-
mediary between trading parties, thus ensuring anonymity and mini-
mizing the default risk. For derivatives transactions ➔ clearing: a
similar function that allows Eurex market participants to settle the
entire process chain of a trade over a single system.
Clearing The netting and settlement of receivables and liabilities
arising from securities and derivatives transactions; determination
of the bilateral net debt of buyers and sellers.
Commercial paper A short-term (between 2 and 364 days) promis-
sory note of a company that is generally issued on a discount basis
and repaid at the principal amount.
Cost of capital The Weighted Average Cost of Capital (WACC) of a
company (cost of equity and debt) that reflects the ratio of available
equity to debt in an accounting period. The cost of debt is governed
by the actual funding terms, whereby interest on borrowings is tax
deductible (tax shield). The cost of equity is the after-tax return on
a share that an investor can expect using the Capital Asset Pricing
Model (CAPM).
Custody The safekeeping and administration of securities for others.
A custody account (similar to an account for money transactions) is
established for each client. This account contains details of the types,
nominal amounts or quantities, numbers, etc. of the securities held,
as well as the name and address of the account holder.
DAX® An index calculated by Deutsche Börse every 15 seconds. It
depicts the performance of the 30 German companies with the great-
est ➔ exchange volume and ➔ market capitalization (blue chips).
Derivative A highly liquid standardized financial instrument whose
value is linked to changes in the price of an ➔ underlying asset. The
most common examples of derivatives are ➔ futures and ➔ options.
eb.rexx® The Deutsche Börse index family for fixed-income securities.
The indices are based on prices on the Eurex Bonds trading plat-
form.
ETF – Exchange Traded Funds Mutual funds whose shares can be
bought or sold in continuous trading on the stock exchange, and that
track the performance of the index on which they are based. ➔ XTF
Exchange volume The total amount of trades executed for a security
or on an entire market within a defined period of time; expressed as
a currency amount (euros, US dollars, etc.).
Future A derivatives contract in which sellers agree to deliver, and
buyers agree to purchase, a certain quantity of an underlying at a
predetermined price on a specified date.
General Standard An admission standard on the Frankfurt Stock
Exchange. Unlike the ➔ Prime Standard, issuers need only meet the
minimum statutory requirements (such as an annual report and ad-hoc
disclosures) to be admitted to and remain in the General Standard.
iBoxx® Real-time indices and prices for bonds. Calculated by
Deutsche Börse on the basis of real-time prices from leading invest-
ment banks.
Market capitalization An indicator of a company’s market value that
corresponds to the market price multiplied by the number of shares
listed on the exchange. Market capitalization can be calculated for
individual sectors or for the entire equities market.
MDAX® A selection index in the ➔ Prime Standard for midcaps in
traditional sectors. Like the ➔ TecDAX®, this index ranks directly
below the equities listed in the ➔ DAX®.
Option A derivatives contract that entitles buyers and sellers to buy
(call) or sell (put) a defined quantity of an ➔ underlying at an
agreed price (exercise price) within a certain period of time or on
a specified date.
Prime Standard An admission standard on the Frankfurt Stock
Exchange that requires issuers to meet high transparency criteria.
These requirements, such as quarterly reports and the application
of internationally accepted accounting standards, exceed those of
the ➔ General Standard. A listing in the Prime Standard is a pre-
condition for admission to a Deutsche Börse selection index, such
as DAX®, MDAX®, TecDAX®, or SDAX®.
Quote book The electronic order book for Eurex Bonds, where
market makers enter binding bid and ask prices (quotes).
Rating A system for classifying corporate creditworthiness. Indepen-
dent agencies award a rating for a company’s short- or long-term
debt securities, based on the probability of future interest and princi-
pal payments. The purpose of ratings is to make the risk associated
with an investment more transparent for investors. Depending on
the agency, an AAA or Aaa rating is awarded for the highest quality;
Aa and AA also both indicate a high quality in every respect; the
suffixes 1, 2 or 3, or + and –, allow further differentiation of the
quality.
Round lot The minimum number of units in equities trading for
which an order can be placed not only in auctions, but also in
continuous trading at any time. The round lot for all equities traded
on the Frankfurt Stock Exchange and in the Xetra® trading system
is one share.
SDAX® A selection index in the ➔ Prime Standard for smallcaps in
traditional sectors. These equities rank directly below those in the
➔ MDAX®.
Settlement The completion and fulfilment of an exchange trans-
action, i. e. the delivery of the security or commodity in exchange
for the cash equivalent.
TecDAX® A selection index in the ➔ Prime Standard for the 30
largest technology equities ranking below the DAX® selection index.
Underlying A security or commodity on which an options or futures
contract is based. The underlying for options on equities is the share
itself, and the underlying for a DAX® future is the DAX index.
Xetra Stars® Deutsche Börse segments where the most attractive
international equities are traded on the fully electronic Xetra plat-
form. Dow Jones Euro STOXX 50SM shares are represented in the
Xetra European Stars, while Xetra US Stars includes US equities
from the most common stock indices.
XTF Exchange Traded Funds® A segment on the Frankfurt Stock
Exchange for continuous trading in investment fund shares. Index
funds (➔ ETF) and actively managed funds can be traded here.
2002
Deutsche Börse Group: Financial Highlights
Consolidated income statement
Sales revenue €m
Net interest income from banking business €m
Earnings before interest, taxes and goodwill amortization and write-downs (EBITA) €m
Earnings before interest and taxes (EBIT) €m
DVFA/SG earnings €m
Dividend (proposal for 2002) €m
Consolidated cash flow statement
Cash flows from operating activities €m
Cash flows from investing activities €m
Consolidated balance sheet
Total noncurrent assets €m
Shareholders’ equity €m
Technical closing date liabilites €m
Total assets €m
Performance indicators
DVFA/SG earnings per share €
Dividend per share €
DVFA/SG cash flow per share €
Employees (annual average)
Sales revenue per employee € thousands
EBIT (excluding share of results of associated companies) / sales revenue %
Return on equity 1) %
Equity ratio %
Market indicators
Xetra
Number of transactions thousands
Order book turnover €m
Participants (at 31 December)
Floor trading
Number of transactions thousands
Order book turnover €m
Eurex
Number of transactions thousands
Participants (at 31 December)
Clearstream
Number of transactions national thousands
international thousands
Securities deposits (at 31 December) national €bn
international €bn
Deutsche Börse share price 2)
Opening price 2) €
High €
Low €
Closing price €
1) Based on DVFA/SG earnings2) Closing price on preceding trading day

Sales Revenue by Segmentin €m
1) Deutsche Börse Systems and Xlaunch2) Deutsche Börse Systems, entory, Clearstream TEC and Xlaunch
Xetra
2001 2002
Eurex
2001 2002
InformationProducts
2001 2002
Clearstream
2001 2002
InformationTechnology
2001
Highlights by Quarterin €m
2002 2001 2002 2001 2002 2001 2002 2001 2002 2001Q1 Q2 Q3 Q4 FY
Sales revenue 204.9 191.7 205.3 182.9 355.7 185.5 340.6 200.2 1,106.5 760.3
Net interest income from banking business 0 0 0 0 32.6 0 31.8 0 64.4 0
Earnings before interest,taxes and goodwill amortization and write-downs (EBITA) 88.4 90.2 81.2 70.3 136.7 64.8 113.6 53.0 419.9 278.3
Earnings before interest and taxes (EBIT) 87.4 90.2 80.0 70.3 87.9 64.8 95.9 52.8 351.2 278.1
Profit before tax from ordinary activities (EBT) 95.0 98.8 89.4 83.5 92.2 75.3 97.8 61.6 374.4 319.2
DVFA/SG earnings 64.6 65.2 59.7 52.2 38.5 49.4 72.3 36.9 235.1 203.7
243.1
+23%
+20%
210.8
268.8
331.6
109.9121.5
277.0
138.51)
165.62)
0
–13%
+11%
1) Based on DVFA/SG earnings2) Adjusted for the 10-for-1 stock split implemented on 1 June 20013) Closing price on preceding trading day4) Issue price on 5 February 2001
Deutsche Börse Group: Financial Highlights
Quarters 1 to 4 – Sales revenue by segment – Share price
➔
Deutsche Börse Group: Five-Year Review
Consolidated income statement
Sales revenue 2) €m 455.1 599.0 648.9 760.3 1,106.5
Net interest income from banking business €m 0 0 0 0 64.4
Other operating income €m 27.8 45.9 95.7 77.3 70.6
Fee and commission expense from banking business €m 0 0 0 0 –66.3
Total expenses less own expenses capitalized 2) €m –373.0 –533.0 –591.6 –604.3 –858.8
Income from equity investments (net) €m –3.7 –5.7 63.5 44.8 34.8
Earnings before interest and taxes (EBIT) €m 106.3 106.2 216.5 278.1 351.2
Net financial income €m 17.0 25.3 2.4 41.1 23.2
Profit before tax from ordinary activities €m 123.3 131.5 218.9 319.2 374.4
DVFA/SG earnings 3) €m 53.4 70.0 142.9 203.7 235.1
Dividend (proposal for 2002) €m 31.1 58.7 30.8 37.0 49.2
Consolidated cash flow statement
Cash flows from operating activities €m 155.0 168.4 101.5 248.8 466.2
Cash flows from investing activities €m –82.5 –137.9 –252.3 –152.8 –1,734.1
Consolidated balance sheet
Noncurrent assets (excluding miscellaneous and deferred tax assets) €m 193.3 260.0 620.3 737.2 2,656.4
Receivables over 1 year including deferred tax assets €m 10.7 20.7 12.5 17.5 22.0
Receivables from banking business €m 978.6 2,907.1 0 6.9 3,085.0
Restricted bank balances €m 93.8 450.1 71.1 164.7 303.7
Other cash and bank balances €m 55.9 102.1 69.5 1,055.1 248.1
Other current assets €m 122.0 165.9 149.3 153.7 229.0
Shareholders’ equity 3) €m 218.5 257.9 419.8 1,560.3 2,152.2
Minority interests €m 3.2 3.8 4.3 10.6 23.1
Noncurrent interest bearing liabilities €m 0 0 90.0 0 9.2
Other noncurrent provisions and liabilities €m 116.4 137.4 84.3 116.2 210.0
Technical closing date liabilities 4) €m 964.7 3,284.6 71.1 164.7 3,475.1
Other current provisions and liabilities €m 151.4 222.2 253.2 283.3 674.6
Total assets 3) €m 1,454.2 3,905.9 922.7 2,135.1 6,544.2
Balance sheet performance indicators
Trade creditors 1 days 28 37 33 28 33
Trade creditors 2 days 32 42 39 33 38
Trade creditors ratio % 20 24 27 29 47
Equity ratio 1 % 30 23 41 203 42
Equity ratio 2 % 68 64 56 220 61
Debt / equity ratio % 31 36 30 14 22
Liabilities structure % 57 62 59 71 75
Cash ratio % 37 46 27 372 37
Current ratio % 117 121 86 430 72
Debt coverage % 66 55 70 101 67
Equity / net tangible assets 6.4 6.6 8.5 37.1 7.9
19981) 19991) 2000 2001 20021) 19981) 19991) 2000 2001 20021)
1) Deutsche Börse Clearing AG was fully consolidated until 1999. The 50 percent interest in Clearstream International S.A. was carried at equity following the merger of Deutsche Börse Clearing AG with the operations of Cedel International S.A. to form Clearstream International S.A. Following the acquisition of Cedel International S.A., Clearstream International S.A. has been fully consolidated since 1 July 2002.
2) Excluding net license fees, which were recognized until 20003) Restated to reflect changes in accounting policies 4) Technical closing date liabilities include liabilities from banking business of Deutsche Börse Clearing and Clearstream International S.A.,
and the Eurex Clearing members’ cash deposits.5) Adjusted for the 10-for-1 stock split implemented on 1 June 2001
Deutsche Börse Group: Five-Year Review
Performance indicators
EBIT (excluding share of results of associated companies) / sales revenue % 24 19 24 31 29
Cash flow 1 return on investment (CF1 ROI) % 36 32 35 20 20
Cash flow 2 return on investment (CF2 ROI) % 37 32 35 21 19
DVFA/SG earnings per share 5) € 0.73 0.95 1.95 2.04 2.18
Dividend per share 5) € 0.42 0.80 0.30 0.36 0.44
Operating cash flow per share 5) € 2.11 2.29 1.38 2.49 4.33
Return on equity % 27 29 40 16 13
Staff costs / total revenue % 20 17 14 12 18
Employees (FTEs, annual average) 1,042 1,143 894 1,030 2,302
Sales revenue per employee 2) € thousands 437 524 726 738 481
Market indicators
Xetra
Number of transactions thousands 7,150 15,785 39,009 49,719 60,001
Order book volume €m 403,302 514,959 980,552 958,407 876,179
Participants (at 31 December) 280 404 431 413 359
Floor
Number of transactions thousands 47,159 73,364 163,914 124,342 86,653
Order book volume €m 207,998 400,479 438,712 235,780 157,760
Eurex
Number of traded contracts millions 248.2 379.1 454.1 674.2 801.2
Participants (at 31 December) 313 414 429 427 424

Sales Revenue by Segmentin €m
1) Deutsche Börse Systems and Xlaunch2) Deutsche Börse Systems, entory, Clearstream TEC and Xlaunch
Xetra
2001 2002
Eurex
2001 2002
InformationProducts
2001 2002
Clearstream
2001 2002
InformationTechnology
2001
Highlights by Quarterin €m
2002 2001 2002 2001 2002 2001 2002 2001 2002 2001Q1 Q2 Q3 Q4 FY
Sales revenue 204.9 191.7 205.3 182.9 355.7 185.5 340.6 200.2 1,106.5 760.3
Net interest income from banking business 0 0 0 0 32.6 0 31.8 0 64.4 0
Earnings before interest,taxes and goodwill amortization and write-downs (EBITA) 88.4 90.2 81.2 70.3 136.7 64.8 113.6 53.0 419.9 278.3
Earnings before interest and taxes (EBIT) 87.4 90.2 80.0 70.3 87.9 64.8 95.9 52.8 351.2 278.1
Profit before tax from ordinary activities (EBT) 95.0 98.8 89.4 83.5 92.2 75.3 97.8 61.6 374.4 319.2
DVFA/SG earnings 64.6 65.2 59.7 52.2 38.5 49.4 72.3 36.9 235.1 203.7
243.1
+23%
+20%
210.8
268.8
331.6
109.9121.5
277.0
138.51)
165.62)
0
–13%
+11%
Consolidated income statement
Sales revenue €m 1,106.5 760.3 46
Net interest income from banking business €m 64.4 0 –
Earnings before interest, taxes and goodwill amortization and write-downs (EBITA) €m 419.9 278.3 51
Earnings before interest and taxes (EBIT) €m 351.2 278.1 26
DVFA/SG earnings €m 235.1 203.7 15
Dividend (proposal for 2002) €m 49.2 37.0 33
Consolidated cash flow statement
Cash flows from operating activities €m 466.2 248.8 87
Cash flows from investing activities €m –1,734.1 –152.8 1,035
Consolidated balance sheet
Total noncurrent assets €m 2,656.4 737.2 260
Shareholders’ equity €m 2,152.2 1,560.3 38
Technical closing date liabilites €m 3,475.1 164.7 2,010
Total assets €m 6,544.2 2,135.1 207
Performance indicators
DVFA/SG earnings per share € 2.18 2.04 7
Dividend per share € 0.44 0.36 22
DVFA/SG cash flow per share € 4.35 2.83 55
Employees (annual average) 2,302 1,030 123
Sales revenue per employee € thousands 481 738 –35
EBIT (excluding share of results of associated companies) / sales revenue % 28.6 30.7 –7
Return on equity 1) % 12.7 15.9 –20
Equity ratio % 70.1 79.2 –11
Market indicators
Xetra
Number of transactions thousands 60,001 49,719 21
Order book turnover €m 876,179 958,407 –9
Participants (at 31 December) 359 413 –13
Floor trading
Number of transactions thousands 86,653 124,342 –30
Order book turnover €m 157,760 235,780 –33
Eurex
Number of transactions thousands 801,201 674,158 19
Participants (at 31 December) 424 427 –1
Clearstream
Number of transactions national thousands 67.0 66.2 1
international thousands 15.2 19.8 –23
Securities deposits (at 31 December) national €bn 4,407 4,838 –9
international €bn 2,737 2,830 –3
Deutsche Börse share price 2)
Opening price 3) € 43.21 33.50 4) 29
High € 51.50 44.93
Low € 32.40 29.77
Closing price € 38.16 43.21 –12
Change2002 2001 %
19981) 19991) 2000 2001 20021)
1) Deutsche Börse Clearing AG was fully consolidated until 1999. The 50 percent interest in Clearstream International S.A. was carried at equity following the merger of Deutsche Börse Clearing AG with the operations of Cedel International S.A. to form Clearstream International S.A. Following the acquisition of Cedel International S.A., Clearstream International S.A. has been fully consolidated since 1 July 2002.
2) Excluding net license fees, which were recognized until 20003) Restated to reflect changes in accounting policies 4) Technical closing date liabilities include liabilities from banking business of Deutsche Börse Clearing and Clearstream International S.A.,
and the Eurex Clearing members’ cash deposits.5) Adjusted for the 10-for-1 stock split implemented on 1 June 2001
Deutsche Börse Group: Five-Year Review
Performance indicators
EBIT (excluding share of results of associated companies) / sales revenue % 24 19 24 31 29
Cash flow 1 return on investment (CF1 ROI) % 36 32 35 20 20
Cash flow 2 return on investment (CF2 ROI) % 37 32 35 21 19
DVFA/SG earnings per share 5) € 0.73 0.95 1.95 2.04 2.18
Dividend per share 5) € 0.42 0.80 0.30 0.36 0.44
Operating cash flow per share 5) € 2.11 2.29 1.38 2.49 4.33
Return on equity % 27 29 40 16 13
Staff costs / total revenue % 20 17 14 12 18
Employees (FTEs, annual average) 1,042 1,143 894 1,030 2,302
Sales revenue per employee 2) € thousands 437 524 726 738 481
Market indicators
Xetra
Number of transactions thousands 7,150 15,785 39,009 49,719 60,001
Order book volume €m 403,302 514,959 980,552 958,407 876,179
Participants (at 31 December) 280 404 431 413 359
Floor
Number of transactions thousands 47,159 73,364 163,914 124,342 86,653
Order book volume €m 207,998 400,479 438,712 235,780 157,760
Eurex
Number of traded contracts millions 248.2 379.1 454.1 674.2 801.2
Participants (at 31 December) 313 414 429 427 424

Annual Report 2002Focus on ProcessD
euts
che
Bör
se G
roup
Ann
ual R
epor
t 20
02
Glossary
At equity Measurement of an equity interest using the equity method,
under which the shares acquired are initially recognized at cost. In
subsequent periods, the carrying amount of the shares increases or
decreases in line with the investor’s share in the investee’s net profit
or loss for the period. Distributions received from the investee reduce
the carrying amount of the shares.
CCP ➔ Central Counterparty
CDAX® An index comprising all German securities in the ➔ Prime
and General Standards across all sectors and segments.
Central Counterparty For cash market trading: a central counterparty
for exchange and off-exchange transactions that acts as a legal inter-
mediary between trading parties, thus ensuring anonymity and mini-
mizing the default risk. For derivatives transactions ➔ clearing: a
similar function that allows Eurex market participants to settle the
entire process chain of a trade over a single system.
Clearing The netting and settlement of receivables and liabilities
arising from securities and derivatives transactions; determination
of the bilateral net debt of buyers and sellers.
Commercial paper A short-term (between 2 and 364 days) promis-
sory note of a company that is generally issued on a discount basis
and repaid at the principal amount.
Cost of capital The Weighted Average Cost of Capital (WACC) of a
company (cost of equity and debt) that reflects the ratio of available
equity to debt in an accounting period. The cost of debt is governed
by the actual funding terms, whereby interest on borrowings is tax
deductible (tax shield). The cost of equity is the after-tax return on
a share that an investor can expect using the Capital Asset Pricing
Model (CAPM).
Custody The safekeeping and administration of securities for others.
A custody account (similar to an account for money transactions) is
established for each client. This account contains details of the types,
nominal amounts or quantities, numbers, etc. of the securities held,
as well as the name and address of the account holder.
DAX® An index calculated by Deutsche Börse every 15 seconds. It
depicts the performance of the 30 German companies with the great-
est ➔ exchange volume and ➔ market capitalization (blue chips).
Derivative A highly liquid standardized financial instrument whose
value is linked to changes in the price of an ➔ underlying asset. The
most common examples of derivatives are ➔ futures and ➔ options.
eb.rexx® The Deutsche Börse index family for fixed-income securities.
The indices are based on prices on the Eurex Bonds trading plat-
form.
ETF – Exchange Traded Funds Mutual funds whose shares can be
bought or sold in continuous trading on the stock exchange, and that
track the performance of the index on which they are based. ➔ XTF
Exchange volume The total amount of trades executed for a security
or on an entire market within a defined period of time; expressed as
a currency amount (euros, US dollars, etc.).
Future A derivatives contract in which sellers agree to deliver, and
buyers agree to purchase, a certain quantity of an underlying at a
predetermined price on a specified date.
General Standard An admission standard on the Frankfurt Stock
Exchange. Unlike the ➔ Prime Standard, issuers need only meet the
minimum statutory requirements (such as an annual report and ad-hoc
disclosures) to be admitted to and remain in the General Standard.
iBoxx® Real-time indices and prices for bonds. Calculated by
Deutsche Börse on the basis of real-time prices from leading invest-
ment banks.
Market capitalization An indicator of a company’s market value that
corresponds to the market price multiplied by the number of shares
listed on the exchange. Market capitalization can be calculated for
individual sectors or for the entire equities market.
MDAX® A selection index in the ➔ Prime Standard for midcaps in
traditional sectors. Like the ➔ TecDAX®, this index ranks directly
below the equities listed in the ➔ DAX®.
Option A derivatives contract that entitles buyers and sellers to buy
(call) or sell (put) a defined quantity of an ➔ underlying at an
agreed price (exercise price) within a certain period of time or on
a specified date.
Prime Standard An admission standard on the Frankfurt Stock
Exchange that requires issuers to meet high transparency criteria.
These requirements, such as quarterly reports and the application
of internationally accepted accounting standards, exceed those of
the ➔ General Standard. A listing in the Prime Standard is a pre-
condition for admission to a Deutsche Börse selection index, such
as DAX®, MDAX®, TecDAX®, or SDAX®.
Quote book The electronic order book for Eurex Bonds, where
market makers enter binding bid and ask prices (quotes).
Rating A system for classifying corporate creditworthiness. Indepen-
dent agencies award a rating for a company’s short- or long-term
debt securities, based on the probability of future interest and princi-
pal payments. The purpose of ratings is to make the risk associated
with an investment more transparent for investors. Depending on
the agency, an AAA or Aaa rating is awarded for the highest quality;
Aa and AA also both indicate a high quality in every respect; the
suffixes 1, 2 or 3, or + and –, allow further differentiation of the
quality.
Round lot The minimum number of units in equities trading for
which an order can be placed not only in auctions, but also in
continuous trading at any time. The round lot for all equities traded
on the Frankfurt Stock Exchange and in the Xetra® trading system
is one share.
SDAX® A selection index in the ➔ Prime Standard for smallcaps in
traditional sectors. These equities rank directly below those in the
➔ MDAX®.
Settlement The completion and fulfilment of an exchange trans-
action, i. e. the delivery of the security or commodity in exchange
for the cash equivalent.
TecDAX® A selection index in the ➔ Prime Standard for the 30
largest technology equities ranking below the DAX® selection index.
Underlying A security or commodity on which an options or futures
contract is based. The underlying for options on equities is the share
itself, and the underlying for a DAX® future is the DAX index.
Xetra Stars® Deutsche Börse segments where the most attractive
international equities are traded on the fully electronic Xetra plat-
form. Dow Jones Euro STOXX 50SM shares are represented in the
Xetra European Stars, while Xetra US Stars includes US equities
from the most common stock indices.
XTF Exchange Traded Funds® A segment on the Frankfurt Stock
Exchange for continuous trading in investment fund shares. Index
funds (➔ ETF) and actively managed funds can be traded here.
2002
Deutsche Börse Group: Financial Highlights
Consolidated income statement
Sales revenue €m
Net interest income from banking business €m
Earnings before interest, taxes and goodwill amortization and write-downs (EBITA) €m
Earnings before interest and taxes (EBIT) €m
DVFA/SG earnings €m
Dividend (proposal for 2002) €m
Consolidated cash flow statement
Cash flows from operating activities €m
Cash flows from investing activities €m
Consolidated balance sheet
Total noncurrent assets €m
Shareholders’ equity €m
Technical closing date liabilites €m
Total assets €m
Performance indicators
DVFA/SG earnings per share €
Dividend per share €
DVFA/SG cash flow per share €
Employees (annual average)
Sales revenue per employee € thousands
EBIT (excluding share of results of associated companies) / sales revenue %
Return on equity 1) %
Equity ratio %
Market indicators
Xetra
Number of transactions thousands
Order book turnover €m
Participants (at 31 December)
Floor trading
Number of transactions thousands
Order book turnover €m
Eurex
Number of transactions thousands
Participants (at 31 December)
Clearstream
Number of transactions national thousands
international thousands
Securities deposits (at 31 December) national €bn
international €bn
Deutsche Börse share price 2)
Opening price 2) €
High €
Low €
Closing price €
1) Based on DVFA/SG earnings2) Closing price on preceding trading day