Embed Size (px)
Citation preview

2012 Second Quarter Report
Discover Solium Capital

Management’s discussion and analysis
Condensed consolidated interim fi nancial statements
Notes to Condensed consolidated interim fi nancial statements
Corporate information
3
13
17
27
Contents
2012 Second Quarter Report

Management’s discussion and analysisFor the quarter ended June 30, 2012
This Management’s Discussion and Analysis (“MD&A”) of Solium Capital Inc. (“Solium” or the “Company”) for the quarter ended June 30, 2012
is dated August 8, 2012. This MD&A should be read in conjunction with the unaudited Condensed Consolidated Interim Financial Statements
for the three and six month periods ended June 30, 2012, the Company’s audited Consolidated Financial Statements and the accompanying
notes for the year ended December 31, 2011, and the MD&A included in the Company’s 2011 Annual Report.
Additional information relating to the Company is available on SEDAR at www.sedar.com under Solium Capital Inc.
All dollar amounts discussed in the MD&A are in Canadian dollars unless otherwise specifi ed.
Special note regarding forward-looking statements
Certain statements included or incorporated by reference in this MD&A constitute forward-looking statements or forward-looking information
under applicable securities legislation. Forward-looking statements or information typically contain statements with words such as “anticipate”,
“believe”, “expect”, “plan”, “intend”, “estimate”, “propose”, or similar words suggesting future outcomes or statements regarding an outlook.
Forward looking statements or information in this MD&A include but are not limited to expectations regarding future revenues, earnings, capital
expenditures, and operating and other costs; business strategy and objectives; market trends; acquisition and disposition plans; the suffi ciency
of cash and working capital for future operations; the timing and the completion of various development projects; and the acquisition of
intellectual property from business combinations.
Such forward-looking statements or information are based on a number of assumptions which may prove to be incorrect. In addition to
other assumptions identifi ed in this MD&A, assumptions have been made regarding, among other things, the Company’s transition to new
products and releases; the number of customer transactions; the length of the sales cycles; the competitive environment; the ability to
maintain or accurately forecast revenue from the Company’s products or services; the ability of the Company to identify, hire, train, motivate
and retain qualifi ed personnel; currency fl uctuations; the ability of the Company to develop, introduce and implement new products as well
as enhancements or improvements for existing products that respond, in a timely fashion, to customer/product requirements and rapid
technological change; risks associated with operations; the impact of any changes in the laws and regulations in the jurisdictions in which the
Company operates; the effect of new accounting pronouncements or guidance; and the ability of the Company to make all required payments
pursuant to its agreements with Computershare Inc.
Although the Company believes that the expectations refl ected in such forward-looking statements or information are reasonable, undue
reliance should not be placed on forward looking statements or information because the Company can give no assurance that such
expectations will prove to be correct. The forward-looking statements and information are based on Solium’s current expectations, estimates
and projections, and are subject to a number of signifi cant risks and uncertainties that could cause actual results to differ materially from those
anticipated. Such risks and uncertainties include, among others, general business and economic conditions; the overall performance of stock
market(s); actions of competitors and partners; the regulatory environment; the corporate governance environment and regulatory reporting
requirements for Solium’s clients; product capability and acceptance; the Company’s ability to generate suffi cient cash fl ow from operations
to meet its current and future obligations; and the Company’s ability to access external sources of fi nancing if required. A more detailed
assessment of the risks that could cause actual results to materially differ from current expectations is contained in the Risk Assessment
section of this MD&A. The foregoing is not exhaustive and other risks are detailed from time to time in other continuous disclosure fi lings of the
Company. Should one or more of these risks or uncertainties materialize, or should assumptions underlying the forward looking statements
or information prove incorrect, actual results may vary materially from those described herein as anticipated, believed, estimated or expected.
These forward looking statements and future-oriented fi nancial information contained herein are made as of the date of this MD&A. The
Company uses future-oriented fi nancial information for budgeting and planning purposes and the information may not be appropriate for other
purposes.
3Management’s discussion and analysis

Overview of the company
Solium is a software-as-a-service company and is a leading global provider of web-based stock plan administration technology and services.
Solium’s software helps companies automate and manage their stock option and purchase plans, by providing unrivalled comprehensive
regulatory and fi nancial reporting capabilities.
Solium’s technology provides functionality that streamlines a client’s workfl ow relating to the issuance of incentives, the exercise of incentives,
reporting of incentives and day-to-day maintenance of the incentives database. The technology provides constant online access to reports for
securities regulators, internal management and fi nancial disclosure purposes.
Solium’s solutions empower plan participants by providing online access to participants to review their stock incentive portfolios from any
Internet-connected computer, anywhere in the world. Plan participants have direct access to the fi nancial markets through Solium’s
brokerage partners.
Revenue is primarily earned on a recurring basis; derived from corporate clients, their associated employee plan participants, and Solium’s
brokerage partners. From corporate clients, Solium receives recurring access, subscription or maintenance fees. From associated employee
plan participants, revenue is continuously generated in the form of transaction and money movement fees. From brokerage partners, revenue
is continuously generated through fees that are based on the share transactions executed by the brokerage partners for Solium’s participants.
In addition, the Company receives one-time (non-recurring) revenue for the implementation of plans onto the system for new clients, ad hoc
customization and consulting.
Overall performance
The Company’s revenues from operations for the three and six month periods ended June 30, 2012 were consistent with those in the same
periods of 2011. Revenue was $11.9 million for the second quarter of 2012 (2011: $11.4 million) and $24.6 million for the six month period
ended June 30, 2012 (2011: $24.5 million). Earnings from operations increased to $1.7 million for the second quarter of 2012 (2011: $1.1
million) and to $4.6 million for the six month period ended June 30, 2012 (2011: $4.0 million).
Excluding the impact of the Computershare matter discussed below, adjusted EBITDA increased to $2.7 million in the second quarter of 2012
(2011: $2.2 million) and to $6.8 million in the six month period ended June 30, 2012 (2011: $6.2 million), and net earnings were $0.5 million in
the second quarter of 2012 (2011: $0.5 million) and $2.5 million in the six month period ended June 30, 2012 (2011: $2.8 million).
Inclusive of all items, net earnings were $8.3 million in the second quarter of 2012 (2011: $0.5 million) and $10.3 million in the six month period
ended June 30, 2012 (2011: $2.8 million).
The key factors affecting the results in the three and six month periods ended June 30, 2012 are:
• Computershare - On April 3, 2012, the Company received notice from Computershare of its decision to retain a stock options and
restricted stock administration business that it acquired on December 31, 2011 as part of a larger transaction. As a consequence of this
decision, effective April 3, 2012, the U.S. $17.3 million amount due to Computershare as at December 31, 2011 was extinguished and
ceased to be an obligation of Solium. The impact of this on the Company’s second quarter income statement is a gain of $15.6 million
partially offset by a charge to intangible assets and goodwill of $7.8 million.
• Strategic initiatives - The Company incurred signifi cant expenses during the fi rst six months of 2012 in establishing its new operations
in the UK, obtaining a brokerage license in Canada, and pursuing other potential business opportunities.
• SRED ITC’s - In the second quarter of 2012, the Company applied for investment tax credits under the Canadian and Alberta
governments’ scientifi c and experimental development (“SRED”) programs. The application represented a claim for 2011 SRED
expenditures. Based on the history of successful SRED claims made in previous years, the Company accrued $645,000 as a reduction
to operating expenses in the second quarter of 2012 (2011: $Nil), and $1.3 million in the six months ended June 30, 2012 (2011: $Nil)
relating to SRED claims.
4 Solium Capital 2012 Second Quarter Report
Management’s discussion and analysis

• CapMX Acquisition - On May 15, 2012, the Company closed the acquisition of the CapMX business of SVB Analytics, Inc. CapMX
provides record keeping services for grant based incentive plans and awards to private companies and venture capital investors in the
United States.
Results during the three and six month periods ended June 30, 2012 were as follows:
• Revenue grew by 5% to $11,916,176 in the second quarter of 2012 (2011: $11,400,255) and by 0.5% to $24,568,848 in the six month
period ended June 30, 2012 (2011: $24,457,134).
• Operating expenses decreased by 0.1% to $10,256,472 in the second quarter of 2012 (2011: $10,267,924) and decreased by 2% to
$19,974,724 in the six month period ended June 30, 2012 (2011: $20,423,665).
• Adjusted EBITDA increased by 21% to $2,683,364 in the second quarter of 2012 (2011: $2,214,296) and by 11% to $6,828,062 in the
six month period ended June 30, 2012 (2011: $6,176,472).
• Excluding the impact of the Computershare matter, net earnings decreased by 9% to $495,277 in the second quarter of 2012 (2011:
$546,688) and by 12% to $2,464,499 in the six month period ended June 30, 2012 (2011: $2,806,112).
• Excluding the impact of the Computershare matter, net earnings per share decreased by 8% to $0.012 in the second quarter of 2012
(2011: $0.013) and by 12% to $0.059 in the six month period ended June 30, 2012 (2011: $0.067).
Results by geographic segment during the second quarter of 2012 were as follows:
• Canadian revenue grew by 6% to $5,868,494 in second quarter of 2012 (2011: $5,511,581) and by 4% to $12,557,363 in the six month
period ended June 30, 2012 (2011: $12,102,378).
• U.S. revenue grew by 3% to $6,047,682 in the second quarter of 2012 (2011: $5,888,674) and decreased by 3% to $12,011,485 in the
six month period ended June 30, 2012 (2011: $12,354,756).
• Adjusted EBITDA in Canada decreased by 10% to $1,305,237 in the second quarter of 2012 (2011: $1,454,703) and by 4% to
$3,772,120 in the six month period ended June 30, 2012 (2011: $3,941,803).
• Adjusted EBITDA in the U.S. increased by 81% to $1,378,127 in the second quarter of 2012 (2011: $759,593) and by 37% to
$3,055,942 in the six month period ended June 30, 2012 (2011: $2,234,668).
• Excluding the impact of the Computershare matter, net earnings in Canada decreased by 41% to $595,282 in the second quarter of 2012
(2011: $1,016,559) and by 27% to $2,237,702 in the six month period ended June 30, 2012 (2011: $3,059,448).
• Excluding the impact of the Computershare matter, net loss in the U.S. decreased by 79% to $100,005 in the second quarter of 2012
(2011: loss $469,871) and net earnings increased by 190% to $226,797 in the six month period ended June 30, 2012 (2011: loss
$253,336).
Results from operations
Revenue
Revenue was $11,916,176 in the second quarter of 2012 (2011: $11,400,255), and $24,568,848 in the six month period ended June 30, 2012
(2011: $24,457,134). This represents an increase of $515,921 over the results from the second quarter of 2011 and $111,714 over the results
from the six month period ended June 30, 2011.
Revenue from Canadian operations was $5,868,494 in the second quarter of 2012 (2011: $5,511,581) and $12,557,363 in the six month
period ended June 30, 2012 (2011: $12,102,378), while revenue from U.S. operations was $6,047,682 in the second quarter of 2012 (2011:
$5,888,674) and $12,011,485 in the six month period ended June 30, 2012 (2011: $12,354,756).
Revenue in 2012 increased over 2011 mainly due to the addition of the CapMX business acquired from SVB Analytics, Inc., net of lower
transactions activity in the second quarter.
5Management’s discussion and analysis

Expenses
Total expenses, including income tax expense, in the second quarter of 2012 were $11,420,899 (2011: $10,853,567) and $22,104,349 in the
six month period ended June 30, 2012 (2011: $21,651,022). Operating expenses were $10,256,472 in the second quarter of 2012 (2011:
$10,267,924) and $19,974,724 in the six month period ended June 30, 2012 (2011: $20,423,665).
The Company applied for investment tax credits under the Canadian and Alberta governments’ scientifi c and experimental development
(“SRED”) programs. During the second quarter of 2012, the claim for 2011 SRED expenditures was made. Based on the history of successful
SRED claims made in previous years, the Company has accrued $645,000 as a reduction to operating expenses in the second quarter of 2012
(2011: $Nil), and $1,270,000 in the six months ended June 30, 2012 (2011: $Nil) relating to SRED claims. The Company expects to recognize
an additional $600,000 of SRED credit in the third and fourth quarters of 2012 for 2012 SRED expenditures.
Staff and infrastructure costs associated with the transition of the Computershare business in the U.S. during the fi rst six months of 2011 did
not re-occur in the fi rst six months of 2012 as a result of the successful integration of the Computershare business during 2011.
The Company incurred signifi cant expenses during the fi rst six months of 2012 in establishing its new operations in the UK and obtaining its
Canadian brokerage license, which were not applicable in the same period of 2011.
Foreign exchange gain or loss
A foreign exchange gain of $137,087 was recorded during the second quarter of 2012 (2011: gain $82,415) and a gain of $123,267 for the
six month period ended June 30, 2012 (2011: gain $456,500). The foreign exchange gain during the second quarter of 2012 refl ects the
weakening of the Canadian dollar against the U.S. dollar during the period.
Extinguishment of amount due to Computershare and charge to intangibles and goodwill
On April 3, 2012, the Company received notice from Computershare of its decision to retain a stock options and restricted stock administration
business that it acquired on December 31, 2011 as part of a larger transaction. As a consequence of this decision, effective April 3, 2012, the
U.S. $17,638,081 amount due to Computershare as at December 31, 2011 was extinguished and ceased to be an obligation of Solium. The
impact of this on the Company’s second quarter income statement is a gain of $15,630,180 partially offset by a charge to intangible assets and
goodwill of $7,796,894.
Income taxes
$1,210,800 of income tax expense was recorded in the second quarter of 2012 (2011: $325,102) and $1,842,655 for the six month period
ended June 30, 2012 (2011: $981,117). The Company’s U.S. operations have become taxable during 2012.
Other comprehensive income
A foreign currency translation gain of $885,177 resulting from the translation of the Due to Computershare liability and the Company’s assets
and liabilities in its U.S. subsidiaries was included in other comprehensive income for the second quarter of 2012 (2011: loss $99,717) and
$493,099 for the six month period ended June 30, 2012 (2011: loss $1,040,898).
Financial condition, liquidity and capital resources
Cash and working capital
Cash on hand as at June 30, 2012 was $16,204,443 (December 31, 2011: $16,934,218). Working capital as at June 30, 2012 was
$14,576,615 (December 31, 2011: $9,645,362).
6 Solium Capital 2012 Second Quarter Report
Management’s discussion and analysis
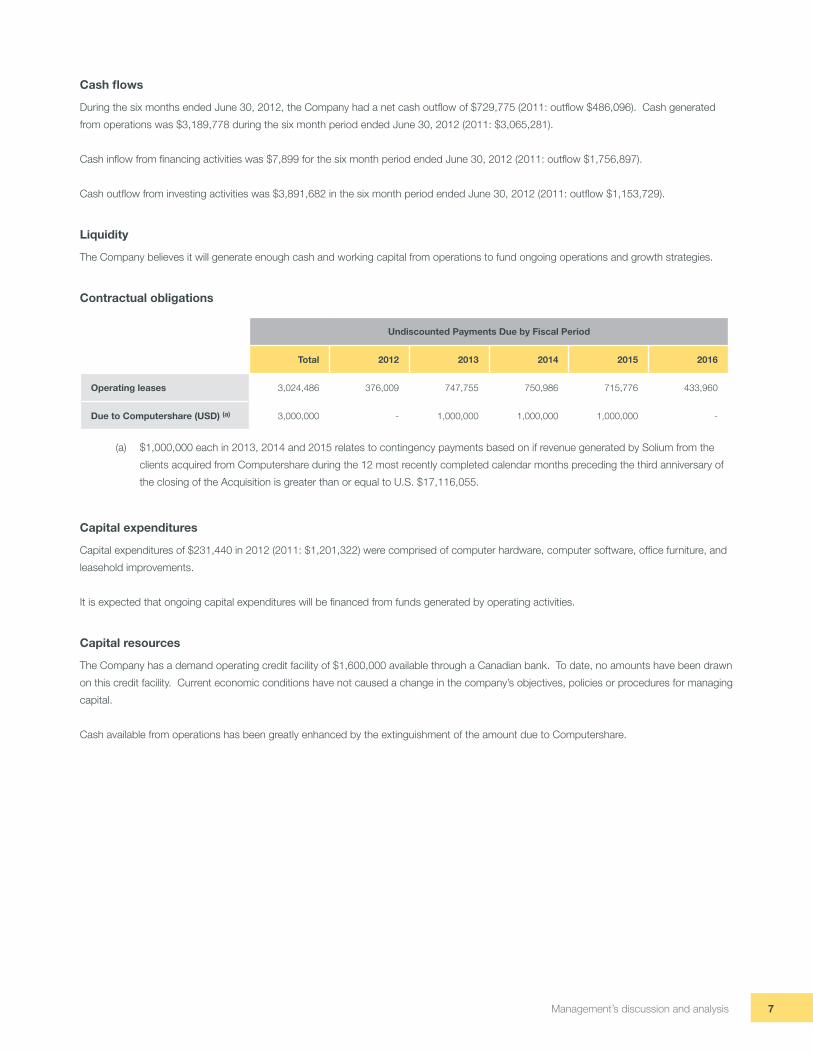
Cash fl ows
During the six months ended June 30, 2012, the Company had a net cash outfl ow of $729,775 (2011: outfl ow $486,096). Cash generated
from operations was $3,189,778 during the six month period ended June 30, 2012 (2011: $3,065,281).
Cash infl ow from fi nancing activities was $7,899 for the six month period ended June 30, 2012 (2011: outfl ow $1,756,897).
Cash outfl ow from investing activities was $3,891,682 in the six month period ended June 30, 2012 (2011: outfl ow $1,153,729).
Liquidity
The Company believes it will generate enough cash and working capital from operations to fund ongoing operations and growth strategies.
Contractual obligations
(a) $1,000,000 each in 2013, 2014 and 2015 relates to contingency payments based on if revenue generated by Solium from the
clients acquired from Computershare during the 12 most recently completed calendar months preceding the third anniversary of
the closing of the Acquisition is greater than or equal to U.S. $17,116,055.
Capital expenditures
Capital expenditures of $231,440 in 2012 (2011: $1,201,322) were comprised of computer hardware, computer software, offi ce furniture, and
leasehold improvements.
It is expected that ongoing capital expenditures will be fi nanced from funds generated by operating activities.
Capital resources
The Company has a demand operating credit facility of $1,600,000 available through a Canadian bank. To date, no amounts have been drawn
on this credit facility. Current economic conditions have not caused a change in the company’s objectives, policies or procedures for managing
capital.
Cash available from operations has been greatly enhanced by the extinguishment of the amount due to Computershare.
Undiscounted Payments Due by Fiscal Period
Total 2012 2013 2014 2015 2016
Operating leases 3,024,486 376,009 747,755 750,986 715,776 433,960
Due to Computershare (USD) (a) 3,000,000 - 1,000,000 1,000,000 1,000,000 -
7Management’s discussion and analysis

The following is a reconciliation of Adjusted EBITDA to net earnings:
2. Comparability of quarterly Adjusted EBITDA and net earnings is affected by factors such as SRED ITC credits, hedge accounting of the
amount due to Computershare, intangibles and goodwill charges, and gain on extinguishment of the amount due to Computershare.
Summary of quarterly results
The following table summarizes the quarterly results for the eight most recently completed quarters.
2012 2011 2010
Q2 Q1 Q4 Q3 Q2 Q1 Q4 Q3
Adjusted EBITDA 2,683,364 4,144,698 2,569,057 2,146,281 2,214,296 3,962,176 1,614,844 1,000,511
Foreign exchange gain (loss) 137,087 (13,820) 431,669) (1,270,507) 82,415) 374,085) 58,220) (35,817)
Finance costs (90,714) (319,523) (340,059) (336,388) (342,956) (359,784) (233,738) (219)
Amortization (1,023,660) (1,210,278) (1,226,971) (1,130,695) (1,081,965) (1,061,038) (707,193) (165,231)
Gain on extinguishment of
amount due to Computershare 15,630,180 - - - - - - -
Intangibles and goodwill charge (7,796,894) - - - - - - -
Income tax (1,210,800) (631,855) (576,787) (371,025) (325,102) (656,015) (547,827) (342,244)
Net earnings 8,328,563 1,969,222) 856,909) (962,334) 546,688) 2,259,424) 184,306) 457,000)
Notes:
1. Adjusted earnings before interest, taxes, depreciation and amortization (“Adjusted EBITDA”) is a non-IFRS fi nancial measure which does
not have any standardized meaning prescribed by IFRS and is therefore unlikely to be comparable to similar measures presented by other
issuers. Adjusted EBITDA provides useful information to users as it refl ects the net earnings prior to the effect of non-operating expenses
such as fi nance costs, income tax, amortization, foreign exchange gain or loss, gain on extinguishment of amount due to Computershare,
and intangibles and goodwill charges. Management uses Adjusted EBITDA in measuring the fi nancial performance of the Company.
Management monitors Adjusted EBITDA against budget and past results on a regular basis. The measure is a component in determining
the annual bonus pool for staff and management.
2012 2011 2010
Q2 Q1 Q4 Q3 Q2 Q1 Q4 Q3
Revenues 11,916,176 12,652,672 10,820,707 10,726,136) 11,400,255 13,056,879 9,663,590 5,785,541
Expenses before
income taxes2 10,210,099 10,051,595 9,387,011 11,317,445) 10,528,465 10,141,440 8,931,453 4,986,297
Adjusted EBITDA1, 2 2,683,364 4,144,698 2,569,057 2,146,281) 2,214,296 3,962,176 1,614,844 1,000,511
Earnings from
operations 2 1,659,704 2,934,420 1,342,086 1,015,586) 1,132,331 2,901,138 907,215 835,280
Earnings (loss) before
income taxes 2 9,539,363 2,601,077 1,433,696 (591,309) 871,790 2,915,439 732,137 799,244
Net earnings (loss) 2
Per share
– basic2
– diluted2
8,328,563
$0.199
$0.198
1,969,222
$0.047
$0.047
856,909)
$0.021)
$0.020)
(962,334)
($0.023)
($0.023)
546,688
$0.013
$0.013
2,259,424
$0.054
$0.054
184,306
$0.003
$0.004
457,000
$0.015
$0.014
8 Solium Capital 2012 Second Quarter Report
Management’s discussion and analysis

Factors contributing to quarterly results
Participant activity
The transaction administration fees collected from participants are affected by several factors, some of which are seasonal. These factors
include: (i) grant vesting dates; (ii) grant termination dates; (iii) the pattern of the Canadian population of making retirement contributions in the
fi rst quarter of every year; (iv) the stock trading prices for a corporate client relative to an employee participant’s associated option exercise
price; and (v) employee participant perceptions of future stock trading prices. Historically, the fi rst three factors contribute to higher transaction
based fees in the fi rst quarter of a given year. However, the actual magnitude of transaction based fees for a specifi c quarter or year is diffi cult
to predict, primarily due to the last two factors.
Critical accounting estimates
The preparation of the consolidated fi nancial statements in conformity with IFRS requires management to make estimates and assumptions
that affect the reported amounts of assets, liabilities and contingent liabilities at the date of the consolidated fi nancial statements and
reported amounts of revenues and expenses during the reporting period. Estimates and judgments are continuously evaluated and are
based on management’s experience and other factors, including expectations of future events that are believed to be reasonable under the
circumstances. Actual outcomes can differ from these estimates.
The key sources of estimation uncertainty that have a signifi cant risk of causing material adjustment to the amounts recognized in the
consolidated fi nancial statements are:
Useful lives of property and equipment
The Company estimates the useful lives of property and equipment based on the period over which the assets are expected to be available
for use. The estimated useful lives of property and equipment are reviewed periodically and are updated if expectations differ from previous
estimates due to physical wear and tear, technical or commercial obsolescence and legal or other limits on the use of the relevant assets. In
addition, the estimation of the useful lives of property and equipment are based on internal technical evaluation and experience with similar
assets. It is possible, however, that future results of operations could be materially affected by changes in the estimates brought about by
changes in factors mentioned above. The amounts and timing of recorded expenses for any period would be affected by changes in these
factors and circumstances. A reduction in the estimated useful lives of the property and equipment would increase the recorded expenses and
decrease the non-current assets.
Fair value of fi nancial instruments
The estimated fair value of fi nancial assets and liabilities, by their very nature, are subject to measurement uncertainty.
Impairment of non-fi nancial assets
Impairment exists when the carrying value of an asset or cash generating unit exceeds its recoverable amount, which is the higher of its
fair value less costs to sell and its value in use. The fair value less costs to sell calculation is based on available data from binding sales
transactions in an arm’s length transaction of similar assets or observable market prices less incremental costs for disposing of the asset. The
value in use calculation is based on a discounted cash fl ow model. The cash fl ows are derived from fi nancial forecasts and do not include
restructuring activities that the Company is not yet committed to or signifi cant future investments that will enhance the asset’s performance of
the cash generating unit being tested. The recoverable amount is most sensitive to the discount rate used for the discounted cash fl ow model
as well as the expected future cash infl ows and the growth rate used for extrapolation purposes.
Taxes
Provisions for taxes are made using the best estimate of the amount expected to be paid based on a qualitative assessment of all relevant
factors. The Company reviews the adequacy of these provisions at the end of the reporting period. However, it is possible that at some future
date an additional liability could result from audits by taxing authorities. Where the fi nal outcome of these tax-related matters is different from
the amounts that were initially recorded, such differences will affect the tax provisions in the period in which such determination is made.
9Management’s discussion and analysis

Share-based payment transaction
The Company measures the cost of equity-settled transactions with employees by reference to the fair value of the equity instruments at the
date at which they are granted. Estimating fair value for share-based payment transactions requires determining the most appropriate valuation
model, which is dependent on the terms and conditions of the grant. This estimate also requires determining and making assumptions about
the most appropriate inputs to the valuation model including the expected life, volatility and dividend yield of the share option.
Future adoption of recently issued accounting pronouncements
In June 2012, the International Accounting Standards Board (“IASB”) issued Consolidated Financial Statements, Joint Arrangements and
Disclosure of Interests in Other Entities: Transition Guidance (Amendments to IFRS 10, IFRS 11 and IFRS 12). The amendments clarify the
transition guidance in IFRS 10 and provide additional transition relief for all three standards by limiting the requirement to provide adjusted
comparative information to only the preceding comparative period. The amendments are effective for annual periods beginning on or after
January 1, 2013. The Corporation will apply these amendments along with the adoption of IFRS 10, 11 and 12 on January 1, 2013.
On December 16, 2011 the International Accounting Standards Board (“IASB”) and Financial Accounting Standards Board (“FASB”) issued
common disclosure requirements that are intended to help investors and other users to better assess the effect or potential effect of offsetting
arrangements on a company’s fi nancial position. The new requirements are set out in ‘Disclosures-Offsetting Financial Assets and Financial
Liabilities (Amendments to IFRS 7)’. The IFRS 7 amendments are effective for annual reporting periods beginning on or after January 1, 2013.
The Company is currently evaluating the impact of this standard on its consolidated fi nancial statements.
IFRS 9, ‘Financial Instruments’ was issued in November 2009 as the fi rst step in a project to replace IAS 39 ‘Financial Instruments: Recognition
and Measurement’. IFRS 9 requires all recognized fi nancial assets that are within the scope of IAS 39 ‘Financial Instruments: Recognition and
Measurement’ to be subsequently measured at amortized cost or fair value. The most signifi cant effect of IFRS 9 regarding the classifi cation
and measurement of fi nancial liabilities relates to the accounting for changes in the fair value of a fi nancial liability (designated as at fair value
through profi t or loss) attributable to changes in the credit risk of that liability and the elimination of the cost exemption for derivative liabilities to
be settled by delivery of unquoted equity instruments. IFRS 9 is applied prospectively with transitional arrangements depending on the date of
application. The Standard is not applicable until annual periods beginning on or after January 1, 2015, but is available for early adoption. The
Company is currently evaluating the impact of this standard on its consolidated fi nancial statements.
In June 2011, the IASB issued an amendment to IAS 1 that changes the presentation of items in the consolidated statement of comprehensive
income. This amendment requires the components of other comprehensive income (“OCI”) to be presented in two separate groups, based
on whether or not the components may be recycled to the consolidated statement of earnings in the future. Companies will continue to have
a choice of whether to present components of OCI before or after tax. Those that present components of OCI before tax will be required to
disclose the amount of tax related to the two groups separately. This amendment is effective for annual periods beginning on or after July 1,
2012, is applied retrospectively, with early adoption permitted. The Company is currently evaluating the impact of this amendment to IAS 1 on
its consolidated fi nancial statements.
In May 2011, the IASB published IFRS 13, a comprehensive standard on how to measure and disclose fair values. IFRS 13 applies to IFRSs
that require or permit fair value measurement, but does not address when to measure fair value or require additional use of fair value. The new
standard requires disclosures similar to those in IFRS 7 ‘Financial Instruments: Disclosures’, but applies to all assets and liabilities measured at
fair value, whereas IFRS 7 applied only to fi nancial assets and liabilities measured at fair value. IFRS 13 is effective for annual periods beginning
on or after January 1, 2013, is applied prospectively as of the beginning of the annual period in which it is adopted, with early adoption
permitted. The Company is currently evaluating the impact of this standard on its consolidated fi nancial statements.
Financial instruments
Exposure to counterparty credit risk, interest rate risk and foreign currency risk arises in the normal course of the Company’s business. The
Company currently does not enter into derivative fi nancial instruments to reduce exposure to fl uctuations in any of the risks impacting the
Company’s operations.
10 Solium Capital 2012 Second Quarter Report
Management’s discussion and analysis
The Company has credit risk as a result of its trade accounts receivable. The Company mitigates this risk by dealing with fi nancially sound
companies and, accordingly, does not anticipate any signifi cant credit losses.
The Company has foreign exchange risk because it is exposed to foreign currency fl uctuations due to its operations in the United States.
The Company currently has no interest rate risk as the Company has no long-term debt outstanding.
Disclosure controls
The Company has a Corporate Disclosure Policy in place to ensure that communications with the public about the Company are timely, factual
and accurate; disseminated in accordance with all applicable legal and regulatory requirements; and that all material information in respect of the
Company is communicated to the Chief Executive Offi cer and the Executive Vice President (EVP), Finance, and where appropriate, the Board of
Directors and/or committees thereof. The Company’s Chief Executive Offi cer and EVP, Finance have concluded that the Company’s disclosure
controls and procedures are effective to provide reasonable assurance that information required to be disclosed by the Company in its annual
fi lings, interim fi lings or other reports or submitted under securities legislation is recorded, processed, summarized and reported within the time
periods specifi ed in the securities legislation and include controls and procedures designed to ensure that information required to be disclosed
in the annual fi lings, interim fi lings or other reports fi led or submitted under securities legislation is accumulated and communicated to the
Company’s management, including its certifying offi cers, as appropriate to allow timely decisions regarding required disclosure.
It should be noted that while the Chief Executive Offi cer and EVP, Finance believe that the disclosure controls and procedures will provide a
reasonable level of assurance and that they are effective, they do not expect that the disclosure controls and procedures will prevent all errors
and fraud. A control system, no matter how well conceived or operated, can provide only reasonable, not absolute assurance that the objectives
of the control system are met.
Internal control over fi nancial reporting
The Chief Executive Offi cer and EVP, Finance of Solium are responsible for designing internal controls over fi nancial reporting or causing them to
be designed under their supervision in order to provide reasonable assurance regarding the reliability of fi nancial reporting and the preparation of
fi nancial statements for external purposes in accordance with IFRS.
Due to its inherent limitations, internal control over fi nancial reporting may not prevent or detect misstatements on a timely basis. Also,
projections of any evaluation of the effectiveness of internal control over fi nancial reporting to future periods are subject to the risk that the
controls may become inadequate because of changes in conditions, or that the degree of compliance with the policies or procedures may
deteriorate.
Management assessed the effectiveness of the Company’s internal control over fi nancial reporting as of December 31, 2011, based on the
criteria set forth in Internal Control – Integrated Framework issued by the Committee of Sponsoring Organizations of the Treadway Commission.
Based on that assessment, management concluded that, as of December 31, 2011, the Company’s internal control over fi nancial reporting was
effective based on the criteria established in the Internal Control – Integrated Framework. Also, management determined that there were no
material weaknesses in Solium’s internal control over fi nancial reporting as of December 31, 2011.
No changes were made in the Company’s internal control over fi nancial reporting during the six month period ended June 30, 2012, that have
materially affected, or are reasonably likely to materially affect, the Company’s internal control over fi nancial reporting.
11Management’s discussion and analysis

Outstanding share data
The Company is authorized to issue an unlimited number of common shares and an unlimited number of preferred shares. As at the date of
this MD&A, there were 41,773,462 common shares outstanding.
Employees, directors, offi cers and consultants have been granted options to purchase common shares under a stock option plan. As at the
date of this MD&A, there were options outstanding to purchase 3,198,069 common shares.
Employees have been granted rights to receive common shares under a share award incentive plan. As at the date of this MD&A, there were
327,410 restricted share units outstanding.
Risk assessment
Management defi nes risk as the evaluation of probability that an event might happen in the future that could negatively affect the fi nancial
condition and/or results of operations of the Company. The risks that could affect the Company have been described in the MD&A of the
Company’s Annual Report for the year ended December 31, 2011. The risks identifi ed therein do not constitute an exhaustive list of all
possible risks as there may be additional risks of which management is currently unaware of. As it is diffi cult to predict whether any risk will
happen or its related consequences, the actual effect of any risk on the business could be materially different from anticipated.
12 Solium Capital 2012 Second Quarter Report
Management’s discussion and analysis
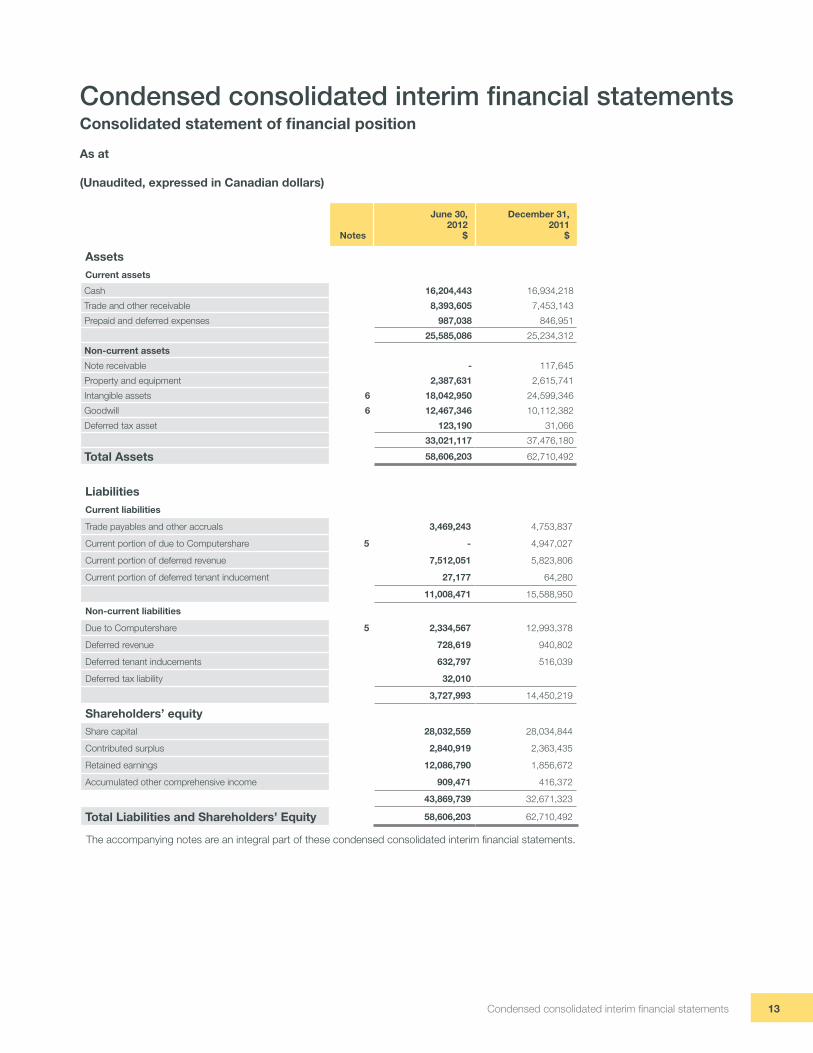
Condensed consolidated interim fi nancial statementsConsolidated statement of fi nancial position
As at
(Unaudited, expressed in Canadian dollars)
Notes
June 30, 2012
$
December 31, 2011
$
AssetsCurrent assets
Cash 16,204,443 16,934,218
Trade and other receivable 8,393,605 7,453,143
Prepaid and deferred expenses 987,038 846,951
25,585,086 25,234,312
Non-current assets
Note receivable - 117,645
Property and equipment 2,387,631 2,615,741
Intangible assets 6 18,042,950 24,599,346
Goodwill 6 12,467,346 10,112,382
Deferred tax asset 123,190 31,066
33,021,117 37,476,180
Total Assets 58,606,203 62,710,492
LiabilitiesCurrent liabilities
Trade payables and other accruals 3,469,243 4,753,837
Current portion of due to Computershare 5 - 4,947,027
Current portion of deferred revenue 7,512,051 5,823,806
Current portion of deferred tenant inducement 27,177 64,280
11,008,471 15,588,950
Non-current liabilities
Due to Computershare 5 2,334,567 12,993,378
Deferred revenue 728,619 940,802
Deferred tenant inducements 632,797 516,039
Deferred tax liability 32,010
3,727,993 14,450,219
Shareholders’ equityShare capital 28,032,559 28,034,844
Contributed surplus 2,840,919 2,363,435
Retained earnings 12,086,790 1,856,672
Accumulated other comprehensive income 909,471 416,372
43,869,739 32,671,323
Total Liabilities and Shareholders’ Equity 58,606,203 62,710,492
The accompanying notes are an integral part of these condensed consolidated interim fi nancial statements.
13Condensed consolidated interim fi nancial statements

Consolidated statement of comprehensive income
(Unaudited, expressed in Canadian dollars)
The accompanying notes are an integral part of these condensed consolidated interim fi nancial statements.
Three Months Ended Six Months Ended
Notes
June 30, 2012
$
June 30, 2011
$
June 30, 2012
$
June 30, 2011
$
Operations
Revenue 11,916,176 11,400,255 24,568,848 24,457,134
Operating expenses 10,256,472 10,267,924 19,974,724 20,423,665
Earnings from operations 1,659,704 1,132,331 4,594,124 4,033,469
Finance costs 90,714 342,956 410,237 702,740
Foreign exchange gain (137,087) (82,415) (123,267) (456,500)
Gain on extinguishment of amount due to Computershare 5 (15,630,180) - (15,630,180) -
Intangible assets and goodwill charge 6 7,796,894 - 7,796,894 -
Earnings before income taxes 9,539,363 871,790 12,140,440 3,787,229
Current income taxes 1,257,913 315,128 1,904,381 976,930
Deferred taxes (47,113) 9,974 (61,726) 4,187
1,210,800 325,102 1,842,655 981,117
Net earnings 8,328,563 546,688 10,297,785 2,806,112
Other comprehensive income
Foreign currency translation (gains) losses for foreign
operations(885,177) 99,717 (493,099) 1,040,898
Total comprehensive income for the period 9,213,740 446,971 10,790,884 1,765,214
Earnings per share
Basic 8 $0.199 $0.013 $0.246 $0.067
Diluted 8 $0.198 $0.013 $0.246 $0.067
14 Solium Capital 2012 Second Quarter Report
Condensed consolidated interim fi nancial statements

Consolidated Statement of Changes in Equity
For the six months ended June 30, 2012 and 2011
(Unaudited, expressed in Canadian dollars)
Share Capital$
Contributed surplus
$
(Defi cit)Retained Earnings
$
Accumulated other
comprehensive income (loss)
$
TotalEquity
$
As at January 1, 2012 28,034,844 2,363,435 1,856,672 416,372 32,671,323
Net earnings - - 10,297,785 - 10,297,785
Foreign currency translation differences for foreign
operations net of tax - - - 493,099 493,099
Stock-based compensation expense - 546,003 - - 546,003
Share unit releases 35,337 (64,061) - - (28,724)
Stock options exercised 12,078 (4,458) - - 7,620
Cancellation of shares purchased in issuer bid (47,492) - (67,667) - (115,159)
Transaction costs (2,208) - - - (2,208)
As at June 30, 2012 28,032,559 2,840,919 12,086,790 909,471 43,869,739
As at January 1, 2011 27,466,406 2,044,155 (809,326) (495,147) 28,206,088
Net earnings - - 2,806,112 - 2,806,112
Foreign currency translation differences for foreign
operations net of tax - - -(1,040,898) (1,040,898)
Stock-based compensation - 341,410 - - 341,410
Share unit releases 46,711 (82,836) - - (36,125)
Stock options exercised 343,759 (143,759) - - 200,000
Transaction costs (7,547) - - - (7,547)
As at June 30, 2011 27,849,329 2,158,970 1,996,786 (1,536,045) 30,469,040
Net earnings - - (105,425) - (105,425)
Foreign currency translation differences for foreign
operations net of tax - - - 1,952,417 1,952,417
Stock-based compensation - 441,821 - - 441,821
Share unit releases 127,210 (199,207) - - (71,997)
Stock options exercised 94,399 (38,149) - - 56,250
Cancellation of shares purchased in issuer bid (34,805) - (34,689) - (69,494)
Transactions costs (1,289) - - - (1,289)
As at December 31, 2011 (audited) 28,034,844 2,363,435 1,856,672 416,372 32,671,323
The accompanying notes are an integral part of these condensed consolidated interim fi nancial statements.
15Condensed consolidated interim fi nancial statements
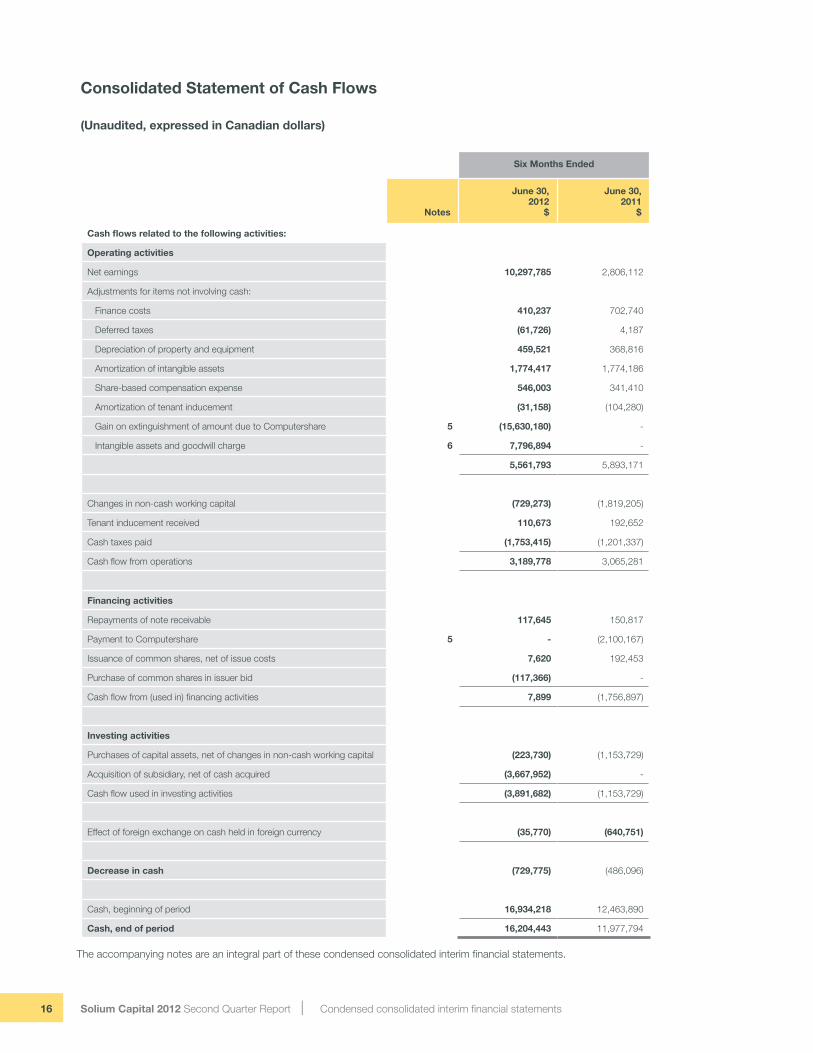
Consolidated Statement of Cash Flows
(Unaudited, expressed in Canadian dollars)
The accompanying notes are an integral part of these condensed consolidated interim fi nancial statements.
Six Months Ended
Notes
June 30,2012
$
June 30,2011
$
Cash fl ows related to the following activities:
Operating activities
Net earnings 10,297,785 2,806,112
Adjustments for items not involving cash:
Finance costs 410,237 702,740
Deferred taxes (61,726) 4,187
Depreciation of property and equipment 459,521 368,816
Amortization of intangible assets 1,774,417 1,774,186
Share-based compensation expense 546,003 341,410
Amortization of tenant inducement (31,158) (104,280)
Gain on extinguishment of amount due to Computershare 5 (15,630,180) -
Intangible assets and goodwill charge 6 7,796,894 -
5,561,793 5,893,171
Changes in non-cash working capital (729,273) (1,819,205)
Tenant inducement received 110,673 192,652
Cash taxes paid (1,753,415) (1,201,337)
Cash fl ow from operations 3,189,778 3,065,281
Financing activities
Repayments of note receivable 117,645 150,817
Payment to Computershare 5 - (2,100,167)
Issuance of common shares, net of issue costs 7,620 192,453
Purchase of common shares in issuer bid (117,366) -
Cash fl ow from (used in) fi nancing activities 7,899 (1,756,897)
Investing activities
Purchases of capital assets, net of changes in non-cash working capital (223,730) (1,153,729)
Acquisition of subsidiary, net of cash acquired (3,667,952) -
Cash fl ow used in investing activities (3,891,682) (1,153,729)
Effect of foreign exchange on cash held in foreign currency (35,770) (640,751)
Decrease in cash (729,775) (486,096)
Cash, beginning of period 16,934,218 12,463,890
Cash, end of period 16,204,443 11,977,794
16 Solium Capital 2012 Second Quarter Report
Condensed consolidated interim fi nancial statements

Notes to the condensed consolidated interim fi nancial statementsAs at June 30, 2012 and for the three and six month periods ended June 30, 2012 and 2011
(Unaudited, expressed in Canadian dollars)
1. General informationSolium Capital Inc. was incorporated in October of 1999 under the laws of the Province of Alberta. Solium Capital Inc. and its
subsidiaries (together the “Company” or “Solium”) are Software as-a-Service (SaaS) companies specializing in technology and services
for the administration and execution of equity-based incentive and savings programs for corporations and their employees. Solium’s
technology platforms, Shareworks, StockVantage and Transcentive, are leading online solutions that integrate the management of
multiple equity plan types including stock options, share units, share appreciation rights, restricted stock awards, and employee share
purchase plans on one comprehensive platform for a client. The address of the registered offi ce is 1500, 800 – 6th Avenue SW,
Calgary, Alberta, T2P 3G3.
2. Basis of preparationStatement of complianceThese condensed consolidated interim fi nancial statements present Solium’s fi nancial results of operations and fi nancial position
using accounting policies under International Financial Reporting Standards (“IFRS”) as at and for the three and six month periods
ended June 30, 2012, including 2011 comparative periods. The condensed consolidated interim fi nancial statements are on a basis
consistent with the Company’s annual audited consolidated fi nancial statements issued under IFRS for the year ended
December 31, 2011. These condensed consolidated interim fi nancial statements are prepared in accordance with IAS 34, ‘Interim
Financial Reporting’. The condensed consolidated interim fi nancial statements do not include all information required for full annual
fi nancial statements and should be read in conjunction with the consolidated fi nancial statements of the Company as at December 31,
2011, December 31, 2010 and January 1, 2010 and for the years ended December 31, 2011 and 2010.
These condensed consolidated interim fi nancial statements have been prepared on a basis consistent with the accounting policies
disclosed in Note 2 of the Company’s condensed consolidated interim fi nancial statements for the three months ended March 31, 2012.
3. Recent accounting pronouncementsIn June 2012, the International Accounting Standards Board (“IASB”) issued Consolidated Financial Statements, Joint Arrangements
and Disclosure of Interests in Other Entities: Transition Guidance (Amendments to IFRS 10, IFRS 11 and IFRS 12). The amendments
clarify the transition guidance in IFRS 10 and provide additional transition relief for all three standards by limiting the requirement to
provide adjusted comparative information to only the preceding comparative period. The amendments are effective for annual periods
beginning on or after January 1, 2013. The Corporation will apply these amendments along with the adoption of IFRS 10, 11 and 12 on
January 1, 2013.
4. Business combinationsOn May 15, 2012, the Company closed the acquisition (the “Acquisition”) of all the assets related to the operations of the CapMX
business of SVB Analytics, Inc. for total cash consideration of $5.27 million (U.S. $5.25 million). CapMX provides record keeping
services for grant based incentive plans and awards to private companies and venture capital investors in the United States (the
“Business”). The Acquisition positioned the Company to better compete in the equity administration of private companies and expand
its services in the United States. The goodwill recognized on acquisition is primarily attributed to the expected future cash fl ows to be
derived from synergies which will contribute to operational effi ciencies.
17Notes to the condensed consolidated interim fi nancial statements

In Canadian dollars
June 30,2012
$
December 31, 2011
$
Fair value of obligation, end of period 2,334,567 17,940,405)
Less: current portion of obligation - 4,947,027)
Long-term portion of obligation 2,334,567 12,993,378)
In U.S. dollars
June 30,2012
$
December 31, 2011
$
Fair value of obligation, beginning of period 17,638,081 20,601,450)
Less: payments(a) - (4,358,333)
Add: accretion 401,212 1,394,964)
Less: extinguishment of obligations (15,746,230) -
Fair value of obligation, end of period 2,293,063 17,638,081)
The preliminary allocation of the components of total consideration to the net assets acquired is as follows:
(a) Payments made to Computershare in Canadian dollars were nil (2011: $4,311,517).
In conjunction with this transaction, the Company has recorded $0.1 million of applicable transaction costs to general and
administrative expenses on the Consolidated Statement of Comprehensive Income. Net working capital includes trade receivables with
a fair value of $681,136 and a gross contractual value of $690,577. The best estimate at acquisition date of the contractual cash fl ows
not expected to be collected is $9,441.
These Condensed Consolidated Interim Financial Statements incorporate the results of operations of the acquired CapMX business
from May 15, 2012. For the three and six months ended June 30, 2012, the Company recorded revenue from the CapMX business
of $0.5 million and earnings before income taxes of $0.1 million. Had the acquisition occurred on January 1, 2012, for the six
months ended June 30, 2012, the Company estimates that its pro forma sales and earnings before income taxes would have been
approximately $26.2 million and $12.6 million, respectively.
5. Due to Computershare
In connection with an acquisition in November 2010, the Company had an obligation to pay Computershare an aggregate of U.S. $22
million over fi ve years. The amount outstanding as at December 31, 2011 was U.S. $17.3 million. On April 3, 2012, the Company
received notice from Computershare of its decision to retain the stock options and restricted stock administration business that it
acquired on December 31, 2011 as part of a larger transaction. As a consequence of Computershare’s decision, pursuant to the Asset
Purchase Agreement dated November 7, 2010 between Solium and Computershare, the U.S. $17.3 million due to Computershare as
at December 31, 2011 was extinguished and ceased to be an obligation of the Company. U.S. $1.25 million of this amount was paid
to Computershare in the fi rst quarter of 2012. Computershare refunded this payment in April 2012.
Net Assets Acquired $
Cash 1,597,273
Intangible assets:
Customer contracts 2,557,395
Brand and proprietary technology 141,409
Deferred revenue (1,934,896)
Net working capital 398,179
Total identifi able net assets 2,759,360
Goodwill 2,505,865
Total consideration 5,265,225
18 Solium Capital 2012 Second Quarter Report
Notes to the condensed consolidated interim fi nancial statements

The extinguishment of the U.S. $17.3 million due to Computershare resulted in a gain of U.S. $15.7 million in the second quarter of
2012, and will result in U.S. $1.5 million of fi nance costs that would have otherwise been recorded through November 2015 to no
longer be recorded.
Also in connection with the acquisition of the business, the Company has an obligation to pay additional cash consideration
(“Contingent Payments”) of up to U.S. $3 million if the revenue generated by Solium from the clients acquired from Computershare
during the 12 most recently completed calendar months preceding the third anniversary of the closing of the acquisition is greater than
or equal to U.S. $17,116,055. If the consideration is payable, three contingent cash payments will be paid to Computershare in the
amount of U.S. $1 million each (the “Contingent Payments”), on January 21, 2014, and at or prior to each of November 7, 2014 and
November 7, 2015.
The fair value of the amounts due to Computershare and Contingent Payments was calculated using a discounted cash fl ow model
using a discount factor of 6.5%. The difference between the face value of the amounts due to Computershare and Contingent
Payments a nd the fair value (the accretion amount) is recognized as fi nance costs over the term which payments are due. As at
June 30, 2012, the accretion on the outstanding obligation resulted in $90,715 (U.S. $89,833) being recorded as fi nance costs for the
three months ended June 30, 2012 (2011: $342,956 or U.S. $354,447) and $410,237 (U.S. $401,212) for the six months ended June
30, 2012 (2011: $702,740 or U.S. $719,316).
6. Intangible assets and goodwill
Intangible Assets Goodwill
June 30, 2012
December 31, 2011
June 30, 2012
December 31, 2011
Balance, beginning of period 24,599,346 27,782,529 10,112,382 9,895,136
Amortization during period (1,774,417) (3,693,063) - -
Addition arising from business combination (Note 4) 2,698,804 - 2,205,865 -
Reduction to carrying value (7,595,392) - (201,502) -
Effect of foreign currency exchange differences 114,609 509,880 350,601 227,246
Balance, end of period 18,042,950 24,599,346 12,467,346 10,112,382
Intangible assets and goodwill have been allocated to the following cash-generating units for purposes of reviewing their carrying values:
Intangible Assets Goodwill
June 30, 2012
December 31, 2011
June 30, 2012
December 31, 2011
Canada 633,753 673,798 249,030 249,030
United States 17,409,197 23,925,548 12,218,316 9,863,352
18,042,950 24,599,346 12,467,346 10,112,382
As a result of Computershare’s decision to retain the stock options and restricted stock administration business that it acquired
on December 31, 2011, the Company reviewed the carrying value of its U.S. assets and recorded a charge to intangible assets of
$7,595,392 and to goodwill of $201,502 for the three and six month periods ended June 30, 2012.
The charge was determined using a discounted cash fl ow model. Signifi cant key assumptions included estimated cash fl ows covering
a fi ve-year period, a discount rate of 15.4% and terminal growth rate in line with historical infl ation at 2%. This charge does not affect
the Company’s operations, its liquidity, taxes, or its bank credit agreements.
If the future were to adversely differ from management’s best estimate of key assumptions and associated cash fl ows were to be
materially adversely affected, the Company could potentially experience future material impairment charges in respect of its intangible
assets and goodwill.
19Notes to the condensed consolidated interim fi nancial statements

7. Stock-based paymentsStock option activity with respect to the Company’s stock option plan for the six months ended June 30, 2012 is shown below:
As at June 30, 2012, 74,500 stock options were vested at a weighted average exercise price of $2.14.
As at June 30, 2012, 329,744 restricted share unit awards (“RSUs”) were outstanding. During the six months ended June 30, 2012,
48,939 RSUs vested. 28,797 common shares were issued in connection with this vesting, and 20,142 common shares were cancelled
in lieu of the income tax withholdings remitted in cash by the Company to tax authorities on behalf of the employees.
8. Earnings per shareBasic and diluted earnings per share
The calculation of basic earnings per share for the three months ended June 30, 2012 was based on net earnings of $8,328,563
(2011: $546,688) and a weighted average number of common shares outstanding of 41,829,159 (2011: 41,612,830). The calculation
for the six months ended June 30, 2012 was based on net earnings of $10,297,785 (2011: $2,806,112) and a weighted average
number of common shares outstanding of 41,800,247 (2011: 41,617,815).
Number of shares
Weighted average
exercise price$
Outstanding, January 1, 2011 2,738,653) 1.87
Granted 1,176,966) 1.73
Exercised (205,000) 1.25
Forfeited (240,400) 1.64
Outstanding, December 31, 2011 3,470,219) 1.88
Granted 169,100 1.57
Exercised (6,500) 1.17
Forfeited (101,700) 1.84
Expired (225,000) 2.11
Outstanding, June 30, 2012 3,306,119 1.85
Three Months Ended Six Months Ended
June 30,2012
June 30,2011
June 30,2012
June 30,2011
Weighted average shares outstanding – basic 41,829,159 41,612,830 41,800,247 41,617,815
Effect of dilutive stock options and share units 152,200 312,014 132,284 311,435
Weighted average shares outstanding – diluted 41,981,359 41,924,844 41,932,531 41,929,250
In the six months ended June 30, 2012, there were 3,088,916 (2011: 1,100,504) stock options excluded from the diluted weighted
average shares outstanding calculation due to an anti-dilutive effect as a result of the exercise right being higher than the market price
of the stock in the period.
9. Financial instruments and risk managementFair value of fi nancial instruments
Cash is classifi ed as held-for-trading. Its fair value is equal to its carrying value and is classifi ed as a Level 1 valuation.
20 Solium Capital 2012 Second Quarter Report
Notes to the condensed consolidated interim fi nancial statements

The three levels of the fair value hierarchy are described as follows:
• Level 1 fair value measurements are those derived from quoted prices (unadjusted) in the active market for identical assets or
liabilities.
• Level 2 fair value measurements are those derived from inputs other than quoted prices that are observable for the asset or
liability, either directly (i.e. as prices) or indirectly (derived from prices)
• Level 3 fair value measurements are those derived from valuation techniques that include inputs for the asset or liability that are
not based on observable market data (unobservable inputs).
Risk management
The Company’s activities expose it to a variety of fi nancial risks: credit risk, liquidity risk and market risk (currency fl uctuations, interest
rates and commodity prices). The Company’s overall risk management program focuses on the unpredictability of fi nancial markets
and seeks to minimise potential adverse effects on the Company’s fi nancial performance.
Credit risk
Credit risk refers to the risk that a counter party will default on its contractual obligations resulting in fi nancial loss to the Company.
The Company has credit risk as a result of its accounts receivable. The Company mitigates this risk by dealing with fi nancially sound
companies and, accordingly, does not anticipate any signifi cant credit losses.
Total trade receivable (net of allowances) held by the Company at June 30, 2012 amounted to $6,792,213. Allowances are provided
against trade receivable based on estimated unrecoverable amounts. In determining the recoverability of a trade receivable, the
Company considers the client’s fi nancial position, service history and payment history.
Trade receivable consists of a large number of customers, spread across diverse industries. The Company does not have signifi cant
credit risk exposure to any single counterparty. Of the trade receivable balance at June 30, 2012, one customer represented greater
than 5% of the balance.
Foreign Currency risk
The Company operates in Canada and the United States. The Company’s functional currency is Canadian dollars (CAD) and the
reporting currency is CAD. Foreign exchange risk arises because the amount receivable on revenue or payable on expenditures that
are denominated in U.S. dollars (USD) may vary when converted to Canadian dollars (CAD) due to changes in exchange rates arising
from timing differences between when the revenue or expense occurs and when actual payment is received or made (“transaction
exposures”) and because the USD denominated monetary net assets of the Company’s U.S. subsidiaries may vary on consolidation
and revaluation into CAD (“translation exposure”).
Based on the balance of net monetary assets carried in the statement of fi nancial position of the Canadian operations as at
June 30, 2012, an increase of 1% in the exchange rate of USD to CAD would, everything else being equal, have had a positive effect
on earnings before taxes for the six months ended and retained earnings as at June 30, 2012 of approximately $82,000 (December 31,
2011: negative effect of $130,000).
On January 1, 2012, the Company designated the U.S. dollar denominated Due to Computershare as a hedge against the Company’s
net investment in its U.S. operations. This designation has the effect of mitigating volatility on net earnings by offsetting foreign
exchange gains and losses on the liability with foreign exchange gains and losses on its net investment in U.S. operations that are
presented in other comprehensive income. Based on the balance of net assets of the U.S. operations and the balance of Due to
Computershare carried in the statement of fi nancial position as at June 30, 2012, an increase of 1% in the exchange rate of USD to
CAD would, everything else being equal, have had a positive effect on other comprehensive income for the six months ended and
accumulated other comprehensive income as at June 30, 2012 of approximately $260,000 (December 31, 2011: positive effect of
$377,000).
21Notes to the condensed consolidated interim fi nancial statements
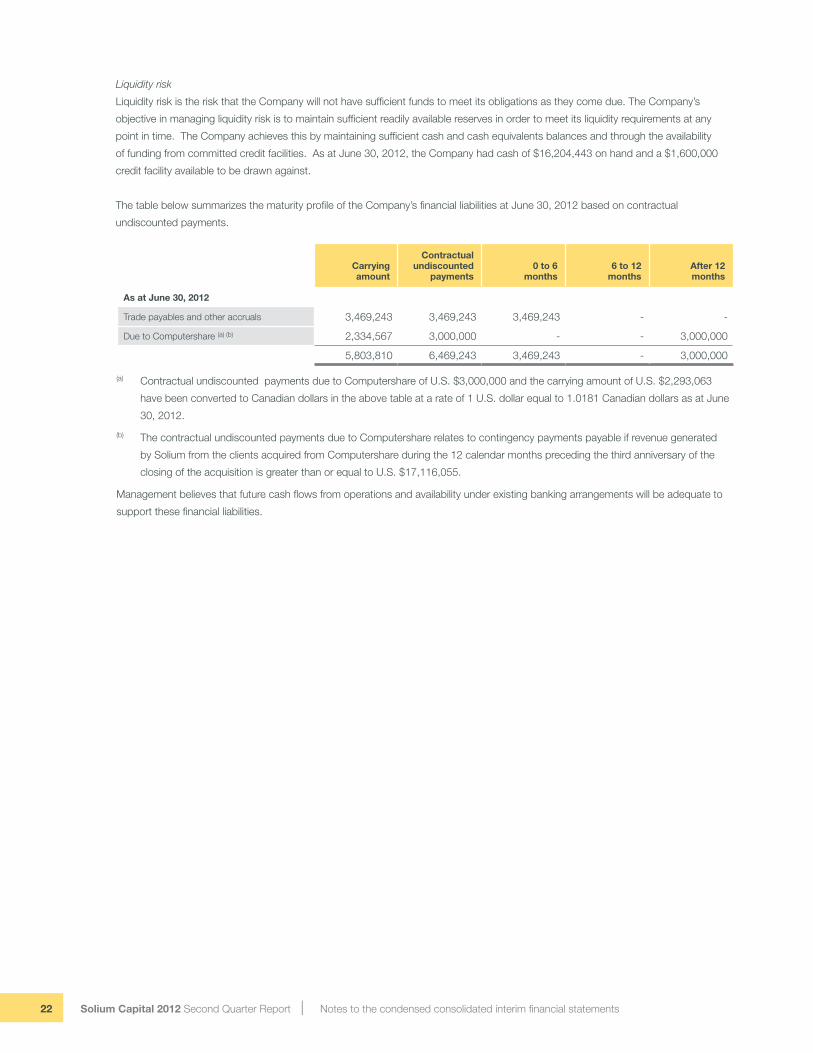
Carrying amount
Contractual undiscounted
payments0 to 6
months6 to 12
monthsAfter 12 months
As at June 30, 2012
Trade payables and other accruals 3,469,243 3,469,243 3,469,243 - -
Due to Computershare (a) (b) 2,334,567 3,000,000 - - 3,000,000
5,803,810 6,469,243 3,469,243 - 3,000,000
(a) Contractual undiscounted payments due to Computershare of U.S. $3,000,000 and the carrying amount of U.S. $2,293,063
have been converted to Canadian dollars in the above table at a rate of 1 U.S. dollar equal to 1.0181 Canadian dollars as at June
30, 2012.
(b) The contractual undiscounted payments due to Computershare relates to contingency payments payable if revenue generated
by Solium from the clients acquired from Computershare during the 12 calendar months preceding the third anniversary of the
closing of the acquisition is greater than or equal to U.S. $17,116,055.
Management believes that future cash fl ows from operations and availability under existing banking arrangements will be adequate to
support these fi nancial liabilities.
Liquidity risk
Liquidity risk is the risk that the Company will not have suffi cient funds to meet its obligations as they come due. The Company’s
objective in managing liquidity risk is to maintain suffi cient readily available reserves in order to meet its liquidity requirements at any
point in time. The Company achieves this by maintaining suffi cient cash and cash equivalents balances and through the availability
of funding from committed credit facilities. As at June 30, 2012, the Company had cash of $16,204,443 on hand and a $1,600,000
credit facility available to be drawn against.
The table below summarizes the maturity profi le of the Company’s fi nancial liabilities at June 30, 2012 based on contractual
undiscounted payments.
22 Solium Capital 2012 Second Quarter Report
Notes to the condensed consolidated interim fi nancial statements
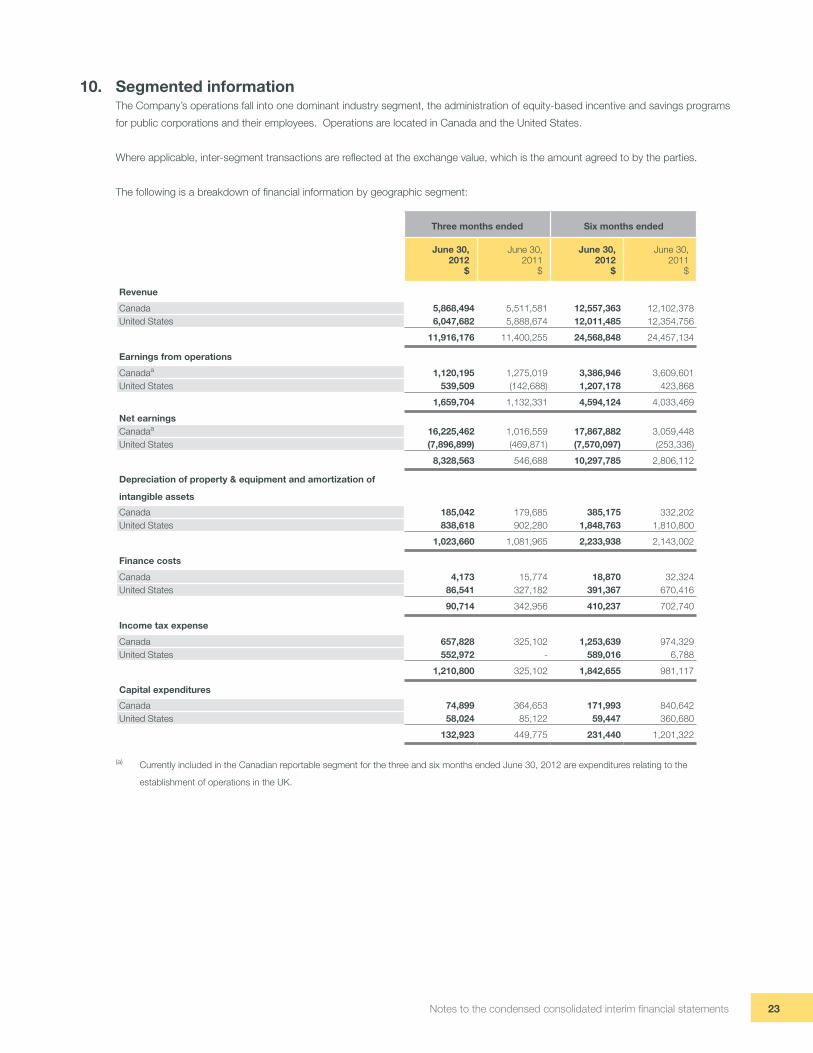
Three months ended Six months ended
June 30, 2012
$
June 30, 2011
$
June 30, 2012
$
June 30, 2011
$
Revenue
Canada 5,868,494 5,511,581 12,557,363 12,102,378United States 6,047,682 5,888,674 12,011,485 12,354,756
11,916,176 11,400,255 24,568,848 24,457,134
Earnings from operations
Canadaa 1,120,195 1,275,019 3,386,946 3,609,601United States 539,509 (142,688) 1,207,178 423,868
1,659,704 1,132,331 4,594,124 4,033,469
Net earningsCanadaa 16,225,462 1,016,559 17,867,882 3,059,448United States (7,896,899) (469,871) (7,570,097) (253,336)
8,328,563 546,688 10,297,785 2,806,112
Depreciation of property & equipment and amortization of
intangible assets
Canada 185,042 179,685 385,175 332,202United States 838,618 902,280 1,848,763 1,810,800
1,023,660 1,081,965 2,233,938 2,143,002
Finance costs
Canada 4,173 15,774 18,870 32,324United States 86,541 327,182 391,367 670,416
90,714 342,956 410,237 702,740
Income tax expense
Canada 657,828 325,102 1,253,639 974,329United States 552,972 - 589,016 6,788
1,210,800 325,102 1,842,655 981,117
Capital expenditures
Canada 74,899 364,653 171,993 840,642United States 58,024 85,122 59,447 360,680
132,923 449,775 231,440 1,201,322
10. Segmented informationThe Company’s operations fall into one dominant industry segment, the administration of equity-based incentive and savings programs
for public corporations and their employees. Operations are located in Canada and the United States.
Where applicable, inter-segment transactions are refl ected at the exchange value, which is the amount agreed to by the parties.
The following is a breakdown of fi nancial information by geographic segment:
(a) Currently included in the Canadian reportable segment for the three and six months ended June 30, 2012 are expenditures relating to the
establishment of operations in the UK.
23Notes to the condensed consolidated interim fi nancial statements

Segmented information (continued)
As at
June 30, 2012
$
December 31,2011
$
Total Assets
Canada 31,606,716 29,809,804United States 26,999,487 32,900,688
58,606,203 62,710,492
Property & equipment and intangible assets, excluding goodwill
Canada 2,472,260 2,685,443United States 17,958,321 24,529,644
20,430,581 27,215,087
GoodwillCanada 249,030 249,030United States 12,218,316 9,863,352
12,467,346 10,112,382
24 Solium Capital 2012 Second Quarter Report
Notes to the condensed consolidated interim fi nancial statements

25Notes to the condensed consolidated interim fi nancial statements

26 Solium Capital 2012 Second Quarter Report
Notes to the condensed consolidated interim fi nancial statements

Corporate information
Executive team
Mike Broadfoot / CEO and Managing Director
Brian Craig / Managing Director
Jeff English / Managing Director
Marcos Lopez / Managing Director
Rudi Bester / Executive Vice President, Global Sales
June Davenport / Executive Director, Corporate Services
Jeannie Kezama / Executive Vice President, Human Resources
Lynn Leong / Executive Vice President, Finance & Administration
Scott Scobie / Executive Vice President, Service Operations
Board of directors
Mike Broadfoot / Director
Brian Craig / Executive Chairman
Michael Deleray / Director
Jeff English / Director
Marcos Lopez / Director
Colleen Moorehead / Lead Director
Tom Muir / Director
Investor information
Transfer agent / Computershare Trust Company of Canada
Lead counsel / Norton Rose Canada LLP
Auditor / Deloitte & Touche LLP
Stock listing and symbol / TSX, Symbol: SUM
Investor contact
Mike Broadfoot / CEO and Managing Director
Solium
403.472.5446
Aaron Kabucis, CFA
TMX | Equicom
416.815.0700 x 230
Headquarters
Calgary, Alberta
1500, 800 6 Avenue SW
Calgary, AB T2P 3G3
Phone: 403.515.3910
Fax: 403.515.3919
Regional offi ces
Toronto, Ontario
905, 150 Ferrand Drive
Toronto, ON M3C 3E5
Montreal, Quebec
620, 999 de Maisonneuve Boulevard West
Montreal, QC H3A 3L4
Shelton, Connecticut
2 Enterprise Drive
Shelton, CT 06484
Tempe, Arizona
510, 60 East Rio Salado Parkway
Tempe, AZ 85281
London, UK
213, 31 Southampton Row
London, UK WC1B 5HJ
27Corporate information

Contact
Headquarters: 403.515.3910
UK offi ce: + 44 (0) 203 585 1209
solium.com
© Solium Capital 2012. All rights reserved. Solium Capital, Solium Transcentive,
StockVantage, and the Solium logo are trademarks or registered trademarks of
Solium Capital in the U.S. and/or Canada.