Embed Size (px)
Citation preview
FINANCIAL STABILITY DEPARTMENT
QUARTERLY REVIEW OF THE DYNAMICS OF
FINANCIAL STABILITY INDICATORS FOR THE
REPUBLIC OF SERBIA
Fourth Quarter 2021
March 2022

Chart 1.1. Financial soundness of Serbian banks compared to regional average annually 2
Chart 1.2. Overview of key macroeconomic risks annually 3
Table 1.1. Key macroprudential indicators quarterly 4
Table 1.2. Financial sector structure quarterly 5
Chart 2.1. Capital adequacy ratio and Tier 1 capital to risk-weighted assets quarterly 7
Chart 2.2. Distribution of Tier 1 to risk-weighted assets (number of banks in each category) quarterly 7
Chart 2.3. Leverage indicators quarterly 7
Chart 2.4. FX-claims to total banking sector claims on corporate sector and households quarterly 9
Chart 2.5. FX-deposits to total deposits quarterly 9
Chart 2.6. New FX-loans to total new loans quarterly 9
Chart 2.7. New FX-deposits to total new deposits quarterly 9
Chart 2.8. Bank claims on corporate sector by sectoral structure quarterly 9
Chart 2.9. Non-performing loans quarterly 9
Chart 2.10. Non-performing loans to capital quarterly 9
Chart 2.11. Non-performing loans coverage quarterly 9
Chart 2.12. Categories D and E quarterly 10
Chart 2.13. Risk-weighted assets and total assets movement quarterly 10
Chart 2.14. Funding sources quarterly 10
Chart 2.15. Total assets structure quarterly 10
Chart 2.16. Liabilities structure quarterly 10
Chart 2.17. Quarterly breakdown of the sector's long and short FX position (in EUR) and foreign exchange
risk ratio
quarterly 10
Chart 2.18. Profitability indicators quarterly 12
Chart 2.19. Banks w/ ROE below 5% quarterly 12
Chart 2.20. Banks that have encountered losses quarterly 12
Chart 2.21. Gross operating income structure quarterly 12
Chart 2.22. Contributions to net operating income growth quarterly 12
Chart 2.23. Gain/loss before taxes quarterly 12
Chart 2.24. Banks w/ cost-to-income ratio above 80% quarterly 12
Chart 2.25. Interest rates on RSD loans monthly 12
Chart 2.26. Interest rates on EUR loans monthly 13
Chart 2.27. Interest rates on RSD saving deposits monthly 13
Chart 2.28. Interest rates on EUR saving deposits monthly 13
Chart 2.29. LTD ratio monthly 15
Chart 2.30. Average monthly liquidity ratio monthly 15
Chart 2.31. Average monthly narrow liquidity ratio monthly 15
Chart 2.32. Liquid assets monthly 15
Chart 2.33. Household and corporate deposits to monetary aggregates monthly 15
Chart 2.34. Banks` FX-reserves to household and corporate FX-deposits monthly 15
Chart 3.1. Total premium per capita at certain date 17
1. Financial Soundness Indicators
2. Banking sector
Content
2.1. Capital adequacy
3.1. Insurance sector
3. Non-banking financial sector
2.4. Liquidity
2.3. Profitability
2.2. Asset and funding quality
Chart 3.2. Total premium to GDP at certain date 17
Chart 3.3. Ownership structure of insurance companies at certain date 17
Chart 3.4. Coverage structure of technical reserves in life insurance at certain date 17
Chart 3.5. Coverage structure of technical reserves in non-life insurance at certain date 17
Chart 3.6. Profitability indicators for life insurance companies annually 17
Chart 3.7. Profitability indicators for non-life insurance companies annually 17
Chart 3.8. Combined insurance ratio quarterly 17
Chart 3.9. Total VPF net assets and index FONDex monthly 19
Chart 3.10. Net assets growth and net contributions to VPF quarterly 19
Chart 3.11. VPF asset structure at certain date 19
Chart 3.12. Investment structure by lessee at certain date 21
Chart 3.13. Investment structure by leasing object at certain date 21
Chart 4.1. Industrial production index quarterly 23
Chart 4.2. Growth of corporate loans monthly 23
Chart 4.3. Currency structure of domestic corporate loans quarterly 23
Chart 4.4. Enforced collection quarterly 23
Chart 4.5. NFC Debt-to-GDP ratio quarterly 23
Chart 5.1. Consumer prices and net household earnings monthly 25
Chart 5.2. Household loans growth monthly 25
Chart 5.3. Currency structure of household loans monthly 25
Chart 5.4. Currency structure of households deposits within banks monthly 25
Chart 5.5. Contributions to growth of FX savings monthly 25
Chart 5.6. Contributions to growth of RSD savings monthly 25
Table 5.1. Household sector performance indicators quarterly 26
Chart 6.1. Regional sovereign credit ratings dynamics monthly 28
Chart 6.2. Sovereign credit ratings dynamics of home countries of banks whose subsidiaries operate in
Serbia
monthly 28
Chart 6.3. CDS spreads on bonds of home countries of parent banks whose subsidiaries operate in Serbia monthly 28
Chart 6.4. Sovereign bond yields: Serbia and CEE region monthly 28
Chart 6.5. Sovereign bond yields: Serbia and home countries of parent banks whose subsidiaries operate in
Serbia
monthly 28
Chart 6.6. Emerging Market Bond Index Global: EMBIG Serbia and EMBIG Composite daily 28
Chart 6.7. Emerging Market Bond Index: Serbia and CEE countries daily 28
Chart 6.8. ECB interest rates and EONIA daily 28
Chart 6.9. 3M money-market interest rates 29
Chart 6.10. Risk premium on the interbank money market monthly 29
Chart 6.11. Inflation in the eurozone monthly 29
Chart 6.12. CDS spreads on bonds issued by Greek parent banks whose subsidiaries operate in Serbia daily 29
Chart 6.13. CDS spreads on bonds issued by Italian parent banks whose subsidiaries operate in Serbia monthly 29
Chart 6.14. CDS spreads on bonds issued by Austrian parent banks whose subsidiaries operate in Serbia monthly 29
Chart 6.15. Stock price dynamics of Greek parent bank whose subsidiaries operate in Serbia daily 29
Chart 6.16. Stock price dynamics of Italian parent banks whose subsidiaries operate in Serbia daily 29
Chart 6.17. Stock price dynamics of Austrian parent banks whose subsidiaries operate in Serbia daily 30
Chart 6.18. Stock price dynamics of Hungarian parent bank whose subsidiaries operate in Serbia daily 30
Chart 6.19. Ownership structure of banks in Serbia quarterly 30
Chart 6.20. BIS member banks` gross exposure towards emerging markets quarterly 30
4. Corporate sector
5. Household sector
6. Macroeconomic environment
6.1. International macroeconomic environment
3.3. Leasing sector
3.2. Voluntary pension funds sector
Chart 6.21. Contributions to real GDP growth by production-side components quarterly 32
Chart 6.22. Contributions to real GDP growth by expenditure-side components quarterly 32
Chart 6.23. Industrial production index monthly 32
Chart 6.24. Unemployment rate quarterly 32
Chart 6.25. Consumer price index monthly 32
Chart 6.26. Contributions to CPI changes monthly 32
Chart 6.27. NBS key policy rate and BEONIA daily 32
Chart 6.28. BELIBOR interest rates monthly 32
Chart 6.29. Exchange rate dynamics of national currencies against the euro daily 33
Chart 6.30. Dynamics of the RSD exchange rate against EUR, CHF and USD monthly 33
Chart 6.31. Dynamics of the RSD exchange rate against EUR and NBS interventions on the interbank FX
market
monthly 33
Chart 6.32. Current account deficit quarterly 33
Chart 6.33. Net foreign direct investments quarterly 33
Chart 6.34. Coverage of imports by FX reserves quarterly 35
Chart 6.35. Coverage of short-term external debt at remaining maturity by FX reserves quarterly 35
Chart 6.36. Coverage of high-power (H) money by FX reserves quarterly 35
Chart 6.37. Coverage of M1 monetary aggregate by FX reserves quarterly 35
Chart 6.38. Fiscal result monthly 37
Chart 6.39. Public revenues and expenditures quarterly 37
Chart 6.40. Public debt dynamics quarterly 37
Chart 6.41. Public debt by currency quarterly 37
Chart 6.42. Internal and external component of public debt quarterly 37
Chart 6.43. Government securities sold on the primary market by buyers monthly 37
Chart 7.1. Primary market demand for RSD government bonds monthly 39
Chart 7.2. Realisation rate and foreign investors` share in auctions of RSD government bonds monthly 39
Chart 7.3. Interest rates on treasury bills, primary market monthly 39
Chart 7.4. Interest rates on zero coupon RSD government securities monthly 39
Chart 7.5. RSD government securities, outstanding stock quarterly 39
Chart 7.6. RSD government bonds investors structure monthly 39
Chart 7.7. Euro-denominated government bonds, outstanding stock quarterly 39
Chart 7.8. RSD government bonds, monthly turnover monthly 39
Chart 7.9. Maturity of RSD government securities monthly 40
Chart 7.10. Belgrade Stock Exchange market capitalisation quarterly 40
Chart 7.11. Stock markets' indices daily 40
Chart 7.12. Real estate index DOMex quarterly 40
Chart 7.13. Indices of the number of newly issued building permits monthly 40
41
7. Financial markets and real estate market
6.3. FX reserves adequacy indicators
6.4. Indebtedness of the Republic of Serbia
Definitions
6.2. Domestic macroeconomic environment
1. Financial soundness indicators
1
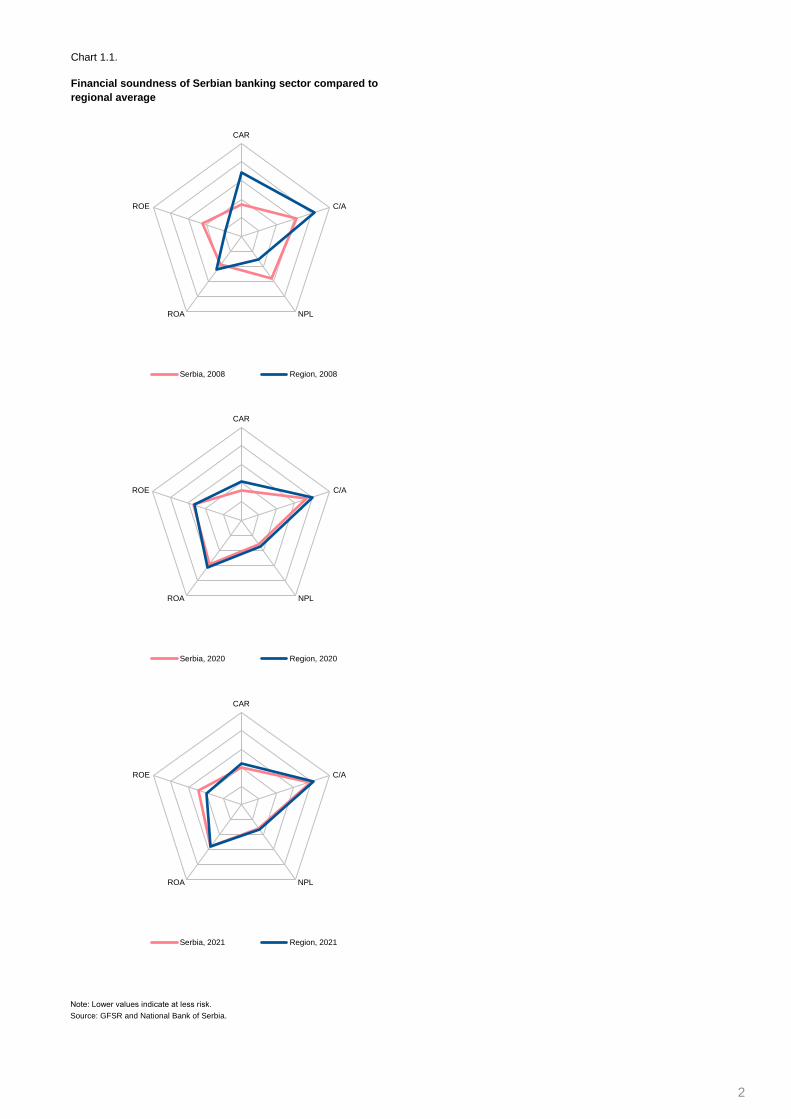
Chart 1.1.
Note: Lower values indicate at less risk.
Source: GFSR and National Bank of Serbia.
Financial soundness of Serbian banking sector compared to
regional average
CAR
C/A
NPLROA
ROE
Serbia, 2008 Region, 2008
CAR
C/A
NPLROA
ROE
Serbia, 2020 Region, 2020
CAR
C/A
NPLROA
ROE
Serbia, 2021 Region, 2021
2
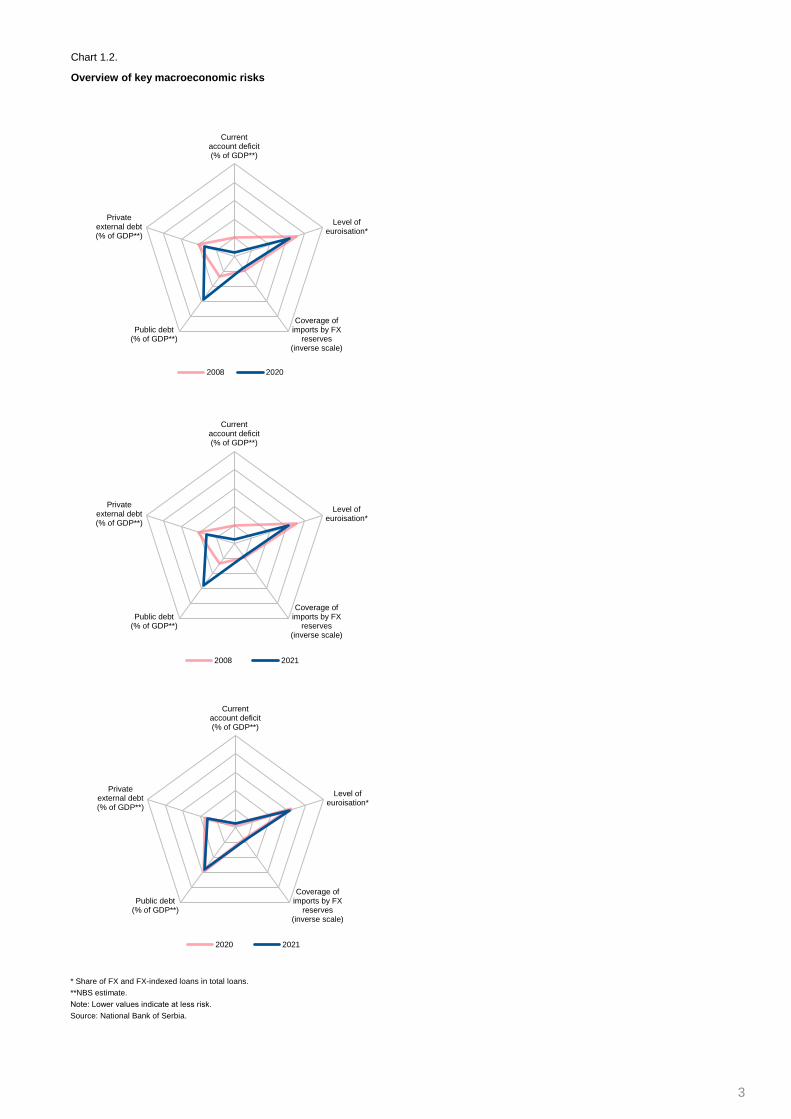
Chart 1.2.
* Share of FX and FX-indexed loans in total loans.
**NBS estimate.
Note: Lower values indicate at less risk.
Source: National Bank of Serbia.
Overview of key macroeconomic risks
Currentaccount deficit(% of GDP**)
Level ofeuroisation*
Coverage ofimports by FX
reserves(inverse scale)
Public debt(% of GDP**)
Privateexternal debt(% of GDP**)
2008 2020
Currentaccount deficit(% of GDP**)
Level ofeuroisation*
Coverage ofimports by FX
reserves(inverse scale)
Public debt(% of GDP**)
Privateexternal debt(% of GDP**)
2008 2021
Currentaccount deficit(% of GDP**)
Level ofeuroisation*
Coverage ofimports by FX
reserves(inverse scale)
Public debt(% of GDP**)
Privateexternal debt(% of GDP**)
2020 2021
3
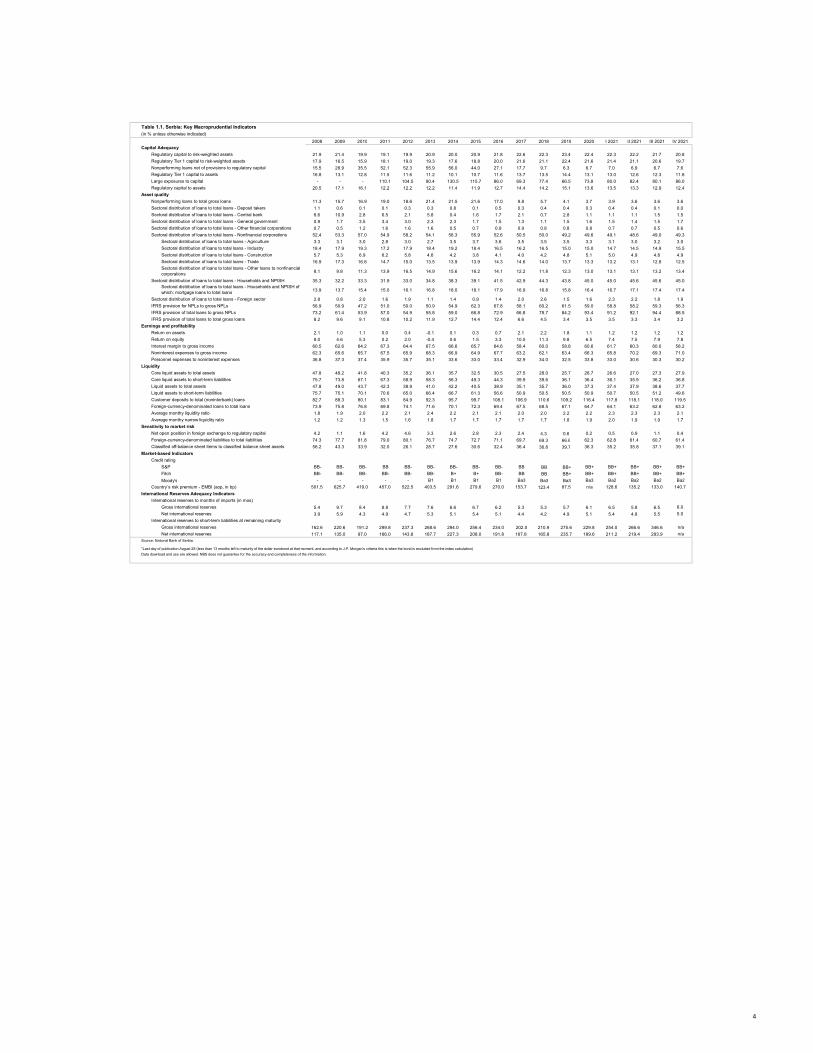
Table 1.1. Serbia: Key Macroprudential Indicators(in % unless otherwise indicated)
2008 2009 2010 2011 2012 2013 2014 2015 2016 2017 2018 2019 2020 I 2021 II 2021 III 2021 IV 2021
Capital Adequacy
Regulatory capital to risk-weighted assets 21.9 21.4 19.9 19.1 19.9 20.9 20.0 20.9 21.8 22.6 22.3 23.4 22.4 22.3 22.2 21.7 20.8
Regulatory Tier 1 capital to risk-weighted assets 17.9 16.5 15.9 18.1 19.0 19.3 17.6 18.8 20.0 21.6 21.1 22.4 21.6 21.4 21.1 20.6 19.7
Nonperforming loans net of provisions to regulatory capital 15.5 26.9 35.5 52.1 52.3 55.9 56.0 44.0 27.1 17.7 9.7 6.3 6.7 7.0 6.9 6.7 7.6
Regulatory Tier 1 capital to assets 16.8 13.1 12.8 11.5 11.6 11.2 10.1 10.7 11.6 13.7 13.5 14.4 13.1 13.0 12.6 12.3 11.8
Large exposures to capital - - - 110.1 104.5 90.4 130.5 115.7 86.0 69.3 77.4 66.5 73.8 80.0 82.4 80.1 86.0
Regulatory capital to assets 20.5 17.1 16.1 12.2 12.2 12.2 11.4 11.9 12.7 14.4 14.2 15.1 13.6 13.5 13.3 12.9 12.4
Asset quality
Nonperforming loans to total gross loans 11.3 15.7 16.9 19.0 18.6 21.4 21.5 21.6 17.0 9.8 5.7 4.1 3.7 3.9 3.6 3.6 3.6
Sectoral distribution of loans to total loans - Deposit takers 1.1 0.6 0.1 0.1 0.3 0.3 0.8 0.1 0.5 0.3 0.4 0.4 0.3 0.4 0.4 0.1 0.0
Sectoral distribution of loans to total loans - Central bank 6.6 10.9 2.8 6.5 2.1 5.8 0.4 1.6 1.7 2.1 0.7 2.8 1.1 1.1 1.1 1.5 1.5
Sectoral distribution of loans to total loans - General government 0.9 1.7 3.5 3.4 3.0 2.3 2.3 1.7 1.5 1.3 1.1 1.5 1.6 1.5 1.4 1.5 1.7
Sectoral distribution of loans to total loans - Other financial corporations 0.7 0.5 1.2 1.6 1.6 1.6 0.5 0.7 0.9 0.9 0.8 0.8 0.8 0.7 0.7 0.5 0.6
Sectoral distribution of loans to total loans - Nonfinancial corporations 52.4 53.3 57.0 54.9 58.2 54.1 56.3 55.9 52.6 50.5 50.0 49.2 49.6 49.1 48.6 49.0 49.3
Sectoral distribution of loans to total loans - Agriculture 3.3 3.1 3.0 2.8 3.0 2.7 3.5 3.7 3.6 3.5 3.5 3.5 3.3 3.1 3.0 3.2 3.0
Sectoral distribution of loans to total loans - Industry 18.4 17.9 19.3 17.2 17.9 18.4 19.2 18.4 16.5 16.2 16.5 15.0 15.0 14.7 14.5 14.9 15.5
Sectoral distribution of loans to total loans - Construction 5.7 5.3 6.9 6.2 5.8 4.6 4.2 3.8 4.1 4.0 4.2 4.8 5.1 5.0 4.9 4.8 4.9
Sectoral distribution of loans to total loans - Trade 16.9 17.3 16.6 14.7 15.0 13.5 13.9 13.9 14.3 14.6 14.0 13.7 13.3 13.2 13.1 12.8 12.5
Sectoral distribution of loans to total loans - Other loans to nonfinancial corporations
8.1 9.8 11.3 13.9 16.5 14.9 15.6 16.2 14.1 12.2 11.8 12.3 13.0 13.1 13.1 13.2 13.4
Sectoral distribution of loans to total loans - Households and NPISH 35.3 32.2 33.3 31.9 33.0 34.8 38.3 39.1 41.5 42.9 44.3 43.8 45.0 45.0 45.6 45.6 45.0Sectoral distribution of loans to total loans - Households and NPISH of which: mortgage loans to total loans 13.9 13.7 15.4 15.0 16.1 16.8 18.0 18.1 17.9 16.9 16.8 15.8 16.4 16.7 17.1 17.4 17.4
Sectoral distribution of loans to total loans - Foreign sector 2.8 0.8 2.0 1.6 1.9 1.1 1.4 0.9 1.4 2.0 2.6 1.5 1.6 2.3 2.2 1.8 1.9
IFRS provision for NPLs to gross NPLs 56.9 50.9 47.2 51.0 50.0 50.9 54.9 62.3 67.8 58.1 60.2 61.5 59.0 58.8 58.2 59.3 56.3
IFRS provision of total loans to gross NPLs 73.2 61.4 53.9 57.0 54.9 55.8 59.0 66.8 72.9 66.8 78.7 84.2 93.4 91.2 92.1 94.4 88.5
IFRS provision of total loans to total gross loans 8.2 9.6 9.1 10.8 10.2 11.9 12.7 14.4 12.4 6.6 4.5 3.4 3.5 3.5 3.3 3.4 3.2
Earnings and profitability
Return on assets 2.1 1.0 1.1 0.0 0.4 -0.1 0.1 0.3 0.7 2.1 2.2 1.8 1.1 1.2 1.2 1.2 1.2
Return on equity 9.0 4.6 5.3 0.2 2.0 -0.4 0.6 1.5 3.3 10.5 11.3 9.8 6.5 7.4 7.5 7.9 7.8
Interest margin to gross income 60.5 62.6 64.2 67.3 64.4 67.5 66.6 65.7 64.6 58.4 60.0 58.8 60.6 61.7 60.3 60.0 58.2
Noninterest expenses to gross income 62.3 65.6 65.7 67.5 65.9 68.3 66.9 64.9 67.7 63.2 62.1 63.4 66.3 65.8 70.2 69.3 71.0
Personnel expenses to noninterest expenses 36.8 37.3 37.4 35.9 35.7 35.1 33.6 33.0 33.4 32.9 34.0 32.5 33.8 33.0 30.6 30.3 30.2
Liquidity
Core liquid assets to total assets 47.8 48.2 41.8 40.3 35.2 36.1 35.7 32.5 30.5 27.5 28.0 25.7 26.7 26.6 27.0 27.3 27.9
Core liquid assets to short-term liabilities 75.7 73.8 67.1 67.3 58.9 58.3 56.3 49.3 44.3 39.9 39.6 36.1 36.4 36.1 35.9 36.2 36.8
Liquid assets to total assets 47.8 49.0 43.7 42.3 38.9 41.0 42.2 40.5 38.9 35.1 35.7 36.0 37.3 37.4 37.9 38.6 37.7
Liquid assets to short-term liabilities 75.7 75.1 70.1 70.6 65.0 66.4 66.7 61.3 56.6 50.9 50.5 50.5 50.9 50.7 50.5 51.2 49.6
Customer deposits to total (noninterbank) loans 82.7 88.3 80.1 83.1 84.9 92.3 95.7 99.7 108.1 106.9 110.6 109.2 116.4 117.8 118.1 118.0 119.5
Foreign-currency-denominated loans to total loans 73.9 75.8 76.8 69.8 74.1 71.6 70.1 72.3 69.4 67.5 68.5 67.1 64.7 64.1 63.2 62.8 63.2
Average monthy liquidity ratio 1.8 1.9 2.0 2.2 2.1 2.4 2.2 2.1 2.1 2.0 2.0 2.2 2.2 2.3 2.3 2.3 2.1
Average monthy narrow liquidity ratio 1.2 1.2 1.3 1.5 1.6 1.8 1.7 1.7 1.7 1.7 1.7 1.8 1.9 2.0 1.9 1.9 1.7
Sensitivity to market risk
Net open position in foreign exchange to regulatory capital 4.2 1.1 1.6 4.2 4.6 3.3 2.6 2.8 2.3 2.4 4.3 0.6 0.2 0.5 0.9 1.1 0.4
Foreign-currency-denominated liabilities to total liabilities 74.3 77.7 81.8 79.0 80.1 76.7 74.7 72.7 71.1 69.7 69.3 66.6 62.3 62.8 61.4 60.7 61.4
Classified off-balance sheet items to classified balance sheet assets 56.2 43.3 33.9 32.0 26.1 28.7 27.6 30.6 32.4 36.4 36.8 39.7 36.3 35.2 35.8 37.1 39.1
Market-based Indicators
Credit rating
S&P BB- BB- BB- BB BB- BB- BB- BB- BB- BB BB BB+ BB+ BB+ BB+ BB+ BB+
Fitch BB- BB- BB- BB- BB- BB- B+ B+ BB- BB BB BB+ BB+ BB+ BB+ BB+ BB+
Moody's - - - - - B1 B1 B1 B1 Ba3 Ba3 Ba3 Ba3 Ba2 Ba2 Ba2 Ba2
Country`s risk premium - EMBI (aop, in bp) 501.5 625.7 419.0 457.0 522.5 403.5 291.6 279.6 270.0 153.7 123.4 87.5 n/a 128.6 135.2 133.0 140.7
International Reserves Adequacy Indicators
International reserves to months of imports (in mos)
Gross international reserves 5.4 9.7 8.4 8.8 7.7 7.6 6.6 6.7 6.2 5.3 5.3 5.7 6.1 6.5 5.8 6.5 6.0
Net international reserves 3.9 5.9 4.3 4.9 4.7 5.3 5.1 5.4 5.1 4.4 4.2 4.9 5.1 5.4 4.8 5.5 5.0
International reserves to short-term liabilities at remaining maturity
Gross international reserves 162.6 220.6 191.2 299.8 237.3 268.6 294.0 256.4 234.0 202.0 210.9 275.6 229.8 254.0 266.6 346.6 n/a
Net international reserves 117.1 135.0 97.0 166.0 143.8 187.7 227.3 208.0 191.8 167.8 165.8 235.7 189.6 211.2 219.4 293.9 n/a
Source: National Bank of Serbia.
*Last day of publication August 28 (less than 13 months left to maturity of the dollar eurobond at that moment, and according to J.P. Morgan’s criteria this is when the bond is excluded from the index calculation)
Data download and use аre allowed. NBS does not guarantee for the accuracy and completeness of the information.
4
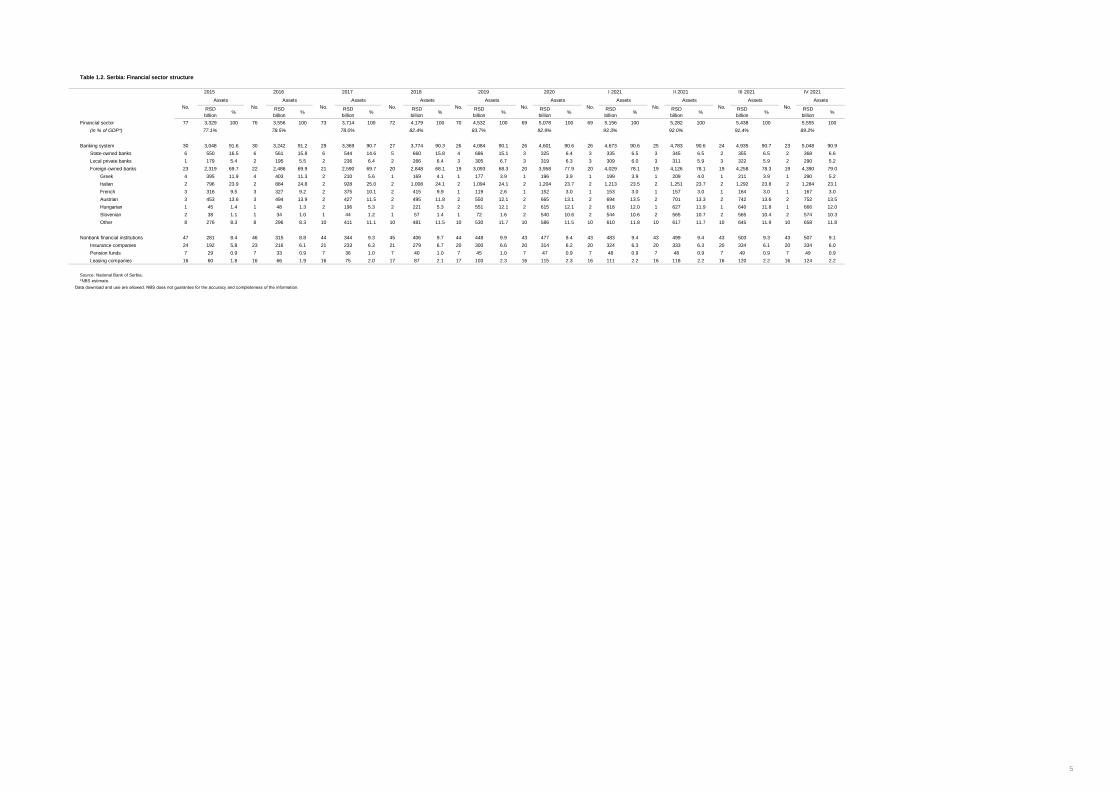
Table 1.2. Serbia: Financial sector structure
RSD
billion%
RSD
billion%
RSD
billion%
RSD
billion%
RSD
billion%
RSD
billion%
RSD
billion%
RSD
billion%
RSD
billion%
RSD
billion%
Financial sector 77 3,329 100 76 3,556 100 73 3,714 100 72 4,179 100 70 4,532 100 69 5,078 100 69 5,156 100 5,282 100 5,438 100 5,555 100
(in % of GDP*) 77.1% 78.5% 78.0% 82.4% 83.7% 92.9% 93.3% 92.0% 91.4% 89.2%
Banking system 30 3,048 91.6 30 3,242 91.2 29 3,369 90.7 27 3,774 90.3 26 4,084 90.1 26 4,601 90.6 26 4,673 90.6 25 4,783 90.6 24 4,935 90.7 23 5,048 90.9
State-owned banks 6 550 16.5 6 561 15.8 6 544 14.6 5 660 15.8 4 686 15.1 3 325 6.4 3 335 6.5 3 345 6.5 2 355 6.5 2 368 6.6
Local private banks 1 179 5.4 2 195 5.5 2 236 6.4 2 266 6.4 3 305 6.7 3 319 6.3 3 309 6.0 3 311 5.9 3 322 5.9 2 290 5.2
Foreign-owned banks 23 2,319 69.7 22 2,486 69.9 21 2,590 69.7 20 2,848 68.1 19 3,093 68.3 20 3,958 77.9 20 4,029 78.1 19 4,126 78.1 19 4,258 78.3 19 4,390 79.0
Greek 4 395 11.9 4 403 11.3 2 210 5.6 1 169 4.1 1 177 3.9 1 196 3.9 1 199 3.9 1 209 4.0 1 211 3.9 1 290 5.2
Italian 2 796 23.9 2 884 24.8 2 928 25.0 2 1,008 24.1 2 1,094 24.1 2 1,204 23.7 2 1,213 23.5 2 1,251 23.7 2 1,292 23.8 2 1,284 23.1
French 3 316 9.5 3 327 9.2 2 375 10.1 2 415 9.9 1 119 2.6 1 152 3.0 1 153 3.0 1 157 3.0 1 164 3.0 1 167 3.0
Austrian 3 453 13.6 3 494 13.9 2 427 11.5 2 495 11.8 2 550 12.1 2 665 13.1 2 694 13.5 2 701 13.3 2 742 13.6 2 752 13.5
Hungarian 1 45 1.4 1 48 1.3 2 196 5.3 2 221 5.3 2 551 12.1 2 615 12.1 2 618 12.0 1 627 11.9 1 640 11.8 1 666 12.0
Slovenian 2 38 1.1 1 34 1.0 1 44 1.2 1 57 1.4 1 72 1.6 2 540 10.6 2 544 10.6 2 565 10.7 2 565 10.4 2 574 10.3
Other 8 276 8.3 8 296 8.3 10 411 11.1 10 481 11.5 10 530 11.7 10 586 11.5 10 610 11.8 10 617 11.7 10 645 11.9 10 658 11.8
Nonbank financial institutions 47 281 8.4 46 315 8.8 44 344 9.3 45 406 9.7 44 448 9.9 43 477 9.4 43 483 9.4 43 499 9.4 43 503 9.3 43 507 9.1
Insurance companies 24 192 5.8 23 216 6.1 21 233 6.3 21 279 6.7 20 300 6.6 20 314 6.2 20 324 6.3 20 333 6.3 20 334 6.1 20 334 6.0
Pension funds 7 29 0.9 7 33 0.9 7 36 1.0 7 40 1.0 7 45 1.0 7 47 0.9 7 48 0.9 7 48 0.9 7 49 0.9 7 49 0.9
Leasing companies 16 60 1.8 16 66 1.9 16 75 2.0 17 87 2.1 17 103 2.3 16 115 2.3 16 111 2.2 16 118 2.2 16 120 2.2 16 124 2.2
Source: National Bank of Serbia.
*NBS estimate.
IV 2021
No.
Assets
III 2021
No.
Assets
I 2021
No.
Assets
II 2021
No.
Assets
2020
No.
Assets
2019
Assets
No.No.
Assets
2016
No.
Assets
2017
Data download and use аre allowed. NBS does not guarantee for the accuracy and completeness of the information.
2018
No.
Assets
2015
No.
Assets
5
2.1. Capital adequacy
2. Banking sector
6
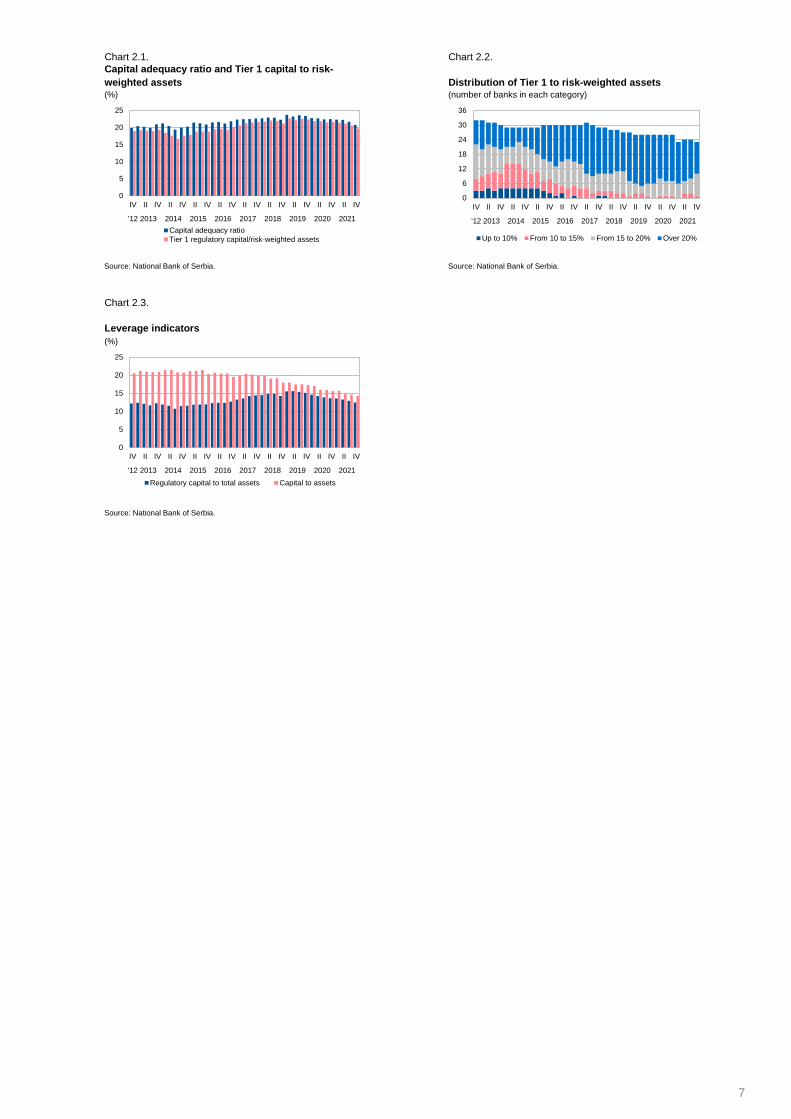
Chart 2.1. Chart 2.2.
(%) (number of banks in each category)
Source: National Bank of Serbia. Source: National Bank of Serbia.
Chart 2.3.
(%)
Source: National Bank of Serbia.
Distribution of Tier 1 to risk-weighted assets
Capital adequacy ratio and Tier 1 capital to risk-
weighted assets
Leverage indicators
0
6
12
18
24
30
36
IV II IV II IV II IV II IV II IV II IV II IV II IV II IV
'12 2013 2014 2015 2016 2017 2018 2019 2020 2021
Up to 10% From 10 to 15% From 15 to 20% Over 20%
0
5
10
15
20
25
IV II IV II IV II IV II IV II IV II IV II IV II IV II IV
'12 2013 2014 2015 2016 2017 2018 2019 2020 2021
Regulatory capital to total assets Capital to assets
0
5
10
15
20
25
IV II IV II IV II IV II IV II IV II IV II IV II IV II IV
'12 2013 2014 2015 2016 2017 2018 2019 2020 2021
Capital adequacy ratio
Tier 1 regulatory capital/risk-weighted assets
7
2.2. Asset and funding quality
2. Banking sector
1,000
1,500
2,000
2,500
3,000
100
150
200
8
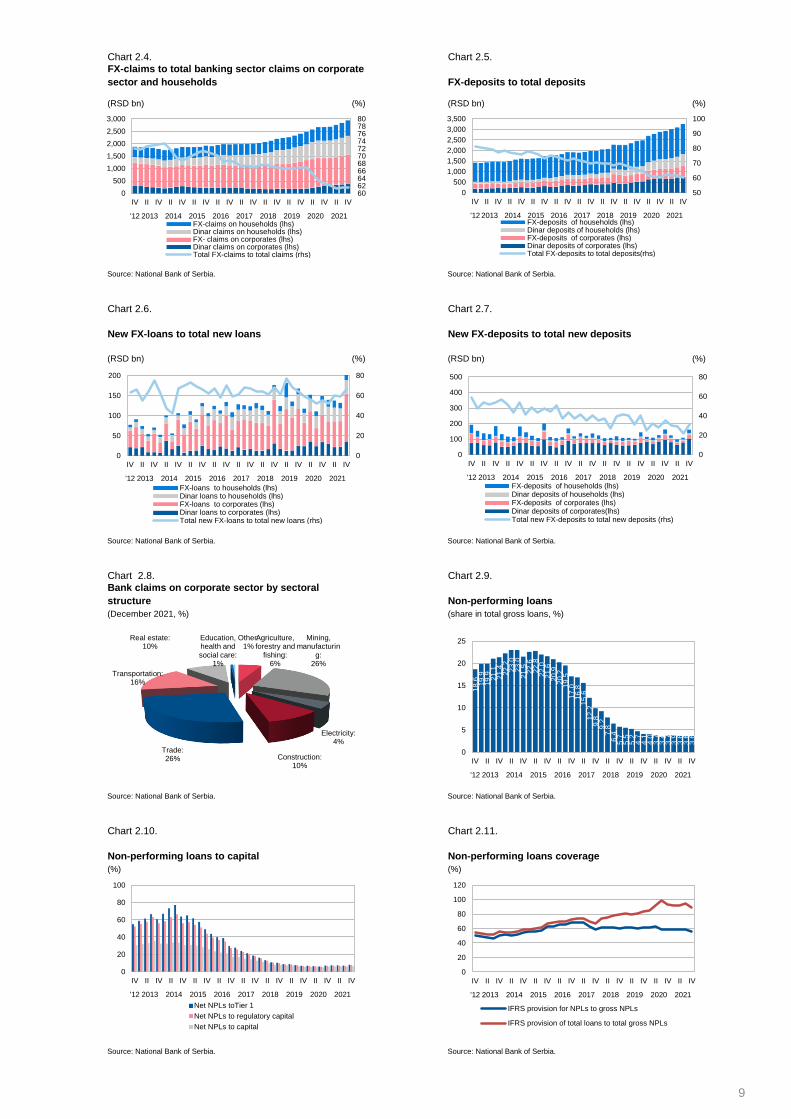
Chart 2.4. Chart 2.5.
(RSD bn) (%) (RSD bn) (%)
Source: National Bank of Serbia. Source: National Bank of Serbia.
Chart 2.6. Chart 2.7.
(RSD bn) (%) (RSD bn) (%)
Source: National Bank of Serbia. Source: National Bank of Serbia.
Chart 2.8. Chart 2.9.
(December 2021, %)
Source: National Bank of Serbia. Source: National Bank of Serbia.
Chart 2.10. Chart 2.11.
(%)
Source: National Bank of Serbia. Source: National Bank of Serbia.
FX-deposits to total deposits
FX-claims to total banking sector claims on corporate
sector and households
(%)
(share in total gross loans, %)
Non-performing loans to capital Non-performing loans coverage
Bank claims on corporate sector by sectoral
structure Non-performing loans
New FX-loans to total new loans New FX-deposits to total new deposits
Agriculture, forestry and
fishing:6%
Mining, manufacturin
g:26%
Electricity:4%
Construction:10%
Trade:26%
Transportation:16%
Real estate:10%
Education, health and social care:
1%
Other:1%
6062646668707274767880
0
500
1,000
1,500
2,000
2,500
3,000
IV II IV II IV II IV II IV II IV II IV II IV II IV II IV
'12 2013 2014 2015 2016 2017 2018 2019 2020 2021FX-claims on households (lhs)Dinar claims on households (lhs)FX- claims on corporates (lhs)Dinar claims on corporates (lhs)Total FX-claims to total claims (rhs)
50
60
70
80
90
100
0
500
1,000
1,500
2,000
2,500
3,000
3,500
IV II IV II IV II IV II IV II IV II IV II IV II IV II IV
'12 2013 2014 2015 2016 2017 2018 2019 2020 2021FX-deposits of households (lhs)Dinar deposits of households (lhs)FX-deposits of corporates (lhs)Dinar deposits of corporates (lhs)Total FX-deposits to total deposits(rhs)
0
20
40
60
80
0
50
100
150
200
IV II IV II IV II IV II IV II IV II IV II IV II IV II IV
'12 2013 2014 2015 2016 2017 2018 2019 2020 2021
FX-loans to households (lhs)Dinar loans to households (lhs)FX-loans to corporates (lhs)Dinar loans to corporates (lhs)Total new FX-loans to total new loans (rhs)
0
20
40
60
80
0
100
200
300
400
500
IV II IV II IV II IV II IV II IV II IV II IV II IV II IV
'12 2013 2014 2015 2016 2017 2018 2019 2020 2021FX-deposits of households (lhs)Dinar deposits of households (lhs)FX-deposits of corporates (lhs)Dinar deposits of corporates(lhs)Total new FX-deposits to total new deposits (rhs)
18
.6 19
.919.9 21
.121.4
22.2
23.0
23
.02
1.5
22.6
22.8
22
.02
1.6
20.9
20
.219.5
17
.01
6.8
15
.61
2.2
9.8
9.2
7.8
6.4
5.7
5.5
5.2
4.7
4.1
4.0
3.7
3.4
3.7
3.9
3.6
3.6
3.6
0
5
10
15
20
25
IV II IV II IV II IV II IV II IV II IV II IV II IV II IV
'12 2013 2014 2015 2016 2017 2018 2019 2020 2021
0
20
40
60
80
100
IV II IV II IV II IV II IV II IV II IV II IV II IV II IV
'12 2013 2014 2015 2016 2017 2018 2019 2020 2021
Net NPLs toTier 1
Net NPLs to regulatory capital
Net NPLs to capital
0
20
40
60
80
100
120
IV II IV II IV II IV II IV II IV II IV II IV II IV II IV
'12 2013 2014 2015 2016 2017 2018 2019 2020 2021
IFRS provision for NPLs to gross NPLs
IFRS provision of total loans to total gross NPLs
10
15
20
25
9
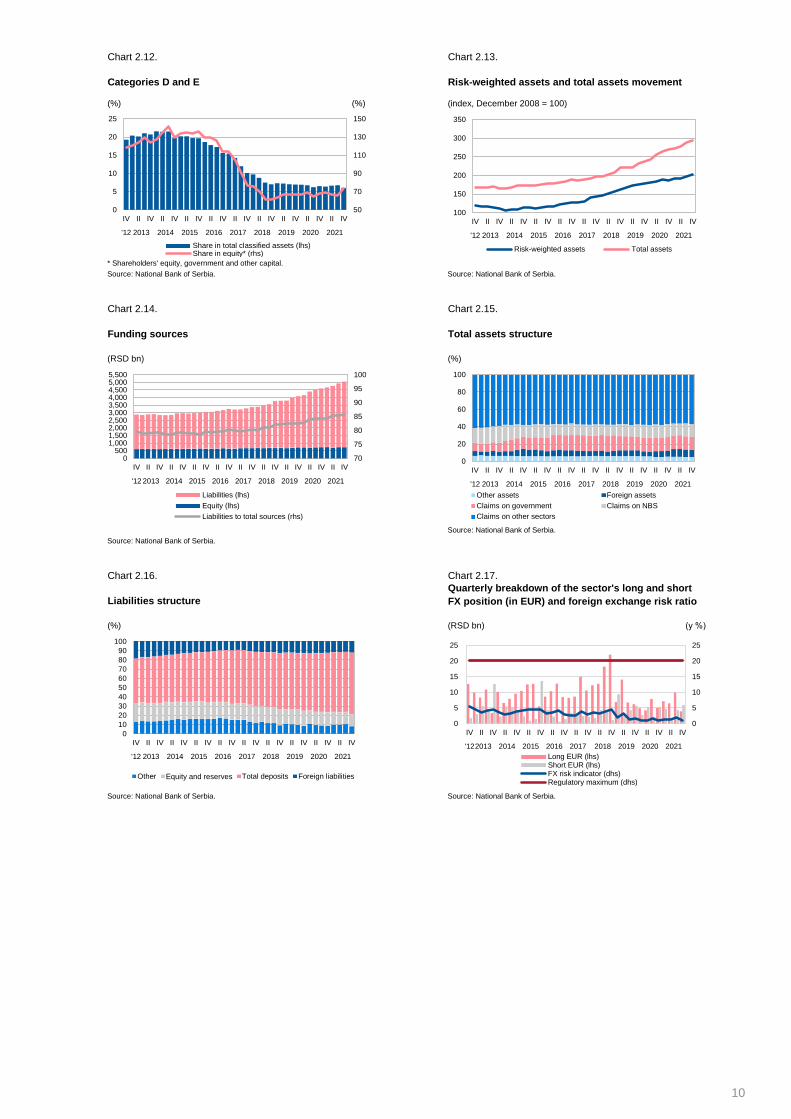
Chart 2.12. Chart 2.13.
(%) (%)
* Shareholders' equity, government and other capital.
Source: National Bank of Serbia. Source: National Bank of Serbia.
Chart 2.14. Chart 2.15.
(%)
Source: National Bank of Serbia.
Source: National Bank of Serbia.
Chart 2.16. Chart 2.17.
(%) (RSD bn) (у %)
Source: National Bank of Serbia. Source: National Bank of Serbia.
Categories D and E Risk-weighted assets and total assets movement
Funding sources
(index, December 2008 = 100)
Liabilities structure
(RSD bn)
Total assets structure
Quarterly breakdown of the sector's long and short
FX position (in EUR) and foreign exchange risk ratio
0
20
40
60
80
50
70
90
110
130
150
0
5
10
15
20
25
IV II IV II IV II IV II IV II IV II IV II IV II IV II IV
'12 2013 2014 2015 2016 2017 2018 2019 2020 2021
Share in total classified assets (lhs)Share in equity* (rhs)
100
150
200
250
300
350
IV II IV II IV II IV II IV II IV II IV II IV II IV II IV
'12 2013 2014 2015 2016 2017 2018 2019 2020 2021
Risk-weighted assets Total assets
70
75
80
85
90
95
100
0500
1,0001,5002,0002,5003,0003,5004,0004,5005,0005,500
IV II IV II IV II IV II IV II IV II IV II IV II IV II IV
'12 2013 2014 2015 2016 2017 2018 2019 2020 2021
Liabilities (lhs)
Equity (lhs)
Liabilities to total sources (rhs)
0
20
40
60
80
100
IV II IV II IV II IV II IV II IV II IV II IV II IV II IV
'12 2013 2014 2015 2016 2017 2018 2019 2020 2021
Other assets Foreign assets
Claims on government Claims on NBS
Claims on other sectors
0
10
20
30
40
50
60
70
80
90
100
IV II IV II IV II IV II IV II IV II IV II IV II IV II IV
'12 2013 2014 2015 2016 2017 2018 2019 2020 2021
Other Еquity and reserves Total deposits Foreign liabilities
0
5
10
15
20
25
0
5
10
15
20
25
IV II IV II IV II IV II IV II IV II IV II IV II IV II IV
'122013 2014 2015 2016 2017 2018 2019 2020 2021
Long EUR (lhs)Short EUR (lhs)FX risk indicator (dhs)Regulatory maximum (dhs)
10
2.3. Profitability
2. Banking sector
10
12
14
16
12
16
11
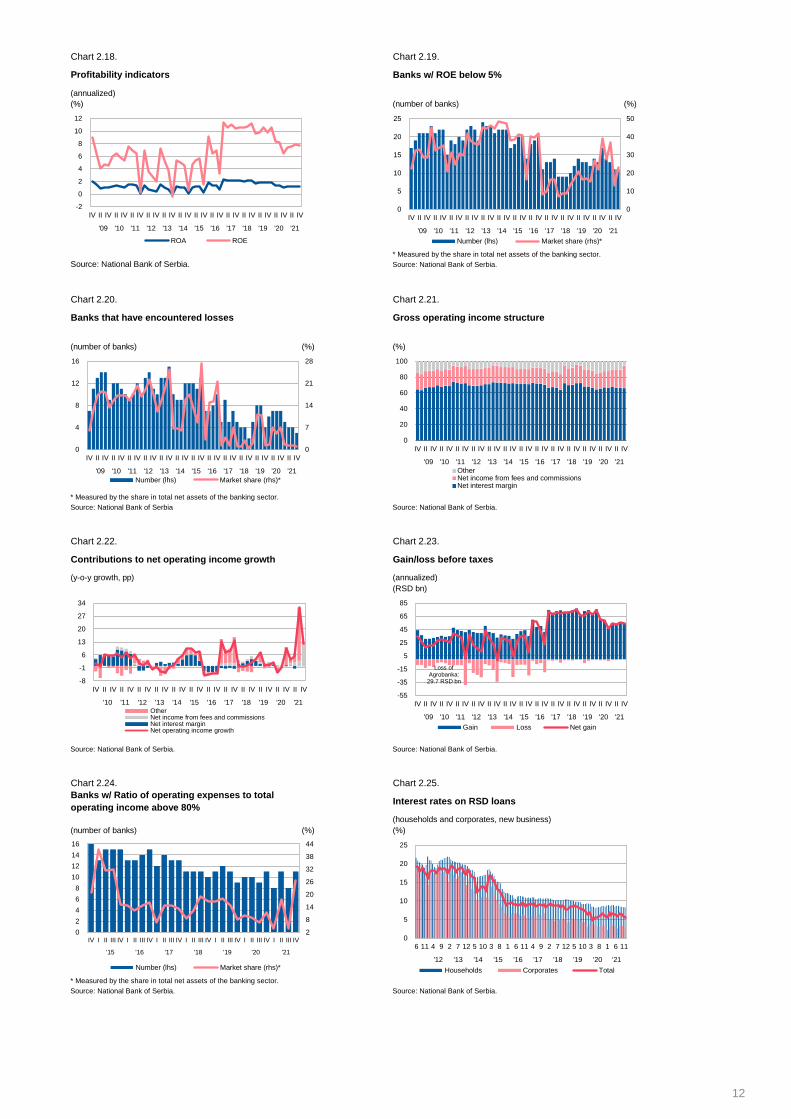
Chart 2.18. Chart 2.19.
(annualized)
(%) (number of banks) (%)
* Measured by the share in total net assets of the banking sector.
Source: National Bank of Serbia. Source: National Bank of Serbia.
Chart 2.20. Chart 2.21.
(number of banks) (%) (%)
* Measured by the share in total net assets of the banking sector.
Source: National Bank of Serbia Source: National Bank of Serbia.
Chart 2.22. Chart 2.23.
(y-o-y growth, pp) (annualized)
(RSD bn)
Source: National Bank of Serbia. Source: National Bank of Serbia.
Chart 2.24. Chart 2.25.
(households and corporates, new business)
(number of banks) (%) (%)
* Measured by the share in total net assets of the banking sector.
Source: National Bank of Serbia. Source: National Bank of Serbia.
Banks that have encountered losses Gross operating income structure
Banks w/ Ratio of operating expenses to total
operating income above 80%
Contributions to net operating income growth
Profitability indicators Banks w/ ROE below 5%
Gain/loss before taxes
Interest rates on RSD loans
-2
0
2
4
6
8
10
12
IV II IV II IV II IV II IV II IV II IV II IV II IV II IV II IV II IV II IV II IV
'09 '10 '11 '12 '13 '14 '15 '16 '17 '18 '19 '20 '21
ROA ROE
-8
-1
6
13
20
27
34
IV II IV II IV II IV II IV II IV II IV II IV II IV II IV II IV II IV II IV
'10 '11 '12 '13 '14 '15 '16 '17 '18 '19 '20 '21OtherNet income from fees and commissionsNet interest marginNet operating income growth
Loss of Agrobanka:
29.7 RSD bn
-55
-35
-15
5
25
45
65
85
IV II IV II IV II IV II IV II IV II IV II IV II IV II IV II IV II IV II IV II IV
'09 '10 '11 '12 '13 '14 '15 '16 '17 '18 '19 '20 '21
Gain Loss Net gain
2
8
14
20
26
32
38
44
0
2
4
6
8
10
12
14
16
IV I II III IV I II III IV I II III IV I II III IV I II III IV I II III IV I II III IV
'15 '16 '17 '18 '19 '20 '21
Number (lhs) Market share (rhs)*
0
5
10
15
20
25
6 11 4 9 2 7 12 5 10 3 8 1 6 11 4 9 2 7 12 5 10 3 8 1 6 11
'12 '13 '14 '15 '16 '17 '18 '19 '20 '21
Households Corporates Total
0
7
14
21
28
0
4
8
12
16
IV II IV II IV II IV II IV II IV II IV II IV II IV II IV II IV II IV II IV II IV
'09 '10 '11 '12 '13 '14 '15 '16 '17 '18 '19 '20 '21
Number (lhs) Market share (rhs)*
0
20
40
60
80
100
IV II IV II IV II IV II IV II IV II IV II IV II IV II IV II IV II IV II IV II IV
'09 '10 '11 '12 '13 '14 '15 '16 '17 '18 '19 '20 '21
OtherNet income from fees and commissionsNet interest margin
0
10
20
30
40
50
0
5
10
15
20
25
IV II IV II IV II IV II IV II IV II IV II IV II IV II IV II IV II IV II IV II IV
'09 '10 '11 '12 '13 '14 '15 '16 '17 '18 '19 '20 '21
Number (lhs) Market share (rhs)*
12
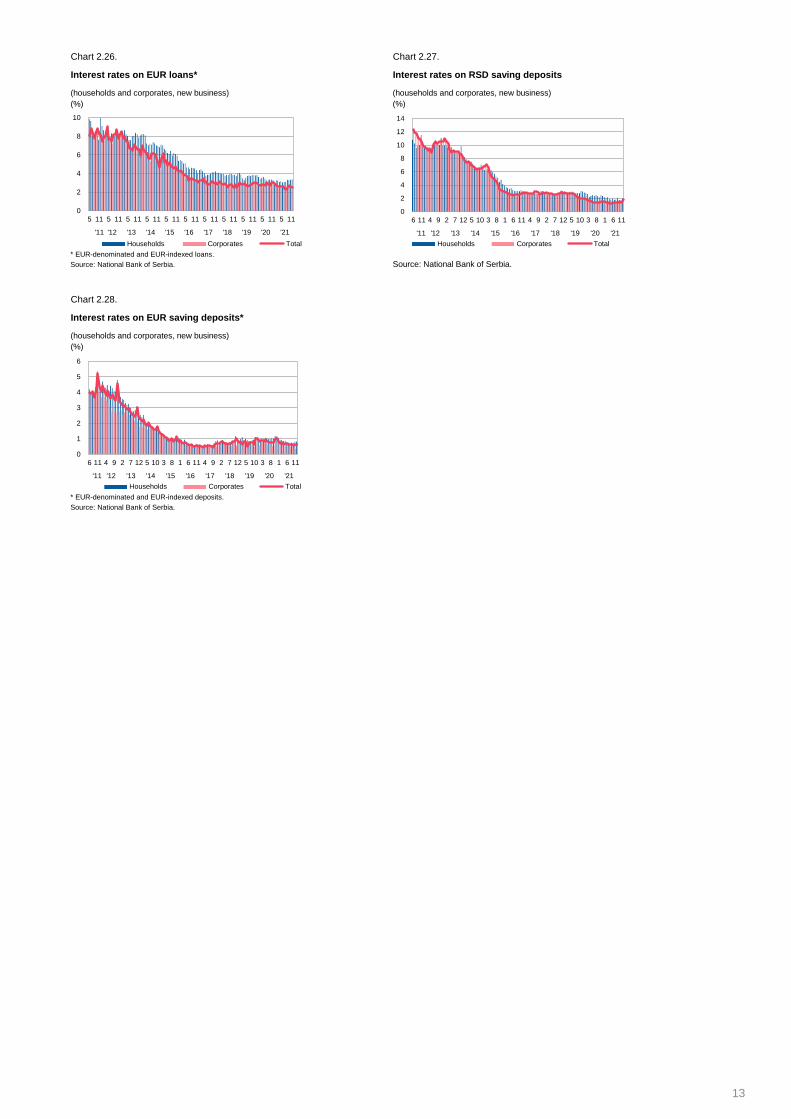
Chart 2.26. Chart 2.27.
(households and corporates, new business) (households and corporates, new business)
(%) (%)
* EUR-denominated and EUR-indexed loans.
Source: National Bank of Serbia. Source: National Bank of Serbia.
Chart 2.28.
(households and corporates, new business)
(%)
* EUR-denominated and EUR-indexed deposits.
Source: National Bank of Serbia.
Interest rates on EUR saving deposits*
Interest rates on EUR loans* Interest rates on RSD saving deposits
0
2
4
6
8
10
5 11 5 11 5 11 5 11 5 11 5 11 5 11 5 11 5 11 5 11 5 11
'11 '12 '13 '14 '15 '16 '17 '18 '19 '20 '21
Households Corporates Total
0
2
4
6
8
10
12
14
6 11 4 9 2 7 12 5 10 3 8 1 6 11 4 9 2 7 12 5 10 3 8 1 6 11
'11 '12 '13 '14 '15 '16 '17 '18 '19 '20 '21
Households Corporates Total
0
1
2
3
4
5
6
6 11 4 9 2 7 12 5 10 3 8 1 6 11 4 9 2 7 12 5 10 3 8 1 6 11
'11 '12 '13 '14 '15 '16 '17 '18 '19 '20 '21
Households Corporates Total
13
2. Banking sector
2.4. Liquidity
14
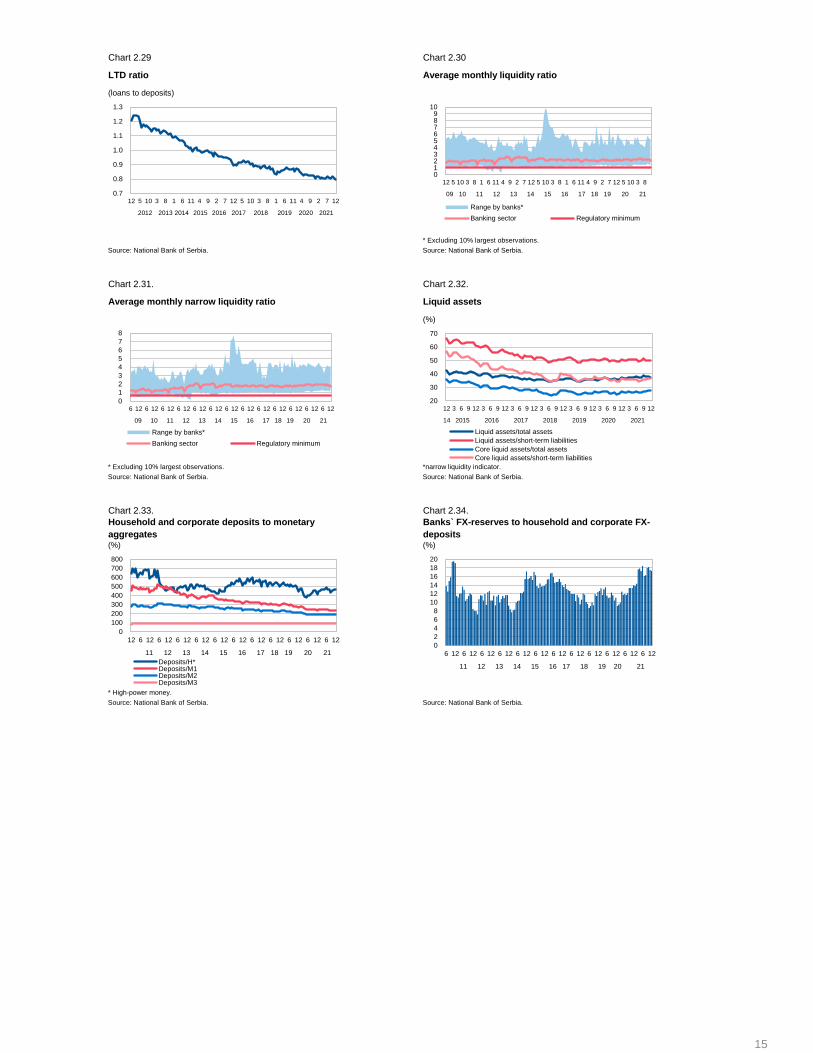
Chart 2.29 Chart 2.30
(loans to deposits)
* Excluding 10% largest observations.
Source: National Bank of Serbia. Source: National Bank of Serbia.
Chart 2.31. Chart 2.32.
(%)
* Excluding 10% largest observations. *narrow liquidity indicator.
Source: National Bank of Serbia. Source: National Bank of Serbia.
Chart 2.33. Chart 2.34.
(%) (%)
* High-power money.
Source: National Bank of Serbia. Source: National Bank of Serbia.
Average monthly narrow liquidity ratio Liquid assets
LTD ratio Average monthly liquidity ratio
Household and corporate deposits to monetary
aggregates
Banks` FX-reserves to household and corporate FX-
deposits
0
100
200
300
400
500
600
700
800
12 6 12 6 12 6 12 6 12 6 12 6 12 6 12 6 12 6 12 6 12 6 12
11 12 13 14 15 16 17 18 19 20 21
Deposits/H*Deposits/M1Deposits/M2Deposits/M3
0.7
0.8
0.9
1.0
1.1
1.2
1.3
12 5 10 3 8 1 6 11 4 9 2 7 12 5 10 3 8 1 6 11 4 9 2 7 12
2012 2013 2014 2015 2016 2017 2018 2019 2020 2021
0123456789
10
12 5 10 3 8 1 6 11 4 9 2 7 12 5 10 3 8 1 6 11 4 9 2 7 12 5 10 3 8
09 10 11 12 13 14 15 16 17 18 19 20 21
Range by banks*
Banking sector Regulatory minimum
20
30
40
50
60
70
12 3 6 9 12 3 6 9 12 3 6 9 12 3 6 9 12 3 6 9 12 3 6 9 12 3 6 9 12
14 2015 2016 2017 2018 2019 2020 2021
Liquid assets/total assets
Liquid assets/short-term liabilities
Core liquid assets/total assets
Core liquid assets/short-term liabilities
0
1
2
3
4
5
6
7
8
6 12 6 12 6 12 6 12 6 12 6 12 6 12 6 12 6 12 6 12 6 12 6 12 6 12
09 10 11 12 13 14 15 16 17 18 19 20 21
Range by banks*
Banking sector Regulatory minimum
0
2
4
6
8
10
12
14
16
18
20
6 12 6 12 6 12 6 12 6 12 6 12 6 12 6 12 6 12 6 12 6 12 6 12
11 12 13 14 15 16 17 18 19 20 21
15
3.1. Insurance sector
3. Non-banking financial sector
1,000
1,500
Government
16
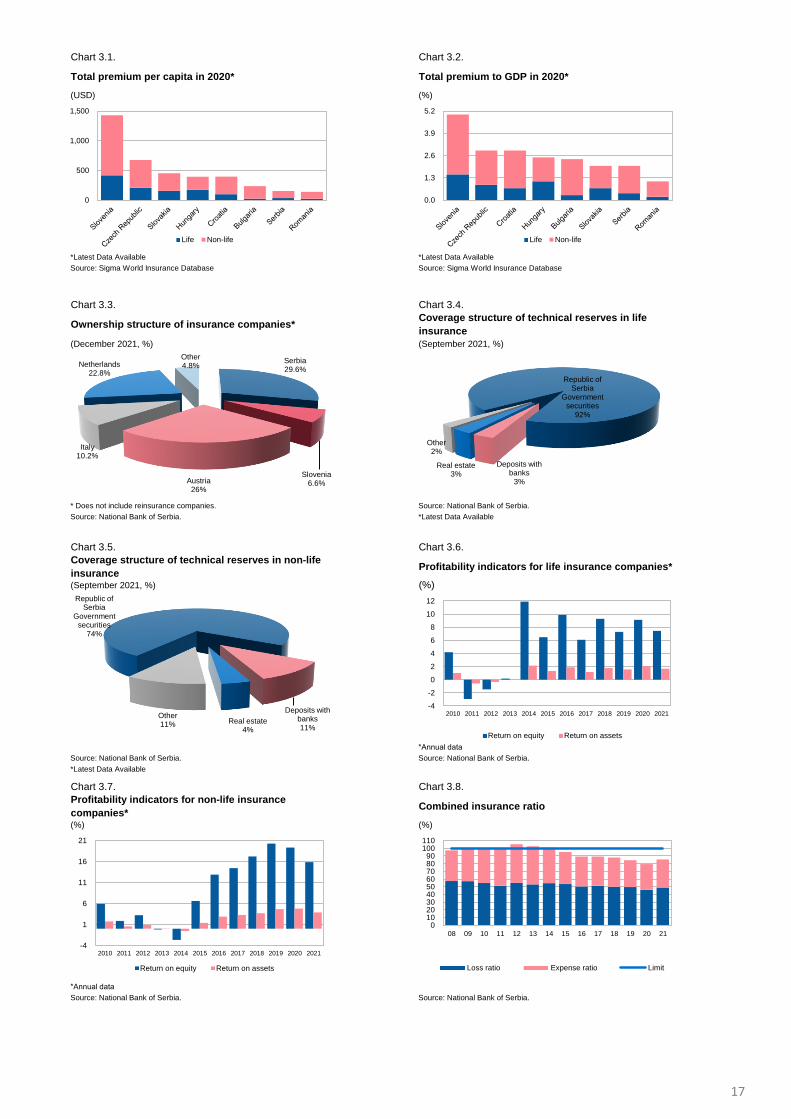
Chart 3.1. Chart 3.2.
(USD) (%)
*Latest Data Available *Latest Data Available
Source: Sigma World Insurance Database Source: Sigma World Insurance Database
Chart 3.3. Chart 3.4.
(December 2021, %) (September 2021, %)
* Does not include reinsurance companies. Source: National Bank of Serbia.
Source: National Bank of Serbia. *Latest Data Available
Chart 3.5. Chart 3.6.
(September 2021, %) (%)
*Аnnual data
Source: National Bank of Serbia. Source: National Bank of Serbia.
*Latest Data Available
Chart 3.7. Chart 3.8.
(%) (%)
*Аnnual data
Source: National Bank of Serbia. Source: National Bank of Serbia.
Ownership structure of insurance companies*
Combined insurance ratio
Profitability indicators for life insurance companies*
Profitability indicators for non-life insurance
companies*
Total premium per capita in 2020* Total premium to GDP in 2020*
Coverage structure of technical reserves in life
insurance
Coverage structure of technical reserves in non-life
insurance
0
500
1,000
1,500
Life Non-life
0.0
1.3
2.6
3.9
5.2
Life Non-life
Serbia29.6%
Slovenia6.6%Austria
26%
Italy10.2%
Netherlands22.8%
Other4.8%
Republic of Serbia
Government securities
92%
Deposits with banks
3%
Real estate3%
Other2%
Republic of Serbia
Government securities
74%
Deposits with banks11%
Real estate4%
Other 11%
-4
-2
0
2
4
6
8
10
12
2010 2011 2012 2013 2014 2015 2016 2017 2018 2019 2020 2021
Return on equity Return on assets
-4
1
6
11
16
21
2010 2011 2012 2013 2014 2015 2016 2017 2018 2019 2020 2021
Return on equity Return on assets
0102030405060708090
100110
08 09 10 11 12 13 14 15 16 17 18 19 20 21
Loss ratio Expense ratio Limit
17
3.2. Voluntary pension funds sector
3. Non-banking financial sector
18
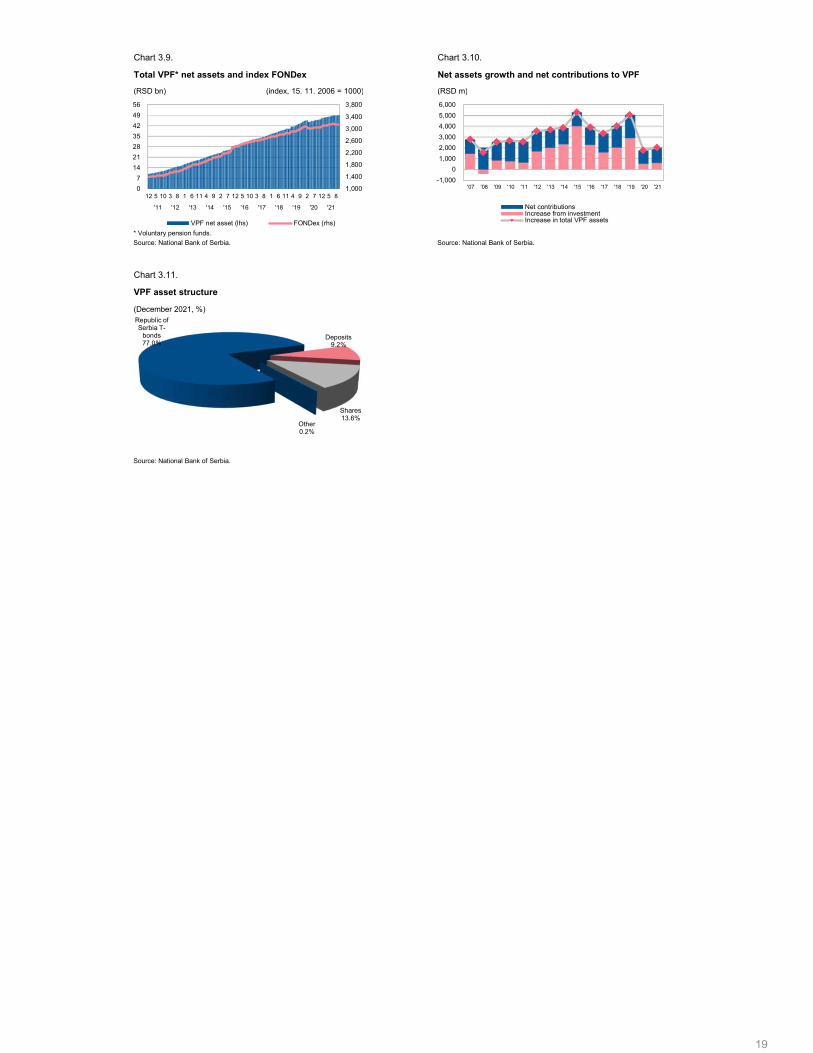
Chart 3.9. Chart 3.10.
(RSD bn) (index, 15. 11. 2006 = 1000) (RSD m)
* Voluntary pension funds.
Source: National Bank of Serbia. Source: National Bank of Serbia.
Chart 3.11.
(December 2021, %)
Source: National Bank of Serbia.
Net assets growth and net contributions to VPFTotal VPF* net assets and index FONDex
VPF asset structure
1,000
1,400
1,800
2,200
2,600
3,000
3,400
3,800
0
7
14
21
28
35
42
49
56
12 5 10 3 8 1 6 11 4 9 2 7 12 5 10 3 8 1 6 11 4 9 2 7 12 5 8
'11 '12 '13 '14 '15 '16 '17 '18 '19 '20 '21
VPF net asset (lhs) FONDex (rhs)
-1,000
0
1,000
2,000
3,000
4,000
5,000
6,000
'07 '08 '09 '10 '11 '12 '13 '14 '15 '16 '17 '18 '19 '20 '21
Net contributionsIncrease from investmentIncrease in total VPF assets
Republic of Serbia Т-
bonds77.0%
Deposits9.2%
Shares13.6%
Other0.2%
19
3. Non-banking financial sector
3.3. Leasing sector
Legal entities in bankruptcy
20
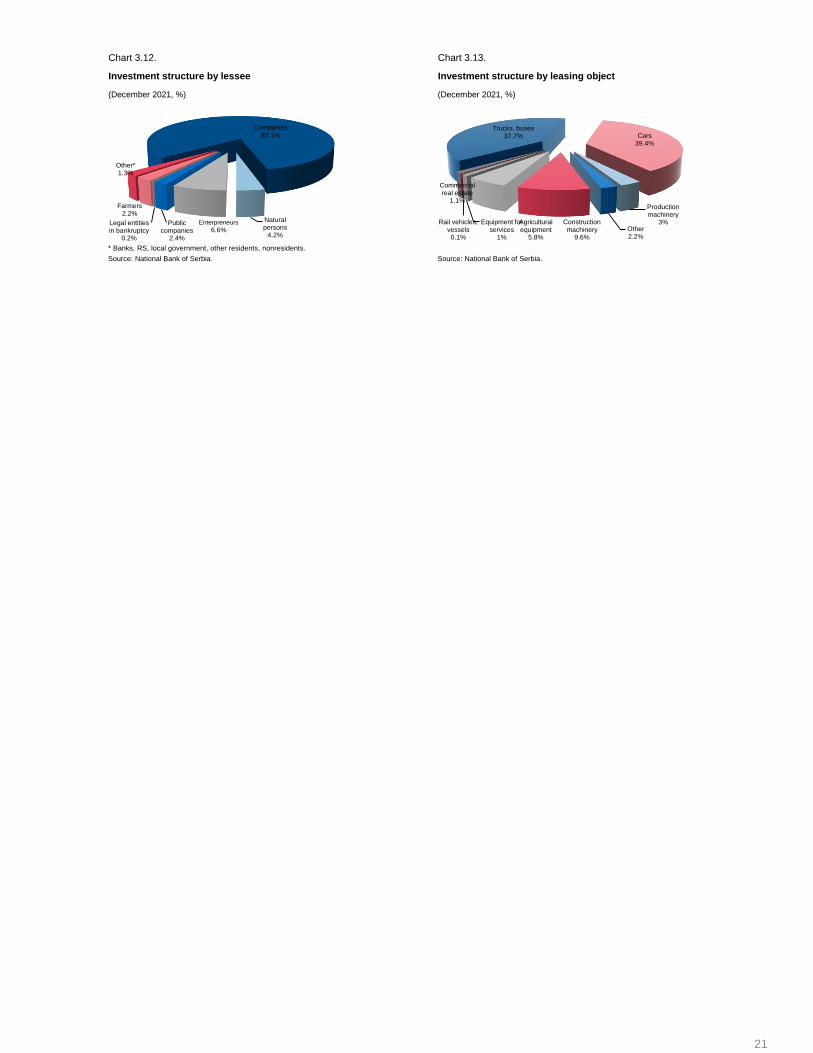
Chart 3.12. Chart 3.13.
(December 2021, %) (December 2021, %)
* Banks, RS, local government, other residents, nonresidents.
Source: National Bank of Serbia. Source: National Bank of Serbia.
Investment structure by lessee Investment structure by leasing object
Companies83.1%
Natural persons
4.2%
Enterpreneurs
6.6%Public
companies2.4%
Legal entities in bankruptcy
0.2%
Farmers2.2%
Other*1.3%
Trucks, buses37.7% Cars
39.4%
Production machinery
3%Other2.2%
Construction machinery
9.6%
Agricultural equipment
5.8%
Equipment for services
1%
Rail vehicles, vessels0.1%
Commercial real estate
1.1%
21

4. Corporate sector
1,000
1,200
1,400
1,600
1,800
22
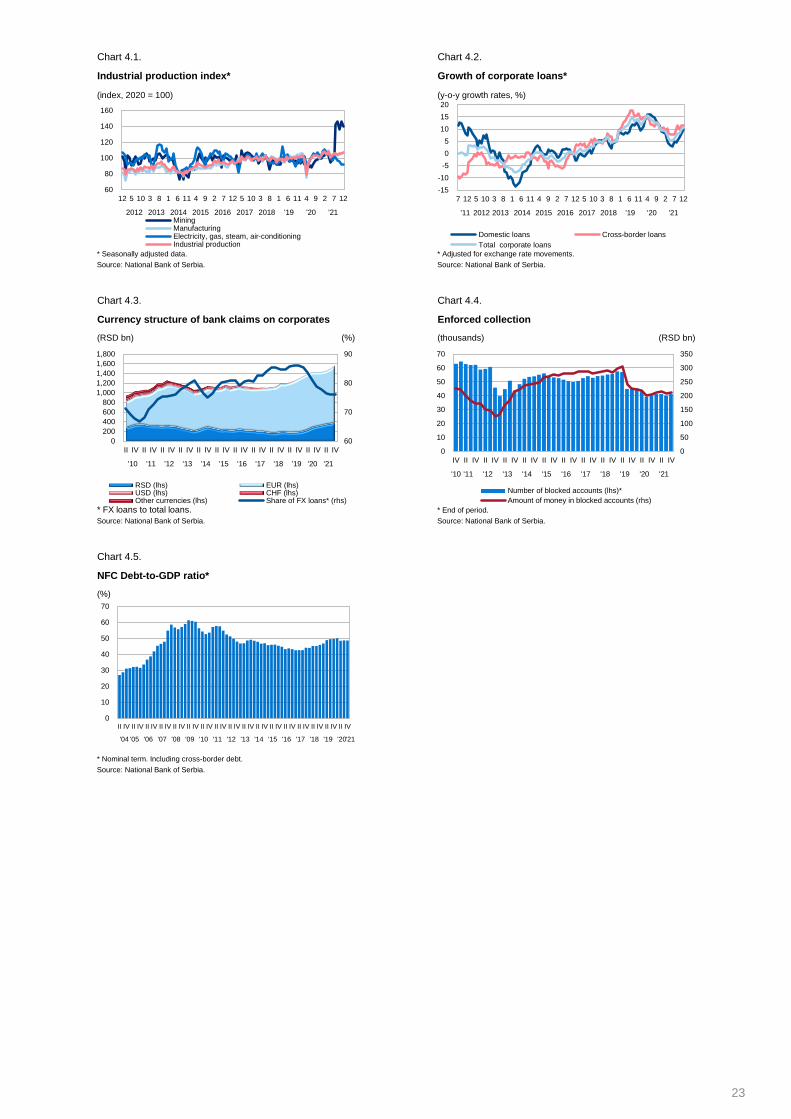
Chart 4.1. Chart 4.2.
(index, 2020 = 100) (y-o-y growth rates, %)
* Seasonally adjusted data. * Adjusted for exchange rate movements.
Source: National Bank of Serbia. Source: National Bank of Serbia.
Chart 4.3. Chart 4.4.
(RSD bn) (%) (thousands) (RSD bn)
* FX loans to total loans. * End of period.
Source: National Bank of Serbia. Source: National Bank of Serbia.
Chart 4.5.
(%)
* Nominal term. Including cross-border debt.
Source: National Bank of Serbia.
NFC Debt-to-GDP ratio*
Industrial production index* Growth of corporate loans*
Currency structure of bank claims on corporates Enforced collection
60
80
100
120
140
160
12 5 10 3 8 1 6 11 4 9 2 7 12 5 10 3 8 1 6 11 4 9 2 7 12
2012 2013 2014 2015 2016 2017 2018 '19 '20 '21MiningManufacturingElectricity, gas, steam, air-conditioningIndustrial production
-15
-10
-5
0
5
10
15
20
7 12 5 10 3 8 1 6 11 4 9 2 7 12 5 10 3 8 1 6 11 4 9 2 7 12
'11 2012 2013 2014 2015 2016 2017 2018 '19 '20 '21
Domestic loans Cross-border loans
Total corporate loans
60
70
80
90
0
200
400
600
800
1,000
1,200
1,400
1,600
1,800
II IV II IV II IV II IV II IV II IV II IV II IV II IV II IV II IV II IV
'10 '11 '12 '13 '14 '15 '16 '17 '18 '19 '20 '21
RSD (lhs) EUR (lhs)USD (lhs) CHF (lhs)Other currencies (lhs) Share of FX loans* (rhs)
0
50
100
150
200
250
300
350
0
10
20
30
40
50
60
70
IV II IV II IV II IV II IV II IV II IV II IV II IV II IV II IV II IV
'10 '11 '12 '13 '14 '15 '16 '17 '18 '19 '20 '21
Number of blocked accounts (lhs)*
Amount of money in blocked accounts (rhs)
0
10
20
30
40
50
60
70
II IV II IV II IV II IV II IV II IV II IV II IV II IV II IV II IV II IV II IV II IV II IV II IV II IV
'04 '05 '06 '07 '08 '09 '10 '11 '12 '13 '14 '15 '16 '17 '18 '19 '20 '21
23

5. Household sector
1,000
1,200
1,400
1,600
24
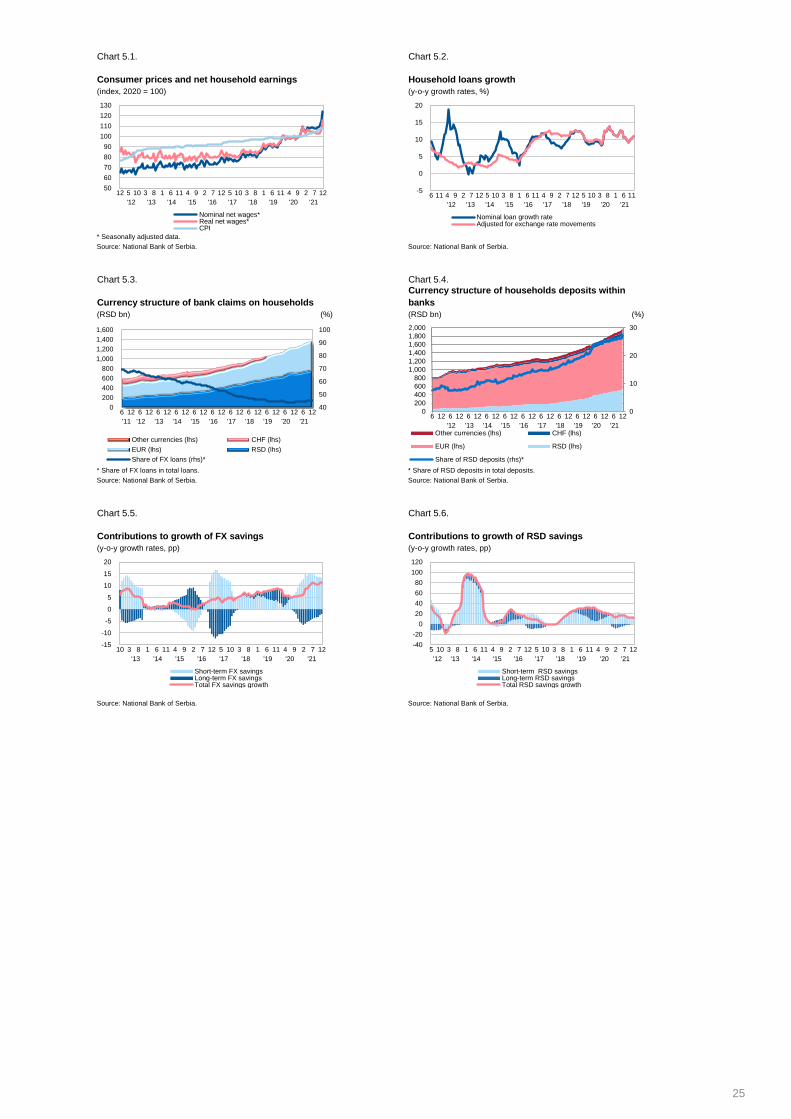
Chart 5.1. Chart 5.2.
(index, 2020 = 100) (y-o-y growth rates, %)
* Seasonally adjusted data.
Source: National Bank of Serbia. Source: National Bank of Serbia.
Chart 5.3. Chart 5.4.
(RSD bn) (%) (RSD bn) (%)
* Share of FX loans in total loans. * Share of RSD deposits in total deposits.
Source: National Bank of Serbia. Source: National Bank of Serbia.
Chart 5.5. Chart 5.6.
(y-o-y growth rates, pp) (y-o-y growth rates, pp)
Source: National Bank of Serbia. Source: National Bank of Serbia.
Contributions to growth of FX savings Contributions to growth of RSD savings
Consumer prices and net household earnings Household loans growth
Currency structure of bank claims on households
Currency structure of households deposits within
banks
50
60
70
80
90
100
110
120
130
12 5 10 3 8 1 6 11 4 9 2 7 12 5 10 3 8 1 6 11 4 9 2 7 12
'12 '13 '14 '15 '16 '17 '18 '19 '20 '21
Nominal net wages*Real net wages*CPI
-5
0
5
10
15
20
6 11 4 9 2 7 12 5 10 3 8 1 6 11 4 9 2 7 12 5 10 3 8 1 6 11
'12 '13 '14 '15 '16 '17 '18 '19 '20 '21
Nominal loan growth rateAdjusted for exchange rate movements
40
50
60
70
80
90
100
0
200
400
600
800
1,000
1,200
1,400
1,600
6 12 6 12 6 12 6 12 6 12 6 12 6 12 6 12 6 12 6 12 6 12
'11 '12 '13 '14 '15 '16 '17 '18 '19 '20 '21
Other currencies (lhs) CHF (lhs)
EUR (lhs) RSD (lhs)
Share of FX loans (rhs)*
0
10
20
30
0
200
400
600
800
1,000
1,200
1,400
1,600
1,800
2,000
6 12 6 12 6 12 6 12 6 12 6 12 6 12 6 12 6 12 6 12 6 12
'12 '13 '14 '15 '16 '17 '18 '19 '20 '21Other currencies (lhs) CHF (lhs)
EUR (lhs) RSD (lhs)
Share of RSD deposits (rhs)*
-15
-10
-5
0
5
10
15
20
10 3 8 1 6 11 4 9 2 7 12 5 10 3 8 1 6 11 4 9 2 7 12
'13 '14 '15 '16 '17 '18 '19 '20 '21
Short-term FX savingsLong-term FX savingsTotal FX savings growth
-40
-20
0
20
40
60
80
100
120
5 10 3 8 1 6 11 4 9 2 7 12 5 10 3 8 1 6 11 4 9 2 7 12
'12 '13 '14 '15 '16 '17 '18 '19 '20 '21
Short-term RSD savingsLong-term RSD savingsTotal RSD savings growth
25
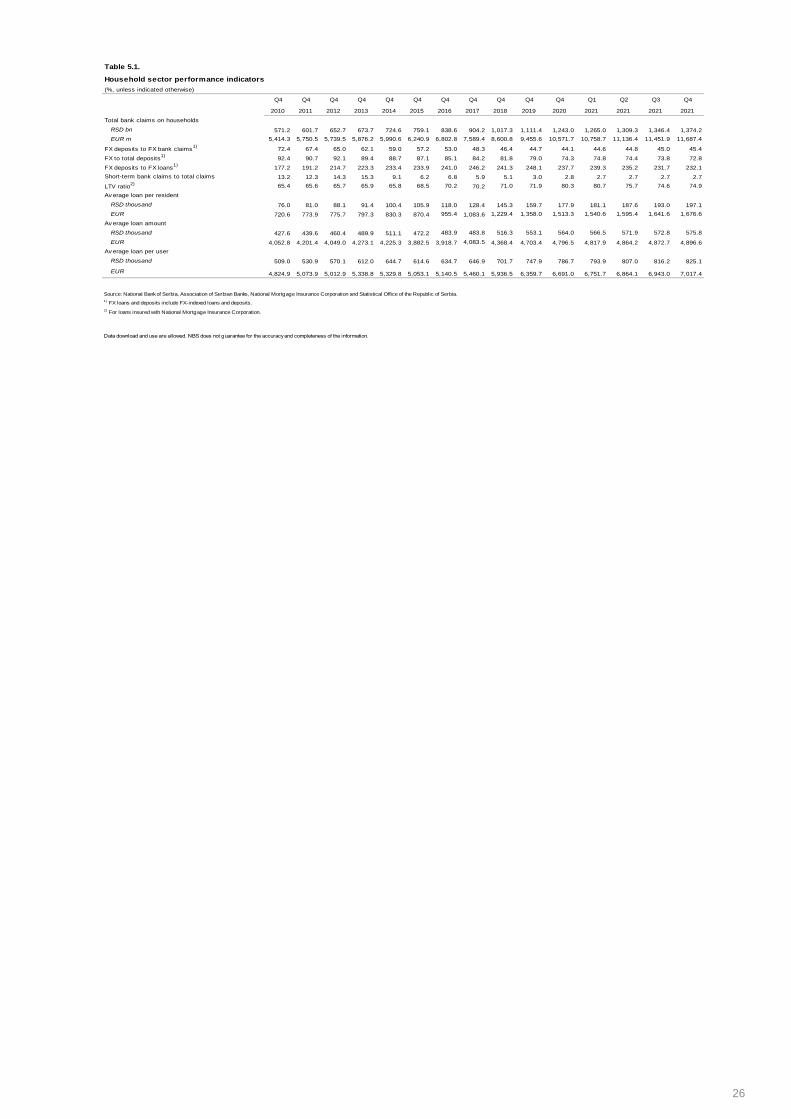
Table 5.1.
Household sector performance indicators
(%, unless indicated otherwise)
Q4 Q4 Q4 Q4 Q4 Q4 Q4 Q4 Q4 Q4 Q4 Q1 Q2 Q3 Q4
2010 2011 2012 2013 2014 2015 2016 2017 2018 2019 2020 2021 2021 2021 2021
Total bank claims on households
RSD bn 571.2 601.7 652.7 673.7 724.6 759.1 838.6 904.2 1,017.3 1,111.4 1,243.0 1,265.0 1,309.3 1,346.4 1,374.2
EUR m 5,414.3 5,750.5 5,739.5 5,876.2 5,990.6 6,240.9 6,802.8 7,589.4 8,600.8 9,455.6 10,571.7 10,758.7 11,136.4 11,451.9 11,687.4
FX deposits to FX bank claims1)
72.4 67.4 65.0 62.1 59.0 57.2 53.0 48.3 46.4 44.7 44.1 44.6 44.8 45.0 45.4
FX to total deposits1)
92.4 90.7 92.1 89.4 88.7 87.1 85.1 84.2 81.8 79.0 74.3 74.8 74.4 73.8 72.8
FX deposits to FX loans1)
177.2 191.2 214.7 223.3 233.4 233.9 241.0 246.2 241.3 248.1 237.7 239.3 235.2 231.7 232.1
Short-term bank claims to total claims 13.2 12.3 14.3 15.3 9.1 6.2 6.8 5.9 5.1 3.0 2.8 2.7 2.7 2.7 2.7
LTV ratio2) 65.4 65.6 65.7 65.9 65.8 68.5 70.2 70.2 71.0 71.9 80.3 80.7 75.7 74.6 74.9
Av erage loan per resident
RSD thousand 76.0 81.0 88.1 91.4 100.4 105.9 118.0 128.4 145.3 159.7 177.9 181.1 187.6 193.0 197.1
EUR 720.6 773.9 775.7 797.3 830.3 870.4 955.4 1,083.6 1,229.4 1,358.0 1,513.3 1,540.6 1,595.4 1,641.6 1,676.6
Av erage loan amount
RSD thousand 427.6 439.6 460.4 489.9 511.1 472.2 483.9 483.8 516.3 553.1 564.0 566.5 571.9 572.8 575.8
EUR 4,052.8 4,201.4 4,049.0 4,273.1 4,225.3 3,882.5 3,918.7 4,083.5 4,368.4 4,703.4 4,796.5 4,817.9 4,864.2 4,872.7 4,896.6
Av erage loan per user
RSD thousand 509.0 530.9 570.1 612.0 644.7 614.6 634.7 646.9 701.7 747.9 786.7 793.9 807.0 816.2 825.1
EUR 4,824.9 5,073.9 5,012.9 5,338.8 5,329.8 5,053.1 5,140.5 5,460.1 5,936.5 6,359.7 6,691.0 6,751.7 6,864.1 6,943.0 7,017.4
1) FX loans and deposits include FX-indexed loans and deposits.
2) For loans insured with National Mortgage Insurance Corporation.
Data download and use аre allowed. NBS does not guarantee for the accuracy and completeness of the information.
Source: National Bank of Serbia, Association of Serbian Banks, National Mortgage Insurance Corporation and Statistical Office of the Republic of Serbia.
26
6. Macroeconomic environment
6.1. International macroeconomic environment
27
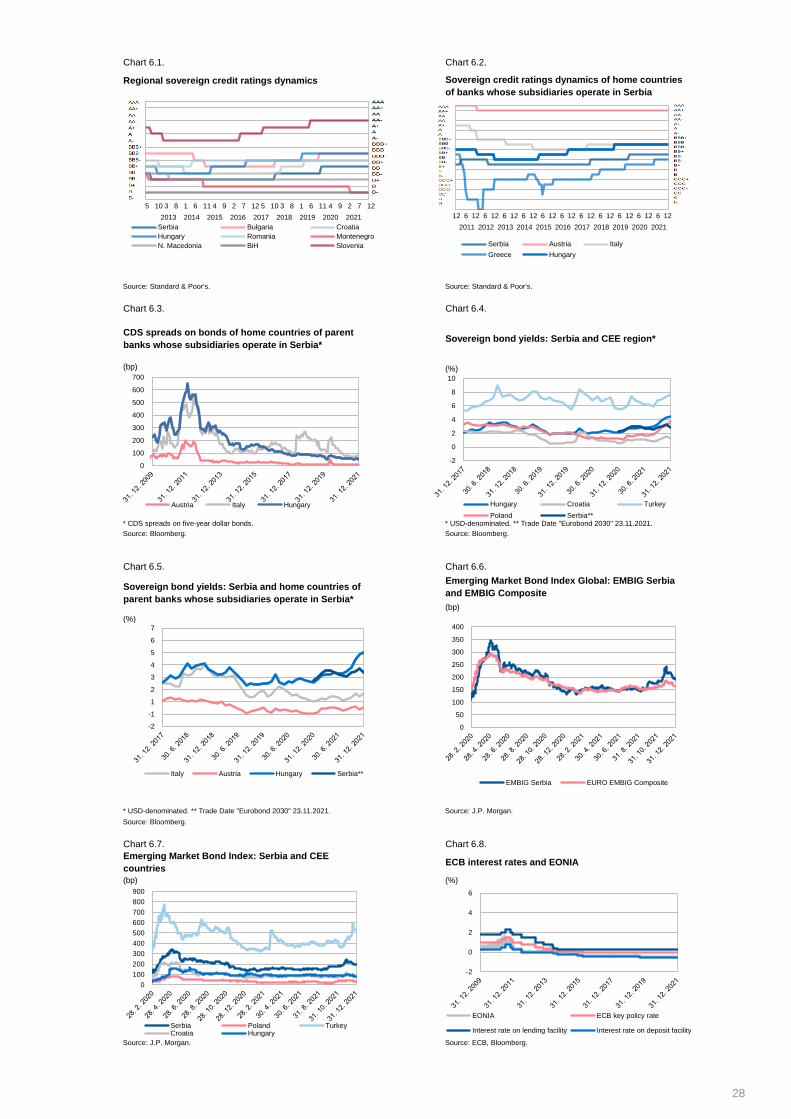
Chart 6.1. Chart 6.2.
Source: Standard & Poor's. Source: Standard & Poor's.
Chart 6.3. Chart 6.4.
(bp) (%)
* CDS spreads on five-year dollar bonds. * USD-denominated. ** Trade Date "Eurobond 2030" 23.11.2021.
Source: Bloomberg. Source: Bloomberg.
Chart 6.5. Chart 6.6.
(bp)
(%)
* USD-denominated. ** Trade Date "Eurobond 2030" 23.11.2021. Source: J.P. Morgan.
Source: Bloomberg.
Chart 6.7. Chart 6.8.
(bp) (%)
Source: J.P. Morgan. Source: ECB, Bloomberg.
Regional sovereign credit ratings dynamics
ECB interest rates and EONIA
Sovereign credit ratings dynamics of home countries
of banks whose subsidiaries operate in Serbia
CDS spreads on bonds of home countries of parent
banks whose subsidiaries operate in Serbia*
Emerging Market Bond Index Global: EMBIG Serbia
and EMBIG CompositeSovereign bond yields: Serbia and home countries of
parent banks whose subsidiaries operate in Serbia*
Emerging Market Bond Index: Serbia and CEE
countries
Sovereign bond yields: Serbia and CEE region*
6
8
10
12
14
16
18
20
5 10 3 8 1 6 11 4 9 2 7 12 5 10 3 8 1 6 11 4 9 2 7 12
2013 2014 2015 2016 2017 2018 2019 2020 2021
Serbia Bulgaria Croatia
Hungary Romania Montenegro
N. Macedonia BiH Slovenia
0
2
4
6
8
10
12
14
16
18
20
12 6 12 6 12 6 12 6 12 6 12 6 12 6 12 6 12 6 12 6 12 6 12
2011 2012 2013 2014 2015 2016 2017 2018 2019 2020 2021
Serbia Austria Italy
Greece Hungary
0
100
200
300
400
500
600
700
Austria Italy Hungary
-2
0
2
4
6
8
10
Hungary Croatia Turkey
Poland Serbia**
-2
-1
1
2
3
4
5
6
7
Italy Austria Hungary Serbia**
0
50
100
150
200
250
300
350
400
EMBIG Serbia EURO EMBIG Composite
0
100
200
300
400
500
600
700
800
900
Serbia Poland TurkeyCroatia Hungary
-2
0
2
4
6
EONIA ECB key policy rate
Interest rate on lending facility Interest rate on deposit facility
28
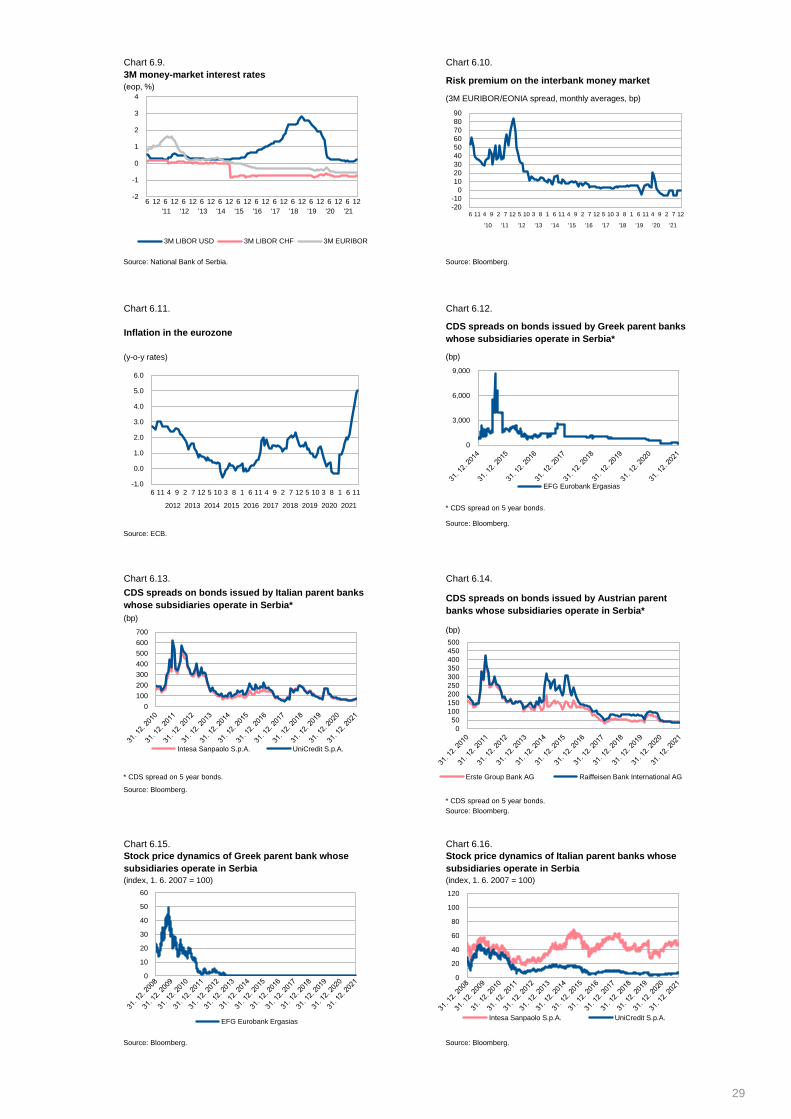
Chart 6.9. Chart 6.10.
(eop, %)
(3M EURIBOR/EONIA spread, monthly averages, bp)
Source: National Bank of Serbia. Source: Bloomberg.
Chart 6.11. Chart 6.12.
(y-o-y rates) (bp)
* CDS spread on 5 year bonds.
Source: Bloomberg.
Source: ECB.
Chart 6.13. Chart 6.14.
(bp)
(bp)
* CDS spread on 5 year bonds.
Source: Bloomberg.
* CDS spread on 5 year bonds.
Source: Bloomberg.
Chart 6.15. Chart 6.16.
(index, 1. 6. 2007 = 100) (index, 1. 6. 2007 = 100)
Source: Bloomberg. Source: Bloomberg.
Inflation in the eurozone
CDS spreads on bonds issued by Italian parent banks
whose subsidiaries operate in Serbia*
3M money-market interest ratesRisk premium on the interbank money market
CDS spreads on bonds issued by Greek parent banks
whose subsidiaries operate in Serbia*
CDS spreads on bonds issued by Austrian parent
banks whose subsidiaries operate in Serbia*
Stock price dynamics of Italian parent banks whose
subsidiaries operate in Serbia
Stock price dynamics of Greek parent bank whose
subsidiaries operate in Serbia
Interest rate on deposit facility
-20
-10
0
10
20
30
40
50
60
70
80
90
6 11 4 9 2 7 12 5 10 3 8 1 6 11 4 9 2 7 12 5 10 3 8 1 6 11 4 9 2 7 12
'10 '11 '12 '13 '14 '15 '16 '17 '18 '19 '20 '21
-1.0
0.0
1.0
2.0
3.0
4.0
5.0
6.0
6 11 4 9 2 7 12 5 10 3 8 1 6 11 4 9 2 7 12 5 10 3 8 1 6 11
2012 2013 2014 2015 2016 2017 2018 2019 2020 2021
0
3,000
6,000
9,000
EFG Eurobank Ergasias
0
50
100
150
200
250
300
350
400
450
500
Erste Group Bank AG Raiffeisen Bank International AG
0
10
20
30
40
50
60
EFG Eurobank Ergasias
0
20
40
60
80
100
120
Intesa Sanpaolo S.p.A. UniCredit S.p.A.
0
100
200
300
400
500
600
700
Intesa Sanpaolo S.p.A. UniCredit S.p.A.
-2
-1
0
1
2
3
4
6 12 6 12 6 12 6 12 6 12 6 12 6 12 6 12 6 12 6 12 6 12 6 12
'11 '12 '13 '14 '15 '16 '17 '18 '19 '20 '21
3M LIBOR USD 3M LIBOR CHF 3M EURIBOR
29
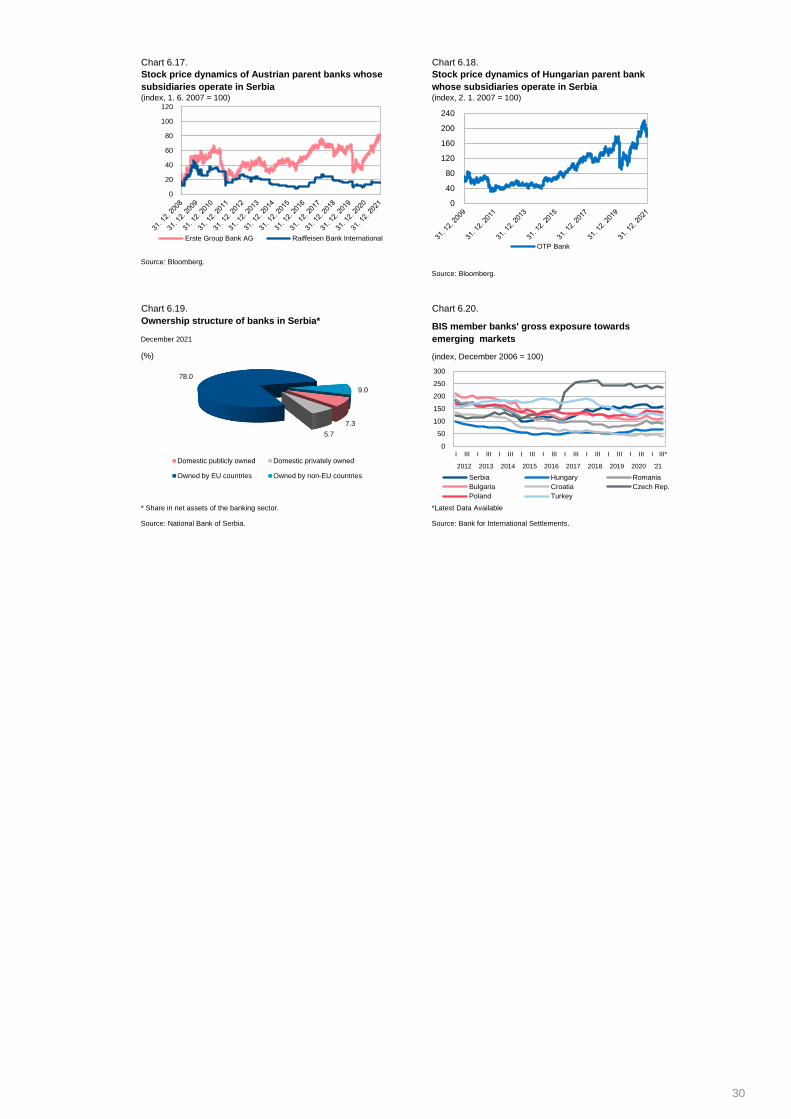
Chart 6.17. Chart 6.18.
(index, 1. 6. 2007 = 100) (index, 2. 1. 2007 = 100)
Source: Bloomberg.
Source: Bloomberg.
Chart 6.19. Chart 6.20.
December 2021
(%)
* Share in net assets of the banking sector. *Latest Data Available
Source: National Bank of Serbia. Source: Bank for International Settlements.
Stock price dynamics of Austrian parent banks whose
subsidiaries operate in Serbia
BIS member banks' gross exposure towards
emerging markets
Stock price dynamics of Hungarian parent bank
whose subsidiaries operate in Serbia
(index, December 2006 = 100)
Ownership structure of banks in Serbia*
0
20
40
60
80
100
120
Erste Group Bank AG Raiffeisen Bank International
7.3
5.7
78.0
9.0
Domestic publicly owned Domestic privately owned
Owned by EU countries Owned by non-EU countries
0
40
80
120
160
200
240
OTP Bank
0
50
100
150
200
250
300
I III I III I III I III I III I III I III I III I III I III*
2012 2013 2014 2015 2016 2017 2018 2019 2020 '21
Serbia Hungary Romania
Bulgaria Croatia Czech Rep.
Poland Turkey
30
6. Macroeconomic environment
6.2. Domestic macroeconomic environment
31
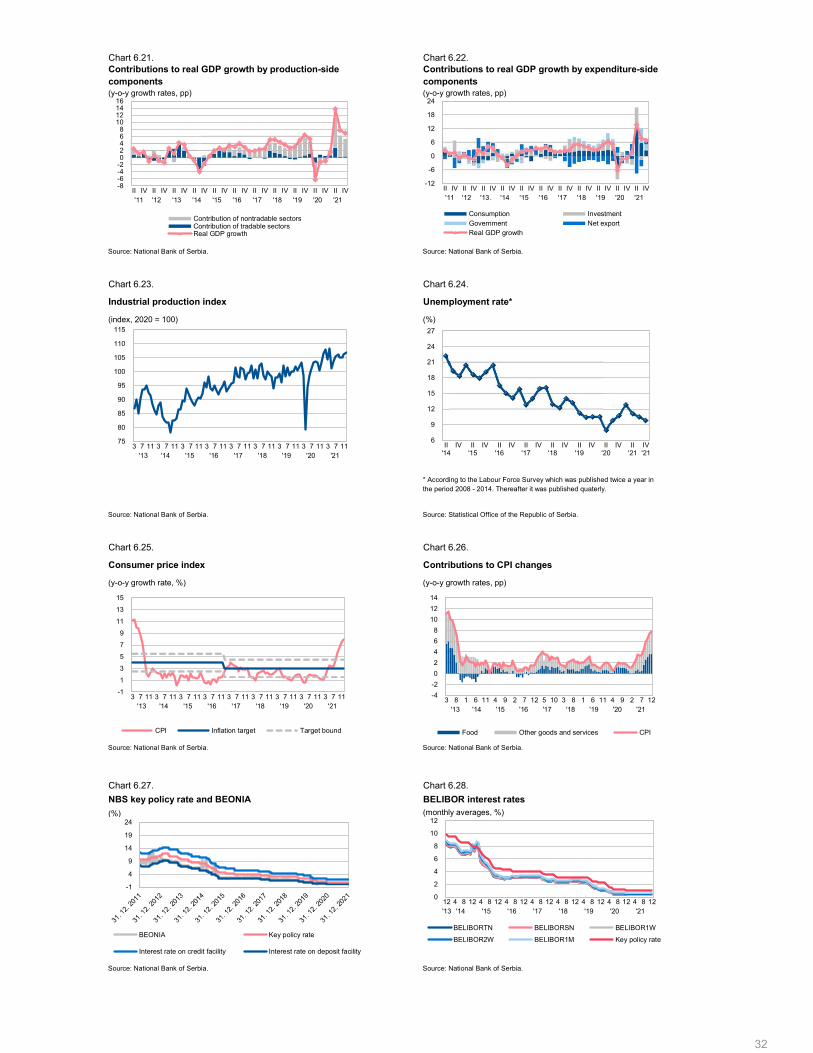
Chart 6.21. Chart 6.22.
(y-o-y growth rates, pp) (y-o-y growth rates, pp)
Source: National Bank of Serbia. Source: National Bank of Serbia.
Chart 6.23. Chart 6.24.
(index, 2020 = 100) (%)
Source: National Bank of Serbia. Source: Statistical Office of the Republic of Serbia.
Chart 6.25. Chart 6.26.
(y-o-y growth rate, %) (y-o-y growth rates, pp)
Source: National Bank of Serbia. Source: National Bank of Serbia.
Chart 6.27. Chart 6.28.
(%)
Source: National Bank of Serbia. Source: National Bank of Serbia.
(monthly averages, %)
Industrial production index
Contributions to real GDP growth by production-side components
Contributions to real GDP growth by expenditure-side components
Unemployment rate*
* According to the Labour Force Survey which was published twice a year in the period 2008 - 2014. Thereafter it was published quaterly.
NBS key policy rate and BEONIA
Contributions to CPI changesConsumer price index
BELIBOR interest rates
-8-6-4-202468
10121416
II IV II IV II IV II IV II IV II IV II IV II IV II IV II IV II IV'11 '12 '13 '14 '15 '16 '17 '18 '19 '20 '21
Contribution of nontradable sectorsContribution of tradable sectorsReal GDP growth
6
9
12
15
18
21
24
27
II'14
IV II'15
IV II'16
IV II'17
IV II'18
IV II'19
IV II'20
IV II'21
IV'21
-1
1
3
5
7
9
11
13
15
3 7 11 3 7 11 3 7 11 3 7 11 3 7 11 3 7 11 3 7 11 3 7 11 3 7 11'13 '14 '15 '16 '17 '18 '19 '20 '21
CPI Inflation target Target bound
-4
-2
0
2
4
6
8
10
12
14
3 8 1 6 11 4 9 2 7 12 5 10 3 8 1 6 11 4 9 2 7 12'13 '14 '15 '16 '17 '18 '19 '20 '21
Food Other goods and services CPI
-1
4
9
14
19
24
BEONIA Key policy rate
Interest rate on credit facility Interest rate on deposit facility
0
2
4
6
8
10
12
12 4 8 12 4 8 12 4 8 12 4 8 12 4 8 12 4 8 12 4 8 12 4 8 12'13 '14 '15 '16 '17 '18 '19 '20 '21
BELIBORTN BELIBORSN BELIBOR1W
BELIBOR2W BELIBOR1M Key policy rate
75
80
85
90
95
100
105
110
115
3 7 11 3 7 11 3 7 11 3 7 11 3 7 11 3 7 11 3 7 11 3 7 11 3 7 11'13 '14 '15 '16 '17 '18 '19 '20 '21
-12
-6
0
6
12
18
24
II IV II IV II IV II IV II IV II IV II IV II IV II IV II IV II IV'11 '12 '13. '14 '15 '16 '17 '18 '19 '20 '21
Consumption InvestmentGovernment Net exportReal GDP growth
32
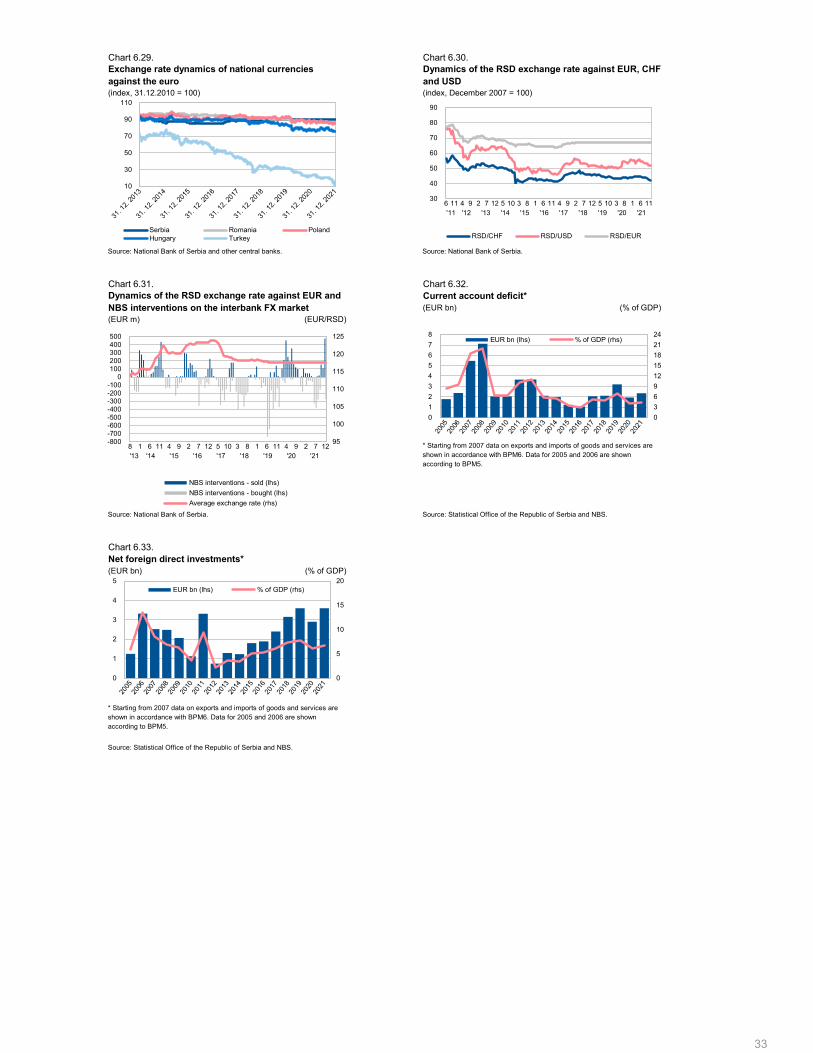
Chart 6.29. Chart 6.30.
(index, 31.12.2010 = 100) (index, December 2007 = 100)
Source: National Bank of Serbia and other central banks. Source: National Bank of Serbia.
Chart 6.31. Chart 6.32.
(EUR bn) (% of GDP)
(EUR m) (EUR/RSD)
Source: National Bank of Serbia. Source: Statistical Office of the Republic of Serbia and NBS.
Chart 6.33.
(EUR bn) (% of GDP)
Source: Statistical Office of the Republic of Serbia and NBS.
Net foreign direct investments*
* Starting from 2007 data on exports and imports of goods and services are shown in accordance with BPM6. Data for 2005 and 2006 are shown according to BPM5.
Dynamics of the RSD exchange rate against EUR, CHF and USD
Exchange rate dynamics of national currencies against the euro
* Starting from 2007 data on exports and imports of goods and services are shown in accordance with BPM6. Data for 2005 and 2006 are shown according to BPM5.
Dynamics of the RSD exchange rate against EUR and NBS interventions on the interbank FX market
Current account deficit*
10
30
50
70
90
110
Serbia Romania PolandHungary Turkey
30
40
50
60
70
80
90
6 11 4 9 2 7 12 5 10 3 8 1 6 11 4 9 2 7 12 5 10 3 8 1 6 11'11 '12 '13 '14 '15 '16 '17 '18 '19 '20 '21
RSD/CHF RSD/USD RSD/EUR
95
100
105
110
115
120
125
-800-700-600-500-400-300-200-100
0100200300400500
8 1 6 11 4 9 2 7 12 5 10 3 8 1 6 11 4 9 2 7 12'13 '14 '15 '16 '17 '18 '19 '20 '21
NBS interventions - sold (lhs)
NBS interventions - bought (lhs)
Average exchange rate (rhs)
0
3
6
9
12
15
18
21
24
0
1
2
3
4
5
6
7
8EUR bn (lhs) % of GDP (rhs)
0
5
10
15
20
0
1
2
3
4
5EUR bn (lhs) % of GDP (rhs)
33
6.3. FX reserves adequacy indicators
6. Macroeconomic environment
34
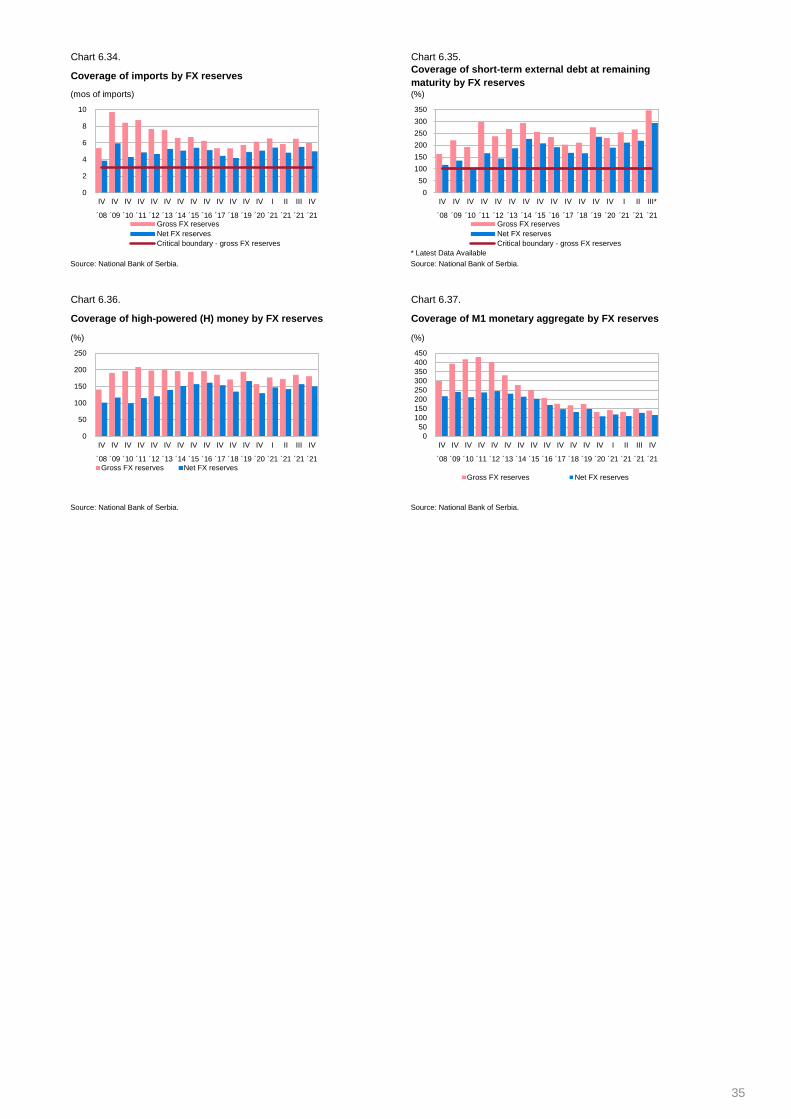
Chart 6.34. Chart 6.35.
(mos of imports) (%)
* Latest Data Available
Source: National Bank of Serbia. Source: National Bank of Serbia.
Chart 6.36. Chart 6.37.
(%) (%)
Source: National Bank of Serbia. Source: National Bank of Serbia.
Coverage of imports by FX reserves Coverage of short-term external debt at remaining
maturity by FX reserves
Coverage of high-powered (H) money by FX reserves Coverage of M1 monetary aggregate by FX reserves
0
2
4
6
8
10
IV IV IV IV IV IV IV IV IV IV IV IV IV I II III IV
´08 ´09 ´10 ´11 ´12 ´13 ´14 ´15 ´16 ´17 ´18 ´19 ´20 ´21 ´21 ´21 ´21Gross FX reserves
Net FX reserves
Critical boundary - gross FX reserves
0
50
100
150
200
250
300
350
IV IV IV IV IV IV IV IV IV IV IV IV IV I II III*
´08 ´09 ´10 ´11 ´12 ´13 ´14 ´15 ´16 ´17 ´18 ´19 ´20 ´21 ´21 ´21Gross FX reserves
Net FX reserves
Critical boundary - gross FX reserves
0
50
100
150
200
250
IV IV IV IV IV IV IV IV IV IV IV IV IV I II III IV
´08 ´09 ´10 ´11 ´12 ´13 ´14 ´15 ´16 ´17 ´18 ´19 ´20 ´21 ´21 ´21 ´21
Gross FX reserves Net FX reserves
0
50
100
150
200
250
300
350
400
450
IV IV IV IV IV IV IV IV IV IV IV IV IV I II III IV
´08 ´09 ´10 ´11 ´12 ´13 ´14 ´15 ´16 ´17 ´18 ´19 ´20 ´21 ´21 ´21 ´21
Gross FX reserves Net FX reserves
35
6.4. Indebtedness of the Republic of Serbia
6. Macroeconomic environment
36
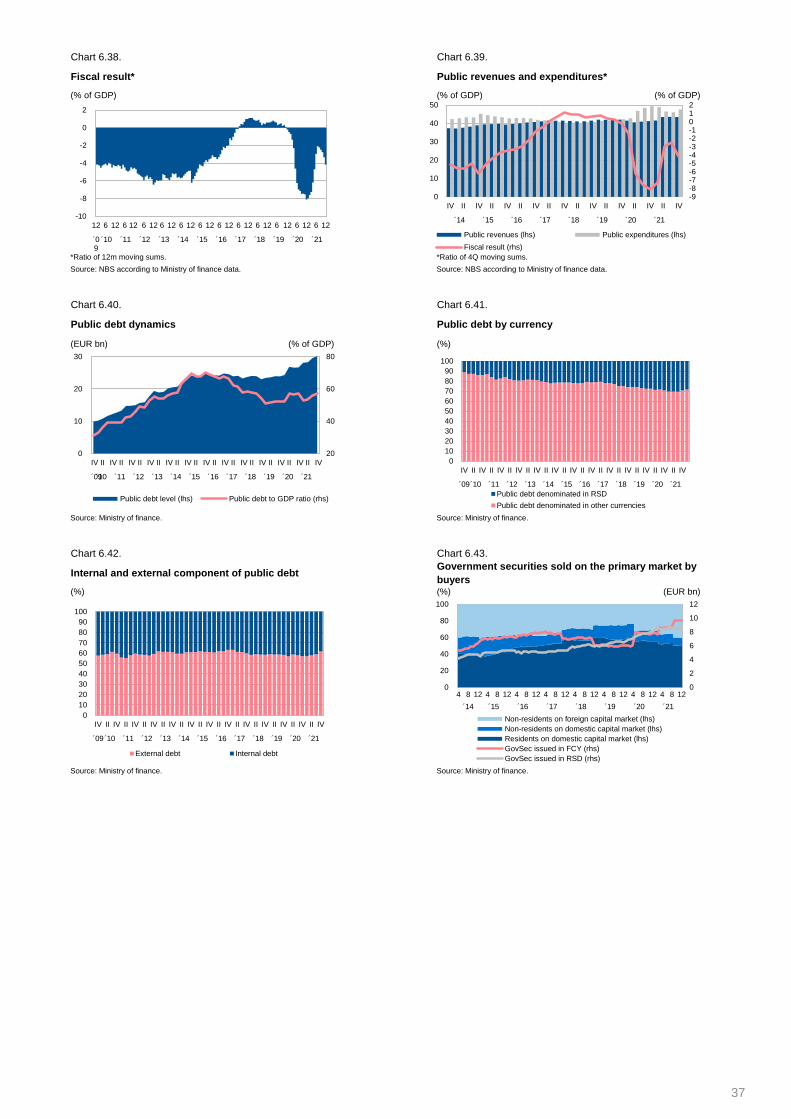
Chart 6.38. Chart 6.39.
(% of GDP) (% of GDP) (% of GDP)
*Ratio of 12m moving sums. *Ratio of 4Q moving sums.
Source: NBS according to Ministry of finance data. Source: NBS according to Ministry of finance data.
Chart 6.40. Chart 6.41.
(EUR bn) (% of GDP) (%)
Source: Ministry of finance. Source: Ministry of finance.
Chart 6.42. Chart 6.43.
(%) (%) (EUR bn)
Source: Ministry of finance. Source: Ministry of finance.
Fiscal result* Public revenues and expenditures*
Government securities sold on the primary market by
buyers
Public debt by currency
Internal and external component of public debt
Public debt dynamics
-10
-8
-6
-4
-2
0
2
12 6 12 6 12 6 12 6 12 6 12 6 12 6 12 6 12 6 12 6 12 6 12 6 12
´09
´10 ´11 ´12 ´13 ´14 ´15 ´16 ´17 ´18 ´19 ´20 ´21
-9-8-7-6-5-4-3-2-1012
0
10
20
30
40
50
IV II IV II IV II IV II IV II IV II IV II IV II IV
´14 ´15 ´16 ´17 ´18 ´19 ´20 ´21
Public revenues (lhs) Public expenditures (lhs)
Fiscal result (rhs)
0
10
20
30
40
50
60
70
80
90
100
IV II IV II IV II IV II IV II IV II IV II IV II IV II IV II IV II IV II IV
´09´10 ´11 ´12 ´13 ´14 ´15 ´16 ´17 ´18 ´19 ´20 ´21
Public debt denominated in RSD
Public debt denominated in other currencies
0
10
20
30
40
50
60
70
80
90
100
IV II IV II IV II IV II IV II IV II IV II IV II IV II IV II IV II IV II IV
´09´10 ´11 ´12 ´13 ´14 ´15 ´16 ´17 ´18 ´19 ´20 ´21
External debt Internal debt
0
2
4
6
8
10
12
0
20
40
60
80
100
4 8 12 4 8 12 4 8 12 4 8 12 4 8 12 4 8 12 4 8 12 4 8 12
´14 ´15 ´16 ´17 ´18 ´19 ´20 ´21
Non-residents on foreign capital market (lhs)
Non-residents on domestic capital market (lhs)
Residents on domestic capital market (lhs)
GovSec issued in FCY (rhs)
GovSec issued in RSD (rhs)
20
40
60
80
0
10
20
30
IV II IV II IV II IV II IV II IV II IV II IV II IV II IV II IV II IV II IV
´09´10 ´11 ´12 ´13 ´14 ´15 ´16 ´17 ´18 ´19 ´20 ´21
Public debt level (lhs) Public debt to GDP ratio (rhs)
37

7. Financial markets and real estate market-20
100
120
38
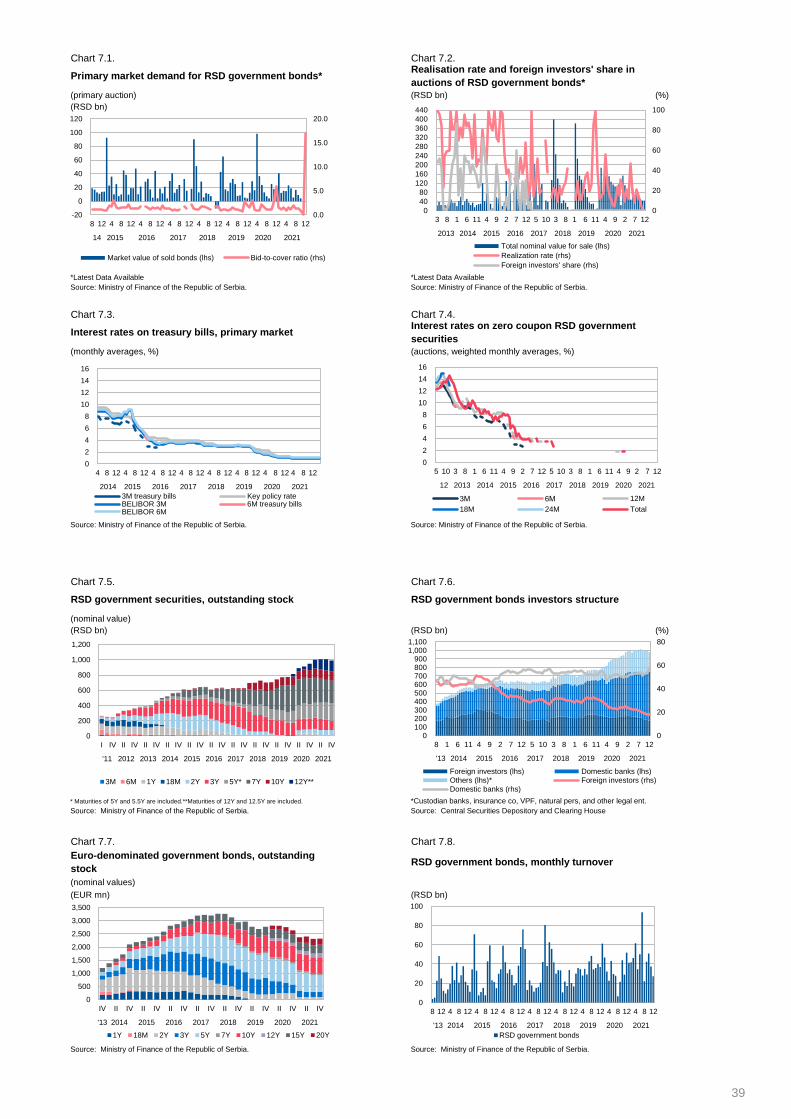
Chart 7.1. Chart 7.2.
(primary auction) (RSD bn) (%)
(RSD bn)
*Latest Data Available *Latest Data Available
Source: Ministry of Finance of the Republic of Serbia. Source: Ministry of Finance of the Republic of Serbia.
Chart 7.3. Chart 7.4.
(monthly averages, %) (auctions, weighted monthly averages, %)
Source: Ministry of Finance of the Republic of Serbia. Source: Ministry of Finance of the Republic of Serbia.
Chart 7.5. Chart 7.6.
(nominal value)
(RSD bn) (RSD bn) (%)
* Maturities of 5Y and 5.5Y are included.**Maturities of 12Y and 12.5Y are included. *Custodian banks, insurance co, VPF, natural pers, and other legal ent.
Source: Ministry of Finance of the Republic of Serbia. Source: Central Securities Depository and Clearing House
Chart 7.7. Chart 7.8.
(nominal values)
(EUR mn) (RSD bn)
Source: Ministry of Finance of the Republic of Serbia. Source: Ministry of Finance of the Republic of Serbia.
RSD government bonds, monthly turnover
Primary market demand for RSD government bonds*Realisation rate and foreign investors' share in
auctions of RSD government bonds*
Euro-denominated government bonds, outstanding
stock
Interest rates on zero coupon RSD government
securities
RSD government securities, outstanding stock RSD government bonds investors structure
Interest rates on treasury bills, primary market
0.0
5.0
10.0
15.0
20.0
-20
0
20
40
60
80
100
120
8 12 4 8 12 4 8 12 4 8 12 4 8 12 4 8 12 4 8 12 4 8 12
14 2015 2016 2017 2018 2019 2020 2021
Market value of sold bonds (lhs) Bid-to-cover ratio (rhs)
0
20
40
60
80
100
0
40
80
120
160
200
240
280
320
360
400
440
3 8 1 6 11 4 9 2 7 12 5 10 3 8 1 6 11 4 9 2 7 12
2013 2014 2015 2016 2017 2018 2019 2020 2021
Total nominal value for sale (lhs)
Realization rate (rhs)
Foreign investors' share (rhs)
0
2
4
6
8
10
12
14
16
4 8 12 4 8 12 4 8 12 4 8 12 4 8 12 4 8 12 4 8 12 4 8 12
2014 2015 2016 2017 2018 2019 2020 2021
3M treasury bills Key policy rateBELIBOR 3M 6M treasury billsBELIBOR 6M
0
2
4
6
8
10
12
14
16
5 10 3 8 1 6 11 4 9 2 7 12 5 10 3 8 1 6 11 4 9 2 7 12
12 2013 2014 2015 2016 2017 2018 2019 2020 2021
3М 6М 12M
18M 24M Total
0
200
400
600
800
1,000
1,200
I IV II IV II IV II IV II IV II IV II IV II IV II IV II IV II IV
'11 2012 2013 2014 2015 2016 2017 2018 2019 2020 2021
3M 6M 1Y 18M 2Y 3Y 5Y* 7Y 10Y 12Y**
0
20
40
60
80
0100200300400500600700800900
1,0001,100
8 1 6 11 4 9 2 7 12 5 10 3 8 1 6 11 4 9 2 7 12
'13 2014 2015 2016 2017 2018 2019 2020 2021
Foreign investors (lhs) Domestic banks (lhs)
Others (lhs)* Foreign investors (rhs)
Domestic banks (rhs)
0
500
1,000
1,500
2,000
2,500
3,000
3,500
IV II IV II IV II IV II IV II IV II IV II IV II IV
'13 2014 2015 2016 2017 2018 2019 2020 2021
1Y 18M 2Y 3Y 5Y 7Y 10Y 12Y 15Y 20Y
0
20
40
60
80
100
8 12 4 8 12 4 8 12 4 8 12 4 8 12 4 8 12 4 8 12 4 8 12 4 8 12
'13 2014 2015 2016 2017 2018 2019 2020 2021
RSD government bonds
39
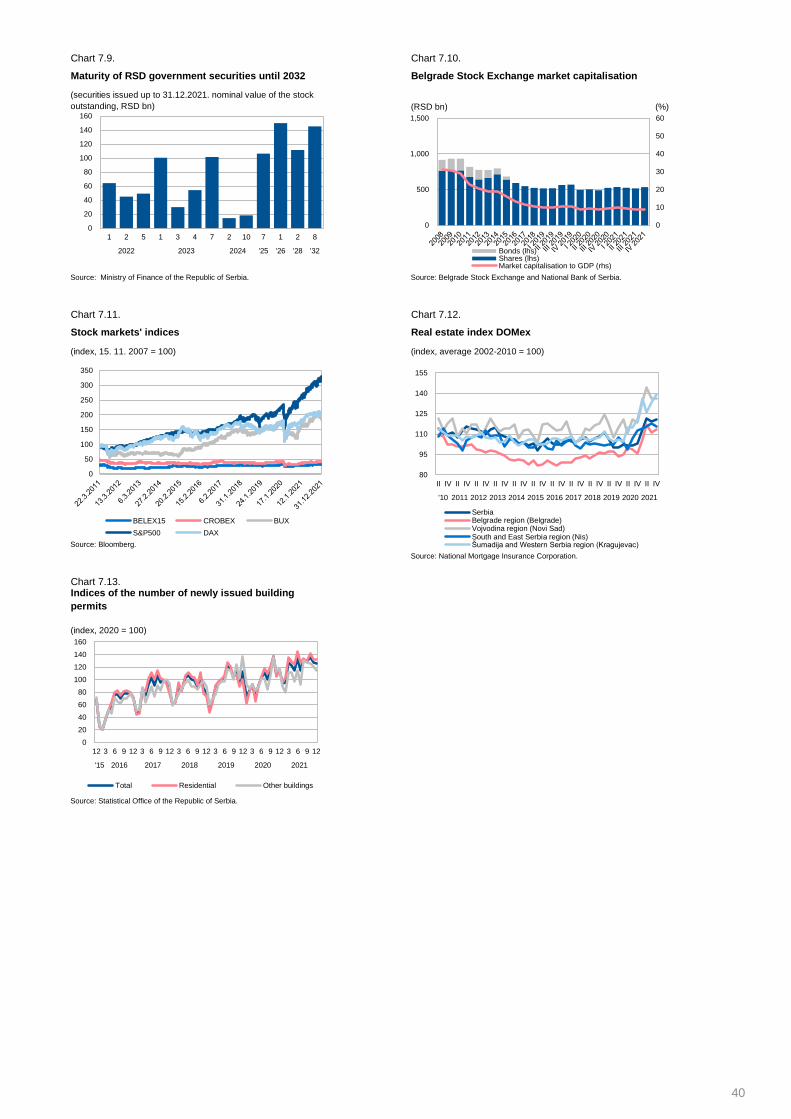
Chart 7.9. Chart 7.10.
(RSD bn) (%)
Source: Ministry of Finance of the Republic of Serbia. Source: Belgrade Stock Exchange and National Bank of Serbia.
Chart 7.11. Chart 7.12.
(index, 15. 11. 2007 = 100) (index, average 2002-2010 = 100)
Source: Bloomberg.
Source: National Mortgage Insurance Corporation.
Chart 7.13.
(index, 2020 = 100)
Source: Statistical Office of the Republic of Serbia.
Maturity of RSD government securities until 2032
(securities issued up to 31.12.2021. nominal value of the stock
outstanding, RSD bn)
Stock markets' indices
Indices of the number of newly issued building
permits
Real estate index DOMex
Belgrade Stock Exchange market capitalisation
0
20
40
60
80
100
120
140
160
1 2 5 1 3 4 7 2 10 7 1 2 8
2022 2023 2024 '25 '26 '28 '32
0
10
20
30
40
50
60
0
500
1,000
1,500
Bonds (lhs)Shares (lhs)Market capitalisation to GDP (rhs)
80
95
110
125
140
155
II IV II IV II IV II IV II IV II IV II IV II IV II IV II IV II IV II IV
'10 2011 2012 2013 2014 2015 2016 2017 2018 2019 2020 2021
SerbiaBelgrade region (Belgrade)Vojvodina region (Novi Sad)South and East Serbiа region (Nis)Šumadija and Western Serbia region (Kragujevac)
0
20
40
60
80
100
120
140
160
12 3 6 9 12 3 6 9 12 3 6 9 12 3 6 9 12 3 6 9 12 3 6 9 12
'15 2016 2017 2018 2019 2020 2021
Total Residential Other buildings
0
50
100
150
200
250
300
350
BELEX15 CROBEX BUX
S&P500 DAX
40
Definitions
Chart 1.1. Greater distance from the center of the "net" indicates greater risk. Standardised values of key financial
soundness indicators are shown: CAR − capital adequacy ratio (regulatory capital to risk-weighted assets), C/A −
capital to assets, NPL − gross non-performing loans to total gross loans, Provisions/NPL − total provisions to
gross NPL, ROA − return on assets, ROE − return on equity. The region encompasses the following countries:
Bosnia and Herzegovina, Bulgaria, Hungary, North Macedonia, Poland, Romania, Turkey and Croatia. Indicators
that refer to the region were obtained as non-weighted averages of corresponding indicators of the countries listed
above.
Chart 1.2. Increasing distance from the center indicates an increase in the specific risk. Increasing area indicates an
increase in the overall macroeconomic vulnerability of the country.
Chart 2.1. The capital adequacy ratio is the ratio between regulatory capital and risk-weighted assets. Tier 1 capital of the
bank is the sum of Common Equity Tier 1 capital and Additional Tier 1 capital.
Chart 2.3. Indicators of leverage show the extent to which banks finance their assets from their own funds.
Chart 2.4. Foreign currency loans refer to foreign currency denominated loans and domestic currency denominated loans
that are indexed in foreign currency.
Chart 2.5. Foreign currency deposits refer to foreign currency denominated deposits and domestic currency denominated
deposits that are indexed in foreign currency.
Chart 2.9. Non-performing loans represent the stock of overall remaining debt (including the amount past due) with payment
overdue for longer than 90 days, or with principal or interest payments that are past due for 90 days or more; if at
least 90 days of interest payments have been capitalised, refinanced or delayed; if the payment of loan is not late,
but the bank has reasons to doubt that payment will be made in full.
Chart 2.11. Balance sheet provisions are made for the part of a loan that a bank considers unlikely to be collected.
Chart 2.12. The main criteria for classification in categories A, B, C, D and E is regularity of client's payments. Categories D
and E represent assets with the lowest quality or that are past due for more than 90 days.
Chart 2.17. The net open FX position is the sum of maximum of absolute value of the total long position and absolute value of
the total short position in foreign currency, plus the absolute value of position in gold. The total long (total short)
foreign currency position of the banking sector is the sum of its net long (net short) positions by foreign
currencies.
Chart 2.18. Return on assets (return on equity) is the ratio between profit before taxation made during the period and average
assets (equities) during that period.
Chart 2.21. Net operating income (operating gain) is profit from bank's main activity (it excludes extraordinary gains and
losses). As domestic banking sector's activity is mainly related to traditional jobs involving loans and deposits and
not to investment banking, the major element of the operating gain is net interest margin, that is the difference
between interest incomes and expenditures. Income from trade in securities is negligible.
Chart 2.29. The LtD ratio (loans to deposits) indicates the ability of the bank to finance its loans by deposits. The value of this
indicator greater than 1 could be seen as the lack of bank's ability to react to shocks.
Chart 2.30. The liquidity ratio of a bank is the ratio of the sum of level 1 and level 2 liquid receivables of the bank and the sum
of liabilities payable on demand or with no agreed maturity and liabilities falling due within a month from the date
of liquidity ratio calculation. According to the Decision on liquidity risk management by banks, the average
monthly liquidity ratio should not be lower than 1, the liquidity ratio should not be lower than 0.9 longer than 3
days, and it should not be lower than 0.8 if calculated for one business day only.
Chart 2.31. The narrow liquidity ratio is the ratio of level 1 liquid receivables of a bank and the sum of liabilities payable on
demand or with no agreed maturity and liabilities falling due within a month from the date of liquidity ratio
calculation. According to the Decision on liquidity risk management by banks, the average monthly narrow
liquidity ratio should not be lower than 0.7, the narrow liquidity ratio should not be lower than 0.6 longer than 3
days, and it should not be lower than 0.5 if calculated for one business day only.
Chart 2.32. Liquid assets are the sum of bank's liquid first and second-degree receivables, as on the last day of the month.
More restrictive definition defines liquid assets as liquid first-degree receivables on the last day of the month.
Chart 2.33. High-power money consists of cash in circulation and banks' deposits in dinars with the National Bank of Serbia.
Charts 3.6. and 3.7. Profitability indicators are avaliable in annual frequency.
Chart 3.8. The combined indicator is sum of the two ratios shown on chart. The value greater than 100% means that
insurance companies mainly depend on the result of their investement activities in financial markets, instead on
results of their basic activities.
Chart 3.9. The fondex daily value is obtained by multiplying the value of index for the previous day by the weighted average
of chain index values of investement units for every fund.
1. Financial soundness indicators
2. Banking sector
3. Non-banking financial sector
41
Chart 6.3. Credit default swap (CDS) is a financial derivative designed to hedge its holder against the default of the issuer of
an underlying bond. CDS spread is a price the owner of CDS has to pay for the provided protection. An increase
in this insurance premium is an indicator of the increase in the credit risk of an underlying bond.
Chart 6.6. Emerging Market Bond Index Global (EMBIG) is a benchmark index for measuring the total return performance of
international government and corporate bonds issued by emerging market countries.
Chart 6.36. According to the IMF definition, FX reserves consist of those external assets that are readily available to and
controlled by monetary authorities for direct financing of payments imbalances, for indirectly regulating the
magnitude of such imbalances through intervention in exchange markets to affect the currency exchange rate,
and/or for other purposes. Gross FX reserves consist of foreign securities, deposits on accounts abroad, effective
foreign money, gold, and special drawing rights. Net FX reserves are gross FX reserves minus banks' deposits
and special drawing rights related to gross FX reserves.
Chart 6.40. According to the Law on Public Debt, public debt of the Republic of Serbia is defined as debt of the Republic,
based on agreements concluded by the Republic; debt of the Republic based on issuing securities; debt of the
Republic based on contracts/agreements according to which obligations of the Republic, pursuant to previously
concluded agreements, have been rescheduled; debt of the Republic, based on the guarantee issued by the
Republic and/or based on the counter-guarantee issued by the Republic; debt of local government and legal
entities for which the Republic has issued guarantees.
Chart 7.1. The bid-to-cover ratio is defined as the ratio between the nominal value of total submitted bids and the nominal
value of sold securities.
7. Financial markets and real estate market
6. International macroeconomic environment
42