Embed Size (px)
Citation preview

Quarterly Energy Dynamics Q3 2021
Market Insights and WA Market Operations

Important notice
PURPOSE
AEMO has prepared this report to provide energy market participants and governments with information on
the market dynamics, trends and outcomes during Q3 2021 (1 July to 30 September 2021). This quarterly
report compares results for the quarter against other recent quarters, focusing on Q2 2021 and Q3 2020.
Geographically, the report covers:
• The National Electricity Market – which includes Queensland, New South Wales, the Australian Capital
Territory, Victoria, South Australia and Tasmania.
• The Wholesale Electricity Market and domestic gas supply arrangements operating in Western Australia.
• The gas markets operating in Queensland, New South Wales, Victoria and South Australia.
DISCLAIMER
This document or the information in it may be subsequently updated or amended. This document does not
constitute legal, market or business advice, and should not be relied on as a substitute for obtaining detailed
advice about:
• past, current or future market conditions, prices and outcomes; and
• the National Electricity Law, the National Electricity Rules, the Wholesale Electricity Market Rules, the
National Gas Law, the National Gas Rules, the Gas Services Information Regulations or any other
applicable laws, procedures or policies.
While AEMO has made reasonable efforts to ensure the quality of the information in this document, it cannot
guarantee its accuracy or completeness.
Accordingly, to the maximum extent permitted by law, AEMO and its officers, employees and consultants
involved in the preparation of this document:
• make no representation or warranty, express or implied, as to the currency, accuracy, reliability or
completeness of the information in this document; and
• are not liable (whether by reason of negligence or otherwise) for any statements or representations in this
document, or any omissions from it, or for any use or reliance on the information in it.
VERSION CONTROL
Version Release date Changes
1 22/10/2021

© AEMO 2021 | Quarterly Energy Dynamics Q3 2021 3
Executive summary
East coast electricity and gas highlights
After a volatile July energy prices returned to lower levels
• At the start of Q3 2021, electricity and gas prices continued at the high levels experienced in May and
June. Mainland National Electricity Market (NEM) electricity prices averaged $111/MWh1 in July while gas
prices jumped 48% from June to average $15.61/GJ in July across AEMO’s spot markets.
• Higher east coast energy prices in July were influenced by an outage at Esso’s Longford Gas Plant
reducing gas supply during the coldest part of winter. This coincided with sustained higher international
gas prices creating strong liquefied natural gas (LNG) export demand, and Iona storage starting the
quarter at historically low levels.
− On 7 July Sydney spot prices reached their second highest level on record at $27.56/GJ, and on
9 July Victorian gas prices hit $58.44/GJ, the third highest recorded since market start. On 10 July
Adelaide hit a new record of $28.01/GJ.
− Following the return of Longford to full capacity on 18 July, Iona storage levels stabilised and gas
prices eased such that there were no prices greater than $10/GJ during August and September, and
the September average gas price fell to $8.09/GJ.
• In the NEM, falling gas prices combined with lower demand from August due to milder weather and
COVID-19 restrictions put downward pressure on electricity prices. This was further exacerbated by
increased renewable generation with the result that electricity prices fell throughout the quarter. During
September mainland NEM prices averaged $37/MWh, resulting in a quarterly average of $66/MWh. This
was down from $95/MWh in Q2 but still above Q3 2020’s $42/MWh.
• While the quarter started with volatile high prices it ended with record levels of negative prices
particularly during the middle of the day at times of peak solar output. Across the quarter, 16% of NEM
trading intervals were zero or negative, more than double the previous record of 7% in Q4 2020.
− In Victoria the average price from 1000 hrs to 1530 hrs was just $0.01/MWh during August and
September.
− Also to note Q3 2021 will be the last quarter where NEM wholesale electricity spot market will be
settled on a 30-minute period, with five minute settlement (5MS) commencing from 1 October 2021.
• International energy prices surged to record levels by the end of the quarter, with export coal prices
reaching A$269/tonne and JKM2 gas prices also hitting a new record of A$41/GJ up from A$17/GJ at the
start of the quarter. However, the impact of these trends on Australia was not discernible during the
quarter, with domestic energy prices moving in the opposite direction to international prices.
Record renewables output
• Output from variable renewable generation (VRE) grew strongly driven by seasonally higher wind and
solar output and commissioning of new grid-scale generators. Grid-scale VRE output averaged
1 Uses the time-weighted average which is the simple average of spot prices in the quarter excluding Tasmania. The Australian Energy Regulator (AER)
reports the volume-weighted average price which is weighted against native demand in each 30 minute trading interval.
2 Japan Korea Marker – a benchmark for Asian gas prices issued by Platts.

© AEMO 2021 | Quarterly Energy Dynamics Q3 2021 4
3,984 MW for the quarter, an increase of 828 MW on Q3 2020. This growth, and continued uptake of
distributed PV across the NEM led to new highs for renewable output.
− The record for instantaneous renewable share of total NEM generation was broken several times
during the quarter and reached a new high of 61.4% for the half-hour ending 1330 hrs on
24 September, while the average renewable share for the quarter was 31.7%, also a record.
• Grid-scale solar and wind constrained output also reached new highs for the quarter, increasing from an
average of 118 MW in the past quarter and 187 MW in Q3 2020, to 351 MW in the last quarter. This
resulted from both economic market response (from the relevant participant), or system security and
network congestion-related causes.
Other highlights
• Electricity demand changes were mixed. Quarterly average underlying demand in Queensland was up
257 MW on Q3 2020 and at its highest Q3 levels in recent years, while New South Wales saw lower
underlying demand (-72 MW) resulting from COVID-19 restrictions and the mildest August weather
since 2013. Overall, average NEM operational demand for the quarter was steady against Q3 2020, with
underlying demand changes and continued growth in distributed PV output (up 341 MW or 26% on
Q3 2020) largely offsetting one another.
• Maximum operational demands were up on Q3 2020 in all NEM regions. South Australia set a new
winter and Q3 record of 2,628 MW while New South Wales saw its highest Q3 maximum demand since
2011. At the other end of the scale, a new minimum operational demand record of 236 MW was set in
South Australia and New South Wales recorded its lowest minimum operational demand since Q1 2000.
• Transmission outages related to upgrades of the Queensland – New South Wales Interconnector (QNI)
and associated constraints on inter-regional energy flows affecting Queensland continued to drive high
quarterly prices and costs for frequency control ancillary services (FCAS), totalling $130 million. These
constraints also led to large negative settlement residues on QNI and contributed to spot price volatility
in Queensland.
• Falling spot prices and high gas costs in South Australia meant that more frequent direction of gas-fired
units was required to maintain system security, up from 30% of dispatch intervals in Q2 2021 to 51% in
Q3 2021. The estimated increase in direction costs was $15 million. Full commissioning of recently
installed synchronous condensers is expected to reduce the extent of directions required in coming
months.
Western Australia electricity and gas highlights
Record renewable generation in the Wholesale Electricity Market (WEM)
• Similar to the NEM, the WEM also saw record levels of renewable generation. On 7 September at
1210 hrs, renewable generation supplied 70% of the underlying demand. Across the quarter,
approximately 25% of underlying demand was met by renewable generation, an increase of more than
4% compared to Q3 last year.
• On Sunday, 5 September 2021 at 1230 hrs there was a new minimum operational demand record of
866 MW, due to mild weather causing low underlying demand (2,238 MW) and sunny conditions
resulting in high distributed PV output (1,372 MW).
Gas-powered generation (GPG) was displaced by coal and renewables
• GPG output decreased by 20% in Q3 2021 compared to Q3 2020 due to higher coal availability (+7%)
and increased output from wind (+36%), solar (+89%) and distributed PV (+13%). Coal’s higher
availability also led to an increased price-setting role.

© AEMO 2021 | Quarterly Energy Dynamics Q3 2021 5
Contents Executive summary 3
East coast electricity and gas highlights 3
Western Australia electricity and gas highlights 4
1. NEM market dynamics 6
1.1 Electricity demand 6
1.2 Wholesale electricity prices 9
1.3 Electricity generation 18
1.4 Inter-regional transfers 27
1.5 Power system management 29
2. Gas market dynamics 35
2.1 Gas demand 35
2.2 Wholesale gas prices 36
2.3 Gas supply 40
2.4 Pipeline flows 41
2.5 Gas Supply Hub 42
2.6 Pipeline capacity trading and day ahead auction 43
2.7 Gas – Western Australia 43
3. WEM market dynamics 45
3.1 Electricity demand 45
3.2 WEM prices 46
3.3 Electricity generation 49
3.4 Power system management 51
Abbreviations 55

© AEMO 2021 | Quarterly Energy Dynamics Q3 2021 6
1. NEM market dynamics 1.1 Electricity demand
1.1.1 Weather
The weather over Q3 2021 was mixed across the east coast capitals. Brisbane and Adelaide had cooler than
average conditions, while Sydney and Melbourne experienced a warmer quarter, with maximum temperatures
averaging ~0.5°C above the 10-year average (Figure 1).
In Sydney, milder conditions were largely driven by above average temperatures in August and September,
with the state experiencing its warmest August since 20133. This contrasted with July where the weather was
much cooler, with maximum temperatures averaging 0.3°C below the 10-year average.
Q3 2021 was a comparatively wet quarter across the east coast regions with above average rainfall in July and
September (Figure 2). In Tasmania (particularly in the north-west), rainfall for July was 8.1% above the
average4 and also up significantly from a vey dry July 2020.
Figure 1 Mixed weather across the east coast
Average maximum temperature variance by capital city
Figure 2 Above average rainfall in the east coast
Australian rainfall deciles – 1 July to 30 September 20215
Source: Bureau of Meteorology
1.1.2 Demand outcomes
National Electricity Market (NEM) quarterly average operational demand decreased by 37 megawatts (MW) or
-0.2% compared to Q3 2020, as increased distributed photovoltaic (PV) output6 (+341 MW) more than offset
higher underlying demand (+305 MW). Distributed PV growth, particularly in New South Wales and
Queensland which accounted for 72% of the increase in total distributed PV output, continued to contribute
to substantial daytime demand reductions (Figure 3).
On a regional basis, the changes in operational demand compared to Q3 2020 were mixed, with reductions in
New South Wales (-212 MW) and South Australia (-35 MW) offset by higher demand in Queensland,
Tasmania and Victoria (+210 MW combined, Figure 4).
3 Bureau of Meteorology 2021, New South Wales in August 2021: http://www.bom.gov.au/climate/current/month/nsw/archive/202108.summary.shtml
4 Bureau of Meteorology 2021, Tasmania in July 2021: http://www.bom.gov.au/climate/current/month/tas/archive/202107.summary.shtml
5 Bureau of Meteorology 2021, Recent and historical rainfall maps:
http://www.bom.gov.au/climate/maps/rainfall/?variable=rainfall&map=decile&period=3month®ion=nat&year=2021&month=09&day=30
6 Increased distributed PV generation results in reduced operational demand because distributed PV is behind the meter.
-0.5
0.0
0.5
1.0
BRI SYD MEL ADL HOB
°C
Q3 21 vs Q3 20 Q3 21 vs 10yr average

© AEMO 2021 | Quarterly Energy Dynamics Q3 2021 7
With small changes in heating requirements compared to Q3 2020, changes in underlying demand were
mostly driven by impacts of the response to the COVID-19 pandemic and industrial load changes.
Figure 3 Increased underlying demand more than offset by distributed PV output
Change in average NEM operational demand – Q3 2021 vs Q3 2020
Figure 4 Queensland leads underlying demand
increase
Change in average operational demand – Q3 2021 vs Q3 2020
Figure 5 Highest Queensland Q3 underlying
demand in recent years
Average Queensland underlying demand – Q3s
Underlying demand changes and drivers varied by region:
• Queensland’s underlying demand increased by 257 MW on average, reaching its highest Q3 levels in
recent years (Figure 5). Higher industrial activity including liquefied natural gas (LNG) and mining load
was a key driver for a consistent increase in underlying demand across the day.
• Strict COVID-19 restrictions in New South Wales this quarter combined with warm August and
September conditions resulted in a 72 MW average fall in underlying demand compared to Q3 2020.
− An increased residential share of demand under COVID-19 restrictions has resulted in demand being
more temperature sensitive. As shown in Figure 6, comparatively cooler conditions in July contributed
to increased underlying demand (+183 MW on average) compared to a year ago. In contrast, warm
August conditions saw large reductions in demand (-394 MW on average), particularly during the
morning peaks between 0630 and 0830 hrs.
• Average underlying demand in Victoria was up by 76 MW on average compared to Q3 2020 with slightly
fewer days (15) in restrictions this Q3 compared to 2020.
-1,400
-1,000
-600
-200
200
600
0:30 2:30 4:30 6:30 8:30 10:30 12:30 14:30 16:30 18:30 20:30 22:30
Avera
ge c
han
ge (
MW
)
Distributed PV impact Underlying demand Operational Demand
-300
-200
-100
0
100
200
300
NSW QLD SA TAS VIC
Avera
ge c
han
ge (
MW
)
Underlying Demand Distributed PV Impact
Operational Demand
6,000
6,100
6,200
6,300
6,400
6,500
2016 2017 2018 2019 2020 2021
Un
derl
yin
g D
em
an
d (
MW
)

© AEMO 2021 | Quarterly Energy Dynamics Q3 2021 8
Figure 6 Large reductions in underlying New South Wales demand in August 2021
Average change in New South Wales monthly underlying demand by time of day – Q3 2021 vs Q3 2020
Maximum demands
Maximum demands were marginally to moderately higher in all regions this Q3 with the largest increase in
New South Wales where cold early July conditions saw a maximum demand of 12,423 MW, an increase of
447 MW over one year ago and the state’s highest Q3 operational demand maximum since 2011. South
Australia’s maximum demand of 2,628 MW on 22 July was a new Q3 and winter record while Queensland’s
Q3 maximum of 8,162 MW was only marginally below the Q3 record for that state.
Minimum demands
As flagged in the recent NEM Electricity Statement of Opportunities7, continued growth in distributed PV is
driving rapid declines in minimum operational demand across the NEM. This quarter saw new lows for
operational demand in New South Wales and South Australia:
• New South Wales’ quarterly low minimum demand
of 4,872 MW8 which occurred at 1230 hrs on Sunday
19 September 2021 was the lowest level since Q1
2000, and 498 MW (or 9%) lower than 2020’s
minimum demand (Figure 7). Mild sunny conditions
coupled with low weekend demand were key drivers.
During the minimum demand interval, distributed PV
provided 2,722 MW of output accounting for 36% of
underlying demand.
• South Australia’s new minimum demand record of
236 MW occurred at 1400 hrs on Sunday 26
September 2021 and was 64 MW below the previous
low set in Q4 2020. Drivers were similar to New South
Wales, with distributed PV providing an estimated
1,131 MW of output, representing 83% of underlying
demand.
7 AEMO 2021, Electricity Statement of Opportunities 2021: https://aemo.com.au/-
/media/files/electricity/nem/planning_and_forecasting/nem_esoo/2021/2021-nem-esoo.pdf?la=en&hash=D53ED10E2E0D452C79F97812BDD926ED
8 Note start-time reference in the Quarterly Energy Dynamics is from NEM start in 1998. This minimum demand was noted as a record in other AEMO
publications as start time reference for operational records is May 2006, aligning with Tasmania being connected to the mainland NEM.
-800
-600
-400
-200
0
200
400
0:30 2:30 4:30 6:30 8:30 10:30 12:30 14:30 16:30 18:30 20:30 22:30
Avera
ge c
han
ge (
MW
)
July August September
Figure 7 Lowest minimum demand since Q1 2000
Minimum demand records – New South Wales
4,000
4,500
5,000
5,500
6,000
1998
2000
2002
2004
2006
2008
2010
2012
2014
2016
2018
2020
Min
imu
m d
em
an
d (
MW
)

© AEMO 2021 | Quarterly Energy Dynamics Q3 2021 9
1.2 Wholesale electricity prices
The start of the quarter saw a continuation of the high prices experienced in May and June with mainland
NEM prices averaging $111/megawatt hour (MWh) in July. By September, however, mainland prices had fallen
to $37/MWh. Across the quarter mainland spot prices averaged $66/MWh down from their Q2 highs of
$95/MWh but still well above their average of $42/MWh in Q3 2020 (Figure 8).
Figure 8 Prices retreated from Q2 highs as volatility reduced
Mainland average wholesale electricity price
The quarter exhibited varied price trends across the NEM (Figure 9):
• In Queensland and New South Wales volatility fell from the very high levels experienced in Q2, but
underlying energy prices were similar, and well above levels of one year ago9.
• Victoria and South Australia saw no significant price volatility in Q3, and although energy prices retreated
somewhat from those of Q2, they were higher than in Q3 2020. Price spreads to the northern NEM states
remained large (the northern regions averaging a premium of 48% to Victoria and South Australia),
although lower than in Q2.
• Tasmanian prices declined sharply as hydro generation increased to support energy exports to the
mainland (Sections 1.3.3 & 1.4).
Figure 9 Lower volatility but northern region energy prices remain elevated
Average wholesale electricity price by region10
9 The AER has published reports around the spot prices greater than $5000 in Queensland on 14 July and New South Wales on 21 July:
https://www.aer.gov.au/wholesale-markets/performance-reporting/prices-above-5000-mwh-14-july-2021-nsw and https://www.aer.gov.au/wholesale-
markets/performance-reporting/prices-above-5000-mwh-21-july-2021-queensland
10 ‘Energy price’ is used in electricity pricing to remove the impact of price volatility (that is, price above $300/MWh).
0
20
40
60
80
100
120
140
Q3 18 Q4 18 Q1 19 Q2 19 Q3 19 Q4 19 Q1 20 Q2 20 Q3 20 Q4 20 Q1 21 Q2 21 Q3 21
$/M
Wh
32
128
80
46
111
78
51
70
56
40
70
51 50 45
25
-
25
50
75
100
125
150
QLD NSW VIC SA TAS
$/M
Wh
Cap price
Energy price
Q3 2
0
Q2 2
1
Q3 2
1

© AEMO 2021 | Quarterly Energy Dynamics Q3 2021 10
Within the quarter, monthly price averages show that volatility and elevated energy prices were essentially
limited to July, with prices in all regions falling away significantly in August and September (Figure 10). The
NEM-wide spot price average for August and September 2021 was 0.6% below that of the corresponding
months in 2020, with prices in the southern states (Victoria, South Australia and Tasmania) averaging 28%
lower.
Figure 10 Volatility and energy prices falling across the quarter
Average wholesale monthly electricity price (energy and cap) by region and month – Q3 2021
The profile of average spot price by time of day for the individual months of Q3 2021 further illustrates the
trajectory of prices through the quarter (Figure 11). The impact of price volatility at morning and evening peak
times falls away after July, with middle-of-day price averages dropping towards zero as solar generation
output (grid-scale and distributed PV) increases and operational demands decline into the spring months.
Figure 12 highlights Victorian average spot prices by time of day for August and September 2021. The
average price between 1000 hrs and 1530 hrs fell from $30/MWh in 2020 to just $0.01/MWh this year.
Section 1.2.1 discusses general electricity price drivers and Section 1.2.2 analyses features of volatility
experienced in the quarter.
Figure 11 Rapid decline in daytime prices over the
quarter
Mainland NEM average spot price by time of day – Q3 2021
(monthly) vs Q3 2020
Figure 12 Victorian middle-of-day prices fall
towards zero
Victoria average spot price by time of day – Aug-Sep 2021 vs
Aug-Sep 2020
0
20
40
60
80
100
120
140
160
July 2021 August 2021 September 2021
$/M
Wh
-100
0
100
200
300
400
500
0:3
0
2:3
0
4:3
0
6:3
0
8:3
0
10:3
0
12:3
0
14:3
0
16:3
0
18:3
0
20:3
0
22:3
0
$/M
Wh
Q3 2020
Jul-21
Aug-21
Sep-21
-20
0
20
40
60
80
100
120
140
0:3
0
2:3
0
4:3
0
6:3
0
8:3
0
10:3
0
12:3
0
14:3
0
16:3
0
18:3
0
20:3
0
22:3
0
$/M
Wh
Aug-Sep 2020 Aug-Sep 2021
QLD NSW VIC SA TAS

© AEMO 2021 | Quarterly Energy Dynamics Q3 2021 11
1.2.1 Wholesale electricity price drivers
Wholesale prices during Q3 2021 were subject to a range of influences with a continuation of Q2’s volatility
leading to high prices in July before milder weather and increased variable renewable energy (VRE) output
saw record occurrences of negative prices by the end of the quarter. These influences are outlined in Table 1.
Table 1 Wholesale electricity price levels: Q3 2021 drivers
Price volatility Episodes of price volatility in Queensland and New South Wales were largely limited to July and
less severe than those of Q2 2021 but still lifted average prices for the quarter relative to Q3 2020
when no significant price volatility occurred (Section 1.2.2).
Gas prices High and volatile east coast gas prices in the first weeks of July flowed through to underlying
electricity prices as gas generation was required to meet winter peak demands. From late July,
however, gas prices eased (Section 2.2) and gas-fired generation output fell substantially
(Section 1.3.2) as lower electricity demands and increasing VRE supply displaced it from the supply
stack.
Black coal
availability and
bidding
Although black coal plant availability increased from outage-affected Q2 levels, the Q3 average
remained below that of Q3 2020 (68% vs 71% respectively), with outages this July 1,317 MW higher
than in July 2020 (although reduced by 1,327 MW from June 2021’s unusually high level).
Combined with key black coal generators moving marginal offer bands to significantly higher
prices (Figure 13), this resulted in a leftward shift in the black coal generation supply curve from
that of Q3 2020, with reductions in offered volume of 1,400 MW below $100/MWh and 1,787 MW
below $50/MWh over the quarter as a whole (Figure 14).
Changes in
demand Higher operational demands in Queensland throughout Q3 2021 (+151 MW versus Q3 2020) and
during July in New South Wales (+77 MW) also contributed to energy prices remaining higher in
those regions than in corresponding months of Q3 2020.
Conversely, milder weather, the full impact of COVID restrictions and increasing distributed PV
output saw operational demands in New South Wales fall sharply after July (down 359 MW
against August and September 2020) while net changes across the quarter in South Australia,
Victoria and Tasmania were small (+24 MW). Lower demands contributed to falling prices over the
remainder of Q3.
Higher VRE and
hydro supply VRE and hydro output increased significantly on Q3 2020 with commissioning of new generation,
higher wind capacity factors, and strong hydro generation in Tasmania, as well as the normal
seasonal upswing in solar generation. This contributed to prices falling during the quarter.
Figure 13 Eraring, Gladstone, Mount Piper and Vales Point power stations’ marginal offers increase
Monthly volume-weighted marginal offers11 - Eraring, Gladstone, Mount Piper and Vales Point power stations
11 Market offers between $10/MWh and $120/MWh.
0
10
20
30
40
50
60
70
Jan
Feb
Mar
Ap
r
May
Jun
Jul
Aug
Sep
Oct
No
v
Dec
Jan
Feb
Mar
Ap
r
May
Jun
Jul
Aug
Sep
Oct
No
v
Dec
Jan
Feb
Mar
Ap
r
May
Jun
Jul
Aug
Sep
2019 2020 2021
$/M
Wh

© AEMO 2021 | Quarterly Energy Dynamics Q3 2021 12
Figure 14 Shifts in coal generators’ marginal price offers reduce lower cost supply
Black coal-fired generation bid supply curve – Q3 2021 vs Q3 2020
1.2.2 Wholesale electricity price volatility
Volatility in Q3 2021 was substantially lower than in Q2 2021, although still material in the northern regions,
contributing $14/MWh to Queensland’s average quarterly spot price, while in New South Wales the
contribution was $6/MWh. Whereas in Q2 there were five days where daily average regional spot prices
exceeded $400/MWh, often in multiple regions, there was only one such day in Q3, when the Queensland
spot price averaged $580/MWh on 21 July. Across the quarter, spot prices exceeded $2,000/MWh in 20
half-hourly trading intervals, compared to 84 in Q2, with fewer instances of simultaneous high prices in
multiple regions.
The majority of the volatility experienced in Queensland and New South Wales in Q3 coincided with planned
transmission outages creating inter- or intra-regional constraints on energy flows, effectively tightening the
supply-demand balance within one or both regions, and generally occurred around morning and evening
demand peaks.
In addition to spot price volatility, Queensland also experienced significant volatility in prices for contingency
FCAS products, with dispatch prices for the Raise 6 Second and Raise 60 Second services exceeding
$10,000/MWh more frequently than the energy dispatch price12 (Figure 15). This volatility led directly to very
high FCAS recovery costs for Queensland, discussed in Section 1.5.1.
Figure 15 Volatility raises Queensland FCAS and energy prices
Queensland FCAS and energy prices vs balance of NEM – Q3 202113
12 The AER has published a report around the FCAS prices exceeded $5,000/MW in Queensland on 21 July: https://www.aer.gov.au/wholesale-
markets/performance-reporting/prices-above-5000-mwh-21-july-2021-queensland
13 ‘Underlying’ portion of average prices removes the impact of price volatility (that is, price above $300/MWh). Note that Energy price volatility is calculated
based on trading interval data while FCAS volatility (Raise 6 Sec, Raise 60 Sec, Lower 6 Sec and Lower 60 Sec) is based on dispatch interval data.
0
50
100
150
200
250
300
8,000 9,000 10,000 11,000 12,000 13,000 14,000 15,000
Pri
ce (
$/M
Wh
)
Offers (MW)
Q3 2021
Q3 2020
0
20
40
60
80
100
Qu
eensl
an
d
Rest
of
NEM
Queensl
an
d
Rest
of
NEM
Qu
eensl
an
d
Rest
of
NEM
Qu
eensl
an
d
Rest
of
NEM
Qu
eensl
an
d
Rest
of
NEM
Raise 6 Sec Raise 60 Sec Lower 6 Sec Lower 60 Sec Energy
$/M
Wh
Underlying Volatility

© AEMO 2021 | Quarterly Energy Dynamics Q3 2021 13
This FCAS price volatility, as well as significant episodes of energy price volatility in Queensland, arose
principally from planned transmission outages in northern New South Wales. These outages were associated
with upgrade works on the Queensland – New South Wales Interconnector (QNI) and required the activation
of local FCAS constraints in Queensland to address the single contingency risk of a parallel line or bus trip.
Such a trip would electrically separate Queensland and part of the northern New South Wales region from
the rest of the NEM, and remove supply flowing on the critical line into the region. Managing the impact of
this risk requires minimum threshold levels of contingency FCAS to be sourced from Queensland providers.
If contingency FCAS supplies in Queensland are limited, as well as raising FCAS prices, the effect of these
constraints can be to force energy flows from Queensland into the northern New South Wales region. Such
exports directly reduce supply on the critical line from the rest of the NEM into northern New South Wales,
which would be lost if a trip occurs. Through reducing this “flow at risk”, the quantity of FCAS required in
Queensland is also reduced, but dispatch of additional generation to support these exports raises energy
prices in the region.
To illustrate these effects, Figure 16 shows Queensland energy and selected FCAS prices on 21 July, which
accounted for just under a third of that region’s Q3 energy price volatility. A planned transmission outage in
northern New South Wales activated local FCAS constraints in Queensland but limited availability of these
services forced energy exports southwards throughout the evening peak demand period, to reduce the
amount of contingency FCAS needing to be procured. This caused additional dispatch of Queensland
generation into high energy offer price bands, leading to significant energy spot price volatility in addition to
very high FCAS prices due to the limited FCAS supply. During this episode, spot prices in New South Wales
remained below $300/MWh and the forced southward energy flow led to significant accumulation of
negative settlement residues on QNI, discussed in Section 1.4.1.
Figure 16 Queensland FCAS constraints force exports to New South Wales and high volatility
Dispatch prices, generation and availability levels, and inter-regional flows 21 July 2021
-3,000
0
3,000
6,000
9,000
12,000
15,000
-1,000
2,000
5,000
8,000
11,000
14:40 15:40 16:40 17:40 18:40 19:40 20:40 21:40
$/M
Wh
MW
Dispatched Gen [LHS] Available Gen [LHS]
QLD-NSW Export [LHS] QLD RRP [RHS]
QLD Raise 6 Sec Price [RHS] QLD Raise 60 Sec Price [RHS]

© AEMO 2021 | Quarterly Energy Dynamics Q3 2021 14
1.2.3 Negative wholesale electricity prices
During Q3 2021, negative and zero spot prices14 occurred in 16% of all trading intervals, more than doubling
the previous record set in Q4 2020 (7%). Notably, the occurrence of negative spot prices this quarter was up
across the NEM, with records set in all regions including New South Wales where negative prices were
previously rare (Figure 17). While the number of negative price intervals increased substantially across all
regions, the largest increase was in the southern regions, with South Australian spot prices negative 25% of
the time, followed by Victoria (21%) and Tasmania (19%). In Queensland and New South Wales, negative spot
price occurrence was also up but at much lower levels of 10% and 5%, respectively.
Figure 17 Record high occurrence of negative prices across the NEM
Quarterly negative price percentage occurrence
The impact of negative prices varied across NEM regions, with the largest impact in South Australia, cutting
average spot prices in the region by $10.20/MWh followed by Victoria ($4.50/MWh) and Tasmania
($2.40/MWh). Despite negative spot occurrences reaching record levels across all states, impacts on average
prices were somewhat softened due to relatively fewer intervals where prices were below negative $50/MWh.
In South Australia, 78% of negative price intervals occurred between $0/MWh and -$50/MWh compared to
68% in Q3 2020.
By region, drivers of record high negative price occurrence included:
• The marked increase in periods of very high VRE output in Victoria and South Australia, particularly from
wind due to the ramp up of recently installed capacity and seasonally windy conditions. A combination of
high wind output and low overnight15 and midday demand contributed to increased negative price
occurrence during those periods (Figure 18).
• Negative spot prices in Tasmania reached record highs (19%) this quarter, surpassing the previous record
set in Q2 2021 (6.6%). Compared to Q3 2020, 380 MW more hydro generation was offered below
$0/MWh than Q3 2020, reflecting increased rainfall and a greater ability to generate. This coupled with
higher Tasmanian wind output (+56 MW), increased exports on Basslink, and the interconnector binding
more frequently (up from 53% in Q3 2020 to 63% this quarter) contributed to periods of negative spot
pricing in the state.
• In Queensland and New South Wales, negative prices were predominantly confined to the middle of the
day (Figure 18). Increased periods of low midday demand due to distributed PV coupled with high
grid-scale solar output were key drivers of the record. Of note, combined grid-scale solar output from the
two regions exceeded 2,000 MW between 0900 hrs and 1530 hrs 38% of the time, compared to only 2%
in Q3 2020.
14 Hereafter referred to as negative spot prices.
15 0200 hrs to 0500 hrs
0%
5%
10%
15%
20%
25%
30%
Q3
20
Q4
20
Q1
21
Q2
21
Q3
21
Q3
20
Q4
20
Q1
21
Q2
21
Q3
21
Q3
20
Q4
20
Q1
21
Q2
21
Q3
21
Q3
20
Q4
20
Q1
21
Q2
21
Q3
21
Q3
20
Q4
20
Q1
21
Q2
21
Q3
21
SA VIC TAS QLD NSW
Neg
ative
pri
ce o
ccu
rren
ce
(%)

© AEMO 2021 | Quarterly Energy Dynamics Q3 2021 15
− Increased occurrence of negative prices in New South Wales also led to a mainland NEM record,
where spot prices were negative at the same time across all four regions 3.9% of the time, surpassing
the previous highs in Q2 2021 (0.7%).
Figure 18 Negative spot price occurrence mainly confined to middle of the day, with some overnight
increases in the southern states
Negative price percentage occurrence by time of day by region – Q3 2021
Generator response to negative prices
• Wind and solar farms – high levels of negative spot prices over the past few quarters and the
deployment of participant automated bidding software has led to a significant increase in price
responsiveness from wind and solar farms. With increased frequency of negative prices the number of
rebids by NEM wind and solar farms this quarter was four and a half times higher than Q3 2020
(Figure 19), as participants raised their offer prices to ensure they were not dispatched during negative
prices.
− With the emergence of negative spot prices in New South Wales, AEMO estimates that around 45% of
New South Wales semi-scheduled VRE capacity has automated bidding capability as evidenced by the
region’s 11-fold increase in VRE rebids compared to Q3 2020.
• Brown coal – as discussed in Section 1.3.1, with high occurrence of low or negative spot prices in Victoria,
brown coal units particularly Yallourn and Loy Yang B have been increasingly responding to low or
negative prices by shifting marginal capacity to higher price bands ($10/MWh to $35/MWh) during these
periods. Of note, compared to Q3 2020, average brown coal output declined by 332 MW this quarter
between 1000 hrs and 1600 hrs, when frequency of negative spot prices were the highest (Figure 20).
Figure 19 Large increase in number of VRE rebids
Number of VRE rebids by DUID and region – Q320 to Q321
Figure 20 Brown coal’s flexible operation
Brown coal average generation by time of day – Q3 21 vs Q3 20
DUID: Dispatchable unit identifier
0%
20%
40%
60%
80%
0:30 2:30 4:30 6:30 8:30 10:30 12:30 14:30 16:30 18:30 20:30 22:30
Neg
ative p
rice
occ
urr
en
ce (
%) NSW QLD SA TAS VIC
0
40,000
80,000
120,000
160,000
200,000
240,000
280,000
Q3 20 Q4 20 Q1 21 Q2 21 Q3 21
Nu
mb
er
of
VR
E r
eb
ids
SA QLD NSW VIC TAS
3,000
3,500
4,000
4,500
0:3
0
2:3
0
4:3
0
6:3
0
8:3
0
10:3
0
12:3
0
14:3
0
16:3
0
18:3
0
20:3
0
22:3
0
Avera
ge M
W
Q3 20 Q3 21

© AEMO 2021 | Quarterly Energy Dynamics Q3 2021 16
1.2.4 Price-setting dynamics
Price-setting trends, shown in Figure 21, reflected a decreased role for gas, down from setting prices 20% of
the time in Q2 to 13% in Q3 2021, with an increase in price setting by VRE from 3% in Q2 to 9% this quarter.
Black coal set the price slightly more often in the northern states but less so in the southern regions,
indicating a greater proportion of periods where prices separated between northern and southern regions.
Figure 21 VRE setting price more frequently while role of gas diminishes
Price-setting by fuel type
Note: price setting can occur inter-regionally: for example, Victoria’s price can be set by generators in other NEM regions.
Figure 22 provides a more detailed view of price-setting roles by time of day, comparing Q3 2020 to Q3 2021,
and clearly shows the increase in the proportion of time that wind and solar set prices through daylight hours
with corresponding decreases in thermal generation’s price-setting frequency. In Q3 2021, wind and solar set
the price 23% of the time between the hours of 0800 hrs and 1600 hrs up from 9% in Q3 2020.
The larger price-setting role for hydro across the day in Q3 2021 reflects sustained higher generation and
energy exports to the mainland by Hydro Tasmania, discussed in Section 1.3.3.
Figure 22 VRE’s growing role in setting daytime prices
NEM price setting by fuel type and time of day – Q3 2020 vs Q3 2021
The increased price-setting role of wind and grid-scale solar generation has been accompanied by the use of
automated bidding and changes in bidding strategies by these generators, with bid volumes more frequently
0%
20%
40%
60%
80%
100%
Q3 2
0
Q4
20
Q1
21
Q2 2
1
Q3 2
1
Q3 2
0
Q4
20
Q1
21
Q2 2
1
Q3 2
1
Q3 2
0
Q4
20
Q1
21
Q2 2
1
Q3 2
1
Q3 2
0
Q4
20
Q1
21
Q2 2
1
Q3 2
1
Q3 2
0
Q4
20
Q1
21
Q2 2
1
Q3 2
1
QLD NSW VIC SA TAS
Perc
en
tag
e o
f tim
e (
%)
Black Coal Brown Coal Gas Hydro Wind Solar Other
0%
20%
40%
60%
80%
100%
0:0
0
1:30
3:0
0
4:3
0
6:0
0
7:3
0
9:0
0
10:3
0
12:0
0
13:3
0
15:0
0
16:3
0
18:0
0
19:3
0
21:
00
22:3
0
0:0
0
1:30
3:0
0
4:3
0
6:0
0
7:3
0
9:0
0
10:3
0
12:0
0
13:3
0
15:0
0
16:3
0
18:0
0
19:3
0
21:
00
22:3
0
Q3 2020 Q3 2021
% o
f tim
e
Black coal Brown coal Gas Hydro Solar Wind Other

© AEMO 2021 | Quarterly Energy Dynamics Q3 2021 17
shifted from extreme negative price bands to higher priced bands to avoid dispatch at uneconomic spot
prices (Section 1.2.3). As a result of such changes, the average marginal price set by wind and solar generators
across the mainland NEM moved from -$51/MWh in Q3 2020 to -$1/MWh in Q3 2021.
1.2.5 Electricity futures markets
During Q3 2021, ASX futures prices continued to fluctuate with NEM price volatility. Calendar year (Cal) 2022
swap contract prices initially increased across all states from an average of $53/MWh at the end of Q2 2021 to
$58/MWh by the end of July (Figure 23).
However, by the end of the quarter there was a clear divergence in prices with New South Wales and
Queensland rising slightly further and South Australia and Victoria falling. New South Wales ended the
quarter up at $66.50/MWh while Victoria remained the lowest priced state at $48.40/MWh. This resulted in a
spread of $18/MWh, which is a multi-year high.
Figure 23 Victorian price spreads to other states widened
ASX Energy – Cal22 swap price by region – seven-day averages
$30
$35
$40
$45
$50
$55
$60
$65
$70
Jan-21 Feb-21 Mar-21 Apr-21 May-21 Jun-21 Jul-21 Aug-21 Sep-21
$/M
Wh
New South Wales Victoria Queensland South Australia

© AEMO 2021 | Quarterly Energy Dynamics Q3 2021 18
1.3 Electricity generation
Figure 24 and Table 2 show the change in NEM
generation mix compared to Q3 2021, while Figure 25
shows the change by time of day. Key outcomes
compared to Q3 2020 included:
• Grid-scale VRE (wind and solar) generation
increased to a record quarterly level with the NEM
instantaneous renewable share of total generation
reaching 61.4%.
• Hydro generation increased by 224 MW on average,
largely driven by Tasmania, reflecting increased
rainfall and dam levels in the region.
• Black coal-fired generation declined to its lowest Q3
average since NEM start, predominantly driven by the
New South Wales fleet as Queensland output was
comparable to Q3 2020.
• Gas-powered generation (GPG) declined by
420 MW on average led by South Australia and Queensland, driven by lower average prices and volatility
during the quarter.
Table 2 NEM supply mix by fuel type
Quarter Black coal Brown coal Gas Hydro Wind Grid solar
Q3 2020 51.9% 17.4% 8.6% 7.8% 11.2% 3.1%
Q3 2021 49.6% 16.8% 6.7% 8.8% 14.1% 4.0%
Change -2.3% -0.5% -1.9% 1.0% 2.9% 0.8%
Figure 25 Renewable energy increases in Q3 2021
Change in supply – Q3 2021 versus Q3 2020 by time of day
-2,000
-1,500
-1,000
-500
0
500
1,000
1,500
2,000
2,500
0:00 2:00 4:00 6:00 8:00 10:00 12:00 14:00 16:00 18:00 20:00 22:00 0:00
Avera
ge c
han
ge (
MW
)
Brown Coal Black Coal Wind Gas Hydro Grid Solar Distributed PV
Figure 24 Wind leads output increase
Change in supply – Q3 2021 versus Q3 2020
-600
-400
-200
0
200
400
600
800
Win
d
Dis
trib
ute
d P
V
Hyd
ro
Gri
d S
ola
r
Bro
wn C
oal
Gas
Bla
ck C
oal
Avera
ge c
han
ge (
MW
)

© AEMO 2021 | Quarterly Energy Dynamics Q3 2021 19
1.3.1 Coal-fired generation
Black coal-fired fleet
During Q3 2021, average black coal-fired generation declined to 10,969 MW, its lowest Q3 output since NEM
start and 512 MW lower than Q3 2020 (Figure 26). Record low output was mostly driven by the New South
Wales fleet (-486 MW), with the Queensland fleet only down by 25 MW.
Figure 26 Record low Q3 black coal output
Average NEM black coal-fired generation – Q3s
Average New South Wales black coal-fired output declined to its lowest Q3 output on record this quarter
(5,939 MW), with the largest decrease occurring between 0800 hrs and 1600 hrs (-887 MW on average,
Figure 27). The substantial decline in output during morning and daytime hours was mainly due to increased
VRE generation and reduced daytime operational demand, with small increases in outages also contributing.
Notably, output reduction also occurred as black coal units in New South Wales shifted coal bids from lower
price bands to price bands above $40/MWh this quarter, coinciding with record high international coal prices
(Section 2.2.3). Compared to Q3 2020, an average 1,424 MW of offers from the New South Wales fleet shifted
from lower-priced bands to prices above $40/MWh.
Figure 27 Large reductions in morning and
daytime output
Average NSW black coal-fired generation by time of day – Q3s
Figure 28 New South Wales fleet leads black coal
output decline
Change in coal-fired generation – Q3 2021 vs Q3 2020
10,000
11,000
12,000
13,000
14,000
15,000
2000
2001
2002
2003
2004
2005
2006
2007
2008
2009
2010
2011
2012
2013
2014
2015
2016
2017
2018
2019
2020
2021
Ave
rag
e M
W
4,000
5,000
6,000
7,000
8,000
0:3
0
2:3
0
4:3
0
6:3
0
8:3
0
10:3
0
12:3
0
14:3
0
16:3
0
18:3
0
20:3
0
22:3
0
Avera
ge M
W
Q318 Q319 Q320 Q321
Mt Piper
Bayswater
Eraring
Liddell
Tarong
NorthGladstone
Stanwell
Loy Yang
A
Yallourn
-800
-600
-400
-200
0
200
400
NSW QLD VIC
Avera
ge c
han
ge (
MW
)

© AEMO 2021 | Quarterly Energy Dynamics Q3 2021 20
Compared to Q3 2020, by power station (Figure 28):
• Reduced output at Mount Piper Power Station (-263 MW on average) was driven by a combination of
higher-priced marginal bids and displacement by increased VRE output. Compared to Q3 2020, Mount
Piper units shifted 312 MW of offers from below $40/MWh to higher price bands. A planned outage at
Unit 2 during the quarter also contributed partially to the output decline.
• Increased outages (mostly unplanned) and some displacement by VRE generation reduced average
output at Bayswater Power Station by 242 MW. The average availability factor16 at Bayswater declined to
68% this quarter, much lower than the 80% achieved in Q3 2020.
• Average output at Eraring Power Station declined by 193 MW to its lowest Q3 level since 2013. Lower
output was largely driven by increased outages (mainly Unit 4 due to a planned outage), with increased
marginal bids also contributing. Compared to Q3 2020, Eraring shifted 717 MW of capacity from below
$40/MWh to higher price bands – this shift in marginal offers particularly during daytime hours when
spot prices were low reflects the greater emphasis on minimising Eraring’s exposure during low prices17.
• Fewer outages at Liddell Power Station increased average output by 203 MW. On average, Liddell units
were out of service 17 days compared to 33 days in Q3 2020.
In Queensland, despite lower availability (-208 MW) compared to Q3 2020, average black coal-fired
generation was largely unchanged (-25 MW) as available units were generating at higher utilisation due to
higher spot prices, particularly in July (85% compared to 79% in July 2020). Utilisation rate however declined
throughout the quarter to 78% in September 2021 as spot prices fell.
• Lower average availability from the Queensland black coal fleet was predominantly driven by Tarong
North and Gladstone due to increased outages, reducing output by 154 MW and 100 MW, respectively.
• At Callide Power Station, despite the major incident in Q2 2021 which resulted in Unit 3 being out of
service until 25 July and Unit 4 for the entire quarter18, overall output was slightly higher than Q3 2020
(+62 MW), as increased availability from Callide B Unit 1 offset the decrease.
Brown coal-fired fleet
Average brown coal-fired generation decreased by
117 MW compared to Q3 2020 as reduced output from
Loy Yang A (-280 MW) mainly due to a planned outage at
Unit 3 was partially offset by increases from Yallourn
(+111 MW) and Loy Yang B (+52 MW). All four Yallourn
units returned to service by 2 July following the mine
flood damage in Q2 2021.
The decline in output this quarter occurred despite slightly
higher brown coal availability (+65 MW) and was mainly
due to displacement by lower-priced fuel types such as
wind and solar. This resulted in the average brown coal-
fired utilisation rate19 decreasing from 99% in Q3 2020 to
94% this quarter, with both Yallourn and Loy Yang B’s
utilisation rate declining to their lowest quarterly levels in
recent years (Figure 29). As low and negative spot prices
continue to trend upwards in Victoria, brown coal units
continued to shift marginal capacity to higher price bands to avoid dispatch.
16 Ratio of generator’s availability divided by max capacity
17 Origin Energy 2021, Full Year Results 2021: https://www.originenergy.com.au/about/investors-media/reports-and-results/full-year-results-20210819.html
18 Callide Unit 4 was originally expected to return by December 2022, it is currently scheduled to return 1 February 2023
19 Ratio of generator’s average generation divided by average availability
Figure 29 Brown coal utilisation rate declines
Brown coal utilisation rate by generator
90%
92%
94%
96%
98%
100%
Q1
19
Q2
19
Q3
19
Q4
19
Q1
20
Q2
20
Q3
20
Q4
20
Q1
21
Q2
21
Q3
21
Utilis
atio
n r
ate
(%
)
Loy Yang A Loy Yang B Yallourn

© AEMO 2021 | Quarterly Energy Dynamics Q3 2021 21
1.3.2 Gas-powered generation
During Q3 2021, NEM GPG declined to 1,485 MW on average, 254 MW lower than the previous quarter and
420 MW less than Q3 2020 (Figure 30). South Australia (614 MW on average) led the decline, with its lowest
Q3 average since 2015, while Queensland (555 MW) decreased to its lowest average since Q3 2018.
Figure 30 GPG declines throughout Q3 with decreasing prices and volatility
Average GPG generation by state
After a volatile pricing end to Q2 2021, average monthly GPG generation declined by 41% between July
(1,853 MW) and September (1,102 MW), as both price volatility and demand decreased coupled with increased
VRE generation and negative prices. This was apparent with average peaking generation declining by 49%
from July to 347 MW in September, while the divergence between rising gas and declining electricity prices
was most evident in South Australia (Figure 31 and Figure 32).
Figure 31 Peaking generation declines in Q3
Average quarterly NEM GPG generation by classification20
Figure 32 SA gas and electricity price diverge
South Australia average electricity and gas price by quarter
20 Classification Baseload/mid-merit: Darling Downs, Swanbank E, Mortlake, Newport, Osborne, Pelican Point, Tallawarra, Torrens Island, Tamar Valley,
remaining are peakers.
-
500
1,000
1,500
2,000
2,500
Q319 Q419 Q120 Q220 Q320 Q420 Q121 Q221 Jul-21 Aug-21 Sep-21
Avera
ge M
W
Queensland South Australia New South Wales Victoria
0
500
1000
1500
2000
2500
Q3
19
Q4
19
Q1
20
Q2
20
Q3
20
Q4
20
Q1
21
Q2
21
Q3
21
Avera
ge G
en
era
tio
n (
MW
)
Baseload/mid-merit Peaking
0
5
10
15
0
25
50
75
100
125
150
175
$/G
J
$/M
Wh
Electricity price [LHS] Gas price [RHS]
© AEMO 2021 | Quarterly Energy Dynamics Q3 2021 22
1.3.3 Hydro
Hydro generation increased by 224 MW on average compared to Q3 2020, influenced by increased rainfall
mainly in Tasmania coupled with higher mainland prices and volatility early in the quarter (Figure 33).
Figure 33 Hydro Tasmania ramps up
Average hydro MW generation by state and quarter
By region compared to Q3 2020:
• Tasmania – was the main contributor to higher NEM hydro output, increasing 268 MW to 1,344 MW on
average. Hydro generators in the region were bidding an additional 475 MW below $60/MWh, increasing
flows across Basslink as higher rainfall improved dam levels to 49% full by the end of Q3 (Figure 34).
• Mainland NEM – hydro output decreased by 44 MW on average. New South Wales (-67 MW) was the
main contributor to the decline, while Queensland and Victoria were comparable to the same time last
year. The response to emerging negative prices in New South Wales during daytime hours was evident,
with generation decreasing by 97 MW on average between 1000 hrs and 1700 hrs (Figure 35).
Figure 34 Hydro Tasmania dam levels increase
Hydro Tasmania dam levels21
Figure 35 New South Wales hydro generation flex
New South Wales average hydro generation by time of day
21 Hydro Tasmania – Energy storage historical data: https://www.hydro.com.au/water
0
500
1,000
1,500
2,000
2,500
Q3 19 Q4 19 Q1 20 Q2 20 Q3 20 Q4 20 Q1 21 Q2 21 Q3 21
Avera
ge M
W
TAS VIC NSW QLD
0
10
20
30
40
50
Jan
Feb
Mar
Ap
r
May
Jun
Jul
Aug
Sep
Oct
No
v
Dec
%
2019 2020 2021
0
200
400
600
800
1000
0:3
0
2:3
0
4:3
0
6:3
0
8:3
0
10:3
0
12:3
0
14:3
0
16:3
0
18:3
0
20:3
0
22:3
0
Avera
ge M
W
Q320 Q321

© AEMO 2021 | Quarterly Energy Dynamics Q3 2021 23
1.3.4 Wind and solar
NEM VRE generation reached a record quarterly high of 3,984 MW on average, surpassing the previous
record set in Q4 2020 by 515 MW. Compared to Q3 2020, output increased by 828 MW – the highest quarter
on quarter increase on record, with wind and grid-scale solar contributing 642 MW and 186 MW respectively
(Figure 36). New capacity additions that entered the system over the past year, windy conditions and ramping
up of capacity that was still commissioning in Q3 202022 were the key drivers of the record, more than
offsetting greater curtailment this quarter (+163 MW, Figure 37).
Figure 36 Victorian wind leads VRE output increase
Average change in VRE generation – Q3 2021 versus Q3 2020
Figure 37 New capacity the largest contributor to VRE output increase
Change in NEM VRE generation – Q3 2021 versus Q3 2020
22 Includes projects which started generating in quarter(s) earlier than the comparison period (Q3 2020) but had not reached full capacity.
-50
0
50
100
150
200
250
300
350
400
450
NSW QLD SA VIC TAS
Avera
ge c
han
ge (
MW
)
Wind
Grid-solar

© AEMO 2021 | Quarterly Energy Dynamics Q3 2021 24
With record high quarterly VRE output, several renewable records were also set during the quarter, including:
• Highest NEM instantaneous renewable share of total generation23 – on 24 September 2021,
renewable penetration, including grid-scale wind and solar, hydro, biomass, battery discharge, and
distributed PV reached a record high 61.4% of total NEM generation in the trading interval ending
1330 hrs (Figure 38).
− During this interval, distributed PV output accounted for 31% of total generation, followed by VRE
output (wind and grid-scale solar) at 28%.
− The previous record of 55.2% set in Q2 2021 was successively increased on seven separate days in this
quarter.
• Highest NEM average renewable share of total generation – NEM average renewable share reached
31.7% of total generation during the quarter, surpassing the previous record set in Q4 2020 (29.7%).
• Highest VRE output – NEM VRE output (wind and grid-scale solar) reached 8,137 MW at 1430 hrs on 25
July 2021, 759 MW higher than the previous quarterly record set in Q2 2021.
• Highest wind output – NEM wind output reached 6,402 MW at 1800 hrs on 25 July 2021, 816 MW higher
than the previous record set in Q2 2021.
• Highest grid-scale solar output – NEM grid-scale solar output reached 3,884 MW at 1000 hrs on 8
September 2021, 462 MW higher than the previous record set in Q1 2021.
Figure 38 NEM instantaneous renewable penetration reached a record high of 61.4%
NEM instantaneous renewable generation quarterly records
Average wind generation reached a quarterly high of 3,107 MW, surpassing the previous record set in Q3
2020 by 26%. Increased wind output across the NEM, particularly in Victoria, was predominantly driven by
new capacity additions over the past year and seasonally windy conditions (Figure 39). Two new wind farms
commenced generation this quarter – Stockyard Hill Wind Farm (currently registered at 286 MW maximum
capacity24) in Victoria, and Kennedy Energy Park Wind Farm (43 MW) in Queensland.
• The marked increase in Victorian wind generation this quarter (+347 MW) was predominantly due to
ramping up of capacity and higher wind speeds as wind available capacity factor increased to 41% this
quarter, up from below average levels in Q3 2020 (33%). Of note, 57% of fully commissioned Victorian
wind farms achieved available capacity factors greater than 40% this quarter, with Berrybank Wind Farm
reaching a capacity factor of 53%.
23 Instantaneous renewable penetration is calculated using the NEM renewable generation share of total generation The measure is calculated on a half-
hourly basis as this is the granularity of estimated output data for distributed PV. Renewable generation includes grid-scale wind and solar, hydro
generation, biomass, battery generation and distributed PV, and excludes battery load and hydro pumping. Total generation = NEM generation +
distributed PV generation.
24 Current nameplate rating is 478 MW.
0%
10%
20%
30%
40%
50%
60%
70%
Q1 Q2 Q3 Q4 Q1 Q2 Q3 Q4 Q1 Q2 Q3
2019 2020 2021
Ren
ew
ab
le p
en
etr
atio
n (
%)
Maximum Average Minimum

© AEMO 2021 | Quarterly Energy Dynamics Q3 2021 25
• In New South Wales, higher output (+140 MW) was largely driven by the continued ramp up of Collector
and Crudine Ridge wind farms, accounting for 86% of output increase.
• Small increases in output from South Australian wind farms (+35 MW) were largely driven by increased
wind speeds which more than offset higher curtailment. Despite AEMO increasing the non-synchronous
limit to 1,900 MW in the region from 10 September following the commissioning of the new synchronous
condensers, the impact was limited by the combination of outage-related system strength constraints
and economic curtailment (see Section 1.5.3 for more details).
Figure 39 Higher wind conditions relative to Q3 2020
Volume weighted wind available capacity factors by region (%)25
Grid-scale solar output increased by 186 MW on average, with New South Wales accounting for most of the
increase (67%). Higher New South Wales output (+124 MW) was driven by continued ramp up of recently
installed capacity (Wellington, Sunraysia, Limondale and Darlington Point solar farms) and higher solar
irradiation, offsetting increased curtailment (+43 MW, Section 1.5.3). In South Australia, despite minor capacity
additions over the past year, output was unchanged mainly due to a slight increase in grid-scale solar
curtailment (+8.5 MW). During the quarter, three new solar farms commenced generation at low levels, two in
New South Wales (Gunnedah Solar Farm, 110 MW and Suntop Solar Farm, 150 MW) and one in Queensland
(Kennedy Energy Park Solar Farm, 15 MW).
1.3.5 NEM emissions
Quarterly NEM emissions declined to the lowest Q3 total on record at 31.3 million tonnes carbon dioxide
equivalent (MtCO2-e), 6% lower than Q3 2020 (Figure 40), driven by reduced coal-fired generation and
continuing growth in VRE output.
Figure 40 Record low Q3 emissions
Quarterly NEM emissions and emissions intensity (Q3s)
25 Capacity factors of each project are weighted by maximum capacity to derive the weighted average by state. Project capacity factors are calculated using
the availability divided by its maximum installed capacity. The use of availability instead of generation removes the impact of curtailment.
0%
10%
20%
30%
40%
50%
60%
NSW QLD SA TAS VIC
Win
d c
ap
aci
ty f
act
or
(%)
Q3 2017 Q3 2018 Q3 2019 Q3 2020 Q3 2021
-
0.2
0.4
0.6
0.8
1.0
-
10
20
30
40
50
2011 2012 2013 2014 2015 2016 2017 2018 2019 2020 2021
Em
issi
on
s In
ten
sity
(tC
O2-e
/MW
h)
Em
issi
on
s (M
tCO
2-e
)
Emissions Emissions Intensity

© AEMO 2021 | Quarterly Energy Dynamics Q3 2021 26
1.3.6 Storage
Batteries
During Q3 2021, total estimated net battery market revenue was $15.3 million, $9.2 million higher than Q3
2020. FCAS markets remained the largest source of revenue, contributing 77% of all gross revenue (Figure 41).
By market:
• Higher FCAS revenue (+$7.6 million) was largely due to increased average enablement from Hornsdale
Power Reserve (HPR) following its expansion in September 2020, accounting for 68% of the increase.
Additionally, higher average Regulation (+$8.3/MWh) and Contingency (+$2.6/MWh) FCAS prices across
South Australia and Victoria also contributed to the increase in revenue.
• Increase in net energy revenue (+$1.6 million) was driven by increased South Australian battery dispatch
(+81%) and energy arbitrage (volume-weighted average increased from $30/MWh in Q3 2020 to
$72/MWh). South Australian batteries also benefitted slightly from record high negative price occurrence
as revenue received when charging during negative prices doubled from $0.33 million to $0.66 million.
During the quarter, AEMO registered three new batteries, two in Victoria – Victorian Big Battery (300MW
capacity/450MWh storage) and Bulgana Green Power Hub (20MW/34MWh) and one in Queensland
(Wandoan Battery Energy Storage System [BESS], 100MW/150MWh). While the new batteries have
commenced operation, their impact on total battery revenue was negligible because units were still
undergoing commissioning and testing. Of note, a fire at one of the Victorian Big Battery Tesla Megapacks on
30 July during testing led to its disconnection from the grid26; the unit restarted commissioning activities on
28 September.
Figure 41 Battery revenue was down on Q2 2021 levels but higher than Q3 2020
Battery revenue sources - quarterly
Pumped hydro
Pumped hydro spot market net revenue in Q3 2021 was $17 million, $18 million lower than the record highs in
Q2 2021, but $11.6 million higher than Q3 2020. Despite Shoalhaven returning to service at the start of the
quarter following an extended outage in Q2 2021, Wivenhoe still accounted for the majority of pumped hydro
net revenue this quarter (85%). Compared to Q3 2020, by power station:
• Increased net revenue from Wivenhoe Pumped Hydro (+$11 million) was a function of increased
utilisation (+51%) as well as high Queensland price volatility in July. Revenue generated during periods
26 Victorian Big Battery 2021, Update on emergency incident: https://victorianbigbattery.com.au/incident-at-vbb/
-10
0
10
20
30
40
50
60
70
Q4 19 Q1 20 Q2 20 Q3 20 Q4 20 Q1 21 Q2 21 Q3 21
Reve
nu
e/c
ost
($m
illio
n)
Energy Energy cost Charge (negative prices)
Regulation FCAS Contingency FCAS Net Revenue
© AEMO 2021 | Quarterly Energy Dynamics Q3 2021 27
when Queensland spot price exceeded $300/MWh accounted for 54% of total net revenue with the
majority derived in July (Figure 42).
• Despite increased price spreads in New South Wales and average energy arbitrage values increasing from
$42/MWh to $90/MWh this quarter, Shoalhaven Pumped Hydro’s net revenue only increased marginally
compared to Q3 2020 (+$0.6 million), mainly due to lower utilisation at the power station (-39%).
Figure 42 Pumped hydro revenue fell after July
Pumped hydro revenue sources - monthly
1.4 Inter-regional transfers
Inter-regional transfers for Q3 2021 were up on Q2 2021, with increased net northward flows from Victoria to
New South Wales (+109 MW) and Tasmania to Victoria (+115 MW) the main contributors (Figure 43).
Compared to Q3 2020, there were net northerly changes in flow of 240 MW between New South Wales and
Queensland (that is, reduced exports from Queensland), 301 MW from Victoria to New South Wales, and
227 MW from Tasmania to Victoria as higher renewable generation in the southern states displaced some
generation in the northern states.
Figure 43 Increased flows from Tasmania and Victoria
Quarterly inter-regional transfers
-5
0
5
10
15
20
Jul-
20
Aug
-20
Sep
-20
Oct
-20
No
v-20
Dec-
20
Jan-2
1
Feb
-21
Mar-
21
Ap
r-21
May-2
1
Jun-2
1
Jul-
21
Aug
-21
Sep
-21
Reven
ue/c
ost
($m
illio
n)
Energy (price $0 and $300/MWh) Energy cap (price > $300/MWh) Energy cost
Charge (negative prices) Contingency FCAS Net Revenue
-800
-600
-400
-200
0
200
400
600
NSW -
QLD V
IC -
NSW
VIC -
SA
TA
S -
VIC
Avera
ge f
low
s (M
W)
QLD
NSW
NSW
VIC
SA
VIC
VIC
TAS
Q3 20
Q2 21
Q3 21
Net
© AEMO 2021 | Quarterly Energy Dynamics Q3 2021 28
Key outcomes by regional interconnector included:
• Queensland to New South Wales – net exports from Queensland were slightly lower than in Q2 2021
(-40 MW) and well below Q3 2020 levels (-240 MW), due to higher operational demand in Queensland.
As in Q2 2021, ongoing transmission outage work related to the upgrade of QNI reduced flow limits on
the interconnector. Constraints related to these outages drove several episodes of FCAS and energy price
volatility in Queensland and also resulted in large negative settlement residues.
• Victoria to New South Wales – northerly flows from Victoria continued to increase with New South
Wales importing less energy on QNI and significant increases in renewable generation in the southern
NEM regions (Sections 1.3.3 and 1.3.4). Interconnector limits remained similar to recent quarters, and with
higher northward flows, time binding at limits of 36% was well above the 30% level of Q3 2020.
• Tasmania to Victoria (Basslink) – exports from Tasmania were well up on Q3 2020 (+227 MW) with
increased hydro generation driven by improved rainfall and dam levels. Basslink export limits to Victoria
were on average 75 MW higher than in Q3 2020 but the increased export flows meant that time binding
at limits also increased from 53% to 63% in Q3 2021.
• Victoria to South Australia – net flows were close to balanced at 32 MW from Victoria to South
Australia, compared to 103 MW net from SA to Victoria in Q3 2020. Increased wind and solar output in
Victoria contributed to this reversal of net flows. Time binding at interconnector limits of 18% was
comparable with past levels.
1.4.1 Inter-regional settlement residue
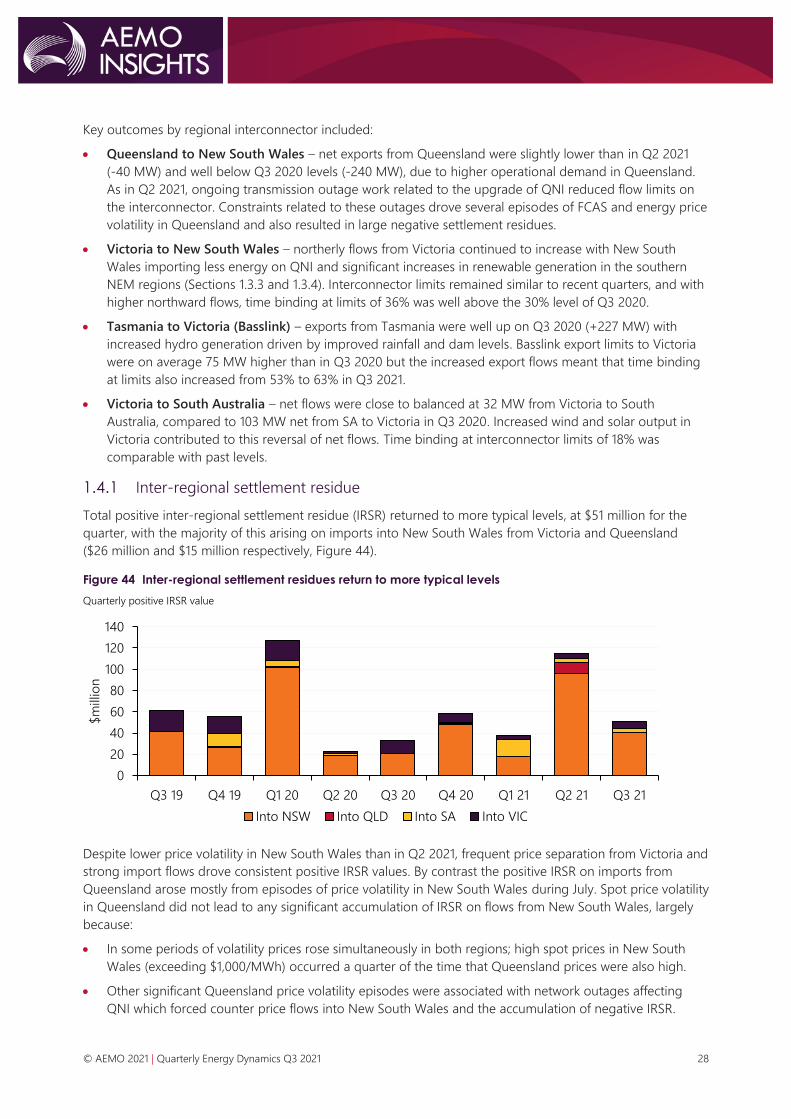
Total positive inter-regional settlement residue (IRSR) returned to more typical levels, at $51 million for the
quarter, with the majority of this arising on imports into New South Wales from Victoria and Queensland
($26 million and $15 million respectively, Figure 44).
Figure 44 Inter-regional settlement residues return to more typical levels
Quarterly positive IRSR value
Despite lower price volatility in New South Wales than in Q2 2021, frequent price separation from Victoria and
strong import flows drove consistent positive IRSR values. By contrast the positive IRSR on imports from
Queensland arose mostly from episodes of price volatility in New South Wales during July. Spot price volatility
in Queensland did not lead to any significant accumulation of IRSR on flows from New South Wales, largely
because:
• In some periods of volatility prices rose simultaneously in both regions; high spot prices in New South
Wales (exceeding $1,000/MWh) occurred a quarter of the time that Queensland prices were also high.
• Other significant Queensland price volatility episodes were associated with network outages affecting
QNI which forced counter price flows into New South Wales and the accumulation of negative IRSR.
0
20
40
60
80
100
120
140
Q3 19 Q4 19 Q1 20 Q2 20 Q3 20 Q4 20 Q1 21 Q2 21 Q3 21
$m
illio
n
Into NSW Into QLD Into SA Into VIC

© AEMO 2021 | Quarterly Energy Dynamics Q3 2021 29
Negative residue management
As in Q2 2021, negative settlement residues totalling $13 million in Q3 2021 were well above historic levels
(Figure 45), driven predominantly by periods of counter price flow on QNI and high spot prices in
Queensland arising from network outage constraints. These constraints were also associated with very high
Queensland FCAS costs discussed in Section 1.5.1.
Negative residue management (NRM) constraints again operated to limit counter price flows and the
accumulation of negative residues on QNI, binding for 1.2% of dispatch intervals for the quarter (1.8% in
Q2 2021). However, in 39% of these binding intervals the NRM constraint violated which meant that it could
not be satisfied due to system security requirements, contributing to the high level of negative residues.
Figure 45 High negative residues again driven by counter price flows from Queensland to NSW
Quarterly negative inter-regional settlement residue
1.5 Power system management
Total NEM system costs27 of $171 million were slightly higher than Q2 2021 (+$13 million) and substantially
above Q3 2020 (+$116 million), with FCAS costs the major contributor as in Q2 (Figure 46).
• FCAS costs decreased slightly from Q2 2021 to $130 million this quarter but were $95 million above
Q3 2020 and represented 76% of quarterly system costs. Section 1.5.1 provides details on FCAS.
• Lower spot prices meant that more frequent direction of South Australian synchronous units was required
to maintain system strength, with the cost of directions increasing by $17 million compared to Q3 2020.
Section 1.5.2 provides details on system security directions.
• Estimated costs of VRE curtailment28 increased by $5 million from Q3 2020 due to greater curtailment
impacts from system strength and network constraints. Section 1.5.3 covers VRE curtailment for the
quarter in detail.
27 In this report, ‘NEM system costs’ refers to costs associated with market ancillary services ie FCAS, as well as directions compensation, Reliability and
Emergency Trader (RERT), and curtailment. For more information on Non-market ancillary services (NMAS) costs, see https://aemo.com.au/-
/media/files/electricity/nem/data/ancillary_services/2021/nmas-cost-and-quantities-report-2020-21.pdf?la=en
28 Excludes economic curtailment. The cost of curtailed VRE output is estimated to be $40/MWh of output curtailed.
-15
-10
-5
0
Q3 19 Q4 19 Q1 20 Q2 20 Q3 20 Q4 20 Q1 21 Q2 21 Q3 21
$m
illio
n
Into NSW Into QLD Into SA Into VIC

© AEMO 2021 | Quarterly Energy Dynamics Q3 2021 30
Figure 46 FCAS the main driver of elevated NEM system costs
Quarterly system costs by category
1.5.1 Frequency control ancillary services
FCAS costs of $130 million moderated slightly from Q2 2021 but were still well above those in the preceding
four quarters, with Queensland costs of $85 million remaining the key driver (Figure 47). Of the $95 million
increase in quarterly costs since Q3 2020, $74 million (or 78%) was in Queensland. By market, 77% of the cost
increase (+$72.9 million) was in the Contingency Raise FCAS category. Although newer technologies including
batteries, demand response (DR), and virtual power plant (VPP) aggregators continued to increase their levels
of FCAS supply (Figure 48), FCAS prices and costs outside Queensland were also up on those of one year
ago, in part reflecting their correlation with energy prices for some FCAS services.
Figure 47 Queensland the main contributor to high FCAS costs
Quarterly FCAS cost by region29
29 Based on AEMO Settlement data and represents preliminary data that will be subject to minor revisions. In this edition of the QED daily settlement data
has been used whereas previous editions used weekly data. This adjustment results in small changes to previously reported quarterly totals.
0
50
100
150
200
250
300
350
Q3 Q4 Q1 Q2 Q3 Q4 Q1 Q2 Q3
2019 2020 2021
$m
illio
n
FCAS RERT Directions Curtailment
0
50
100
150
200
250
Q4 19 Q1 20 Q2 20 Q3 20 Q4 20 Q1 21 Q2 21 Q3 21
To
tal C
ost
($m
)
NSW QLD SA VIC TAS
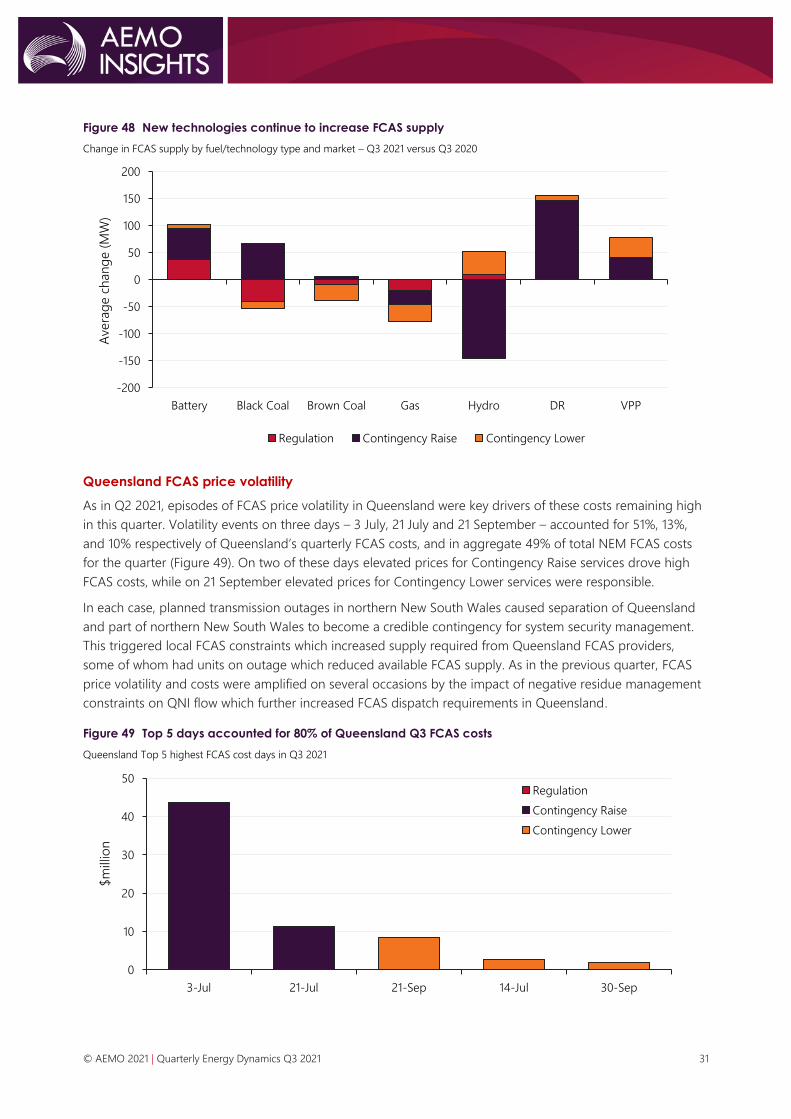
© AEMO 2021 | Quarterly Energy Dynamics Q3 2021 31
Figure 48 New technologies continue to increase FCAS supply
Change in FCAS supply by fuel/technology type and market – Q3 2021 versus Q3 2020
Queensland FCAS price volatility
As in Q2 2021, episodes of FCAS price volatility in Queensland were key drivers of these costs remaining high
in this quarter. Volatility events on three days – 3 July, 21 July and 21 September – accounted for 51%, 13%,
and 10% respectively of Queensland’s quarterly FCAS costs, and in aggregate 49% of total NEM FCAS costs
for the quarter (Figure 49). On two of these days elevated prices for Contingency Raise services drove high
FCAS costs, while on 21 September elevated prices for Contingency Lower services were responsible.
In each case, planned transmission outages in northern New South Wales caused separation of Queensland
and part of northern New South Wales to become a credible contingency for system security management.
This triggered local FCAS constraints which increased supply required from Queensland FCAS providers,
some of whom had units on outage which reduced available FCAS supply. As in the previous quarter, FCAS
price volatility and costs were amplified on several occasions by the impact of negative residue management
constraints on QNI flow which further increased FCAS dispatch requirements in Queensland.
Figure 49 Top 5 days accounted for 80% of Queensland Q3 FCAS costs
Queensland Top 5 highest FCAS cost days in Q3 2021
-200
-150
-100
-50
0
50
100
150
200
Battery Black Coal Brown Coal Gas Hydro DR VPP
Avera
ge c
han
ge (
MW
)
Regulation Contingency Raise Contingency Lower
0
10
20
30
40
50
3-Jul 21-Jul 21-Sep 14-Jul 30-Sep
$m
illio
n
Regulation
Contingency Raise
Contingency Lower

© AEMO 2021 | Quarterly Energy Dynamics Q3 2021 32
1.5.2 Directions
During Q3 2021, AEMO continued to issue directions to GPGs in South Australia to maintain system security in
the region, with total South Australian direction costs for energy increasing to $24 million, the region’s
highest quarterly costs on record. The significant increase was largely due to higher time on direction,
increasing from 30% of the time in Q2 2021 to 51% this quarter (Figure 50), with a quarterly record 148
directions issued.
While installation of the four new synchronous condensers at Davenport and Robertstown in South Australia
was completed in September 2021, its impact on directions for South Australian GPGs this quarter remained
unchanged, as those units were still undergoing testing and monitoring. Following successful monitoring,
AEMO will transition from required continuous operation of four to a minimum of two gas-fired units to
ensure power system security30.
In South Australia, the key driver of increased time on direction this quarter was the reduction in spot prices
(particularly in September), influenced by the combination of high local wind output (Section 1.3.4), low
operational demand and high gas prices impacting GPG running costs. With Adelaide’s spot gas prices
averaging $11.5/GJ and electricity prices below $30/MWh 39% of the time, GPGs were frequently
decommitting from the market for economic reasons. Increased time on direction also meant that the
proportion of South Australian GPG output directed increased to 16% this quarter, up from 7% in Q2 2021.
While the average 12-month 90th percentile spot price (used as a benchmark for compensating participants)
has increased to $97/MWh from $71/MWh in Q2 2021, the rising South Australian gas prices meant that
AEMO received 51 additional claims during the quarter31, accounting for 17% of total costs.
Figure 50 South Australian direction costs reached record highs
Time and cost of system security directions (energy only) in South Australia
Note: direction costs are preliminary costs which are subject to revision.
30 While no changes to generator combinations were made during the quarter, AEMO has increased non-synchronous limit to 1,900 MW in the region from
10 September 2021, 1000 hrs, which applies under system normal conditions. Please see Market Notice 90305 for more information.
31 As these additional compensation claims are processed, final direction costs are likely to be higher than the preliminary costs published in the report.
Additional claims that require independent expert may take up to 30 weeks to finalise.
0%
10%
20%
30%
40%
50%
60%
70%
80%
0
5
10
15
20
25
30
Q4 19 Q1 20 Q2 20 Q3 20 Q4 20 Q1 21 Q2 21 Q3 21
Tim
e (
%)
Co
st (
$m
)
SA Direction cost [LHS] SA Direction time [RHS]

© AEMO 2021 | Quarterly Energy Dynamics Q3 2021 33
1.5.3 VRE curtailment
During the quarter, average VRE curtailment rose to a record high 351 MW, or 9% of potential
semi-scheduled output (Figure 51), compared to 4% of potential output in Q2 2021 and 6% in Q3 2020, with
curtailment growing in all mainland NEM regions (Figure 52). In absolute terms more wind (205 MW) was
curtailed than grid-scale solar (146 MW), but relative to potential output for each technology, grid-scale solar
curtailment at 14% was more than double that of wind at 7%.
Figure 51 VRE curtailments rise to record levels
Average NEM VRE curtailed by curtailment type32
Key drivers included:
• Economic curtailment – with strong growth in VRE output, seasonally lower demands in Q3, record
frequency of negative spot prices and the increasing responsiveness of wind and solar farms to market
price outcomes, economic curtailment rose from 53 MW in Q2 2021 to 168 MW this quarter, with the
largest increases in Victoria (+44 MW) and South Australia (+39 MW).
• System strength – in South Australia, delays in commissioning of synchronous condensers (originally
expected to be operational in Q2 2021), coupled with very windy Q3 conditions, contributed to significant
levels of curtailment (62 MW, up from 36 MW in Q3 2020). Although progress on commissioning the
synchronous condensers allowed a significant increase in the nominal limit on non-synchronous South
Australian generation from 10 September, unrelated transmission outages in the state required the
effective continuation of the previous limits for much of the balance of quarter. In Victoria and New South
Wales, system strength constraints related to transmission outages in the West Murray region led to
average curtailment of 38 MW over the quarter.
• Other curtailment – growth in output at recently commissioned solar farms in New South Wales led to
more significant curtailment impacts from network constraints in that state, up to 31 MW from 5 MW in
Q2, with smaller increases to other network-related curtailment in South Australia and Queensland.
32 Curtailment amount is based on combination of market data and AEMO estimates. For more information on the calculation:
www.wattclarity.com.au/articles/2020/06/not-as-simple-as-it-appears-estimating-curtailment-of-renewable-generation/?utm_source
=rss&utm_medium=rss&utm_campaign=not-as-simple-as-it-appears-estimating-curtailment-of-renewable-generation.
0
50
100
150
200
250
300
350
400
Q3 19 Q4 19 Q1 20 Q2 20 Q3 20 Q4 20 Q1 21 Q2 21 Q3 21
Avera
ge c
urt
aile
d (
MW
)
System strength Other Solar Separation Economic

© AEMO 2021 | Quarterly Energy Dynamics Q3 2021 34
Figure 52 Curtailment up significantly in all mainland NEM regions
% VRE curtailed by NEM region
Curtailment during periods of high renewable output (including distributed PV production) and/or adverse
market conditions can be much larger than average values. For example:
• On 24 September when instantaneous NEM renewable penetration reached a record level, over
2,600 MW of semi-scheduled renewable production was being curtailed at the time of maximum output
(Figure 53).
• Economic self-curtailment driven by high FCAS costs rather than low energy prices again featured in
Queensland during the quarter. On 3 July when there was extended volatility in prices for the Raise 6
Second and Raise 60 Second Contingency FCAS services, a high proportion of wind and solar generators
rebid to reduce their output and minimise exposure to Raise costs which are recovered from online
generators. Over the most volatile period of the day, up to 80% of potential semi-scheduled output was
self-curtailed (Figure 54).
Figure 53 Over 2,600 MW of VRE curtailed at the
interval of maximum penetration
Renewables generation and estimated VRE curtailment – 24
September 2021
Figure 54 Qld VRE curtails to avoid high
Contingency Raise FCAS costs
% Qld VRE curtailed vs Raise 6 Second FCAS price – 3 July 2021
0%
5%
10%
15%
20%
Q1 Q2 Q3 Q4 Q1 Q2 Q3 Q4 Q1 Q2 Q3
2019 2020 2021
% c
urt
aile
d
NSW QLD SA TAS VIC
0
4,000
8,000
12,000
16,000
20,000
0:3
0
2:3
0
4:3
0
6:3
0
8:3
0
10:3
0
12:3
0
14:3
0
16:3
0
18:3
0
20:3
0
22:3
0
MW
Renewables generation Wind curtailment
Grid-solar curtailment
0
2,000
4,000
6,000
8,000
10,000
12,000
14,000
16,000
0%
20%
40%
60%
80%
100%
7:0
0
8:0
0
9:0
0
10:0
0
11:0
0
12:0
0
13:0
0
14:0
0
15:0
0
16:0
0
17:0
0
18:0
0
$/M
Wh
% c
urt
aile
d
QLD VRE Curtailed [LHS]
QLD Raise 6 Second price [RHS]

© AEMO 2021 | Quarterly Energy Dynamics Q3 2021 35
2. Gas market dynamics 2.1 Gas demand
Total east coast gas demand increased by 5% compared to Q3 2020 driven by increased Queensland LNG
demand (+32 petajoules [PJ], Figure 55) which was offset by reduced GPG and domestic demand.
Figure 55 Increased gas demand driven by LNG exports
Change in east coast gas demand – Q3 2021 vs Q3 202033
Queensland LNG exports continue to be influenced by strong Asian LNG demand and record high
international gas prices (Section 2.2.3). Demand for Queensland LNG is usually lower in the northern
hemisphere summer but Q3 2021 demand was the highest Q3 on record, and the fourth highest quarter on
record. Year to date demand has totalled 1,038 PJ, the first time demand has exceeded 1,000 PJ in the first
three quarters of the calendar year and is tracking 62 PJ higher than the previous record in 2019.
By participant, Gladstone Liquified Natural Gas (GLNG) recorded the largest increase of 27.7 PJ, while
Queensland Curtis LNG (QCLNG) increased by 2.4 PJ, and Australia Pacific LNG (APLNG) increased by 2.1 PJ
(Figure 56).
Figure 56 GLNG drives record Q3 flows to Curtis Island for LNG export
Total quarterly pipeline flows to Curtis Island
33 AEMO Markets demand is the sum of customer demand in each of the Short Term Trading Market (STTM) and the Declared Wholesale Gas Market
(DWGM) and excludes GPG in these markets. GPG includes demand for GPG usually captured as part of total DWGM and STTM demand. Excludes Yabulu
Power Station.
0
100
200
300
400
Q1 Q2 Q3 Q4 Q1 Q2 Q3 Q4 Q1 Q2 Q3 Q4 Q1 Q2 Q3 Q4 Q1 Q2 Q3 Q4 Q1 Q2 Q3
2016 2017 2018 2019 2020 2021
PJ
APLNG GLNG QCLNG

© AEMO 2021 | Quarterly Energy Dynamics Q3 2021 36
During Q3 there were 87 LNG cargoes exported, up from 78 in Q3 2020. GLNG increased from 21 to 29
cargoes, QCLNG increased from 28 to 29, while APLNG remained steady also at 29.
GPG demand decreased by 19% compared to Q3 2020, with reductions in every state except New South
Wales. Drivers for reduced GPG are discussed in Section 1.3.2.
2.2 Wholesale gas prices
Quarterly average prices were at record levels across all east coast gas markets, averaging $10.74/gigajoule
(GJ) compared to $4.47/GJ in Q3 2020 (Table 3). It is the first time every market has averaged over $10/GJ.
Table 3 Gas prices – quarterly comparison
Price ($/GJ) Q3 2021 Q3 2020 Change from Q3 2020
DWGM 10.05 4.57 +120%
Adelaide 11.51 5.41 +113%
Brisbane 10.65 4.17 +155%
Sydney 11.16 4.37 +156%
GSH 10.33 3.85 +169%
Prices in July were significantly higher than August and September, due to a partial outage of the Longford
Gas Plant from 29 June, reducing supply during the coldest part of winter. This was exacerbated by high
demand for LNG and GPG and record low storage levels at Iona for that stage of winter (Figure 57). Following
the return of Longford on 18 July and with mild weather in August reducing demand, Iona storage was able
to start refilling and market prices fell in all regions and did not exceed $10/GJ during August and September.
Figure 57 Rapid Iona emptying and reduced Longford supply in July contributes to price spikes
0
5
10
15
20
25
30
35
40
0
200
400
600
800
1,000
1,200
1,400
$/G
J
TJ/
d
Longford [LHS] Iona emptying [LHS] Iona refilling [LHS] DWGM (6am)

© AEMO 2021 | Quarterly Energy Dynamics Q3 2021 37
2.2.1 Wholesale gas price volatility
Every market recorded significant spikes in prices during the first half of July, and after a 48% increase from
June, the average market price peaked in July at a record $15.61/GJ (Figure 58). The main drivers of these high
prices are discussed in Section 2.2.2. Key price events include:
• Adelaide Short Term Trading Market (STTM) hit an all-time high $28.01/GJ on 10 July.
• Sydney and Brisbane STTM’s recorded their second highest prices since market start, $27.56/GJ on 7 July
and $20.08/GJ on 8 July respectively.
• The Declared Wholesale Gas Market (DWGM) in Victoria recorded a 1000 hrs price of $58.44/GJ on 9 July,
the third highest price since market start and the highest non 2200 hrs price. The 0600 hrs price on 9 July
of $34.84/GJ was the fourth highest 0600 hrs price on record.
• The Gas Supply Hub (GSH) recorded 70 trades above the previous record price of $16.50/GJ in a
one-week span between 5 July and 11 July, peaking at $27.49/GJ.
Figure 58 Domestic prices fall in August despite increasing international prices
ACCC netback and GSH average gas price by month34
August saw the average market price decrease to $8.41/GJ (a 46% decrease), and this further decreased to
$8.09/GJ in September. A reduction in market demand, combined with an increase in supply, predominantly
from Longford, and Iona storage levels increasing, led participants to bid at lower levels (Figure 59). This was
despite international prices as represented by the Australian Competition and Consumer Commission (ACCC)
netback price increasing during the quarter.
Figure 59 DWGM bids driving record prices in July 2021
DWGM – proportion of marginal bids by price band
34 ACCC LNG netback series: https://www.accc.gov.au/regulated-infrastructure/energy/gas-inquiry-2017-2025/lng-netback-price-series
0
5
10
15
20
25
Jan-2
0
Feb
-20
Mar-
20
Ap
r-20
May-2
0
Jun-2
0
Jul-
20
Aug
-20
Sep
-20
Oct
-20
No
v-20
Dec-
20
Jan-2
1
Feb
-21
Mar-
21
Ap
r-21
May-2
1
Jun-2
1
Jul-
21
Aug
-21
Sep
-21
$/G
J
GSH ACCC
0%
20%
40%
60%
80%
100%
Q3 2020 Apr-21 May-21 Jun-21 Jul-21 Aug-21 Sep-21
Pro
po
rtio
n o
f m
arg
inal b
ids
$4-7/GJ $7-9/GJ $9-11/GJ $11-14/GJ $14-20/GJ

© AEMO 2021 | Quarterly Energy Dynamics Q3 2021 38
2.2.2 High DWGM prices - 9 July 2021
The week beginning Monday 5 July saw DWGM demand increasing, driven by cold temperatures, lower wind
generation and higher GPG demand. Longford capacity was reduced from 29 June by up to 130 terajoules
(TJ)/day due to an unplanned outage. As demand increased during the week, and with Longford output
limited greater reliance was placed on Iona storage which was operating at seasonally low levels. This resulted
in a substantial shift in participant bidding behaviour, with more volume moved from prices between
$7-$17/GJ to higher price bands, particularly at Iona, creating a steeper supply curve (Figure 60).
Demand for the week peaked on 9 July with Melbourne experiencing a minimum temperature of near zero in
many suburbs, and a maximum of 12oC. The demand forecast began the day around 1.1 PJ and the
combination of high demand and participant bidding saw a price of $34.84/GJ at beginning of day.
At the 1000 hrs schedule the price further increased to $58.44/GJ due to an increase in the demand forecast
and the very steep bid curve. The demand increase was due to a combination of higher forecast GPG and a
very cold morning reducing linepack. With Longford at capacity, Culcairn unable to increase flows further and
a very steep bid stack at Iona, the price was set by VicHub redirecting gas from the Eastern Gas Pipeline (EGP)
into Victoria.
Figure 60 Significant change in Iona offer prices contributes to higher July prices
Participant offers to supply gas into DWGM from Iona
0
5
10
15
20
25
30
35
40
0
100
200
300
400
500
600
700
1-Jul 2-Jul 3-Jul 4-Jul 5-Jul 6-Jul 7-Jul 8-Jul 9-Jul 10-Jul 11-Jul 12-Jul 13-Jul 14-Jul 15-Jul
$/G
J
TJ
=$0/GJ $0-9/GJ $9-17/GJ $17-25/GJ $25-35/GJ
$35-60/GJ $60-800/GJ Injected 6am Price

© AEMO 2021 | Quarterly Energy Dynamics Q3 2021 39
2.2.3 International energy prices
International energy prices rallied to new records or yearly highs, as a global energy crisis emerged35 driven
by sustained global demand recovery, low levels of storage and supply disruptions.
Japan Korea Marker (JKM) LNG prices continued trending up, from A$17/GJ at the end of the previous quarter
to finish Q3 at a record A$41/GJ, averaging A$23/GJ for the quarter (Figure 61). Key drivers included ongoing
refilling of gas storages, which were at multi year lows in Europe and Asia, ahead of the northern hemisphere
winter, coupled with adverse weather and maintenance supply disruptions36.
Figure 61 JKM record rally continues
Japan Korea Marker (JKM) in A$/GJ
Source: Bloomberg data in 14-day averages
Brent Crude oil prices increased to pre covid levels at A$109/barrel by the end of Q3, averaging A$10/barrel
higher than Q2 2021 at A$100/barrel this quarter (Figure 62). Key drivers include, global oil demand recovery
and an energy commodities rally, balanced by the Organisation of the Petroleum Exporting Countries
(OPEC37) planned month by month production increase.
Thermal coal export prices continued to rally this quarter to a new A$269/tonne record, A$88/tonne higher
than the Q2 2021 maximum price (Figure 63). Drivers included, continued strong Asian demand from warmer
than usual weather, higher post pandemic industrial demand coupled with supply disruptions38.
Figure 62 Late increase in Brent Crude oil
Brent Crude oil in A$/barrel
Figure 63 Record thermal coal price continue
Newcastle export thermal coal prices in A$/tonne
Source: Bloomberg data in 14-day averages
35 Reuters 2021, On the cusp of Europe’s winter season, gas storages hits 10-yr low: https://www.reuters.com/business/energy/cusp-europes-winter-season-
gas-storage-hits-10-yr-low-2021-09-22/
36 SPglobal 2021,: JKM hits record high: https://www.spglobal.com/platts/en/market-insights/latest-news/lng/093021-jkm-lng-benchmark-hits-record-high-
on-global-gas-supply-tightness-winter-demand
37 OPEC 2021, 19th OPEC and non-OPEC Ministerial Meeting concludes: https://www.opec.org/opec_web/en/press_room/6512.htm
38 Reuters 2021, Asia’s coal prices hit new highs: https://www.reuters.com/world/china/asias-coal-prices-hit-new-highs-global-utilities-scramble-fuel-2021-
09-07/
$0
$10
$20
$30
$40
JKM
(A
UD
/GJ)
$0
$20
$40
$60
$80
$100
$120
Bre
nt
(AU
D/B
arr
el)
$0
$50
$100
$150
$200
$250
$300
AU
D/T
on
ne

© AEMO 2021 | Quarterly Energy Dynamics Q3 2021 40
2.3 Gas supply
2.3.1 Gas production
East coast gas production increased by 21.4 PJ compared to Q3 2020 (+7%, Figure 64) with key changes
including:
• Increased Queensland production, particularly GLNG (+12.1 PJ), with smaller increases from QCLNG (+2.5
PJ) and APLNG (+1.9 PJ), to meet continuing increased demand for LNG export. GLNG saw a large
increase from Roma Compressor Station (+10 PJ) and Arcadia (+5 PJ), despite a decrease from Fairview
(-3.5 PJ). APLNG increased despite a planned single train outage occurring from 28 July to 24 August.
• Higher Longford production (+5.3 PJ), assisted by the commissioning of the West Barracouta gas field
during April. Despite the outage in early July Longford’s capacity factor was 96% for the quarter, the
highest since 98% in Q3 2017 (Figure 65). During the July outage plant capacity fell from 980 TJ/d to as
low as 830 TJ/d in the first week of July, before recovering to 985 TJ by 18 July.
Figure 64 East coast gas production up 7%
Change in east coast gas supply – Q3 2021 versus Q3 2020
Figure 65 Highest Longford capacity factor since 2017
Longford production and capacity by quarter
-2
0
2
4
6
8
10
12
14
NGP Longford Otway Moomba Bass Gas Orbost APLNG GLNG QCLNG Other*
Non-QLD QLD
PJ
0
20
40
60
80
100
120
Q1 Q2 Q3 Q4 Q1 Q2 Q3 Q4 Q1 Q2 Q3 Q4 Q1 Q2 Q3 Q4 Q1 Q2 Q3
2017 2018 2019 2020 2021
PJ
Longford Production Unutilised Capacity

© AEMO 2021 | Quarterly Energy Dynamics Q3 2021 41
2.3.2 Gas storage
Iona began the quarter at its lowest storage levels for 1 July since storage levels were reported in October
2016. This rapid emptying continued into July, with Iona heavily utilised because of the Longford outage, cold
weather, and high GPG and LNG demand.
While demand was too high for much of July to enable refilling, Iona was unable to refill with gas from the
market for much of the month due to an outage on 24 June to remove a leaking section of piping that
prevented withdrawing gas from the South West Pipeline (SWP). A subsequent outage occurred on 31 July to
repair the piping, and refilling with gas from the SWP was possible again after that. With the plant repaired,
Iona was able to refill during August, due to a combination of decreased domestic demand with milder
weather, lower GPG demand, higher Longford production, and an increase in gas flowing south from
Queensland. Iona finished the quarter with a gas balance of 11.7 PJ, 3.9 PJ lower than Q3 2020 (Figure 66).
Figure 66 Iona storage drops to record winter low before recovering
Iona storage levels
2.4 Pipeline flows
Compared to Q3 2020, there was a 12 PJ reduction on net transfers on the South West Queensland Pipeline
(SWQP). While the net flow for the quarter was south from Queensland, of note, 3.7 PJ flowed north from
Moomba back towards Queensland in September, driven by the increase in Queensland LNG export demand
and coinciding with the rise in international prices (Figure 67). While this is usual during the shoulder season
and summer months, it is the earliest gas has flowed north back to Queensland since Queensland LNG
exports began.
Figure 67 Large reduction in gas flows south from Queensland
Flows on the South West Queensland Pipeline at Moomba
8
13
18
23
1-Jan 1-Feb 1-Mar 1-Apr 1-May 1-Jun 1-Jul 1-Aug 1-Sep 1-Oct 1-Nov 1-Dec
PJ
2017 2018 2019 2020 2021
-30
-20
-10
0
10
20
30
Q1 Q2 Q3 Q4 Q1 Q2 Q3 Q4 Q1 Q2 Q3 Q4 Q1 Q2 Q3 Q4 Q1 Q2 Q3
2017 2018 2019 2020 2021
PJ
North at Moomba South at Moomba Sum of Net

© AEMO 2021 | Quarterly Energy Dynamics Q3 2021 42
Victorian net gas transfers to other states increased by 9.7 PJ compared to Q3 2020, due to increased
Victorian supply and lower heating and GPG demand in August and September (Figure 68). Compared to Q3
2020, there were increased flows from Victoria to New South Wales. Victoria imported 1 PJ from New South
Wales via Culcairn, compared to importing 8.5 PJ in Q3 2020. Exports to New South Wales via the EGP
increased by 1.8 PJ. Flows from Victoria to South Australia decreased by 1.5 PJ, mostly due to lower GPG
demand.
Figure 68 Victorian Q3 gas transfers to New South Wales highest since 2017
Victorian net gas transfers to other regions
2.5 Gas Supply Hub
In Q3 2021 there were lower trading volumes on the GSH compared to Q3 2020 (Figure 69), with traded
volume down by 0.8 PJ. Delivered volume however increased by 2.6 PJ, a result of higher traded volume in
Q2 2021 for the Q3 delivery period.
As noted in Section 2.2.1, the GSH recorded 70 trades in July above the previous highest ever trade price of
$16.50/GJ, with the highest trade at $27.49/GJ.
Figure 69 Increased deliveries on the GSH compared to 2020
Gas Supply Hub – quarterly trades and deliveries
0
10
20
30
40
50
60
70
Q1 Q2 Q3 Q4 Q1 Q2 Q3 Q4 Q1 Q2 Q3 Q4 Q1 Q2 Q3 Q4 Q1 Q2 Q3
2017 2018 2019 2020 2021
PJ
to NSW to SA to Tas
0
2
4
6
8
10
12
Q1 Q2 Q3 Q4 Q1 Q2 Q3 Q4 Q1 Q2 Q3 Q4 Q1 Q2 Q3 Q4 Q1 Q2 Q3
2017 2018 2019 2020 2021
PJ
Traded Delivered

© AEMO 2021 | Quarterly Energy Dynamics Q3 2021 43
2.6 Pipeline capacity trading and day ahead auction
Day Ahead Auction (DAA) utilisation was 370 TJ lower than the record set in Q2 2021, and 1.1 PJ higher than
Q3 2020 (Figure 70). The largest increases occurred on the EGP (+1.8 PJ), Queensland Gas Pipeline (QGP,
+0.4 PJ) and Roma to Brisbane Pipeline (RBP, +0.4 PJ)
Average auction clearing prices remained at or close to $0/GJ on most pipelines. The exceptions to this were
the EGP which averaged $0.14/GJ, the Moomba to Sydney Pipeline (MSP) which averaged $0.10/GJ, RBP
which averaged $0.04/GJ, and SWQP which averaged $0.03/GJ.
Figure 70 Day Ahead Auction utilisation marginally lower than record Q2 2021
Day Ahead Auction results by quarter
2.7 Gas – Western Australia
Total Western Australian domestic gas consumption during Q3 2021 decreased by 4.7 PJ (-4.7%) from Q3
2020 to 95.3 PJ. The average temperature in Q3 2021 was similar to Q3 2020 resulting in minimal change in
heating related gas consumption. The decrease in gas consumption between the quarters is primarily
attributed to a reduction in consumption for electricity generation and mineral processing (Figure 71):
• Gas consumption for electricity generation decreased by 3.1 PJ (-14.8%) in Q3 2021 as GPG was displaced
by increased availability of coal-fired generation in Q3 2021 (see Section 3.3.1).
• Gas usage for mineral processing decreased by 1.8 PJ (-6.9%) compared to Q3 2020 primarily due to Alcoa
Wagerup alumina processing plant consuming 1.6 PJ less.
Figure 71 Western Australia domestic gas consumption drops 4.7% from Q3 2020
WA quarterly gas consumption by industry
-1
4
9
14
Q1 Q2 Q3 Q4 Q1 Q2 Q3
2020 2021
PJ
WCF RBP SWQP MSP EGP BWP MAPS ICF QGP Vichub
0
20
40
60
80
100
Q3 Q4 Q1 Q2 Q3 Q4 Q1 Q2 Q3
2019 2020 2021
Co
nsu
mp
tio
n (
PJ)
Distribution Electricity Industrial Mineral Processing
Mining Other (Non-Large User) Other Large User

© AEMO 2021 | Quarterly Energy Dynamics Q3 2021 44
Total Western Australian gas supply was 97 PJ, which is 4.1 PJ less (-4.1%) than Q3 2020 (Figure 72) and
decreased in line with changes in total consumption. Compared to Q3 2020, production from Karratha Gas
Plant (KGP) reduced 4 PJ (-58%), which accounts for 98% of the total decrease of gas production.
Figure 72 Western Australia domestic gas production drops 4.1% from Q3 2020
WA quarterly gas consumption by industry
Gas storage facilities had a net injection of 2.7 PJ of gas into the pipelines in Q3 2021, which is a 50% decrease
in net injections from Q2 2021 (Figure 73) and continues a trend of net flows out of storage.
Figure 73 Gas storage facilities continue net injection to meet reduced production
WA gas storage facility injections and withdrawals
0
20
40
60
80
100
120
Q3 Q4 Q1 Q2 Q3 Q4 Q1 Q2 Q3
2019 2020 2021
Pro
du
ctio
n b
y Faci
lity
(PJ)
Devil Creek Gorgon Karratha Gas Plant Macedon Varanus Island Wheatstone Other
-8
-6
-4
-2
0
2
4
6
8
10
12
Q3 Q4 Q1 Q2 Q3 Q4 Q1 Q2 Q3
2019 2020 2021
Sto
rag
e F
low
s (P
J)
Mondarra Filling Mondarra Emptying Tubridgi Filling Tubridgi Emptying Net

© AEMO 2021 | Quarterly Energy Dynamics Q3 2021 45
3. WEM market dynamics 3.1 Electricity demand
Operational demand39 in Q3 2021 increased by 2.5% compared to Q3 2020, increasing from an average of
1,976 MW in Q3 2020 to 2,025 MW in Q3 2021. However, operational demand was lower during the middle of
the day due to increased uptake of distributed PV. An estimated increase of 379 MW of distributed PV
capacity has been installed since Q3 2020 (estimated 1,851 MW total as at 1 September 202140), resulting in
the reduction in operational demand between 1130 hrs and 1500 hrs (Figure 74).
Despite the increase in distributed PV capacity, July 2021 saw a 4% reduction in distributed PV output
compared to July 2020 due to increased cloud cover in July 202141. However, much of this effect was offset by
continued growth in output throughout the rest of the quarter.
Figure 74 Underlying demand increases but higher distributed PV reduces midday operational demand
Change in Q3 2021 WEM-average operational and underlying demand by time of day compared to Q3 2020
3.1.1 New minimum demand record
A new minimum operational demand record was set on Sunday, 5 September 2021 at 1230 hrs. Operational
demand dropped to 866 MW, which is 9% lower than the previous record of 952 MW set on Sunday, 14
March 2021. This was due to sunny, mild temperatures causing low underlying demand42 (2,238 MW).
Distributed PV generated an estimated 1,372 MW during this trading interval, supplying nearly 61% of the
underlying demand. Figure 75 shows that as distributed PV capacity increases, minimum demand continues
to decline, most noticeably during the shoulder seasons.
39 Operational demand is total wholesale generation from registered facilities in the SWIS and is based on non-loss adjusted sent out SCADA data, averaged
over a 30-minute interval.
40 Estimates are based on Clean Energy Regulator small-scale solar data: http://www.cleanenergyregulator.gov.au/RET/Forms-and-resources/Postcode-data-
for-small-scale-installations
41 Monthly mean daily global solar exposure can be found here:
http://www.bom.gov.au/jsp/ncc/cdio/weatherData/av?p_nccObsCode=203&p_display_type=dataFile&p_startYear=&p_c=&p_stn_num=009225
42 Underlying demand is operational demand that has been adjusted to remove the impact of distributed PV output.
-200
-150
-100
-50
0
50
100
150
200
0:00 2:00 4:00 6:00 8:00 10:00 12:00 14:00 16:00 18:00 20:00 22:00
Avera
ge C
han
ge (
MW
)
Distributed PV Impact Underlying Demand Operational Demand

© AEMO 2021 | Quarterly Energy Dynamics Q3 2021 46
Figure 75 Minimum operational demand falls as distributed PV capacity increases
Operational demand and installed distributed PV capacity
3.2 WEM prices
The average Balancing Price in the Wholesale Electricity Market (WEM) for Q3 2021 was $48.69/MWh,
remaining relatively flat compared to Q3 2020 (Figure 76). Average operational demand increased between
the quarters however the effect on the Balancing Price was offset by greater output from lower cost
generators, such as wind and coal-fired generation (see Section 3.3.1), the net effect being a slight increase in
the Balancing Price (+$0.55/MWh).
Figure 76 Average Balancing Price and STEM Price converge, STEM cleared quantity highest since Q419
WEM average Balancing Prices, STEM Prices, and quantity cleared in STEM
The average Short Term Electricity Market (STEM) Price was $48.03/MWh and followed the same trend,
increasing by just $3.14/MWh this quarter compared to Q3 2020. The average STEM Price has been lower
0
250
500
750
1,000
1,250
1,500
0
500
1,000
1,500
2,000
2,500
Q3 Q4 Q1 Q2 Q3 Q4 Q1 Q2 Q3 Q4 Q1 Q2 Q3
2018 2019 2020 2021
Op
era
tio
nal D
em
an
d (
MW
)
Dis
trib
ute
d P
V C
ap
aci
ty (
MW
)
Installed Distributed PV Capacity [LHS] Minimum Operational Demand [RHS]
0
50
100
150
200
250
300
0
10
20
30
40
50
60
70
Q3 Q4 Q1 Q2 Q3 Q4 Q1 Q2 Q3 Q4 Q1 Q2 Q3 Q4 Q1 Q2 Q3
2017 2018 2019 2020 2021
To
tal C
leare
d Q
uan
tiy
(GW
h)
Pri
ce (
$/M
Wh
)
STEM Cleared Quantity [RHS] STEM Price [LHS] Balancing Price [LHS]

© AEMO 2021 | Quarterly Energy Dynamics Q3 2021 47
than the average Balancing Price for every quarter since Q1 2020. This, in conjunction with the greater
quantities cleared in STEM in recent quarters, reflects a greater desire to sell energy in STEM at similar or
lower prices than previous years to hedge against the Balancing Price.
In Q3 2021 the average Balancing Price and STEM Price were close to converging, with the STEM Price only
$0.63/MWh less than the Balancing Price.
The quantity of energy cleared in the STEM was higher this quarter compared to previous Q3s (+1.8% and
+1.4% in 2019 and 2020 respectively), with the total energy cleared making up 5.6% of the total energy traded
in the WEM. This outcome demonstrates that market participants are willing to use the STEM to clear more
energy at prices lower than the historical average.
3.2.1 Negative prices
The number of trading intervals with a negative Balancing Price in Q3 2021 increased from last year (+24) to
7% of all intervals, however, the negative price impact43 compared to Q3 2020 was $0.72/MWh lower (Figure
77). This was driven by the change in distribution of negative prices, with fewer extreme negative prices and
no intervals clearing at the price floor (-$1,000/MWh) this quarter, compared to six price floor events in Q3
2020.
Figure 77 Frequency of negative price events continues to grow in Q3 2021
WEM Q3 count of negative price events by price band and impact
Despite a lower minimum demand, the Balancing Price did not reach the price floor in Q3 2021. The lowest
Balancing Price for the quarter was -$90.94/MWh. This is due to a reduction in energy offered into the
Balancing Market at the price floor in Q3 2021 compared to Q3 last year; an indication of this was an average
of 1,223 MW was priced at -$1,000/MWh per interval, down by 44 MW (-4%) compared to Q3 2020.
3.2.2 High price events
The number of trading intervals with Balancing Prices above $50/MWh increased to approximately 40% of all
intervals in Q3 2021, up by almost 10% from Q3 2020 (Figure 78). The most significant changes were the
increase in the number of intervals with a Balancing Price between $50/MWh and 75/MWh (+12%) and the
decrease in the number of intervals with a Balancing Price between $25/MWh and 50/MWh (-7%). The
decrease in Balancing Prices above $150/MWh is linked to the increase in lower cost coal and wind
generation.
43 Impact of negative prices is a measure of both frequency and magnitude of negative prices. It is defined as the difference in average Balancing Price
caused by negative intervals compared to if the floor price was $0/MWh. It is calculated as the absolute sum of the Balancing Price in all negatively priced
intervals, divided by the total number of intervals.
0
0.5
1
1.5
2
2.5
3
0
50
100
150
200
250
300
350
Q3 2017 Q3 2018 Q3 2019 Q3 2020 Q3 2021
Neg
ative
Pri
ce Im
pact
($/M
Wh
/In
terv
al)
Neg
ative
Pri
ce O
ccu
ren
ce
-$1000/MWh [LHS] -$250 to -$100/MWh [LHS] -$100 to -$50/MWh [LHS]
-$50 to 0/MWh [LHS] Negative Price Impact [RHS]

© AEMO 2021 | Quarterly Energy Dynamics Q3 2021 48
Figure 78 Increased frequency of Balancing Prices above $50/MWh in Q3 2021
WEM Q3 Balancing Price distributions
3.2.3 Price-setting dynamics
Synergy’s Balancing Portfolio currently has a 51.5% market share of Capacity Credits in the WEM and set the
Balancing Price for 62% of trading intervals in Q3 2021, up from 7% in Q3 2020 (Figure 79). This was due to
increased availability from their coal-fired facilities this quarter, in particular MUJA_G7 and MUJA_G8 (+43%
and +50% increased availability, respectively).
Wind and solar set the Balancing Price more frequently compared to Q3 2020, in line with increased capacity
due to facility upgrades and two new wind farms (see Section 3.2.4).
These increases were offset by a reduction from higher cost gas and distillate facilities, which were displaced
by increased quantities offered by lower cost coal, wind and solar facilities.
Figure 79 Higher coal availability contributes to an increased price-setting role in the Balancing Market
Price-setting by Balancing Portfolio and fuel type of non-Balancing Portfolio Facilities
0%
20%
40%
60%
80%
100%
Q3 2017 Q3 2018 Q3 2019 Q3 2020 Q3 2021
Pro
po
rtio
n o
f in
terv
als
<$0/MWh $0 to $25/MWh $25 to $50/MWh $50 to$75/MWh
$75 to $100/MWh $100 to $150/MWh ≥$150/MWh
0
10
20
30
40
50
60
70
0%
10%
20%
30%
40%
50%
60%
70%
80%
90%
100%
Q3 Q4 Q1 Q2 Q3 Q4 Q1 Q2 Q3
2019 2020 2021
Avera
ge B
ala
nci
ng
Pri
ce (
$/M
Wh
)
Perc
en
tag
e o
f tim
e
Balancing Portfolio [LHS] Coal [LHS] Gas and Distillate [LHS]
Wind and Solar [LHS] Landfill Gas and Biomass [LHS] Balancing Price [RHS]

© AEMO 2021 | Quarterly Energy Dynamics Q3 2021 49
3.2.4 Reserve Capacity Mechanism
The end of Q3 2021 marks the close of the 2020-21 Capacity Year, and the commencement of the 2021-22
Capacity Year. In 2021-22 fundamental changes to the Reserve Capacity Mechanism will commence, further
information can be found in the WEM Electricity Statement of Opportunities44. Changes in Capacity Credit
assignment between Capacity Years include:
• 2020-21 Capacity Year – two new Facilities (Warradarge Wind Farm and Yandin Wind Farm) and two
upgrades to existing facilities (Badgingarra Wind Farm and Greenough River Solar Farm) came online,
adding 92 MW of Capacity Credits.
• 2021-22 Capacity Year – one new Facility was assigned 33 MW of Capacity Credits (Kwinana Waste to
Energy). This facility was the first waste-to-energy generator assigned Capacity Credits in the WEM.
3.3 Electricity generation
3.3.1 Change in fuel mix
Compared to Q3 2020, the increase in availability from coal-fired generators and increased output from wind,
solar and distributed PV in Q3 2021 resulted in a decrease in GPG across all times of the day (Figure 80).
Figure 80 Solar, wind and coal displace GPG output across all times of the day
Average change in WEM generation – Q3 2021 vs Q3 2020
Key shifts by fuel type compared to Q3 2020 include:
• Coal-fired generation increased by an average of 92 MW (+11%). This increase is attributed to a 7%
increase in the overall availability of coal generators in Q3 2021 due to Muja G7 and G8 returning from
outage.
44 Available at: https://aemo.com.au/en/energy-systems/electricity/wholesale-electricity-market-wem/wem-forecasting-and-planning/wem-electricity-
statement-of-opportunities-wem-esoo
-300
-200
-100
0
100
200
300
400
00:00 02:00 04:00 06:00 08:00 10:00 12:00 14:00 16:00 18:00 20:00 22:00
Avera
ge C
han
ge (
MW
)
Gas and Distillate Coal Wind Grid Solar Distributed PV Other

© AEMO 2021 | Quarterly Energy Dynamics Q3 2021 50
• Wind generation increased by an average of 103 MW (+36%). The additional output from Yandin Wind
Farm was the driving factor behind the increase. The WEM’s volume weighted capacity factor for wind
also increased to 38% compared to 33% in the same quarter last year45.
• Grid-scale solar increased by an average 15 MW (+89%) in Q3 2021. This increase can be attributed to
the additional output from Greenough River Solar Farm’s expansion in August 2020, which increased the
solar farm’s capacity to 40 MW (up from 10 MW).
• Distributed PV output increased by an average of 26 MW (+13%) compared to Q3 2020. This increase is
due to the estimated 379 MW of additional distributed PV capacity in the SWIS since Q3 2020.
• GPG decreased by 164 MW (-20%) as it was displaced by lower cost generation.
3.3.2 Renewable generation records
A record amount of instantaneous output was provided by renewable generators in Q3 2021. On
7 September at 1210 hrs, renewable generation supplied 70% of the underlying demand. The previous record
was set on 13 March 2021 at 1320 hrs, with renewable generators supplying 65% of underlying demand.
In Q3 2021 approximately 25% of total underlying demand was met by renewable generators. This was an
increase of more than 4% compared to Q3 last year and 14% on Q3 2016 (Figure 81).
Figure 81 Renewable energy meets a record share of underlying demand in the WEM
Q3 renewable energy share
3.3.3 Emissions intensity of the WEM
Emissions from registered facilities in the WEM in Q3 2021 is estimated at 2.64 MtCO2-e, equating to a 1%
reduction in carbon dioxide equivalent emissions compared to Q3 2020 and a 21% reduction from Q3 201646
(Figure 82). The emissions intensity of electricity produced in the WEM is estimated at 0.59 MtCO2-e/MWh for
Q3 2021, which is a 3% reduction compared Q3 2020 and 14% from Q3 2016.
Carbon dioxide emissions related to coal-fired generation increased to 1.85 MtCO2-e in Q3 2021 compared to
1.65 MtCO2-e in Q3 2020, this was due to an increase in coal-fired generator availability in Q3 2021. Carbon
dioxide emissions associated with GPG fell to 0.78 MtCO2-e, this decrease of 0.23 MtCO2-e outweighed the
0.19 MtCO2-e increase in coal-fired carbon dioxide emissions.
45 The weighted average capacity factor of wind facilities is calculated using SCADA and sent out capacity from each wind farm connected to the SWIS.
46 Emission intensity per MWh values published by the Clean Energy Regulator (see http://www.cleanenergyregulator.gov.au/NGER/National greenhouse
and energy reporting data/electricity-sector-emissions-and-generation-data/electricity-sector-emissions-and-generation-data-2019-20) and sent out
facility SCADA data (see https://aemo.com.au/energy-systems/electricity/wholesale-electricity-market-wem/data-wem/market-data-wa) were used to
determine the carbon dioxide equivalent emissions for all registered facilities in the SWIS for Q3 in 2016 to 2021.
0%
5%
10%
15%
20%
25%
30%
Q3 2016 Q3 2017 Q3 2018 Q3 2019 Q3 2020 Q3 2021
Ren
ew
ab
le E
nerg
y
Gen
era
tio
n S
hare

© AEMO 2021 | Quarterly Energy Dynamics Q3 2021 51
Figure 82 Q3 WEM emissions intensity has been declining since 2016
WEM Emissions – Q3s
3.4 Power system management
3.4.1 Ancillary Services
The estimated total cost of Ancillary Services for Q3 2021 was $20.3 million47, down by $0.5 million from last
quarter (Figure 83).
Figure 83 Total Ancillary Service costs drop by 2.2% from Q2 2021
Ancillary services costs by quarter – Q1 2020 to Q3 2021
• Estimated Load Following Ancillary Service (LFAS) costs for Q3 2021 was $15 million and accounted for
74% of all Ancillary Service costs for the quarter, a reduction of $0.5 million from Q2 2021. Lower LFAS
costs for Q3 2021 compared to last quarter can be attributed to lower average LFAS Prices.
• Estimated Spinning Reserve costs reduced in Q3 2021, compared to last quarter and to Q3 2020 due to
a lower margin value during peak (-12.86%) and a lower Spinning Reserve required quantity during peak
(-12.03 MW)48.
47 The Q3 2021 Ancillary Service costs are estimated values due to September 2021 NSTEM Settlement not occurring until November 2021. The estimated
values are calculated as per the WEM Metering, Settlement & Prudential Calculations published here https://aemo.com.au/en/energy-
systems/electricity/wholesale-electricity-market-wem/procedures-policies-and-guides/guides on the AEMO website.
48 Spinning Reserve margin values and requirements are determined by the ERA: Ancillary Service Parameters published for 2021/22 are available here on
the ERA website - https://www.erawa.com.au/electricity/wholesale-electricity-market/ancillary-services-parameters/spinning-reserve-margin-peak-and-
off-peak-load-rejection-reserve-and-system-restart-cost_lr
0.0
0.1
0.2
0.3
0.4
0.5
0.6
0.7
0.0
0.5
1.0
1.5
2.0
2.5
3.0
3.5
4.0
2016 2017 2018 2019 2020 2021
Em
issi
on
s In
ten
sity
(tC
O2-e
/MW
h)
Em
issi
on
s (M
tCO
2-e
)
Coal [LHS] Gas [LHS] Other [LHS] Emissions Intensity [RHS]
0
5
10
15
20
25
Q1 Q2 Q3 Q4 Q1 Q2 Q3
2020 2021
To
tal C
ost
($M
)
LFAS Payments Load Rejection and System Restart Payments Spinning Reserve Payments

© AEMO 2021 | Quarterly Energy Dynamics Q3 2021 52
• Estimated Load Rejection and System Restart costs increased by $1.65 million in Q3 2021 due to the
COST_LR49 parameter increasing to $10,755,619, more than doubling the determination for 2020/21
($4,035,473)50.
3.4.2 LFAS market
In Q3 2021 the sculped LFAS requirements51 changed, with the transition to the lower requirement occurring
at 2030 hrs (previously 1930 hrs). The quantity of LFAS required was also adjusted:
• An additional +/-5 MW between 0530 hrs and 2030 hrs (a total of +/-100 MW); and,
• A reduction of +/-5 MW between 2030 hrs and 0530 hrs (a total of +/-65 MW).
Even with an increased LFAS requirement during the middle of the day and a record quantity of Backup LFAS
enablement, the total cost of LFAS enablement for Q3 2021 decreased by $506,000 from the previous quarter
(Figure 84). This was driven by lower average LFAS Prices compared to Q2 2021, down by $1.51/MW for LFAS
Up and $2.32/MW for LFAS Down.
Compared to Q3 2020, LFAS enablement costs increased by $1.39 million to $15 million. This was
predominantly driven by the increased LFAS requirement, which was introduced late in Q3 2020. On average,
the LFAS Up/Down requirement increased by +/-16 MW from this year to last year for all trading intervals.
Figure 84 Average LFAS prices continue to trend downwards contributing to lower total LFAS costs
LFAS cots and prices – Q3 2017 to Q3 2021
3.4.3 Backup LFAS
During Q3 2021 a record quantity of Backup LFAS was enabled, with an average of +/-41 MW of Backup LFAS
required during the 113 intervals it was enabled (Figure 84).
Backup LFAS is enabled by AEMO when additional or replacement LFAS is required and is provided by
Synergy. Similar to previous quarters, Backup LFAS was enabled in Q3 2021 during daytime hours, between
49 COSR_LR refers to the total cost of Load Rejection Reserve and System Restart, as determined by the ERA.
50Load Rejection and System Restart costs determined by the ERA can be found here - https://www.erawa.com.au/electricity/wholesale-electricity-
market/ancillary-services-parameters/load-rejection-cost_lr
51 For details of changes in LFAS Requirements refer to the Ancillary Service Report: https://aemo.com.au/en/energy-systems/electricity/wholesale-electricity-
market-wem/data-wem/system-management-reports
0
5
10
15
20
25
30
35
40
45
0
5
10
15
20
25
Q3 Q4 Q1 Q2 Q3 Q4 Q1 Q2 Q3 Q4 Q1 Q2 Q3 Q4 Q1 Q2 Q3
2017 2018 2019 2020 2021
Avera
ge L
FA
S P
rice
($/M
W)
To
tal LF
AS C
ost
($M
)
LFAS Up Cost [LHS] LFAS Down Cost [LHS] Backup LFAS Cost [LHS]
LFAS Up Price [RHS] LFAS Down Price [RHS]

© AEMO 2021 | Quarterly Energy Dynamics Q3 2021 53
0600 hrs and 1930 hrs, which corresponds to when the LFAS requirement quantities are higher due to higher
demand variability caused by distributed PV. This may occur when the weather conditions have intermittent,
patchy clouds or inconsistent wind levels.
On 10 August 2021, distributed PV fluctuations resulted in the highest ever quantity of Backup LFAS procured
in an interval, with +/- 80 MW of Backup LFAS required in addition to the standard LFAS quantity of
+/-100 MW quantity.
While Q3 2021 saw the highest quantities and costs associated with Backup LFAS compared to other quarters
(+$315,000 and +$221,000 from Q3 2020 and Q2 2021 respectively), it was utilised across 2.6% all intervals in
the quarter (+1.1% from Q2 2021). As Backup LFAS is only enabled during a relatively small number of trading
intervals, AEMO expect that enabling Backup LFAS only when it is required is a lower-cost alternative to
increasing the LFAS requirement across all trading intervals.
3.4.4 GIA Constraints
Generator Interim Access (GIA) is a connection arrangement established in mid-2018 to facilitate new
generation connections to the SWIS under a constrained access arrangement52. Since GIA was introduced,
630 MW of additional VRE generation has connected to the SWIS53 .
During Q3 2021, GIA generators produced 374 gigawatt hours (GWh) of energy, which accounted for 49% of
total wind and solar generation in Q3 2020. This represents energy provided by lower cost renewable
generators that would not have been available to the market without the GIA arrangement being in place. An
estimated 31 GWh of energy was constrained off under GIA54; over 99.8% of the GIA constraints were from
wind generators located in the North Country region55, due to network constraints. Compensation is not
provided to the facility operators for GIA constraints.
Q3 2021 saw a 77.5% decrease in GIA constraints compared to Q2 2021, in which 138 GWh of energy was
constrained under GIA (Figure 85). The GIA constraints in Q2 2021 were unusually high due to Cyclone Seroja
causing an extended network outage and islanding event in the North Country region56. During this period
GIA facilities still produced a total of 276 GWh of energy.
Figure 85 NCS generation and constraints
Quantity of energy produced by GIA and non-GIA Generators and quantity constrained by GIA
52 GIA was introduced, and is administered by, Western Power as Network Operator of the SWIS.
53 The Facilities connected under the GIA arrangements are BADGINGARRA_WF1, BLAIRFOX_BEROSRD_WF1, MERSOLAR_PV1, WARRADARGE_WF1, and
YANDIN_WF1.
54 GIA constraints are estimated based on a theoretical calculation of a generators output using wind or solar forecasts.
55 The North Country region include parts of the SWIS north of Pinjar.
56 Analysis of this event was published in the Q2 2021 Quarterly Energy Dynamics Report: https://www.aemo.com.au/-/media/files/major-
publications/qed/2021/q2-report.pdf?la=en
0
200
400
600
800
1,000
1,200
Q3 Q4 Q1 Q2 Q3
2020 2021
En
erg
y (
GW
h)
Generation - GIA Wind Generation - GIA Solar Generation - Non-GIA Wind
Generation - Non-GIA Solar GIA Constraint - Wind GIA Constraint - Solar

© AEMO 2021 | Quarterly Energy Dynamics Q3 2021 54
3.4.5 Demand variability
On 10 August 2021, between 1210 hrs and 1240 hrs, the WEM recorded a 723 MW drop (-28%) in
instantaneous demand, which was driven by an estimated 787 MW increase in distributed PV generation. This
resulted in a 409 MW decrease in End of Interval (EOI) demand57 between the trading interval commencing
1130 hrs and 1200 hrs, which is the largest downwards change in EOI demand recorded. Large variability in
demand may require manual intervention by AEMO to maintain power system security; as EOI demand is the
measure used to set the Balancing Price, variability can also have market impacts.
AEMO procured up to +/-80 MW of Backup LFAS to maintain power system security during this period.
The largest upwards change in EOI demand was recorded on 12 July 2021. EOI demand increased a record
449 MW between trading intervals commencing 1330 hrs and 1400 hrs. This was caused by a loss of 317 MW
in distributed PV generation combined with demand starting to ramp up to the evening peak.
Considering the seasonality of distributed PV output (optimum output occurs during the shoulder seasons in
Q2 and Q3) demand variability is becoming more pronounced with the increasing distributed PV capacity
(Figure 86).
Figure 86 Demand variability increases as distributed PV capacity grows
Distributed PV capacity and largest swing in demand – Q3 2019 to Q3 2021
57 End of Interval Relevant Dispatch Quantity is the demand measurement that sets the Balancing Price.
0
50
100
150
200
250
300
350
400
450
500
0
500
1,000
1,500
2,000
2,500
Q3 Q4 Q1 Q2 Q3 Q4 Q1 Q2 Q3
2019 2020 2021
EO
I Lo
ad
Sw
ing
(M
W)
PV
Cap
aci
ty (
MW
)
Distributed PV Capacity [LHS] Largest Quarterly EOI Swing [RHS]

© AEMO 2021 | Quarterly Energy Dynamics Q3 2021 55
Abbreviations Abbreviation Expanded term
AEMO Australian Energy Market Operator
ASX Australian Securities Exchange
APLNG Australia Pacific LNG
AWST Australian Western Standard Time
Cal Calendar year
DAA Day Ahead Auction
DWGM Declared Wholesale Gas Market
EGP Eastern Gas Pipeline
FCAS Frequency control ancillary services
GJ Gigajoule
GLNG Gladstone LNG
GPG Gas-powered generation, gas-powered generator
GSH Gas Supply Hub
IRSR Inter-regional settlement residue
JKM Japan Korea Marker
LFAS Load Following Ancillary Services
LNG Liquefied natural gas
MSP Moomba to Sydney Pipeline
MtCO2-e Million tonnes of carbon dioxide equivalents
MW Megawatts
MWh Megawatt hours
NEM National Electricity Market
NRM Negative residue management
OPEC Organisation of Petroleum Exporting Countries
PJ Petajoule
PV Photovoltaic
QCLNG Queensland Curtis LNG
QNI Queensland – New South Wales Interconnector
RBP Roma Brisbane Pipeline

© AEMO 2021 | Quarterly Energy Dynamics Q3 2021 56
Abbreviation Expanded term
RERT Reliability and Emergency Reserve Trader
SRA Settlement Residue Auction
STEM Short Term Energy Market
STTM Short Term Trading Market
SWIS South West Interconnected System
SWQP South West Queensland Pipeline
TJ Terajoule
VRE Variable renewable energy
WEM Wholesale Electricity Market