Embed Size (px)
Citation preview

Quarterly Review
Selected Financial and Operational Data:
Re: Electric Companies
• Carolina Power & Light Company • Dominion North Carolina Power • Duke Power, a Division of Duke Energy Corporation • Nantahala Power and Light Company
Natural Gas Local Distribution Companies
• North Carolma Gas Service, Division of NUI • North Carolina Natural Gas Corporation • Piedmont Natural Gas Company, Inc. • Public Service Company of North Carolina, Inc.
Telecommunications Companies
• ALLTEL Carolina, Inc, • BellSouth Telecommunications, Inc. • Carolina Telephone and Telegraph Company • Central Telephone Company • Citizens Telephone Company • Concord Telephone Company • LEXCOM Telephone Company • MEBTEL Communications • North State Communications • Verizon South Inc.
Quarter Ending March 31, 2002'

Table of Contents
Part Page
I Introduction 1
II Review of Key Financial Ratios: 6
H Summary Statement of Key Financial Ratios For 18 Selected Companies For The Twelve Months Ended March 31, 2002 — Returns on Common Equity, Overall Rates of Return, Common Equity Capitalization Ratios, and Pre-tax Interest Coverage Ratios — And Certain Rate Case Data 7
H Statement of Authorized Returns on Common Equity and Overall Rates of Return Granted By Various Public Utility Regulatory Agencies As Reported By Public UtiUties Reports. Volume Nos. 208-220, from June 2001 Through November 2002 10
III Overviews of Selected Financial and Operational Data By Utility: 12
H Electric Companies:
• Carolina Power & Light Company 13
• Dominion North Carolina Power 14 • Duke Power, a Division of Duke Energy Corporation 15 • Nantahala Power and Light Company 16
H Natural Gas Local Distribution Companies.
• North Carolina Gas Service, Division of NUI 17 • North Carolina Natural Gas Corporation 18 • Piedmont Natural Gas Company, Inc. 19 • Public Service Company of North Carolina, Inc. 20
H Telecommunications Companies:
• ALLTEL Carolina, Inc. 21 • BellSouth Telecommunications, Inc. 22 • Carolina Telephone and Telegraph Company 23 • Central Telephone Company 24
n

Table of Contents — continued
Part Page
III Overviews of Selected Financial and Operational Data — continued:
H Telecommunications Companies — continued:
Citizens Telephone Company Concord Telephone Company LEXCOM Telephone Company MEBTEL Communications North State Communications Verizon South Inc.
25 26 27 28 29 30
IV Appendix A - Distribution List
i n

Par t i
Introduction
B The purpose, structure, focus, and an abbreviated synopsis ofthe nature ofthe contents ofthis report is presented here.

The Quarterly Review has been designed and is structured so as to provide, in a clear and concise format, relevant and useful financial and operational information pertaining to 18 major investor-owned public utilities regulated by the North Carolina Utilities Commission (Commission): four electric companies, four natural gas local distribution companies, and ten telecommunications companies. The primary focus of this report is one of a jurisdictional financial nature. However, albeit limited, certain jurisdictional operational infonnation is also included.
To a vast extent the information presented herein is organized into individual company overviews. The data presented covers a period of five years. From a general viewpoint, such overviews provide information that users ofthis report will find helpful from the standpoint of gaining insight into each company's jurisdictional financial standing and in acquiring a sense ofthe magnitude of each company's overall jurisdictional economic dimension.
This report has been prepared solely for the use of the Commission. The responsibility for developing and preparing the report is that of the Commission's Operations Division (Division). The preponderance of the information and data included in and/or on which the report is based has been provided by the companies. Such data has not been audited or otherwise verified. Therefore, the Division, although it believes the aforesaid data to be true and correct in each and every respect, cannot and does not offer any attestation in that regard.
A Specific Objective
A specific objective ofthis reporting process is to present to the Commission, on an ongoing basis, meaningful information regarding the financial viability of the subject companies, including the reasonableness ofthe overall levels of rates and charges currently being charged by jurisdictional utilities, whose rates are cost based, for their sales of services. Cost based regulation is synonymous with rate base, rate of return regulation.
Under rate base, rate of return regulation, the cost of service of a public utility is defined as the sum total of reasonable operating expenses, depreciation, taxes, and a reasonable return on the net valuation of property used and useful in providing public utility services. Therefore, the reasonableness of a public utility's rates is a function of the reasonableness ofthe level of each individual component of its cost of service.
The reasonable return component of the cost of service equation refers to the overall rate of return related to investment funded by all investors, including debt investors as well as preferred and common equity investors. The costs ofdebt capital and preferred stock, which are essentially fixed by contract, must be deducted from revenue, like all other components ofthe cost of service, in determining income available for distribution to common stockholders. Therefore, generally speaking, a very meaningful measure ofthe profitability

of any utility, and consequently the reasonableness of its overall rates and charges, is the return earned on its common shareholders* investment, i.e., its return on common equity, over some specified period of time. Typically, such returns are measured over a period of one year. Thus, annual returns on common equity and certain other key financial ratios, which among other things give significant perspective to the common equity returns, are the focal points of this report.
The Key Financial Ratios
Specifically, the key financial ratios presented herein for use in reviewing the companies' financial viabilities, including their profitability and consequently the reasonableness of their rates and charges are (1) the return on common equity, (2) the common equity capitalization ratio, (3) the pre-tax interest coverage ratio, and (4) the overall rate of return.
The Return on Common Equity
As indicated, the return on common equity is a key financial indicator which measures the profitability of an enterprise from the standpoint of its common stockholders over some specified period of time. That return or earnings rate reflects the ratio of earnings available for common equity to the common-equity investors' capital investment. As previously stated, the ratio is significant because it traditionally represents profitability after all revenues and costs, other than the cost of common equity capital, have been considered. From the standpoint of measuring profitability, return on common equity is indeed "the bottom line".
The Common Equity Capitalization Ratio
The common equity capitalization ratio is the ratio of common equity capital to total investor-supplied capital of the firm. That ratio is significant because it is a major indicator of the financial riskiness of the firm, particularly from the standpoint of the common stockholders. The issuance ofdebt capital, assuming no offsetting decrease in preferred stock, decreases the common equity capitalization ratio, and its existence creates what has come to be known as financial leverage. The risk bome by shareholders that accompanies that leverage is known as financial risk. As the proportion of debt in the capital structure increases, so does the degree of financial leverage and thus shareholders' risk and consequently the shareholders' requirements regarding expected return, i.e., the expected return on common equity or, in regulatory jargon, the cost of common equity capital.
Alternatively, the financial riskiness of the firm, some might argue, is more appropriately revealed when expressed in terms of debt leverage, particularly when preferred stock is present in the capital structure. Such leverage is the ratio of long-term debt capital to total investor-supplied capital. Both approaches are clearly insightful and useful. In evaluating the superiority of one approach in comparison to the other, one should consider the

context within which the information is to be used. Since a major objective ofthis report is to review the reasonableness of the levels of earnings of the companies' common stockholders, and in consideration ofthe other key financial benchmarks which are also presented herein, the common equity capitalization ratio appears to be the most appropriate and meaningful measure ofthe financial riskiness ofthe companies for use in this regard.
The Pre-tax Interest Coverage Ratio
The pre-tax interest coverage ratio is the number of times earnings, determined before consideration of income taxes and interest charges, cover annual interest charges. That financial indicator is particularly important to debt investors because holders ofthe company's outstanding debt, including long-term bonds, receive interest payments from the company before any earnings are determined to be available for distribution to preferred or common equity investors. Pre-tax interest coverage is measured before income taxes because interest expense is deductible in arriving at taxable income. Therefore, generally speaking, debt holders can expect to be paid before the company incurs any liability for the payment of income taxes. From the debt holder's perspective, all other things remaining equal, the higher the pre-tax interest coverage the better.
The Overall Rate of Return
The overall rate of return measures the profitability of a firm from the standpoint of earnings on total investment, including investment funded by both debt and equity investors. Specifically, in the public utility regulatory environment, it is the ratio of operating income to total investment.
The Propriety o f The Methodology
The foregoing financial benchmarks, as presented in this report, have been determined on the basis of the companies' actual operating experience. Under rate base, rate of return regulation, North Carolina statutes require that the companies' rates be determined on a normalized, pro forma, end-of-period basis based upon a historical test year. Stated alternatively, the Commission, in setting prospective rates, essentially, must take into account the company's current level of operations adjusted for known and material changes in the levels of revenues and costs that the company can reasonably be expected to experience over a reasonable period of time into the future. Thus, rates, which are established for use prospectively, are set, to a certain extent and within certain constraints, on the basis of revenue and cost expectations, including investor expectations regarding their return requirements, as opposed to simply setting prospective rates solely on the basis of actual operating experience.

The process of setting prospective rates is inherently and exceedingly time consuming, difficult, and otherwise costly to both companies and regulators. It involves the assimilation, investigation, and evaluation of enormous amounts of complex information and data which invariably leads to multifarious issues; many, if not most, of which must be resolved through adjudication.
It is far less difficult and costly to perform an intellectual, financial analysis ofthe need to undertake the aforesaid process. Such preliminary analysis avoids the unnecessary incursion ofthe immense costs of setting prospective rates. Those are precisely the reasons why this report is focused on a review ofthe returns on common equity and other key financial ratios which the companies are currently earning or achieving under their existing rates and charges. Those ratios, when considered in conjunction with statutory rate making requirements, prevailing economic conditions, and certain other financial indicators, including returns on common equity and overall rates of return currently being authorized by other public utility regulatory agencies, are meaningful indicators ofthe need, if any, for further, more extensive regulatory review.
From the standpoint of giving an added measure of meaning to the aforesaid ratios of the individual companies and in the interest ofproviding a sense of current financial market conditions, certain financial information has been included herein as notes to the first statement included in Part II of this report. Such notes are an integral part of this report. Additionally, also from the standpoint ofproviding perspective, returns on common equity and overall rates of return currently being authorized by a number of other public utility regulatory agencies are provided in the second statement presented in Part II.
A Final Note
It is emphasized that the information contained in this report is not intended and should not be construed to be all inclusive from the standpoint of the criteria to be used in assessing the reasonableness of the companies existing rates. But rather, it is submitted that such information is clearly relevant to such a determination and as such should be considered in conjunction with all other pertinent information and data.
The Operations Division will be pleased to receive and respond to any questions or comments.

Part I I
A Review of Key Financial Ratios
H Summary Statement of Key Financial Ratios For 18 Selected Companies For The Twelve Months Ended March 31, 2002 — Returns on Common Equity, Overall Rates of Return, Common Equity Capitalization Ratios, and Pre-tax Interest Coverage Ratios — And Certain Rate Case Data
H Statement of Authorized Returns on Common Equity and Overall Rates of Return Granted By Various Public Utility Regulatory Agencies As Reported By Public Utilities Reports, Volume Nos. 208-220 from June 2001 Through November 2002

Summary Statement Of Key Financial Ratios Achieved By
And Authorized For Selected Companies
"Ei t imated Returns on Common Equity, Overall Rates of Return, Common Equity Capitalization Ratios, and Pre-tax Interest Coverage Ratios are for
Twelve Months Ended March 31 , 2002, Except for Certain Telecommunications Companies - See Note [1]"
"Rate Case Data are from Orders with Various Issue Dates as Indicated In Column (1)"
Estimated for 12 Months Ended 3/31/02 Authorized - Lmat Rmt* Case
Line No, Item
(a)
Return On
Eguity (b)
12.04%
12.16%
11.48%
6.90%
Overall Rate of Return
(e)
9.36%
9.12%
9.25%
7.03%
Equity Ratio
(d)
48.27%
46.66%
61.03%
61.50%
Pre-tax Interest
Coverage Ratio
(«)
4.04
4.32
6.48
3.37
Rttum On
Equity (f)
12.75%
11.80%
12.50%
12.10%
Overmll Rate of fittum
10.45%
9.48%
10.44%
10.32%
Equity fiatfo
(h)
44.00%
44.82%
49.82%
56.11%
Date of Last Order
(0
08/05/88
02/20/93
11/12/91
06/18/93
Electric Companies
1. Carolina Power & Light Company
2. Dominion North Carolina Power
3. Duke Power, a Division of Duke Energy Corporation
4. Nantahala Power and Light Company
Natural Gas Local Distribution Companies
5. North Carolina Gas Service. Division of NUI
6. North Carolina Natural Gas Corporation
7. Piedmont Natural Gas Company, Inc.
8. Public Service Company of North Carolina, Inc.
Telecommunications Companies
9. • ALLTEL Carolina, Inc.
10. * BellSouth Telecommunications, Inc.
11. * Carolina Telephone and Telegraph Company
12. * Central Telaphone Company
13. Citizens Telephone Company
14. * Concord Telephone Company
15. LEXCOM Telephone Company
16. * MEBTEL Communications
17. North State Telephone Company
18. ' Verizon South Inc,
NOTES: * [1] Companies electing price regulation are denoted above with an asterisk. For those companies, wi th the exception of Concord
Telephone Company, ALLTEL Carolina, Inc., and MEBTEL Communications, the Information on which this report is based is filed on an annual calendar-year basis for reporting periods beginning after June 30,1996; therefore, the data for such companies included herein is updated annually beginning with the calendar year 1SSS. Concord Telephone Company elected price regulation during 1997, and the Information on which this report is based is filed on an annual calendar-year basis for reporting periods beginning after June 30,1997. Thus, the data for Concord Telephone Company wil l be updated annually beginning with the calendar year 1997. ALLTEL Carolina, Inc. elected price regulation during 1998, and the information on which this report is based is filed on an annual calendar-year basis tor reporting periods beginning after June 30,1998. Thus, the data for ALLTEL Carolina, Inc. wil l be updated annually beginning with the calendar year 1998. MEBTEL Communications elected price regulation during 1999, and the Information on which this report is based is filed on an annual calendar-year basis for reporting periods beginning after September 30,1999. Thus, the data for MEBTEL Communications will be updated annually beginning with the calendar year 1999.
[2] Information presented is on a North Caroiina jurisdictional basis except for MEBTEL Communications and North State Telephone Company which are presented on a total company basis.
[3] N/A denotes that information is not available.
N/A
2.71%
10,08%
10.86%
18.90%
19.14%
22.72%
20.06%
16.73%
14.47%
12.81%
18.58%
14.91%
13.54%
N/A
4.66%
8.66%
9.01%
18.59%
13.36%
16.53%
17.63%
13.95%
14,53%
12.57%
18.58%
14.70%
10.02%
N/A
48.27%
52.77%
48.26%
72.31%
56.16%
63.21%
79.05%
66.84%
66.38%
95.65%
100.00%
97,62%
50.21%
N/A
1.59
3.31
3.26
5,53
7.78
11.85
14.49
7.25
5.01
87.09
0.00
317.15
4.23
11.40%
N/A
11.30%
11.40%
13.20%
15.00%
15.25%
15.50%
12.70%
15.50%
16.25%
16.50%
N/A
13.90%
9.16%
10.09%
9.70%
9.82%
10.33%
12.51%
11.82%
12.09%
10.11%
12.11%
12.77%
5.92%
N/A
11.82%
47.57%
N/A
52.71%
51.91%
42.11%
54.00%
48.40%
48.30%
44.95%
58.59%
37.22%
16.92%
N/A
50.00%
09/20/95
10/27/95
10/05/00
10rt0/98
11/25/86
11/09/84
03/30/83
08/22/83
02/28/91
06/17/83
06/14/82
11/26/79
06/13/52
09/16/86

Summary Statement Of Key Financial Ratios Achieved By
And Authorized For Selected Companies
"Estimated Returns on Common Equity, Overall Rates of Return, Common Equity Capitalization Ratios, and Pre-tax Interest Coverage Ratios are for
Twelve Months Ended March 31, 2002, Except for Certain Telecommunications Companies - See Note [ I F
N O T E S - c o n t i n u e d
NOTES: [4] Standard and Poor's 1994 annual "Olobal Sector Review" reflects the following benchmark-ratio ranges for total debt capitalization ratios and pre-tax interest coverage ratios for electric utilities and natural gas local distribution companies; telecommunications utilities are not included In that publication:
RANGE Line No. Item
(a)
Electric utilities: Pre-tax interest coverage ratio (times) Total debt ratio (%)
Natural gas local distribution companies: Pre-tax interest coverage ratio (times) Total debt ratio (%)
BONDS RATED "AA"
(b)
3.50 - 4.00 42.00 - 47.00
3.75 - 4.25 41.00-46.00
BONDS RATED "A" (c)
2.75 - 4.50 41.00-52.00
3.00 - 4.25 42.00-51.00
[6] Selected financial market indicators from "Moody's Credit Perspectives", Volume 96, No. 2, January 13, 2003 follow:
Part i Dealer- Moody's Placed Long-Term
3-Month Corporate CP Bond Yield _5L -%. (e) (0
Line No. Date
(a)
U.S. Treasury Securities 3-Month 10-Year 30-Year
Bill Note Bond _5i_ _%_ _!i_ (b) (c) (d)
January 3, 2003 January 6, 2003 January 7. 2003 January 8, 2003 January 9, 2003
Month of December 2002 Month of November 2002
1.20 1.19 1.18 1.17 1.18
1.19 1.23
4.03 4.06 4.00 3.98 4.16
4.01 4.04
4.95 498 4.94 492 5.07
4.92 4.95
1.28 1.29 1.29 1.29 1.28
1.32 1.37
6.90 6.92 6.89 6.83 6.95
6.90 7.01
Part II
Moody's public utility long-term bond yield averages (%):
Line No. Siting
(a)
Aaa Aa A
01/09/03 (b)
6.96 7.10
Past 12-Months High
(c)
7.43 7.76
Low (d)
6.94 7.07
Monthly Dec. 2002
(«)
6.64 7.07
Nov. 2003 (0
7.03 7.14
[6] According to "Moody's Credit Perspectives", Volume 96, No. 2, as of 12/10/01 the "Aaa" Utilities Index wfll be discontinued indefinitely.

Summary Statement Of Key Financial Ratios Achieved By
And Authorized For Selected Companies
"Estimated Returns on Common Equity, Overall Rates of Return, Common Equity Capitalization Ratios, and Pre-tax Interest Coverage Ratios are for
Twelve Months Ended March 31, 2002, Except for Certain Telecommunications Companies • See Note [1]"
NOTES - continued
NOTES: [7] Selected financial market indicators from January 13,2003 follow - continued:
Part III
'Moody's Credit Perspectives", Volume 96, No. 2,
New offerings by public utilities -
Line No.
1.
2.
3.
4.
5.
6.
7.
Company Name (a)
Alabama Power Company
Dominion Resources, Inc.
Dominion Resources. Inc.
Wisconsin Public Service Corp.
Florida Power & Light Company
Florida Power & Light Company
Illinois Power Company
listing is all inclusive for week of January 13, 2003:
Amount (b)
$200 Million
$300 Million
1300 Million
$150 Million
$400 Million
$200 Million
$550 Million
Term (c)
20 Years
7 Years
30 Years
10 Years
10 Years
30 Years
8 Years
Yield Current
(d)
5.875%
5.125%
6.750%
4.875%
4.850%
5.850%
11.500%
Maturity (•)
5.490%
5.190%
6.760%
4.920%
4.860%
5.860%
-
Bating (0
A2
Bsal
Baal
Aai
Aa3
Aa3
B3

Statement of Authorized Returns On Common Equity and Overall Rates of Return
Granted By Various Public Utility Regulatory Agencies As Reported In PubUc Utilities Reports Volume Nos. 208-220, from June 2001 through November 2002
(Statement Is All Inclusive With Respect To Returns Published)
Line No, Company (JurisdIction)
(a)
Authorized Returns Common
Equity (b)
Overall (c)
Volume No. Date Of PubHc UtHlttos Order RvpQrt*
(d) (e)
Electric Companies
1. Portland General Electric Company (OR)
2. PacifiCorp., d/b/a Utah Power and Light Co. (UT)
3. Nevada Power Company (NV)
4. Montana-Dakota Utilities Company (MT)
5. Sierra Pacific Power Company (NV)
6. Guif Power Company (FL)
7. Savannah Electric and Power Company (GA)
8. Wisconsin Public Service Corporation (Wl)
9. Citizens Energy Services (VT)
10.50%
11.00%
10.10%
11.80%
10.17%
12.00%
12.00%
12.30%
5,75%
N/A
8.87%
8.37%
N/A
8.61%
N/A
N/A
9.71%
N/A
08/31/01
09/10/01
03/29/02
04/24/02
05/28/02
06/10/02
05/30/02
06/21/02
07/15/02
Volume 212
Volume 213
Volume 216
Volume 217
Volume 218
Volume 218
Volume 218
Volume 218
Volume 220
Natural Gas Local Distribution Companies
10. Public Service Company of Colorado (CO)
11. Montana Power Company (MT)
12. Northern States Power Company (ND)
13. Southwest Gas Corporation (AZ)
14. Mobile Gas Service Corporation (AL)
15. Yankee Gas Services Company (CT)
16. Atlanta Gas Light Company (GA)
17. Wisconson Public Service Corporation (Wl)
11.25%
10.75%
11.50%
11.00%
13.60%
11.00%
11.00%
12.30%
9.33%
8.82%
8.89%
9.19%
N/A
8.91%
N/A
9.71%
03/15/01
05/09/01
06/27/01
10/30/01
10/30/01
01/30/02
04/29/02
06/21/02
Volume 208
Volume 209
Volume 211
Volume 213
Volume 213
Volume 215
Volume 217
Volume 218
10

Statement of Authorized Returns On Common Equity and Overall Rates of Return
Granted By Various Public Utility Regulatory Agencies As Reported In Public UtiliiiBS Reports Volume Nos. 208-220, from June 2001 through November 2002
(Statement Is All Inclusive With Respect To Returns Published)
Line No. Company (Jurisdiction)
(a)
Authorized Returns Common
Equity Overall (b) (c)
Volume No. Date Of Public Utilities Order Reports
(d) (e)
Water Companies
18, Artesian Water Company, Inc. (DE)
19, Arizona Water Company (AZ)
20. Aloha Utilities, Inc. (HI)
21. Philadelphia Suburban Water Company (PA)
10.50%
10.25%
10.34%
10.70%
N/A
9.64%
8.52%
8.77%
06/19/01
12/28/01
04/30/02
08/01/02
Volume 211
Volume 214
Volume 217
Volume 219
NOTE : N/A denotes that information is not available.
11

Part III
Overviews of Selected Financial and Operational Data By Utility.
H Electric Companies
• Carolina Power & Light Company • Dominion North Carolina Power • Duke Power, a Division of Duke Energy Corporation • Nantahala Power and Light Company
H Natural Gas Local Distribution Companies
• North Carolina Gas Service, Division of NUI • North Carolina Natural Gas Coiporation • Piedmont Natural Gas Company, Inc. • Public Service Company of North Carolina, Inc.
H Telecommunications Companies
ALLTEL Carolina, Inc. BellSouth Telecommunications, Inc. Carolina Telephone and Telegraph Company Central Telephone Company Citizens Telephone Company Concord Telephone Company LEXCOM Telephone Company MEBTEL Communications North State Communications Verizon South Inc.
Line No.
1.
2. 3. 4. 5. 6, 7.
Item (a)
Operating Revenue
Operating Expenses: Fuel Purchased Power Maintenance Other Operating Expenses
Total Operating Expenses
8. Depreciation & Amortization
9. Total Expenses & Depreciation
10. Total Operating Taxes
11. Total Expenses, Depr. & Taxea
12. Operating Income
13. Net Plant Investment
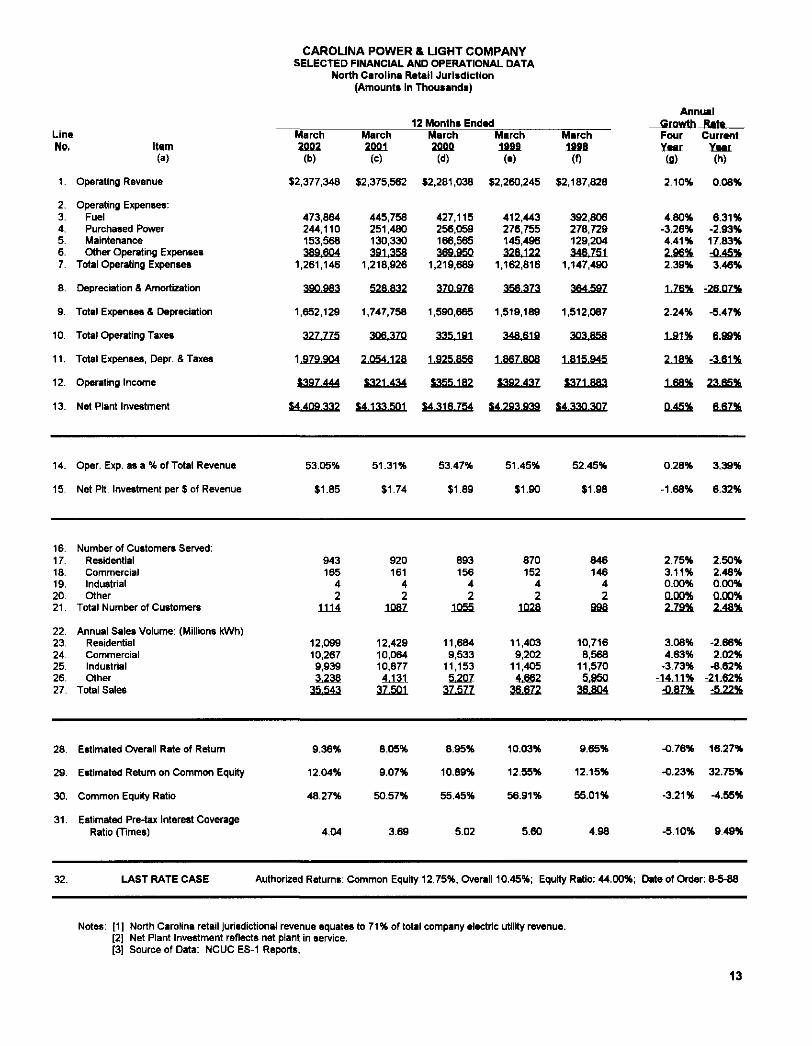
CAROLINA POWER & LIGHT COMPANY SELECTED FINANCIAL AND OPERATIONAL DATA
North Carolina Retail Jur isdict ion (Amounts In Thousands)
March 2002
(b)
$2,377,348
473,864 244,110 153,568 389,604
1,261,146
390.963
1,652,129
327.775
1 9 7 9 3 0 4
1397.444
K^oajm
March 2QQ1
(e)
$2,375,562
445,758 251,480 130,330 391358
1,218,926
528.S32
1,747,758
306,370
2.054.123
$321.434
simsoi
12 Months Ended March 2000
(d)
$2,281,036
427,115 256,059 166,565 369.950
1,219,689
370.976
1,590,665
335,191
1 9 2 5 J 5 6
S3SSJfl2
$4.316754
March 1889
(e)
$2,260,245
412,443 276,755 145,496 328022
1,162,816
35&3Z3
1,519,189
348.619
ISSLSQS
Sa&2J3I
March 1888
(f)
$2,187,828
392,806 278,729 129,204 346,751
1,147,490
364 597
1,512,087
msss 1.815.945
1371.883
Ann Growth Four Year
(9)
2.10%
4.80% -3.26% 4.41% 2,96% 2.39%
1.76%
2.24%
1.91%
2.18%
1.68%
045%
ual Rate Current
Year (h)
0.08%
6.31% -2.93% 17.83% -0.45% 3.46%
-26.07%
-5.47%
6.99%
-3 .61%
23.65%
fi£Z%
14.
15.
16. 17. 18. 19. 20. 21.
22. 23. 24. 25. 26. 27.
28.
29.
30.
31.
Oper. Exp. as a % of Total Revenue
Net Pit. Investment per $ of Revenue
Number of Customers Served: Residential Commercial Industrial Other
Total Number of Customers
Annual Sates Volume: (Millions kWh) Residential Commercial Industrial Other
Total Sales
Estimated Overall Rate of Return
Estimated Return on Common Equity
Common Equity Ratio
Estimated Pre-tax Interest Coverage Ratio (Times)
53.05%
$1.85
943 165
4 2
1114
12,099 10,267 9,939 3,238
35.549
9.36%
12.04%
48.27%
4,04
51.31%
$1.74
920 161
4 2
1087
12,429 10,064 10,877 4.131
37,501
8.05%
9.07%
50.57%
3.69
53.47%
$1.89
893 156
4 2
1255
11,684 9,533
11,153 5.207
37,577
8.95%
10.89%
55.45%
5.02
51.45%
$1.90
870 152
4 2
uua
11,403 9,202
11,405 4,662
36.672
10.03%
12,55%
56.91%
5.60
52.45%
$1.98
846 146
4 2
aaa
10,716 8,568
11,570 5.950
36,804
9.65%
12.15%
55.01%
4.98
0.28%
-1.68%
2.75% 3.11% 0.00% Q.0Q% 223%.
3.06% 4.63%
-3.73% -14.11% -0.87%
-0.76%
-0.23%
-3 .21%
-5.10%
3.39%
6.32%
2.50% 2.48% 0.00% Q.QQ% 248%
-2.66% 2.02%
-8.62% -21.62%
-5,22%
16.27%
32.75%
-4.55%
9 4 9 %
32. LAST RATE CASE Authorized Returns: Common Equity 12.75%, Overall 10.45%; Equity Ratio: 44.00%; Date of Order: 8-5-88
Notes: [1 ] North Carolina retail Jurisdictional revenue equates to 71 % of total company electric utility revenue. [2] Net Plant Investment reflects net plant in service. [3] Source of Data: NCUC ES-1 Reports.
13

Line No,
1.
2. 3. 4. 5, 6. 7.
Kern (a)
Operating Revenue
Operating Expenses: Fuel Purchased Power Maintenance Other Operating Expenses
Total Operating Expenses
8. Depreciation & Amortization
9. Total Expenses & Depreciation
10. Total Operating Taxes
11. Total Expenses, Depr. & Taxes
12. Operating Income
13. Net Plant Investment
DOMINION NORTH CAROLINA POWER SELECTED FINANCIAL AND OPERATIONAL DATA
North Carolina Retail Jurisdiction (Amounts In Thousands)
12 Months Ended March 2002 (b)
March 2001 (c)
March 20.00 (d)
March 1989 (e)
$243,096 $239,619 $222,949 $219,198
March UBS
(0
$217,715
46,657 44,383
0 51677
142,717
29.502
172.219
33,206
205,425
$37.673
S41&a22
35,617 51,990
0 56J06
143,713
2L523
171.236
29.400
200.636
s s s a a a
S420.Q?4
32,786 51.802
0 49.668
134,456
24.648
159,104
27.700
186.804
136.145
27,771 52.039 12,671 31,375
123.856
25.109
148,965
30.434
179.399
138798
1410.136
17.359 59.877 10.765 30.040
118,041
27.668
145.709
30.107
175.816
$41.899
sm2si
Annual Growth Rate Four Current Year Year (9) (h)
2.80% 1.45%
28.04% -7.21%
N/A 14.52%
4.86%
1.62%
4.27%
2.48%
3.97%
-262%
-±233k
31.00% -14.83%
N/A -7.68% -0.69%
U8%
0.57%
1255%
2.39%
-3 3f i%
-0.47%
14. Oper, Exp. as a % of Total Revenue
15. Net Ptt. Investment per $ of Revenue
58.71%
$1.72
59.98%
$1.75
60.31%
$1.82
56.50%
$1.87
54.22%
$2.02
2.01% -2.12%
-3.94% -1.71%
16. 17. 18. 19. 20. 21.
22, 23. 24. 25. 26. 27.
Number of Customers Sen/ed: Residential Commercial Industrial Other
Total Number of Customers
Annual Sales Volume: (Millions kWh) Residential Commercial Industrial Other
Total Sales
94 15 0 2
H I
1,313 706
1.450 134
3*603
93 14 0 2
ioa
1,316 690
1.292 134
3422
91 14 0 2
10Z
1.224 662
1,218 124
&22&
90 14 0 2
IQfi
1,188 650
1,202 12fi
89 13 0 2
104
1.112 630
1.266 109
ajiz
1.38% 3.64%
N/A 0,00% 1,64%
4.24% 2.89% 3.45% 5.30% & f f l %
108% 7.14%
N/A 0.00% 1.83%
-0.23% 2.32%
12.23% 0.00% 4 4 6 %
28. Estimated Overall Rate of Return
29. Estimated Return on Common Equity
30. Common Equity Ratio
31. Estimated Pre-tax Interest Coverage Ratio (Times)
9.12%
12.16%
46.66%
4.32
9.64%
12.40%
46.09%
4.09
8.85%
10.76%
48.16%
3.62
9.65%
12.41%
47.24%
4.14
9.55%
12.09%
47.45%
4.00
-1.15%
0.14%
-0.42%
1.94%
-5.39%
-1.94%
-2.97%
5.62%
32. LAST RATE CASE Authorized Returns; Common Equity 11.80%, Overall 9.48%; Equity Ratio: 44.82%: Data of Order: 2-26-93
Notes: [1 ] North Carolina retail jurisdictional revenue equates to 5% of total company electric utility revenue. [2] Net Plant Investment reflects net plant in servica. [3] Source of Data: NCUC ES-1 Reports. [4] N/A denotes that the data is not available or not applicable or that information is, essentially, unmeaningful.
14
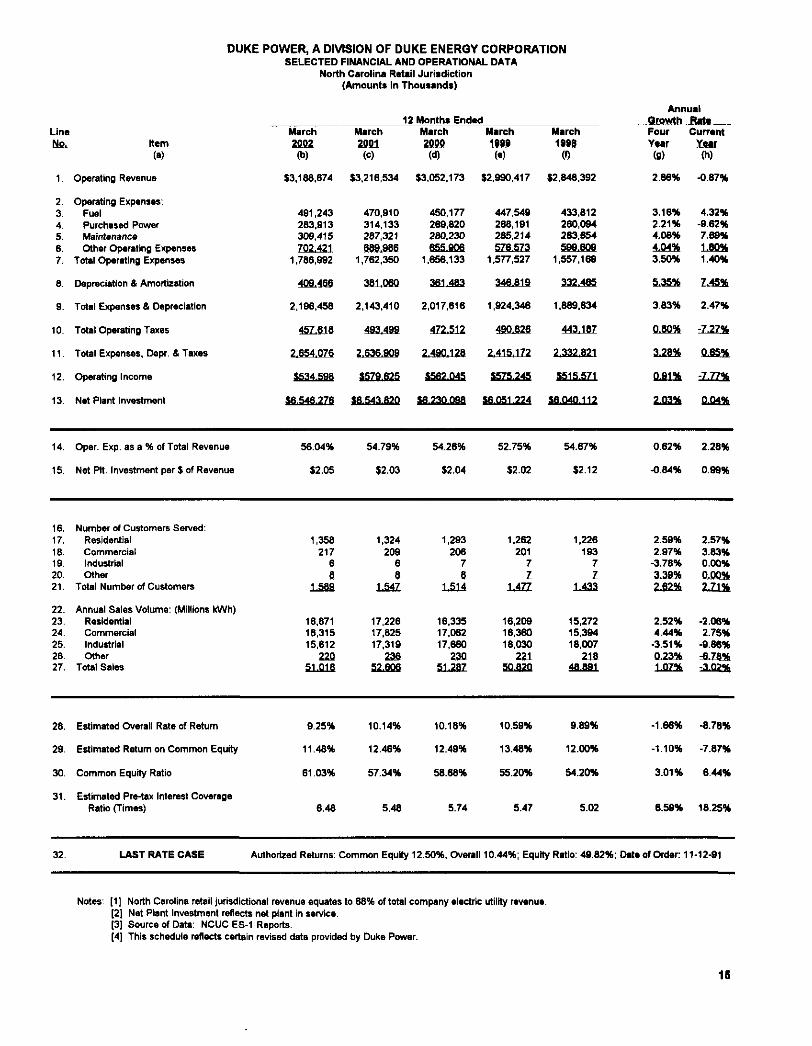
DUKE POWER, A DIVISION OF DUKE ENERGY CORPORATION SELECTED FINANCIAL AND OPERATIONAL DATA
North Carolina Retail Jurisdiction (Amounts In Thousands)
Une No.
1.
2. 3. 4. 5. 6. 7,
Item (a)
Operating Revenue
Operating Expenses: Fuel Purchased Power Maintenance Other Operating Expenses
Total Operating Expenses
8. Depreciation & Amortization
9. Total Expenses & Depreciation
10- Total Operating Taxes
11. Total Expenses, Depr. & Taxes
12. Operating Income
13. Net Plant Investment
March 2002 (b)
12 Months Ended March 2001
(c)
March 2000
(d)
March 1989
(a)
March 1986
(0
$3,168,674 $3,216,534 $3,052,173 $2,990,417 $2,846,392
491,243 283.913 309,415 702.421
1.786,992
409.469
2,196,458
45L616
2.654.076
S534£aa
l&S4&2Zfi
56.04%
$2.05
470.910 314,133 287,321 6S&9S6
1,762.350
381.060
2,143,410
493.499
2.636.909
1SZ&625
1&543£2Q
54.79%
$2.03
450,177 269,820 280.230 655.906
1.656,133
361483
2,017,616
4Z2£12
2.490.128
SSS2441
&23Q£aa
54.26%
$2.04
447,549 268,191 265.214 576.573
1,577,527
346.819
1,924.346
490626
2.415.172
1575^45
S&aSL224
52.75%
$2.02
433,812 260,094 263,654 599,608
1.557.169
332.405
1,869.634
443.187
2J3ZS21
1S1££Z1
i f i JMLll i
54.67%
$2.12
Annual . .growth ..Rail
Four Currant Year Year
(g) (h)
2.66% -0.87%
3.16% 2.21% 4.06% 4.04% 3.50%
5.353t
3.83%
0.80%
32S%
Q £ l %
2 4 3 %
4.32% -9 62% 7.69% 1SQ% 1.40%
L45%
2.47%
7.27%
&6S%
-7.77.%
004%
14. Oper. Exp. as a % of Total Revenue
15. Net PH. Investment per $ of Revenue
0.62% 2,28%
-0.64% 0.99%
16. Number of Customers Served: 17. Residential 18. Commercial 19. Industrial 20. Other 21. Total Number of Customers
22. Annual Sales Volume: (Millions kWh) 23. Residential 24. Commercial 25. Industrial 26. Other 27. Tota) Sales
1,358 217
6 6
1,589
16,871 16,315 15,612
220 SLQ1£
1.324 209
6 8
1.547
17,226 17,825 17.319
236 52£QB
1,293 206
7
s 1,514
16.335 17.062 17,660
230 512SZ
1.262 201
7 7
1,477
16.209 16.360 18,030
221
soazo
1,226 193
7 7
1,433
15,272 15.394 18,007
218 4&fiai
2.59% 2.97%
-3.78% 3.39% 2J2%
2.52% 4.44%
-3.51% 0.23% 107%
2.57% 3.83% 0.00% Q£Q% 221%
-2.06% 2.75%
-9.86% =676% 13^12%
28. Estimated Overall Rate of Return
29. Estimated Return on Common Equity
30. Common Equity Ratio
31. Estimated Pre-tax Interest Coverage Ratio (Times)
9.25%
11.48%
61.03%
6.46
10.14%
12.46%
57.34%
5,48
10.18%
12.49%
58.68%
5.74
10,59%
13.48%
55.20%
5.47
9.89%
12.00%
54.20%
5.02
-1.66%
-1,10%
3.01%
6.56%
-8.78%
-7.87%
644%
18.25%
32 LAST RATE CASE Authorized Returns: Common Equity 12.50%, Overall 10.44%; Equity Ratio: 49.82%; Date of Order: 11-12-91
Notes: [1] North Carolina retail jurisdictional revenue equates to 66% of total company electric utility revenue. [2] Net Plant Investment reflects net plant in service. [3] Source of Data: NCUC ES-1 Reports. [4] This schedule reflects certain revised data provided by Duke Power.
IS
Line No, Item
(a)
1. Operating Revenue
2. Operating Expenses: 3. Purchased Power - Special Contract 4. Purchased Power - Regular 5. Maintenance 6. Other Operating Expenses 7. Total Operating Expenses
8. Depreciation & Amortization
9. Total Expenses & Depreciation
10. Total Operating Taxes
11. Total Expenses, Depr. & Taxes
12. Operating Income
13. Net Plant Investment
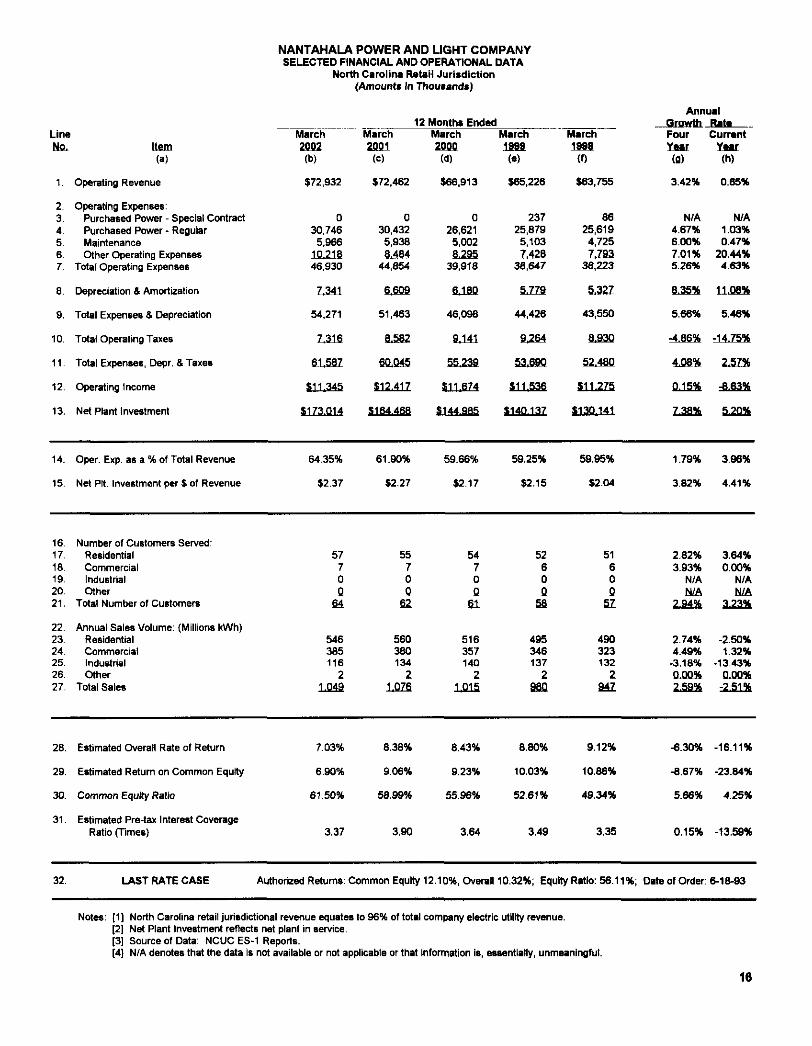
NANTAHALA POWER AND UGHT COMPANY SELECTED FINANCIAL AND OPERATIONAL DATA
North Carolina Retail Jur isdict ion (Amounts In Thousands)
12 Months Ended March 2002
(b)
$72,932
March 2001
(c)
$72,462
March 2000
(d)
$66,913
March 1S98 (e)
$65,226
March 1988
(0
$63,755
0 30,746
5,966 10218 46,930
7.341
54.271
7.316
61587
$11,345
SI 73.014
64.35%
$2.37
0 30.432
5,938 8,484
44,854
6,609
51,463
8582
60045
$12417
$164 468
61.90%
$2,27
0 26,621
5,002 8295
39,918
6,180
46,096
9.141
55,239
111.674
$141925
59.66%
$2.17
237 25,879
5,103 7 478
38,647
5.779
44,426
9264
53.690
$11536
$140,137
59.25%
$2,15
86 25,619
4.725 7 J 9 3
36,223
5^27
43,550
S£3Q
52.480
111225
1130.141
59.95%
$2.04
Annual j S r o w t t L - B i t t Four Current Year Year
(g) (h)
3.42% 0.65%
N/A 4.67% 6.00% 7.01% 5.26%
6^5%
5.66%
-4.86%
4.08%
0 15%
7.38%
1.79%
3.82%
N/A 1.03% 0.47%
20 44% 4 6 3 %
1148%
5.46%
-14.75%
2-57%
^ £ 2 %
5.20%
396%
4.41%
14. Oper. Exp. as a % of Total Revenue
15. Net Pit. Investment per $ of Revenue
16. Number of Customers Served: 17. Residential 18 Commercial 19. Industrial 20- Other 21 . Total Number of Customers
22. Annual Sales Volume: (Millions kWh) 23. Residential 24. Commercial 25. Industrial 26. Other 27. Total Sales
57 7 0 0
64
546 385 116
2 1049
55 7 0 0
62
560 380 134
2 1.076
54 7 0 0
ei
516 357 140
2 1015
52 6 0 0
sa
495 346 137
2 930
51 6 0 0
SL
490 323 132
2 942
2.82% 3.93%
N/A N/A
2.94%
2.74% 4.49%
-3.18% 000% 2^9%
3.64% 0.00%
N/A N/A
3.23%
-2.50% 1,32%
-13.43% Q.00%
-2 51%
28. Estimated Overall Rate of Return
29. Estimated Return on Common Equity
30. Common Equity Ratio
31 . Estimated Pre-tax Interest Coverage Ratio (Times)
7.03%
6,90%
61.50%
3.37
8.38%
9.06%
58.99%
3.90
8.43%
9.23%
55.96%
3.64
8.80%
10.03%
52.61%
3,49
9.12%
10.86%
49.34%
3.35
-6.30%
-8.67%
5.66%
0.15%
-16.11%
-23.84%
4,25%
-13.59%
32 LAST RATE CASE Authorized Returns: Common Equity 12.10%, Overall 10.32%; Equity Ratio: 56.11%; Date of Order: 6-18-93
Notes: [1] North Carolina retail jurisdictional revenue equates to 96% of total company electric utility revenue. [2] Net Plant Investment reflects net plant in service. [3] Source of Data: NCUC ES-1 Reports. [4] N/A denotes that the data is not available or not applicable or that Information is, essentially, unmeaningful.
16

NORTH CAROLINA GAS SERVICE, DIVISION OF NUI SELECTED FINANCIAL AND OPERATIONAL DATA
North Carolina Retail Jurisdiction (Amounts In Thousands)
Lim No.
1. 2. 3 4. 5. 6. 7. 8.
9.
10.
11.
12.
13.
14.
15,
16.
17. 18. 19. 20. 21, 22. 23. ?4
25. 26. 27. 28. 29. 30. 31. 32.
33.
34.
35.
36.
37.
! Item (a)
Operating Revenue: Residential Commercial Industrial Public Authorities Resale Other
Total Operating Revenue
Cost of Gas
Margin
O&M Expenses
Other Deductions
Operating Income
Net Plant Investment
Operating Exp. as a % of Margin
Net PH. Investment per $ of Margin
Gas Delivered in DTs: Residential Commercial Industrial Public Authorities Resale Other
Total DTs
Number of Customers; Residential Commercial Industrial Public Authorities Resale Other
Total Number of Customers
Estimated Overall Rate of Return
Estimated Return on Common Equity
Common Equity Ratio
Estimated Pre-tax Interest Coverage Ratio (Times)
LAST RATE CASE
March 2002 (b)
$6,536 3,343
914 0
307 2J34
13,434
6479
7,355
3,524
2^2Z
$1,404
m423
47.91%
$2.24
765 492 192
0 0
2491 3.540
12 2 0 0 0 0
14
N/A
N/A
N/A
N/A
12 Months Ended —March March
2001 (c)
$10,487 5.279 3,877
0 1,636 3.754
25233
17,571
7,662
3,649
2.685
£1328
Sl&2aQ
47.62%
$2.12
941 590 634
0 0
1556 3521
12 2 0 0 0 0
14
N/A
N/A
N/A
N/A
2000 (d)
N/A N/A N/A N/A N/A N/A N/A
WA
N/A
N/A
N/A
WA
N/A
N/A
N/A
N/A N/A N/A N/A N/A N/A N/A
N/A N/A N/A N/A N/A N/A N/A
N/A
N/A
N/A
N/A
March 1999 (e)
$5,712 2,609 2.105
0 1,387 2206
14,019
7.601
6,418
3,816
1,636
lass
114522
59.46%
$2.28
796 468
1,215 0 0
1,110 3,609
12 2 0 0 0 0
14
N/A
N/A
N/A
N/A
WarcTT 1388 (0
$7,080 3,173 4.116
0 1,971 2J22
19462
11,815
7,247
3,675
2,115
11.457
114^28
50.71%
$1.95
822 459 932
0 0
1528 3,741
12 2 0 0 0 0
14
N/A
N/A
N/A
N/A
Authorized Returns: Common Equity 11.40%, Overall 9.16%; Equity Ratio: 47.57%;
Annual Growth Rate
Four Year (fl)
-1.98% 1.31%
-31.35% N/A
-37.18% -3.77% -8,38%
-15.31%
0.37%
-1.04%
350%
=092%
3,95%
-1.41%
3.53%
N/A N/A N/A N/A N/A N/A N/A
N/A N/A N/A N/A N/A N/A N/A
N/A
N/A
N/A
N/A
Current Year (h)
-37.68% -36.67% -76.43%
N/A -83.28% -37.83% -46,76%
-65.40%
-4.01%
-3.43%
-9.61%
5 72%
1.31%
0.61%
5.66%
-18.70% -16.61% -69.72%
N/A N/A
2627% -7 35%
0.00% 0.00%
N/A N/A N/A N/A
0.00%
N/A
N/A
N/A
N/A
Date of Order: 9-20-95
Notes: [1] The percentage of North Carolina retail jurisdictional revenue to total company gas utility revenue is not available. [2] Net Plant Investment reflects net plant in service. [3] Source of Data: Shareholders' reports and the NCUC GS-1 Reports. [4] N/A denotes that the data has not been provided due to ongoing changes occurring within the Company's intemal operational
structure.
17
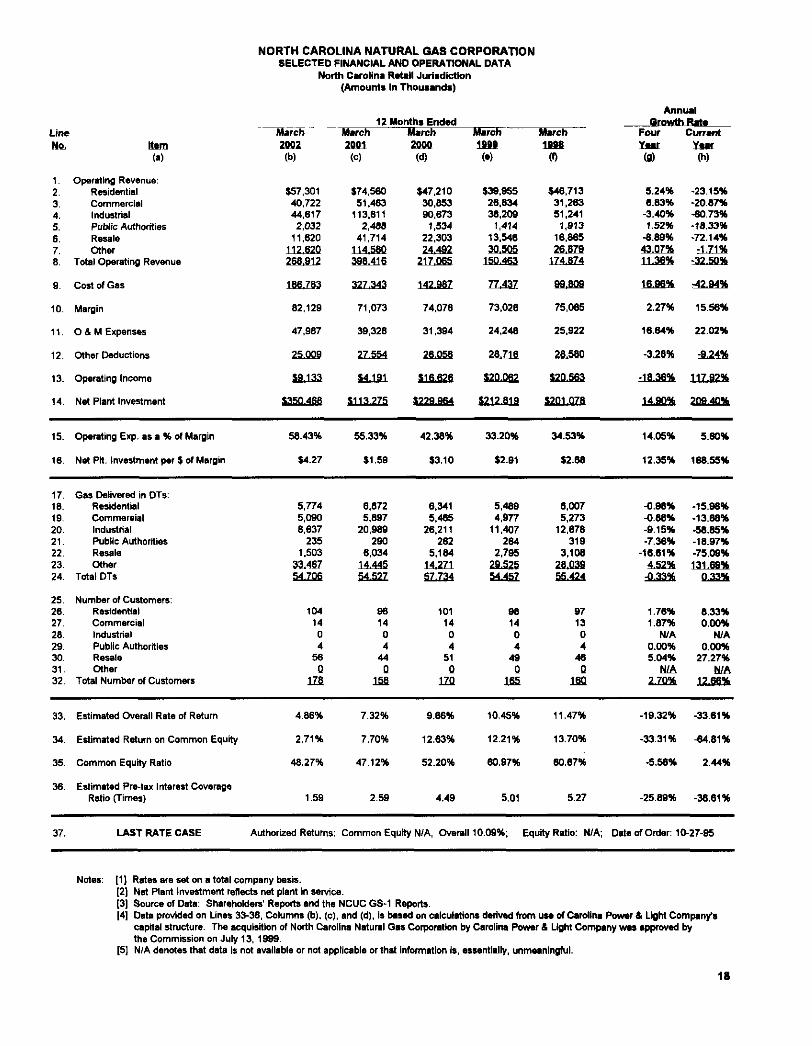
N O R T H C A R O L I N A N A T U R A L G A S C O R P O R A T I O N SELECTED FINANCIAL AND OPERATIONAL DATA
North Carolina Retail Jurisdiction (Amounts In Thousands)
Line No.
1. 2 3 4. 5. 6. 7, 8.
9.
10.
11.
12.
13
14.
15.
16.
17. 18. 19-20. 21. 22. 23 24.
25 26 27. 28. 29. 30. 31, 32.
33,
34.
35.
36.
37.
Item (a)
Operating Revenue: Residential Commercial Industrial Public Authorities Resale Other
Total Operating Revenue
Cost of Gas
Margin
O & M Expenses
Other Deductions
Operating Income
Net Plant Investment
Operating Exp. as a % of Margin
Net PH. Investment per $ of Margin
Gas Delivered in DTs: Residential Commercial Industrial Public Authorities Resale Other
Total DTs
Number of Customers: Residential Commercial Industrial Public Authorities Resale Other
Total Number of Customers
Estimated Overall Rate of Return
Estimated Return on Common Equity
Common Equity Ratio
Estimated Pre-tax Interest Coverage Ratio (Times)
LAST RATE CASE
March 2002
(b)
$57,301 40.722 44,617
2,032 11.620
112520 266512
166763
82,129
47,987
25409
&133
1350.466
58.43%
$4.27
5,774 5,090 8,637
235 1.503
33.467 54 706
104 14 0 4
56 0
126
4.86%
2.71%
48.27%
1.59
Authorized Returns:
12 Months Ended March 2001
(c)
$74,560 51.463
113.611 2,488
41,714 114.580 399.4_16
327,343
71,073
36.326
27.554
14.191
£113225
55.33%
$1.59
6.872 5,897
20,989 290
6.034 14.445 5452Z
96 14
0 4
44 0
156
7.32%
7.70%
47.12%
2.59
March 2000
(d)
$47,210 30,853 90,673
1,534 22.303 24.492
217465
142.987
74.078
31,394
26456
116526
1229564
42.38%
$3.10
6,341 5.485
26.211 262
5,164 14.271 57734
101 14 0 4
51 0
170
9.66%
12.63%
52.20%
4.49
March 1999
(•)
$39,955 26.834 38,209
1,414 13.546 30.505
150463
77.437
73.026
24.248
28716
S20QS2
1212512
33.20%
$2.91
5,469 4,977
11.407 264
2.795 29525 51452
96 14 0 4
49 0
165
10.45%
12.21%
60.97%
5.01
March 1186
(»)
$46,713 31,263 51.241
1,913 16.865 26.879
174,624
99509
75,065
25.922
26580
S2Q5ffl
SiUlQZfi
34.53%
$2.66
6.007 5,273
12,678 319
3,106 28.039 55424
97 13 0 4
46 0
160
11.47%
1370%
60.67%
5.27
Common Equity N/A, Overall 10.09%; Equity Ratio: N/A;
Annual Growth Rata
Four Year
(9)
5.24% 6.83%
-3.40% 1.52%
-6.66% 43.07% 11.36%
16.96%
2.27%
16.64%
-3 28%
I l&3&%
14.90%
14.05%
12.35%
-0.96% -0.66% -9.15% -7.36%
-16.61% 4 5 2 % 452%
1.76% 1.87%
N/A 0.00% 5.04%
N/A 270%
-19.32%
-33.31%
•5.56%
-25 89%
Current Year
(h)
-23.15% -20.67% -8073% -16.33% 72.14%
-1.71% -32.50%
-42.94%
15.56%
22 02%
-824%
11252%
20040%
5.60%
168.55%
-15.98% -13.68% -58.85% -18.97% -75.09% 131.69%
0 3 3 %
8.33% 0.00%
N/A 0.00%
27.27% N/A
12.66%
-33.61%
-64.81%
2 44%
-36.61%
Date of Order: 10-27-95
Notes: [1] Rates are set on a total company basis. [2] Net Plant Investment reflects net plant in sen/ice. [3] Source of Data: Shareholders'Reports and the NCUC GS-1 Reports. [4] Data provided on Lines 33-36, Columns (b). (c), and (d). is based on calculations derived from use of Carolina Power & Light Company's
capital structure. The acquisition of North Carolina Natural Gas Corporation by Carolina Power & Light Company was approved by the Commission on July 13,1999.
[S] N/A denotes that data is not available or not applicable or that information Is, essentially, unmeaningful.
18

PIEDMONT NATURAL GAS COMPANY, INC. SELECTED FINANCIAL AND OPERATIONAL DATA
North Carolina Retail Jurisdiction (Amounts In Thousands)
Line
No,
1. 2. 3 4 5, fi 7, 8.
9
10.
11,
12.
13.
14.
15.
16.
17. 18. 19. 20. 21 . 22. 23. 24.
25. 26. 27. 28. 29-30. 31 . 32.
33.
34.
35.
36.
37.
Item (a)
Operating Revenue: Residential Commercial Industrial Public Authorities Resale Other
Total Operating Revenue
Cost of Gas
Margin
O & M Expenses
Other Deductions
Operating Income
Net Plant Investment
Operating Exp. as a % of Margin
Net Ptt. Investment per $ of Margin
Gas Delivered in DTs: Residential Commercial Industrial Public Authorities Resale Other
Total DTs
Number of Customers: Residential Commercial Industrial Public Authorities Resale Other
Total Number of Customers
Estimated Overall Rate of Return
Estimated Return on Common Equity
Common Equity Ratio
Estimated Pre-tax Interest Coverage Ratio (Times)
LAST RATE CASE
March
2002 (b)
$236,945 114,473 35,060
560 3
25.352 412593
225.233
187,160
78,423
55512
£52520
1606559
41.90%
$3.25
24,876 14,782 5,427
67 0
26222 71.424
389 43
2 1 0 0
435
8.86%
10.08%
52.77%
3.31
Authorized Returns:
12 Months Ended March
2001 (c)
$303,595 161,657 119,533
2,944 0
14.041 601770
422570
179,200
77.592
51,417
ssoiai
£565592
43.30%
$3.27
28,443 18,503 20,606
303 0
13.667 &1524
375 42
2 4 0 0
423
8.85%
9.91%
50.85%
3.07
March
2000 (d)
$202,076 107,125 88,575
2,781 0
21,729 422286
243.607
178,679
71,098
55502
151.974
15S&105
39.79%
$3.11
24,572 16.240 20,870
396 0
20,885 62563
357 41
2 6 0 0
406
10.11%
12.33%
52.92%
3.91
March 1989 (e)
$171,992 86,790 73,389
2,691 0
81.415 416.277
224.115
192,162
69,025
66.165
156522
ISQTJfia
35.92%
$2 64
22,378 14,394 20,753
424 0
50,444 106523
338 40
2 6 0 0
366
10.77%
13.25%
54.01%
4.21
: Common Equity 11.30%, Overall 9.70%;
March 1998
(0
$192,785 102,549
79,760 3,201
0 75.958
451253
265242
189,006
69,880
6452S
£54096
£485530
36.97%
$2,57
24,702 16,205 18,457
482 0
42550 102596
320 38
2 6 0 0
366
11.67%
15.05%
52.19%
4.34
Equity Ratio; 52.71%;
Annual Growth Rate
Four Year
(g)
5.29% 2 7 9 %
-18.58% -35,33%
N/A =2359%
2 5 9 %
^ . 0 1 %
-0.25%
2.93%
J 5 7 %
-0.64%
5.63%
3.18%
6.04%
0.18% -2.27%
-26.36% -38.94%
N/A =1156%
-8 .61%
5.00% 3.14% 0.00%
-36,11% N/A N/A
4,41%
-6.66%
-9.53%
0.26%
-6.55%
Current Year (h)
-21.95% -29.19% -70.87% -60.98%
N/A 6 0 5 6 %
-51.42%
-46.70%
4.44%
1,07%
875%
524%
3.96%
-3.23%
-0 .61%
-1254% -20.11% -73.67% -77.89%
N/A 9223%
d25&%
3,73% 2.38% 0.00%
-75.00% N/A M/A
2.84%
0.11%
172%
3.78%
7.82%
Date of Order: 10-5-00
Notes: {1] North Carolina retail jurisdictional revenue equates to 48% of total company gas utility revenue. [2] Net Plant Investment reflects net plant in service. [3] Source of Data: Shareholders' reports and the NCUC GS-1 Reports. [4] N/A denotes that the data is not available or not applicable or that information is, essentially, unmeaningful.
19

PUBLIC SERVICE COMPANY OF NORTH CAROUNA INC. SELECTED FINANCIAL AND OPERATIONAL DATA
North Carolina Retail Jurisdiction (Amounts In Thouaanda)
Line No,
1. 2. 3. 4. 5. 6. 7. 8.
9.
10.
11.
12.
13.
14.
15.
16.
17. 18. 19. 20. 21, 22 23. 74
25. 26. 27. 28. 29. 30 31. 32,
33.
34.
35.
36.
37.
Item (a)
Operating Revenue: Residential Commercial Industrial Public Authorities Resale Other
Total Operating Revenue
Cost of Gas
Margin
O & M Expenses
Other Deductions
Operating Income
Net Plant Investment
Operating Exp. as a % of Margin
Net Ptt. Investment per $ of Margin
Gas Delivered in DTs: Residential Commercial Industrial Public Authorities Resale Other
Total DTs
Number of Customers: Residential Commercial Industrial Public Authorities Resale Other
Total Number of Customers
Estimated Overall Rate of Return
Estimated Return on Common Equity
Common Equity Ratio
Estimated Pre-tax Interest Coverage Ratio (Times)
LAST RATE CASE
March 2002 (b)
$207,815 97,664 9,203
0 6
43,432 358 J22
192.912
165,210
70,077
61263
£33520
£542405
42.42%
$3.31
20.527 12.279 1,410
0 14
30 534 64.764
334 36 0 0 0 0
370
9.01%
10.86%
48.26%
3.26
Authorized Returns:'
12 Months Ended March 2001 (c)
$294,691 138,485 12,951
0 5
42542 493.974
322.110
171,864
67,157
60859
£35548
£483501
39.08%
$2.81
25,114 14,760 1,536
0 0
30,224 71.634
326 44 2 0 0 0
372
11.25%
15.27%
48.52%
4.16
March 2000
(d)
$199,641 87.642 8,943
0 0
42,216 330442
160206
169,736
67,403
59,419
$42914
1503560
39.71%
$2,97
22.033 13,264 1,653
0 0
33 363 70.313
313 43 2 0 0 0
356
11.13%
15.12%
48.18%
4.11
March 1888 (e)
$172,731 75,268 6,406
0 0
39,804 294211
136570
157,541
66,770
55.095
$25526
1420522
42.38%
$3.05
19,254 11.812 1,219
0 0
30,690 63.175
299 42 2 0 0 0
343
8.39%
9.07%
49.15%
2.81
March 1888
(0
$187,596 86,427 24.707
0 0
38,380 338.120
161605
156,515
60,630
55.957
$39526
1455595
3874%
$2.98
20.934 12.705 5,012
0 0
29 544 68195
263 41
2 0 0 0
326
9.80%
11.70%
46.82%
3.26
Common Equity 11,40%, Overall 9.82%; Equity Ratio: 51.91%;
Annual Growth Rate
Four Year (g)
2.59% 3.10%
-21.88% N/A N/A
2.47% 1,45%
152%
1.36%
3.69%
229%
-4.03%
4.12%
2.29%
2.66%
-0.49% -0.85%
-27.17% N/A N/A
0 83% -1.28%
4.23% -3.20%
N/A N/A N/A N/A
3-22%
-2.08%
-1.85%
-0,29%
0.00%
Date of Order:
Current Year (h)
-29.48% -20.46% -28.94%
N/A 60.00% -922%
=2250%
-40.11%
-3.87%
4.35%
-11.03%
£ 5 2 %
13.22%
8.55%
17.79%
-18.26% -16.81%
-8.20% N/A N/A
1,03% -9 59%
2.45% -18.18%
N/A N/A N/A N/A
-0.54%
-19.91%
-28.88%
-0.54%
-21,63%
10-30-98
Notes: [1] Rates are set on a total company basis. [2] Net Plant Investment reflects net plant in servjce. [3] Source of Data: Shareholders' Reports and the NCUC GS-1 Reports. [4] N/A denotes that the data is not available or not applicable or that information is, essentially, unmeaningful.
20

ALLTEL CAROUNA INC. SELECTED FINANCIAL OPERATIONAL DATA
North Carolina Intrastate Operations (Amounts In Thousands)
Line No. Item
(a)
1. Operating Revenue: 2. Basic Local Service 3. Network Access 4. Long Distance Message 5. Miscellaneous 6- Uncoilectibles 7. Total Operating Revenue
8. Operating Expenses 9. Depreciation & Amortization
10. Total Operating Taxes 11. Total Expenses, Depr. & Taxes
12. Other Operating (Income) & Expense
13. Operating Income
14. Net Plant Investment
December 2Q01
(b)
$73,312 25.599
4,380 4,262
C9321 106521
43,465 18,153 17,046 78.664
0
£22552
115543&
12 Months Ended December
2000 (c)
$69,646 24,875 5,035 3,994 (5111
103241
47,321 17,499 14,894 79.714
0
£20522
1150544
December 1888 (d)
$63,217 21,166
5,643 3,636 (564)
93496
46,647 16,157 11529 74.683
0
$18,415
£152569
December 1888 (a)
$63,267 20,200 5,496 3.577 (5801
91,962
42,171 15,276 13.434 70.881
0
$21.081
1145551
December 1997
(0
$57,628 20,706 5,403 2,477 (278)
85.936
39,913 14,026 12,171 fifUlfl
0
£19526
1145.745
Annual Growth Rate
Four Year (g)
6.20% 5.45%
-5.11% 14.53% 35.31% 5.54%
2.15% 6.66% 8 79% 4.44%
N/A
552%
015%
Current Year (h)
4.96% 2.91%
-13.01% 6.71%
82.39% 322%
-8.15% 3.74%
14,45% -1-32%
N/A
10&3%
2 5 1 %
15. Oper. Exp. as a % of Total Revenue
16. Net PH. Investment per $ of Revenue
40.77%
$1.55
45.84%
$1,56
50.11%
$1.65
45.86%
$1.59
46.45%
$1.70
-3.21%
-2.28%
-11.06%
-0.64%
17. Local Access Lines: 18. Residential 19. Business 20. Total Local Access Lines
2 1 . Total Access Lines: 22. Residential 23. Business 24. Total Access Lines
181 55
236
181 55
£36
178 55
233
178 55
233
169 52
221
169 52
221
158 49
202
158 49
202
147 45
192
147 45
192
5.34% 514% 5.29%
5.34% 514% 529%
1.69% 0,00% 1.29%
1.69% 0,00% 129%
25. Estimated Overall Rate of Return
26- Estimated Return on Common Equity
27, Common Equity Ratio
28. Estimated Pre-tax Interest Coverage Ratio (Times)
16.59% 16.35%
18.90% 18.00%
72.31% 67.00%
5.53 5.65
13.52%
14.90%
65.39%
4.24
16.01% 15.71%
20.65% 20.90%
61 69% 60.78%
7.24 6.45
4.30% 1370%
-2.46% 5.00%
4.44% 7.93%
-3.77% -2.12%
29. LAST RATE CASE Authorized Retum8:Common Equity 13.20%, Overall 10.33%; Equity Ratio: 42.11%; Date of Order: 11-25-86
Notes: [1] North Carolina intrastate revenue, i.e., jurisdictional revenue equates to approximately 79% of total North Carolina revenue, i.e., intrastate and interstate revenue.
[2] Net Plant Investment reflects net plant in sen/ice. [3] Source of Data: NCUC TS-1 Reports. [4] ALLTEL Carolina, Inc. has elected price regulation. Under that election the information on which this report Is
based is filed on an annual calendar-year basis for reporting periods beginning after June 30,1996. The data for ALLTEL Carolina, Inc. included herein is updated annually beginning with the calendar year 1996.
[5] N/A denotes that the data is not available or not applicable or that information is, essentially, unmeaningful.
21

Line No.
1. 2. 3. 4. 5. 6.
Item (a)
Operating Revenue: Basic Local Service Network Access Long Distance Message Miscellaneous Uncoilectibles
7. Total Operating Revenue
8. Operating Expenses 9. Depreciation & Amortization
10. Total Operating Taxes 11. Total Expenses, Depr. & Taxes
12. Other Operating (Income) & Expense
13. Operating Income
14. Net Plant Investment
BELLSOUTH TELECOMMUNICATIONS, INC. SELECTED FINANCIAL AND OPERATIONAL DATA
North Carolina Intrastate Operations (Amounts In Thousands)
December 2001 (b)
$1,074,258 99,455 27,061 75,050
(20.163) 1,255.661
527.844 342,955 162,140
1,032.939
(350)
1223422
SI 93? 824
12 Months Ended December
2000 (c)
$1,068.769 115,247 27,714 66,612 (10.093)
1268249
448,878 343,992 195495 987.965
am 1280531
11931005
December 1999 (d)
$1,035,846 144,537 35.137 58,366 (9,1021
1,264.784
457,763 310,910 200,530 969,203
46
1295535
115695S2
December 1898 (e)
$955,410 158,061 42,476 47,596 (6,300)
1.197.243
463,029 291,352 166,120 920.5Q1
(5301
1277272
11563J34
December 1887
(0
$871,804 159,274 49,446 37,573
(13,664) 1.104.413
457,536 290,581 164.263 912580
96
£191535
11564562
Annual Growth Rate Four Year (g)
5.36% -11.11% -13.99% 18,86% 10,18% 326%
3.64% 4 23%
=052% 3.15%
N/A
353%
090%
Current Year (h)
0.51% -13.70% -2.36% 12.67% 99.77% -0.99%
17.59% -0.30%
-16.89% 4.55%
4170%
2048%
ooa%
15. Oper. Exp. as a % of Total Revenue
16. Net PH. Investment per $ of Revenue
42,04%
$1.54
35.39%
$1.52
36.19%
$1.48
38.67%
$1.56
41.43%
$1.69
0.37%
-2.30%
18.79%
1.32%
17. Local Access Lines: 18. Residential 19. Business 20. Total Local Access Lines
21. Total Access Lines: 22. Residential 23. Business 24. Total Access Lines
1.664 767
2,431
1,673 769
2.442
1,690 705
2.395
1,690 714
2.404
1,667 694
2.361
1667 696
2565
1,600 666
2266
1,600 690
2290
1.524 657
2.181
1,524 663
2062
2.22% -1.54% 355% 8.79% L25% 150%
2.36% -1.01% 376% 7.70% 250% 156%
25. Estimated Overall Rate of Return
26. Estimated Return on Common Equity
27. Common Equity Ratio
28- Estimated Pre-tax Interest Coverage Ratio (Times)
13.38% 17.13%
19.14% 25.61%
56.16% 55.01%
778 8.67
18.37%
2775%
55,12%
9.08
17.19% 11.95%
25.24% 16.15%
57.55% 57.38%
9.30 7.30
2.87% -21.89%
4.34% -25.26%
-0.54% 2.09%
1.60% -10.27%
29. LAST RATE CASE Authorized Returns: Common Equity 15.00%, Overall 12.51%; Equity Ratio: 54.80%; Date of Order: 11-9-84
Notes: [1] North Carolina intrastate revenue, i.e., Jurisdictional revenue, equates to approximately 69% of total North Carolina revenue, i.e.. intrastate and interstate revenue.
[2] Net Plant Investment reflects net plant in service. [3] Source of Data: NCUC TS-1 Reports. [4] BellSouth Telecommunications. Inc. has elected price regulation. Under that election the information on which this
report is based is filed on an annual calendar-year basis for reporting periods beginning after June 30, 1996. The data for BellSouth Telecommunications, Inc. included herein is updated annually beginning with the calendar year 1996.
[5] N/A denotes that the data is not available or not applicable or that information Is, essentially, unmeaningful.
22

CAROLINA TELEPHONE AND TELEGRAPH COMPANY SELECTED FINANCIAL AND OPERATIONAL DATA
North Carolina Intrastate Operations (Amounts In Thousands)
Line No. Item
(a)
1. Operating Revenue: 2. Basic Local Sen'ice 3. Network Access 4. Long Distance Message 5. Miscellaneous 6. Uncoilectibles 7. Total Operating Revenue
8. Operating Expenses 9. Depreciation & Amortization
10. Total Operating Taxes 11. Total Expenses, Depr. 8. Taxes
12. Operating Income
13. Net Plant Investment
December 2001 (b)
$420,406 99,482 12,692 40.937 (14,2661 559.451
256,996 136,568 69,301
462,967
195564
1229J35
12 Months Ended December
2000 (c)
$411,137 110,536 18.286 36,815 (5506)
570568
247.280 143,427 76,060
466.767
1104201
1&35556
December 1888 (d)
$392,091 86,775 24,172 32,335 (6,665)
529J08
281,126 134,968 47,966
4644S2
164545
1S2&424
December 1888 (•)
$360,990 89,606 24,436 34,582 (5,716)
503598
259,881 129,667 50,037
439525
1S4512
1S42JQ2
December 188Z (0
$338,306 88,775 32,804 45.277 (6,6621
498.495
250,852 123,663 52,515
427430
171.465
1661595
Annual Growth Rate Four Year (g)
5,58% 2.89%
-20.82% -2.49% 20 95% 253%
0.61% 2.51% 7.18% 2,04%
Z52%
420%
Current Year (h)
2.25% -10.00% -29.50% 11.20%
145J1% -242%
3.93% -4.78% -8,89% -0.84%
-7.31%
22.61%
14. Oper. Exp. as a % of Total Revenue
15. Net Pit. Investment per $ of Revenue
45.94%
$1.39
43.31%
$1.11
53.17%
$1.18
51.57%
$1.28
50.32%
$1.33
-2.25%
1.24%
6.07%
25.13%
16. Local Access Lines: 17. Residential 18. Business 19. Total Local Access Lines
20. Total Access Lines: 21. Residential 22. Business 23. Total Access Lines
910 303
1213
910 304
1.214
917 309
1226
917 310
122Z
681 297
1,178
661 298
1.179
644 284
112S
844 285
U29
813 259
1472
813 260
1.073
2.86% 440% 3.14%
2.86% 3,99% 3.13%
-076% =194% -106%
-0.76% -1.94% -1.06%
24. Estimated Overall Rate of Return
25. Estimated Return on Common Equily
26. Common Equity Ratio
27. Estimated Pre-tax Interest Coverage Ratio (Times)
16.53% 17.81%
22.72% 25.05%
63.21% 61.20%
11.65 11.12
12.36%
15.96%
62.08%
7.35
11.69% 12.53%
15.10% 16.59%
62.09% 6075%
7.59 7.65
7.17% -7.19%
8.18% -9.30%
1.00% 3.28%
11.09% 4.77%
28. LAST RATE CASE Authorized Returns: Common Equity 15.25%, Overall 11.62%; Equity Ratio: 48.40%; Date of Order: 3-30-63
Notes: [1] North Carolina intrastate revenue, i.e., jurisdictional revenue, equates to approximately 82% of total NorthCarolina revenue, i.e., intrastate and interstate revenue.
[2] Net Plant Investment reflects net plant in sen/ice. [3] Source of Data: NCUC TS-1 Reports. [4] Carolina Telephone and Telegraph Company has elected price regulation. Under that election the information on which this
report Is based is filed on an annual calendar-year basis for reporting periods beginning after June 30,1996. The data for Carolina Telephone and Telegraph Company included herein is updated annually beginning with the calendar year 1996.
23
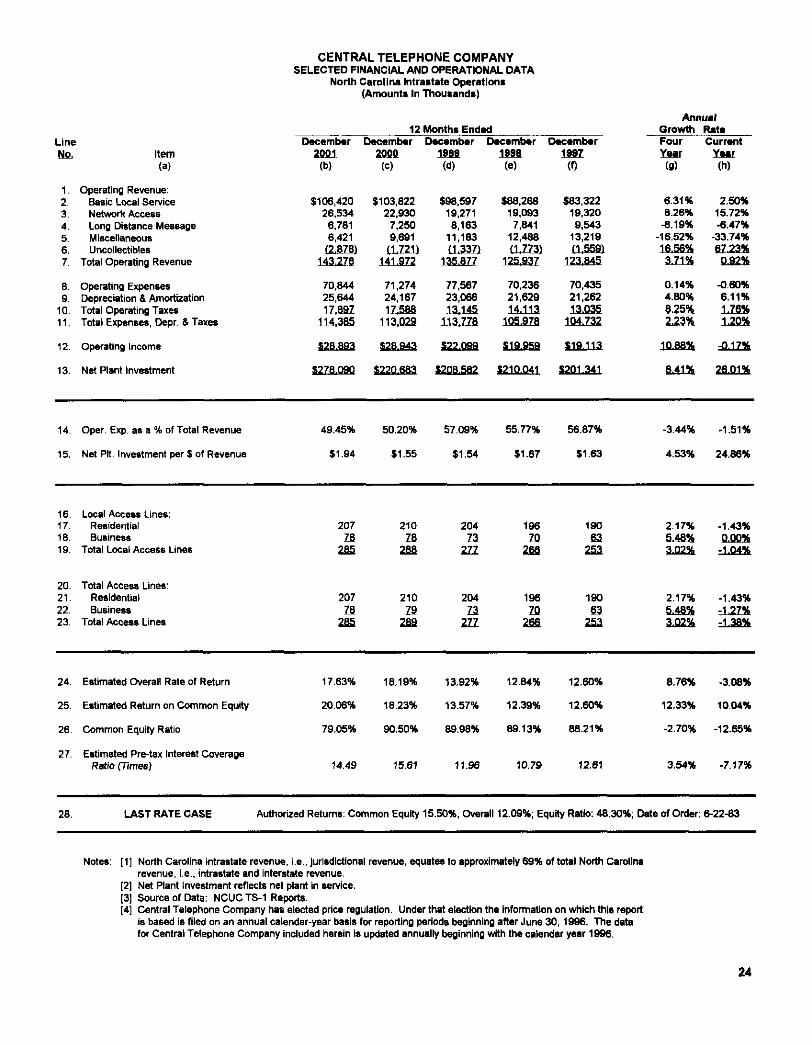
CENTRAL TELEPHONE COMPANY SELECTED FINANCIAL AND OPERATIONAL DATA
North Carolina Intrastate Operations (Amounts In Thousands)
Line No,
1. 2. 3. 4. 5. 6.
Item (a)
Operating Revenue: Basic Local Service Network Access Long Distance Message Miscellaneous Uncoilectibles
7. Total Operating Revenue
8. Operating Expenses 9. Depreciation & Amortization
10. Total Operating Taxes 11. Total Expenses, Depr. & Taxes
12. Operating Income
13. Net Plant Investment
December 2001 (b)
$106,420 26,534 6,781 6,421 (2578)
143.278
70,844 25,644 17,892
114.385
128593
1228490
12 Months Ended December
2000 (c)
$103,622 22,930
7,250 9,691 (1721)
141.972
71.274 24,167 17,588
113,029
$28543
1220563
December 1859 (d)
$98,597 19,271 8,163
11,183 (1.337)
135,677
77,567 23,066 13,145
113,778
122499
$200562
December 1886 (e)
$88,288 19,093 7,841
12,486 (1.773)
125532
70,236 21,629 14,113
105.978
£19559
1210541
December 1887
(0
$83,322 19,320 9,543
13,219 (1.559)
123545
70,435 21.262 13,035
104.732
$19,113
£201541
Annual Growth Rate Four Year (g)
6.31% 8.26%
-8.19% -16.52% 16,56%
371%
0.14% 4.80% 8.25% 223%
1058%
6.41%
Current Year (h)
2.50% 1572% -6.47%
-33.74% 6223%
052%
-0 60% 6.11% 176% 120%
-0.17%
2641%
14. Oper. Exp. as a % of Total Revenue
15. Net PR. Investment per $ of Revenue
49.45%
$1.94
50.20%
$1.55
57.09%
$1.54
55.77%
$1.67
56.87%
$1.63
-3.44%
4.53%
-1.51%
24.86%
16. Local Access Lines: 17. Residential 18. Business 19. Total Local Access Lines
20. Total Access Lines: 21. Residential 22. Business 23. Total Access Lines
207 Z8
265
207 28
225
210 26
268
210 29
289
204 23
277
204 23
222
196 20
266
196 20
2SS
190 63
253
190 63
253
2.17% 5.48% 3.02%
2.17% 5.48% 342%
-1.43% 0,00%
-1.04%
-1.43% -127% -1.38%
24. Estimated Overall Rate of Return
25. Estimated Return on Common Equity
26. Common Equity Ratio
27. Estimated Pre-tax Interest Coverage Ratio (Times)
17.63% 18.19%
20.06% 18.23%
79.05% 90.50%
14.49 15.61
13.92%
13.57%
89.98%
11.96
12.84% 12.60%
12.39% 12.60%
89.13% 88.21%
10.79 12.61
876% -3.08%
12.33% 10.04%
-2.70% -12.65%
3.54% -7.17%
28. LAST RATE CASE Authorized Returns: Common Equity 15.50%, Overall 12.09%; Equity Ratio: 48.30%; Date of Order: 6-22-83
Notes: [1] NorthCarolina intrastate revenue, i.e., Jurisdictional revenue, equates to approximately 69% of total North Carolina revenue, i.e., intrastate and interstate revenue.
[2] Net Plant Investment reflects net plant in service. [3] Source of Data: NCUC TS-1 Reports. [4] Central Telephone Company has elected price regulation. Under that election the information on which this report
is based is filed on an annual calendar-year basis for reporting periods beginning after June 30, 1996. The data for Central Telephone Company included herein is updated annually beginning with the calendar year 1996.
24

Line No.
1. 2. 3. 4. 5. 6.
Item (a)
Operating Revenue: Basic Local Service Network Access Long Distance Message Miscellaneous Uncoilectibles
7. Total Operating Revenue
8. Operating Expenses 9. Depreciation & Amortization
10. Total Operating Taxes 11. Total Expenses, Depr. & Taxes
12. Operating Income
13. Net Plant Investment
CITIZENS TELEPHONE COMPANY SELECTED FINANCIAL AND OPERATIONAL DATA
North Carolina Intrastate Operations (Amounts In Thousands)
March 2002 (b)
$5,684 3,613 1,304 1,062
(201 11543
4,398 2,285 1720 6,403
£3240
$23525
12 Months Ended March 2001 (c)
$5,361 3,093 1,346 1,051
(131 10,838
4,454 3,608
915 8,977
S1861
$21552
March 2000 (d)
$4,807 3,830 1,238
885 (121
10.748
4,260 1,653 1,845 7756
£2530
120526
March 1999 (e)
$4,672 3.634 1,164
870 (19)
10521
4,074 2,452 1234 2J6Q
$2.561 '
110223
March 1888
(f)
$4,351 3,433 1,144
820 (311
9.717
3,876 2,643
983 2502
$2215
117.479
Annual Growth Rate Four Year (g)
6.91% 1.29% 3.33% 6.66%
-10.38% 452%
3.21% -3,57% 15,01% 256%
852%
259%
Current Year (h)
6.02% 16.81% -3.12% 1.05%
53,85% 7.43%
-1.26% -36.67% 67.98% =659%
7410%
950%
14. Oper. Exp. as a % of Total Revenue
15. Net Ptt. Investment per $ of Revenue
37.77%
$2.03
41.10%
$2.00
39.64%
$1.91
39.47%
$1.81
39.89%
$1.80
-1.36%
3.05%
-8.10%
1.50%
16. Local Access Lines: 17. Residential 18. Business 19. Total Local Access Lines
20. Total Access Lines: 21. Residential 22. Business 23. Total Access Lines
17 4
21
17 4
21
17 4
21
17 4
21
16 4
20
16 4
20
16 4
20
16 4
20
15 3
15
15 3
Ifi
3.18% 746% 3.93%
3.18% 746% 353%
0.00% 0.00% 0.00%
0.00% 0,00% 040%
24. Estimated Overall Rate of Return
25. Estimated Return on Common Equity
26. Common Equity Ratio
27. Estimated Pre-tax Interest Coverage Ratio (Times)
13.95% 8.44%
16.73% 6,54%
66.84% 64.98%
7,25 4.13
15.76%
20.26%
62.43%
7.25
14.03% 12.86%
18.08% 16.64%
59.01% 55.68%
5.67 4.75
2.05% 65.28%
0.13% 95.90%
4.67% 2.86%
11.15% 75.54%
28. LAST RATE CASE Authorized Returns: Common Equity 12.70%, Overall 10.11%; Equity Ratio: 44.95%; Date of Order: 2-26-91
Notes: [1] North Carolina intrastate revenue, i.e., jurisdictional revenue equates to approximately 72% of total NorthCarolina revenue, i.e.. intrastate and interstate revenue.
[2] Net Plant Investment reflects net plant in service. [3] Source of Data: NCUC TS-1 Reports,
25

Line No,
1. 2. 3. 4. 5. 6.
Item (a)
Operating Revenue: Basic Local Service Network Access Long Distance Message Miscellaneous Uncoilectibles
7. Total Operating Revenue
8. Operating Expenses 9. Depreciation & Amortization
10. Total Operating Taxes 11. Total Expenses. Depr. & Taxes
12. Operating Income
13. Net Plant Investment
CONCORD TELEPHONE COMPANY SELECTED FINANCIAL AND OPERATIONAL DATA
North Carolina Intrastate Operations (Amounts In Thousands)
2001 (b)
$45,366 6.582 4.565 7,035 (270)
63298
29,255 16,495 8,133
53583
19415
123565
12 Months Ended December
2000 (c)
$42,387 6,907 5,020 7,736 (24U
61.809
29.087 15,434 7596
52.517
19292
$73 143
December 1888 (d)
$38,190 6,639 4,739 7.264 (1781
50654
28,107 11,532 7510
47,449
19205
154582
December 1998 (e)
$35,129 5,836 4,937 6.970
031 52J99
27,025 11,966 6,544
45.537
12262
1SQ544
December 1997
(0
$29,962 5,351 7.113 6,274 (165)
48,535
24,581 6,881 7,739
39201
$0334
163501
Annual Growth Rate Four YMF (g)
10.94% 5.31%
-10.50% 2.90%
13.14% 656%
4.45% 24.43%
1,25% 026%
022%
076%
Current Year (h)
7.08% -4.71% -9.06% -9.06% 12,03%
2.41%
0.58% 6.87% 1.71% 250%
152%
112%
14. Oper Exp. as a % of Total Revenue
15. Net Pit. Investment per $ of Revenue
46.22%
$1.17
47.06%
$1.16
49.61%
$1.15
51.18%
$1,15
50.65%
$1.31
-2.26%
-279%
-1.78%
-0.85%
16- Local Access Lines: 17. Residential 18. Business 19. Total Local Access Lines
20. Total Access Lines: 21. Residential 22. Business 23- Total Access Unes
91 26
117
91 26
i l l
91 27
118
91 22
115
88 25
113
88 25
113
84 24
106
84 24
IQS
79 23
102
79
102
3.60% 011% 3.49%
3.60% 011% 349%
0.00% -3 70% -0.65%
0.00% =070% £55%
24. Estimated Overall Rate of Return
25. Estimated Return on Common Equity
26. Common Equity Ratio
27. Estimated Pre-tax Interest Coverage Ratio (Times)
14.53% 15.98%
14.47% 19.24%
66,38% 71.44%
5.01 11.88
18.12%
2176%
75.41%
17,89
15.82% 20.39%
18.21% 22.92%
78.06% 84.96%
16.77 42.30
-8.12% -9.07%
-10.86% -24.79%
-5.98% -7.08%
-41.34% -57.83%
28. LAST RATE CASE Authorized Returns: Common Equity 15.50%, Overall 12.11%; Equity Ratio: 58.59%; Date of Order: 6-17-83
Notes: [1 ] North Carolina intrastate revenue, i.e., jurisdictional revenue equates to approximately 78% of total North Carolina revenue, i.e., intrastate and Interstate revenue.
[2] Net Plant Investment reflects net plant in service. [3] Source of Data: NCUC TS-1 Reports, [4] Concord Telephone Company has elected price regulation. Under that election the information on which this report
is based is filed on an annual calendar-year basis for reporting periods beginning after June 30,1997, The data for Concord Telephone Company Included herein is updated annually beginning with the calendar year 1997.
26

Line No. Item
(a)
1. Operating Revenue: 2. Basic Local Sen/ice 3. Network Access 4. Long Distance Message 5. Miscellaneous 6. Uncoilectibles 7. Total Operating Revenue
8. Operating Expenses 9. Depreciation & Amortization
10. Total Operating Taxes 11. Total Expenses, Depr. & Taxes
12. Operating Income
13. Net Plant Investment
LEXCOM TELEPHONE COMPANY SELECTED FINANCIAL AND OPERATIONAL DATA
Total Company Utility Operations (Amounts In Thousands)
March 2002 (b)
$14,187 4,205
326 2,856 (3331
21243
7,468 3,655 5540
15.6S
$4 560
mM6
12 Months Ended March 2901 (c)
$12,463 3,233
357 3.887 0261
19.814
7,621 3,416 5,060
16,097
S3 717
$37,941
March 2000 (d)
$12,026 3,035
437 3,455 (173)
18.780
8.375 3,070 4,677
15022
$2 658
$36.306
March 1888 (e)
$10,770 2,908
491 3,187 (176)
17.180
9,401 2,660 4,136
16,199
$981
$34506
March 1888
(f)
$10,107 2,867
625 2,950 (1471
16402
8,716 3,516 2.674
15.106
$1996
$32 135
Annual Growth Rata Four Year (g)
8.85% 10.05%
-14.89% -0.81% 2256%
658%
-3.79% 0.97%
17.83% 2.48%
37 11%
450%
Current Year (h)
13.83% 30.06% -8.12%
-26.52% 16429%
7 2 1 %
-2.01% 7.00% 9,49% 052%
» » %
138%
14. Oper. Exp. as a % of Total Revenue
15. Net Pit. Investment per $ of Revenue
35.16%
$1.81
38.46%
$1.91
44.60%
$1.93
54.72%
$2.01
53.14%
$1.96
-9.81%
-1.97%
-6.58%
-5.24%
16. Local Access Lines: 17. Residential 18. Business 19. Total Local Access Lines
24 9 33
25 10 35
25 10 35
24 10 34
23 9 32
1.07% -4.00% 0.00% =10.00% Q.77% -571%
20. Total Access Lines: 21. Residential 22. Business 23. Tota) Access Lines
24 9
33
25 11 36
25 10
24 10 34
23 9
32
1.07% -4.00% 0.00% -18.16% 077%
24. Estimated Overall Rate of Return
25. Estimated Return on Common Equity
26. Common Equity Ratio
27. Estimated Pre-tax Interest Coverage Ratio (Times)
12.57% 13.72%
12.81% 14.07%
95.65% 94.31%
67.09 60.63
9.30%
9.42%
92.56%
41.53
5.47% 5.51%
5.22% 4.90%
90.10% 81.25%
27.93 10.86
22.90% -8.38%
27.16% -8.96%
4.16% 1.42%
68.28% 43.64%
28. LAST RATE CASE Authorized Returns Common Equity 16.25%, Overall 12,77%; Equity Ratio: 37.22%; Date of Order: 6-14-82
Notes: [1 ] Rates are set on a total company basis. [2] Net Plant Investment reflects net plant in sen/ice. [31 Source of Data: NCUC TS-1 Reports.
27

MEBTEL COMMUNICATIONS SELECTED FINANCIAL AND OPERATIONAL DATA
Total Company Utility Operations (Amounts in Thousands)
Line ND.
1. 2. 3. 4. 5. 6, 7.
Item (a)
Operating Revenue: Basic Local Service Network Access Long Distance Message Miscellaneous Uncoilectibles
Total Operating Revenue
8. Operating Expenses 9. Depreciation & Amortization
10. Total Operating Taxes 11. Total Expenses, Depr. & Taxes
12. Operating Income
13. Net Plant Investment
December 2001 (b)
$3,625 4,105
365 785 (601
6520
4,240 1,003 1429 6722
$2498
£10506
12 Months Ended December
2000 (c)
$3,288 4,105
454 801 (38)
8.610
4,694 839
1.074 6,607
£2403
18554
December 1888 (d)
$2,754 3,717
739 866 29
8,105
4,970 800 802
6572
£1533
£0631
December 1998 (e)
$2,313 3,106
819 430 23
6.691
4,943 708 303
5.954
$737
1Z5&4
December 1887 (0
$2,096 3,419
608 207
(111) 6219
4,028 701 544
5273
1946
15554
Annual Growth Four Year (g)
14.68% 4.68%
-11.98% 39.55%
N/A 013%
1.29% 9.37%
28.41% 626%
2242%
1161%
Rate Current
Year (h)
10.25% 0.00%
-19.60% -2.00% 5759% 2,44%
-9.67% 19.55% 37.71%
1.74%
474%
2025%
14. Oper. Exp. as a % of Total Revenue
15. Net Pit Investment per $ of Revenue
48.07%
$1.23
54.52%
$0.99
61.32%
$1.06
73.68%
$1.15
64.77%
$1.12
-7.18%
2.37%
-11.83%
24.24%
16. Local Access Lines: 17. Residential 18. Business 19. Total Local Access Lines
9 3
12
9 3
12
9 3
12
6 2
10
6.46% 0.00% 10.67% 0 4 0 % 7-46% Q4Q%
20. Total Access Lines: 21. Residential 22. Business 23. Total Access Lines
9 3
12
9 3
12
9 3
12
8 2
10
6.46% 0.00% 10.67% 040% 7 46% 0 0 0 %
24. Estimated Overall Rate of Return
25. Estimated Return on Common Equity
26. Common Equity Ratio
27. Estimated Pre-tax Interest Coverage Ratio (Times)
18.58% 19.04%
18.58% 22.37%
100.00% 6077%
0.00 5.01
17.95%
55.31%
23.07%
4.96
10.06% 15.01%
12.74% 23.94%
25.06% 49.89%
1.75 7.08
5.46% -2.42%
-6.14% -16.94%
18.99% 64.55%
N/A N/A
28 LAST RATE CASE Authorized Returns: Common Equity 16.50%, Overall 5.92%; Equity Ratlo:16.92%; Date of Order: 11-26-79
Notes: [1] Rates are set on a total company basis. [2] Net Plant Investment reflects net plant in service. [3] Source of Data: NCUC TS-1 Reports. [4] MEBTEL Communications has elected price regulation. Under that election the Information on which this report is based
is filed on an annual calendar-year basis for reporting periods beginning after September 30,1999. The data for MEBTEL Communications Included herein is updated annually beginning with the calendar year 2000.
[5] MEBTEL Communications was acquired by Madison River Communications, Inc. In January 1998. [6] N/A denotes that the data is not available or not applicable or that information is, essentially, unmeaningful.
28

Line No.
1. 2. 3. 4. 5. 6.
Item (a)
Operating Revenue: Basic Local Service Network Access Long Distance Message Miscellaneous Uncoilectibles
7. Total Operating Revenue
6. Operating Expenses 9. Depreciation & Amortization
10- Total Operating Taxes
11. Total Expenses, Depr. & Taxes
12. Other Operating (Income) & Expense
13. Operating Income
14. Net Plant Investment
NORTH STATE COMMUNICATIONS SELECTED FINANCIAL AND OPERATIONAL DATA
Total Company Utility Operations (Amounts In Thousands)
March 2002 (b)
$35,896 33,749
2,092 7,456
(1 213) 77.980
34,037 17.339 11,207 625S3
(3991
115.796
S114336
12 Months Ended March 2001 (c)
$35,626 32,894
2,057 8,265 (6291
78.013
31,385 15,701 13.365 60,451
(1691
$17 731
1U35J99
March 2000 (d)
$33,389 30,855
1,946 7,882 (6901
73,184
30,772 13,233 12,562 56.587
029)
110226
$95523
March 1889 (•)
$29,903 29,409 2,123 7,514 (640)
68509
30,667 13,227 10,490 54404
0201
$14 075
105565
March 1998
(0
$27,667 28,281
2,191 7,146 (645)
64,640
27,002 15,790 9,597
52.389
(32*1
112580
152510
Annual Growth Rate Four Year (0)
6.73% 4.52%
-1.15% 1.07%
17.10% 4.80%
5.96% 2.37% 355% 455%
454%
556%
040%
Current Year (h)
076% 2.60% 170%
-9.79% 4652% -0.04%
6.45% 10.43%
-16.15% 353%
136.09%
-10.91%
002%
15, Oper. Exp. as a % of Total Revenue
16. Net PR. Investment per $ of Revenue
43.65%
$1.47
40.23%
$1.36
42.05%
$1.31
44.92%
$1.25
41.77%
$1.28
1.10%
3.43%
8.50%
8.11%
17. Local Access Lines: 18. Residential 19. Business 20. Total Local Access Lines
21. Total Access Lines: 22. Residential 23. Business 24. Total Access Lines
86 46
134
86 48
124
86 48
136
88 48
136
87 46
133
87 46
133
84 42
126
84 42
125
80 38
Ufl
80 36
na
1.82% 641% 323%
1.82% 641% 023%
-2,27% 040%
-147%
-2.27% 040%
-147%
25. Estimated Overall Rate of Return
26. Estimated Return on Common Equity
27. Common Equity Ratio
28. Estimated Pre-tax Interest Coverage Ratio (Times)
14.70% 18.08%
14.91% 18.38%
97.62% 97.57%
317.15 396.65
18.71%
19.12%
96.73%
211.78
17,18% 15.95%
17.64% 16.43%
95.73% 95.14%
141.32 116.85
-2.02% -18.69%
-2.40% -18.88%
0.65% 0.05%
26.35% -20.04%
29. LAST RATE CASE Authorized Returns: Common Equity N/A, Overall N/A; Equity Ratio: N/A; Date of Order: 6-13-52
Notes: [1] Rates are set on a total company basis. [2] Net Plant Investment reflects net plant in sen/ice. [3] Source of Data: NCUC TS-1 Reports. [4] N/A denotes that data Is not available or not applicable or that information is, essentially, unmeaningful.
29

Line No.
1, 2. 3, 4, 5. 6.
Item (a)
Operating Revenue: Basic Local Sen/ice Network Access Long Distance Message Miscellaneous Uncoilectibles
7. Total Operating Revenue
6. Operating Expenses 9. Depreciation & Amortization
10. Total Operating Taxes 11 - Total Expenses. Depr. & Taxes
12. Other Operating (Income) & Expense
13. Operating Income
14. Net Plant Investment
VERIZON SOUTH INC. SELECTED FINANCIAL AND OPERATIONAL DATA
Merged North Carolina Intrastate Operations (Amounts In Thousands)
December 2001
(b)
$131,805 54,555
4.710 11.210 (4.0411
1965%
99,913 54.413 15578
169504
(536)
120623
£433500
12 Months Ended December
2000 (c)
$133,595 59,815 4,758 6,631 0436)
201563
111.257 76,742
4,435 192.434
(441
10923
£220442
December 1899 (d)
$123,017 54.976
5.226 17,215 (3,206)
197.231
93.150 72,622 14.374
180.146
119
116566
£231962
1 December
1988 (e)
$117,728 62.117
6,204 18.249 (37431
200.555
100,685 69.858
oioe 179.651
60
120,844
£340952
December 1897
(0
$111,078 57,345 9.526
15,993 (1,996)
191946
90.819 62,991 13,584
167.404
21
124521
£251566
Annual Growth Rate Four Year (fl)
4.33% -1.24%
•16.15% -8.50% 19.26%
0 7 8 %
2.41% -3.59% 3,46% 0 5 2 %
N/A
0 9 9 %
0 2 5 %
Current Year (h)
-1.49% -879% -1.01%
69.05% 17.61% -1.65%
-10.20% -29.10% 25125% -1171%
UIA
21955%
3278%
15. Oper. Exp. as a % of Total Revenue
16. Net Ptt. Investment per $ of Revenue
50.45%
$2.19
55.25%
$1.62
47.23%
$1.68
50.20%
$1.70
47,31%
$1.63
1.62%
4.53%
-8.69%
35.02%
17. Local Access Lines: 18. Residential 19. Business 20. Total Local Access Lines
21. Total Access Lines: 22. Residential 23. Business 24. Total Access Lines
253 124 377
253 312 565
252 141 393
252 322 524
244 141 385
244 251 495
231 132 363
231 214 445
221 121 342
221 196 412
3.44% 051% 2.47%
3.44% 12.32% 259%
0.40% -12,06% -4.07%
0.40% -311% -157%
25. Estimated Overall Rate of Return
26. Estimated Return on Common Equity
27. Common Equity Ratio
28. Estimated Pre-tax Interest Coverage Ratio (Times)
10.02% 2.66%
13.54% -1.99%
50.21% 52.45%
4.23 0.26
6.46%
4.36%
55.81%
2.23
6.74% 8.73%
4.50% 8.62%
60.56% 63.23%
1.81 3.56
3.51% 276.66%
11.95% -780.40%
-5.80% -4.27%
4.41% N/A
29. LAST RATE CASE Authorized Returns: Common Equity 13.90%, Overall 11.62%; Equity Ratio: 50.00%; Data of Order: 9-16-86
Notes: [1] North Carolina intrastate revenue, i.e.. jurisdictional revenue, equates to approximately 90% of total North Carolina revenue, i.e.. intrastate and interstate revenue.
[2] Net Plant investment reflects net plant in sen/ice. [3] Source of Data: NCUC TS-1 Reports except for data on Lines 2 -11 and Lines 17-24, Column (f) which are the sum total of figures
for GTE South, Inc. and GTE of North Carolina, which were being provided on a separated basis prior to January 1996. [4] Verizon South Inc., formerly known as GTE South Incorporated, has elected price regulation. Under that election the information on
which this report is based is filed on an annual calendar-year basis for reporting periods begmning after June 30,1996. The data for Verizon South Inc. included herein is updated annually beginning with the calendar year 1996.
[5] On June 30,2000, by amendment of Hs articles of incorporation, the name of GTE South Incorporated was changed to Verizon South inc. as a result of the merger between GTE Corporation and Bell Atlantic Corporation, effective August 1, 2000.
[6] N/A denotes that the data is not available or not applicable or that information is, essentially, unmeaningful.
30

Appendix A
ChiefClerk Geneva Thigpen
Commission Staff
(1 copy)
Quarterly Review Distribution Others (continued")
Mr. Bob Fountain, Director Regulatory Accounting & Administration SCANA Corporation
List
Bob Bennink Don Hoover Debbie Holder
Public Staff
Robert Gruber, Executive Director
Nat Carpenter Bill Carter Jeff Davis Tom Farmer Andy Lee Carol Stahl Ben Turner Antoinette Wike
Attomev General's Office Margaret Force
Others
( 6 copies) (11 copies) ( 3 copies)
C 1 copy) C 1 copy) (9 copies) ( 1 copy) (3 copies) ( 1 copy) C 1 copy) (1 copy) (2 copies)
Columbia, Soulh Carolina 29218
Barry L. Guy, V.P. & Controller Piedmont Natural Gas Company P. 0. Box 33068 Charlotte, North Carolina 28233
Donald F. Harrow Piedmont Natural Gas Company P. 0. Box 33068 Charlotte, North Carolina 28233
Don Hathcock BellSouth P.O. Box 30188 Charlotte, North Carolina 28230
Fredrick W. Hering North Carolina Natural Gas Corporation P.O. Box 1551-CPB 18 Raleigh, North Carolina 27602
Len S. Anthony Carolina Power & Light Company P.O. Box 1551 Raleigh, North Carolina 27602
Tom K, Austin North Carolina Electric Membership Corporation
P. O. Box 27306 Raleigh, North Carolina 27611
Johnny Bailey North Carolina Department of Revenue Ad Valorem Tax Division 501 N. Wilmington Street Raleigh, North Carolina 27640
Bruce Barkley Carolina Power & Light Company P.O. Box 1551 Raleigh, North Carolma 27602
Linda Cheatham BellSouth 128 W. Hargett Street Raleigh, North Carolina 27601
Joe W. Foster Verizon South Inc. 4100 N. Roxboro Road Durham, North Carolma 27704
John Hogshire MEBTEL Communications P. O. Box 9 Mebane, North Carolina 27302
William McAulay Public Service Company 1312 Annapolis Dr., Ste. 200 Raleigh, North Carolina 27608
Ralph McDonald Bailey & Dixon, LLP P.O. Box 1351 Raleigh, North Carolina 27602-1351
Darell Mennenga ALLTEL Telephone Corporation One Allied Drive Little Rock. Arkansas 72202
Sharon Miller CUCA 5811 Glenwood Avenue #204 Raleigh, North Carolina 27612-6260
Steve Parrott Carolina Telephone 14111 Capital Boulevard Wake Forest, North Carolina 27587
Others Ccontinuedl
Richard Reese, President LEXCOM Telephone Company P. O. Box 808 Lexington, North Carolma 27293-0808
C. A. Stadelmeier Dominion North Carolina Power P. O. Box 26666 Richmond, Virginia 23261
Ken Stonebraker Nantahala Power & Light Company P. O. Box 260 Franklin, North Carolma 28734
Don T. Stratton Duke Power, a Division of Duke Energy Corporation 422 S. Church Street Charlotte, North Carolina 28242
Samuel M. Taylor Womble, Carlyle, Sandridge & Rice, P.L.L.C.
2100 First Union Capitol Center 150 Fayetteville Street Mall P.O. Box 831 Raleigh, North Carolina 27602
Royster M. Tucker, Jr. North State Communications P. O. Box 2326 High Point, North Carolina 27261
Jerry Weikle Concord Telephone Company P. O. Box 227 Concord, North Carolina 28026-0227
Bob Wells North Carolina Telephone Alliance 3737 Glenwood Avenue Suite 100 Raleigh, North Carolina 27612
James P. West. Esquire West Law Offices, P.C. Suite 1735 Two Hannover Square 434 Fayetteville Street Mall P.O. Box 1568 Raleigh, North Carolina 27602