Embed Size (px)
Citation preview
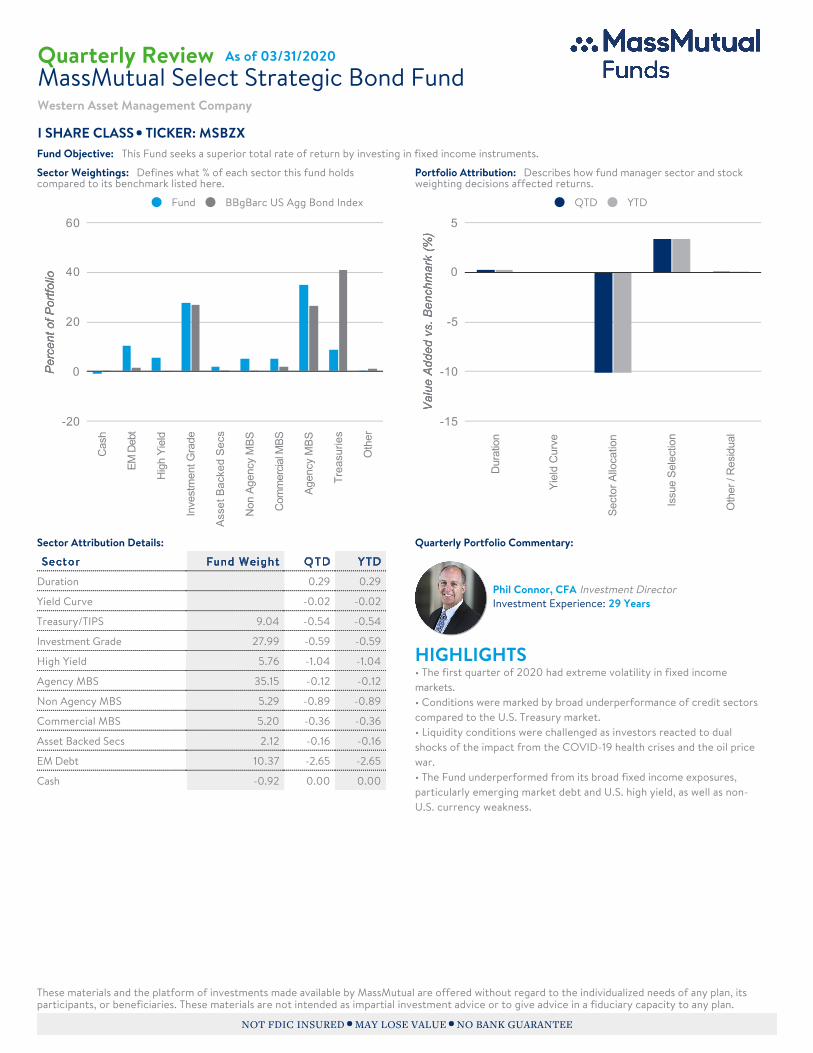
Fund BBgBarc US Agg Bond Index
Sector Weightings: Defines what % of each sector this fund holdscompared to its benchmark listed here.
QTD YTD
Portfolio Attribution: Describes how fund manager sector and stockweighting decisions affected returns.
Sector Attribution Details: Sector Fund Weight Q T D Y T D
Duration 0.29 0.29
Yield Curve -0.02 -0.02
Treasury/TIPS 9.04 -0.54 -0.54
Investment Grade 27.99 -0.59 -0.59
High Yield 5.76 -1.04 -1.04
Agency MBS 35.15 -0.12 -0.12
Non Agency MBS 5.29 -0.89 -0.89
Commercial MBS 5.20 -0.36 -0.36
Asset Backed Secs 2.12 -0.16 -0.16
EM Debt 10.37 -2.65 -2.65
Cash -0.92 0.00 0.00
Quarterly Portfolio Commentary:
Phil Connor, CFA Investment DirectorInvestment Experience: 29 Years
HIGHLIGHTS• The first quarter of 2020 had extreme volatility in fixed incomemarkets.• Conditions were marked by broad underperformance of credit sectorscompared to the U.S. Treasury market.• Liquidity conditions were challenged as investors reacted to dualshocks of the impact from the COVID-19 health crises and the oil pricewar.• The Fund underperformed from its broad fixed income exposures,particularly emerging market debt and U.S. high yield, as well as non-U.S. currency weakness.
These materials and the platform of investments made available by MassMutual are offered without regard to the individualized needs of any plan, itsparticipants, or beneficiaries. These materials are not intended as impartial investment advice or to give advice in a fiduciary capacity to any plan.
NOT FDIC INSURED MAY LOSE VALUE NO BANK GUARANTEE
Cash
EM Debt
High Yield
Investment G
rade
Asset Backed Secs
Non Agency MBS
Com
mercial MBS
Agency MBS
Treasuries
Other
-20
0
20
40
60
Percent of P
ortfolio
Percent of P
ortfolio
Duration
Yield Curve
Sector Allocation
Issue Selection
Other / Residual
-15
-10
-5
0
5
Value Added vs. Benchmark (%
)Value Added vs. Benchmark (%
)
Quarterly Review As of 03/31/2020
MassMutual Select Strategic Bond FundWestern Asset Management Company
I SHARE CLASS TICKER: MSBZXThis Fund seeks a superior total rate of return by investing in fixed income instruments.Fund Objective:

Quarterly Portfolio Commentary:
The first quarter of 2020 had extreme volatility in fixed income markets and broad underperformance of credit sectors from dual economic shocks of theCOVID-19 pandemic and an oil price war. In March, the U.S. Federal Reserve made two emergency interest rates cut and brought the Federal Fundstarget rate down to 0.00% from 1.50%. Yields of U.S. Treasury securities followed suit, although not without their own volatility. The 2-year maturityTreasury note yield dropped from 1.37% to 0.20%, while the 10-year note fell from 1.24% to 0.68%. The 10-year yield was lowest on March 9th at 0.31%(an all-time record low), and subsequently was back up to 1.18% on March 18th before settling back down into month end. Amid the volatility spike inMarch, liquidity of the fixed income market became challenged as there was dramatic redemption activity from bond mutual funds and ETFs, and buyerswere scarce. The result was extreme price pressure across the fixed income market, not only in lower credit quality areas but also in short maturity high-grade credit issues across corporate, mortgage-backed and asset-backed securities (“MBS” and “ABS” respectively). Within the Bloomberg BarclaysAggregate Bond Index benchmark, the investment grade corporate sector fared the worst with a decline of 3.63% in absolute terms and decline of 13.50%relative to comparable duration U.S. Treasuries (i.e. “excess return”). In fact, relative investment grade corporate sector performance in March was theworst ever month on record – down more than 10% and more than 2% worse than September 2008! Excess returns were negative across the board. Out-of-benchmark sectors, such as U.S. corporate high yield and the emerging market debt, declined substantially compared to investment grade sectors. Fund underperformance was substantial in the quarter, coincident with the market environment. Much of the negative attribution to the BloombergBarclays U.S. Aggregate Index benchmark was from emerging market debt holdings. This exposure, about 10.5% of Fund assets at the beginning of thequarter, consisted of about half to U.S. dollar-denominated and half to local currency (non-U.S. dollar) denominated issues. Both types were largeunderperformers in the quarter. The local currency issues consisted primarily of positions tied to the Mexican peso, Russian ruble and Brazilian real, whichall significantly weakened relative to the U.S. dollar. Some of this currency exposure was cut in the quarter amid the uncertainty. Another area ofweakness for the Fund was exposure to U.S. high yield corporate bond and bank loans, about 6% of Fund assets to start the year. Although the exposurewas modest, the substantial sell-off in these issues led to substantial negative attribution. Other areas that detracted included non-agency residential andcommercial MBS (about 11% exposure combined), and a slightly less than 2% allocation to ABS as these credit areas were not immune to the marketvolatility that characterized the quarter. Even an overweight to U.S. Agency MBS, that is a large part of the benchmark and generally considered to havehigh liquidity, was a detractor in the quarter as the sector underperformed relative to U.S. Treasuries amid the challenging environment. Liquidity of theseissues declined, but not to the extent of other credit areas. In more liquid markets, a small allocation to U.S. Treasury Inflation Protected Securities was anallocation detractor as such securities underperformed nominal Treasuries as inflation expectations fell. Finally, non-U.S. dollar exposure within the Fund,such as a Canadian dollar position, detracted as the currency fell to the U.S. dollar. Attribution from duration was a positive net contributor to results. However, duration results were overwhelmed from credit sector positioning asdiscussed above. The quarter saw some changes in the use of duration as it was trimmed relative to the benchmark in January and February then extendedin March amid the volatility in rates. In terms of outlook, Fund management views the effects of the COVID-19 as transitory and without permanent destruction of global demand. Thequestion of course is the length and magnitude of the effects. Comparisons to other shock events such as 9/11 or the global financial crises provide somecontext, but not fully. Ultimately, while recessionary conditions are present, progression of economic growth conditions are viewed as postponed ratherthan derailed.
TICKER: MSBZX Fund Inception: 12/31/2004Morningstar Category: Intermediate Core-Plus Bond
Average Annual Total Return
Q T D Y T D 1 Year 3 Year 5 Year 10 year
MassMutual Select Strategic Bond I -3.36% -3.36% 4.14% 3.40% 3.11% 4.41%
BBgBarc US Agg Bond Index 3.15% 3.15% 8.93% 4.82% 3.36% 3.88%
Category Average Returns -- -- 4.24% 3.27% 2.57% 3.87%
Category Rank -- -- 63 51 20 18
# of Funds in Category -- -- 606 530 442 331Performance shown is for class I shares. Gross expenses = 0.49%, Net expense = 0.49%. Max Sales charge for I is 0.00%
Performance shown is past performance. Past performance does not guarantee future results . You can lose money, including loss of pr incipal , by invest ing in this fund. Investors should careful ly consider investment objectives, r isks , charges and expenses. This and other important information is contained in the fund prospectuses and summary prospectuses, which can be obtained from www.massmutualfunds.com and should be read careful ly before invest ing. A l ist of the Fund’s holdings can also be obtained from www.massmutualfunds.com. Current performance may be lower or higher than return data quoted herein. For more current information, including month-end performance, please cal l 1-866-444-2601. You cannot invest directly in an index. Issues rated AAA, AA, A and BBB are considered investment grade and anything below BBB is considered non-investment grade.Pre-Inception Returns - The inception date listed is that of the oldest share class of the Fund. Performance shown subsequent to the inception dateis the actual performance of the share class. Other share classes of the investment itself have existed longer, which accounts for any pre-inception performance shown. The pre-inception performance of Class I for the periods prior to its inception date of (04/01/2014) is based on the performance of an older share class, Class R5, using the expenses and fees of Class R5 (inception date 12/31/2004). If the expenses of the newer share class was used rather than the expenses of the old share class (due to lower expenses of the new share class), it would have resulted in better performance.The Fund’s Princ ipa l R isks include - Below Investment Grade Debt Securities Risk, Cash Position Risk, Credit Risk, Defaulted and Distressed Securities Risk, Derivatives Risk, Fixed Income Securities Risk, Foreign Investment Risk; Emerging Markets Risk; Currency Risk, Frequent Trading/Portfolio Turnover Risk, Inflation Risk, Leveraging Risk, Liquidity Risk, Management Risk, Market Risk, Mortgage- and Asset-Backed Securities Risk, Sector Risk, Sovereign Debt Obligations Risk, U.S. Government Securities Risk, and Valuation Risk. Please refer to the summary prospectus (a copy can be obtained by sending an email to [email protected]) for more information on the specific risks.The Morningstar percenti le ranking is based on the fund’s total-return percenti le rank relat ive to al l funds that have the same
category for the same t ime period. The highest (or most favorable) percentile rank is 1%, and the lowest (or least favorable) percentile rank is 100%. Morningstar total return includes both income and capital gains or losses and is not adjusted for sales charges. © 2020 Morningstar, Inc. All Rights Reserved. The information contained herein: (1) is proprietary to Morningstar and/or its content providers; (2) may not be copied or distributed; and (3) is not warranted to be accurate, complete or timely. Neither Morningstar nor its content providers are responsible for any damages or losses arising from any use of this information.
MassMutual Select Strategic Bond Fund
1
2
1
2
RS9093b
© 2020 Massachusetts Mutual Life Insurance Company (MassMutual® ), Springfield, MA. All rights reserved. www.MassMutual.com Principal Underwriter:MML Distributors, LLC. (MMLD) Member FINRA and SIPC (www.FINRA.org and www.SIPC.org) MMLD is a subsidiary of Massachusetts Mutual LifeInsurance Company, 100 Bright Meadow Blvd., Enfield, CT 06082. Investment advisory services provided to the Funds by MML Investment Advisers, LLC.
RS-49227-00

THIS PAGE INTENTIONALLY LEFT BLANK


![[Plan Name] BENEFICIARY DESIGNATION - MassMutual](https://img.pdfslide.us/doc/110x75/623e8866a5510c1f0e0f4cc7/plan-name-beneficiary-designation-massmutual.jpg)