Embed Size (px)
Citation preview
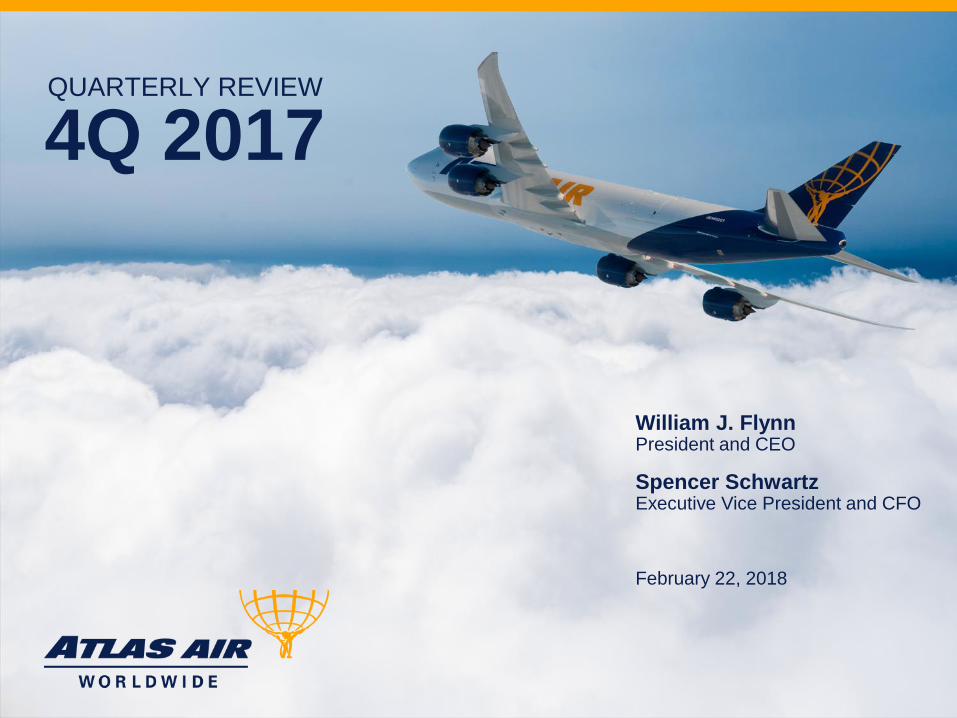
QUARTERLY REVIEW
4Q 2017
February 22, 2018
William J. Flynn President and CEO
Spencer Schwartz Executive Vice President and CFO
2
Safe Harbor
Statement
This presentation contains “forward-looking statements” within the meaning of the Private Securities Litigation Reform Act of 1995 that reflect Atlas Air Worldwide Holdings Inc.’s (“AAWW”) current views with respect to certain current and future events and financial performance. Such forward-looking statements are and will be, as the case may be, subject to many risks, uncertainties and factors relating to the operations and business environments of AAWW and its subsidiaries that may cause actual results to be materially different from any future results, express or implied, in such forward-looking statements.
For additional information, we refer you to the risk factors set forth in the documents filed by AAWW with the Securities and Exchange Commission. Other factors and assumptions not identified above are also involved in the preparation of forward-looking statements, and the failure of such other factors and assumptions to be realized may also cause actual results to differ materially from those discussed.
Such forward-looking statements speak only as of the date of this presentation. AAWW assumes no obligation to update the statements in this presentation to reflect actual results, changes in assumptions, or changes in other factors affecting such estimates, other than as required by law and expressly disclaims any obligation to revise or update publically any forward-looking statement to reflect future events or circumstances.
This presentation also includes some non-GAAP financial measures. You can find our presentations on the most directly comparable GAAP financial measures calculated in accordance with accounting principles generally accepted in the United States and our reconciliations in our earnings release dated February 22, 2018, which is posted at www.atlasair.com.

3
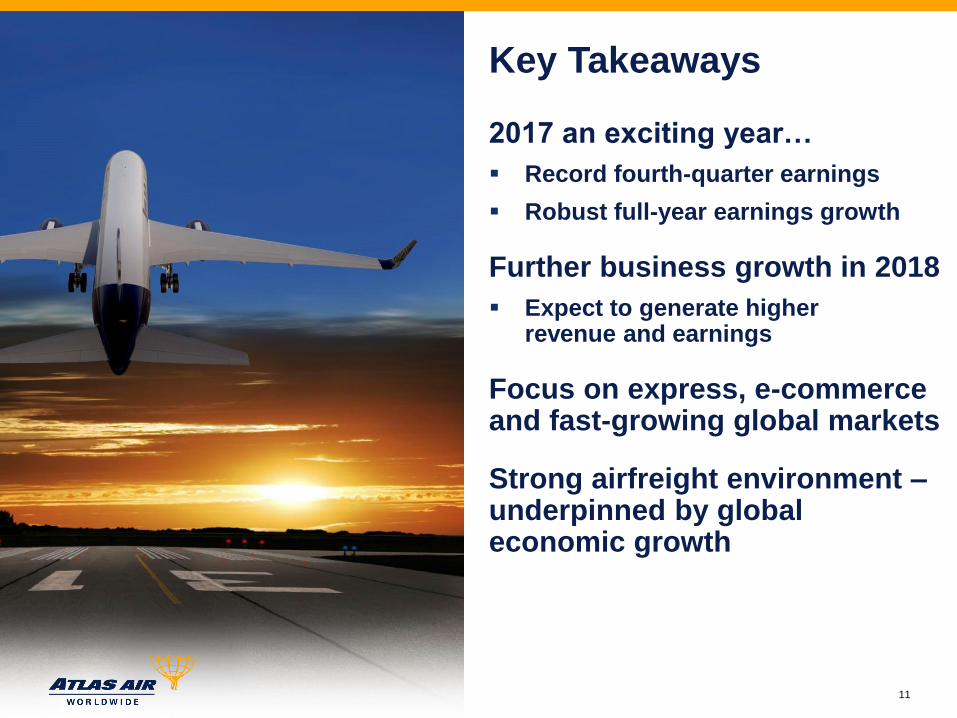
2017 an exciting year…
Record fourth-quarter earnings
Robust full-year earnings growth
Further business growth in 2018
Expect to generate higher revenue and earnings
Focus on express, e-commerce and fast-growing Asian markets
Strong airfreight environment – underpinned by global economic growth
Key Takeaways
4
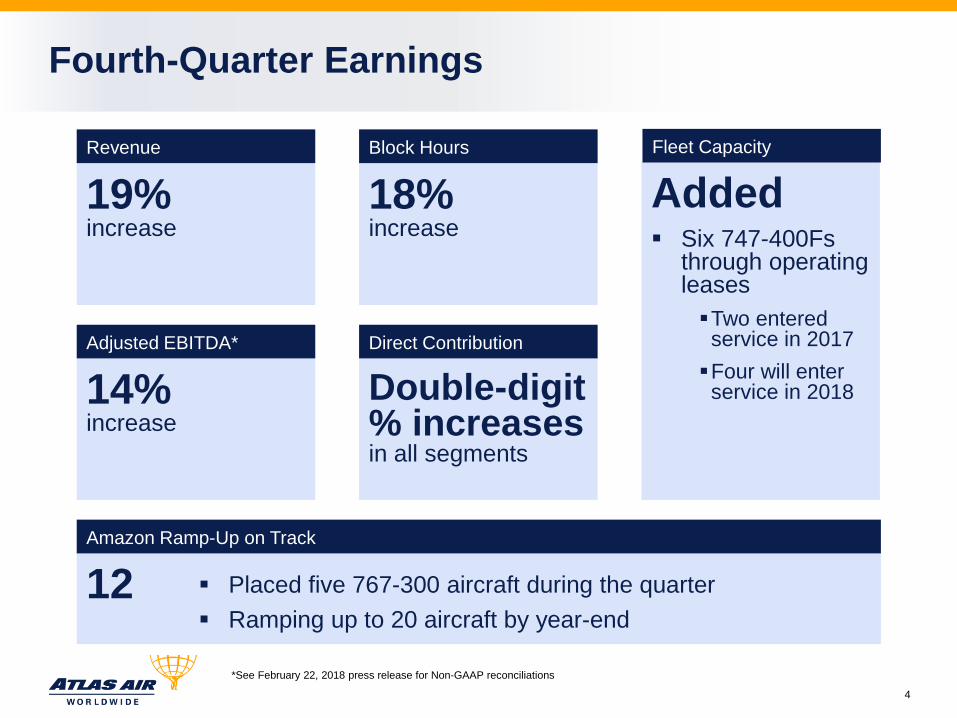
Fourth-Quarter Earnings
Added Six 747-400Fs
through operating leases
Two entered service in 2017
Four will enter service in 2018
Fleet Capacity
14% increase
Adjusted EBITDA*
19% increase
Revenue
18% increase
Block Hours
Double-digit % increases in all segments
Direct Contribution
12 Placed five 767-300 aircraft during the quarter
Ramping up to 20 aircraft by year-end
Amazon Ramp-Up on Track
*See February 22, 2018 press release for Non-GAAP reconciliations
5
2018 Framework
~19% increase to 300,000
~75% of total in ACMI
Balance in Charter
Block Hours
Revenue ~$2.5 billion
Adj. EBITDA ~$500 million
Revenue and Adj. EBITDA
Stronger company
Solid demand for our services
Business
Maint Exp ~$315 million
Depr/Amort ~$220 million
Core Capex ~$100-110 million
Other 2018 Key Items
Adj. EBITDA ~$90 million
Adj. net income to be approximately double 1Q17
1Q18 Outlook
To grow by a mid-twenty-
percent level compared with
2017
Adj. Net Income
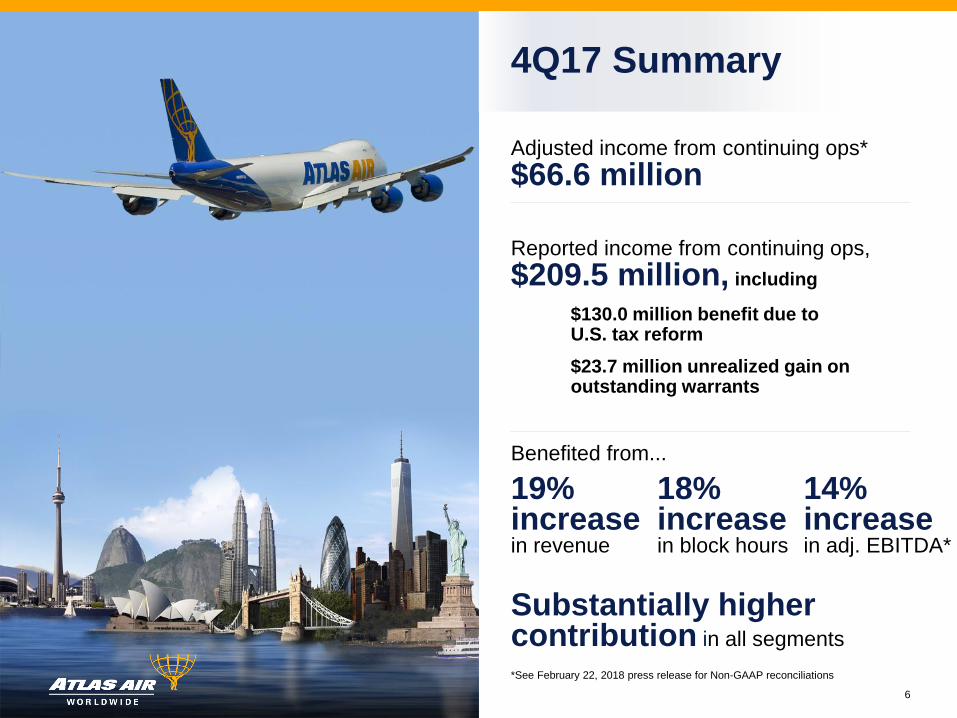
19% increase in revenue
18% increase in block hours
Substantially higher contribution in all segments
6
*See February 22, 2018 press release for Non-GAAP reconciliations
Adjusted income from continuing ops*
$66.6 million
Reported income from continuing ops,
$209.5 million, including
$130.0 million benefit due to U.S. tax reform
$23.7 million unrealized gain on outstanding warrants
Benefited from...
4Q17 Summary
14% increase in adj. EBITDA*
7
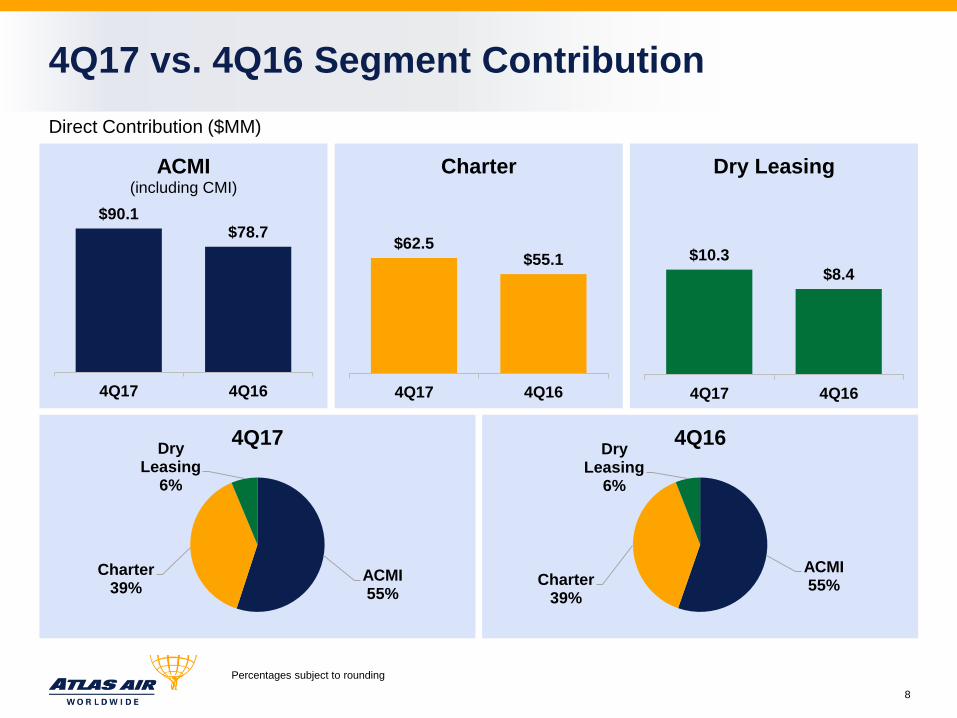
Percentages subject to rounding
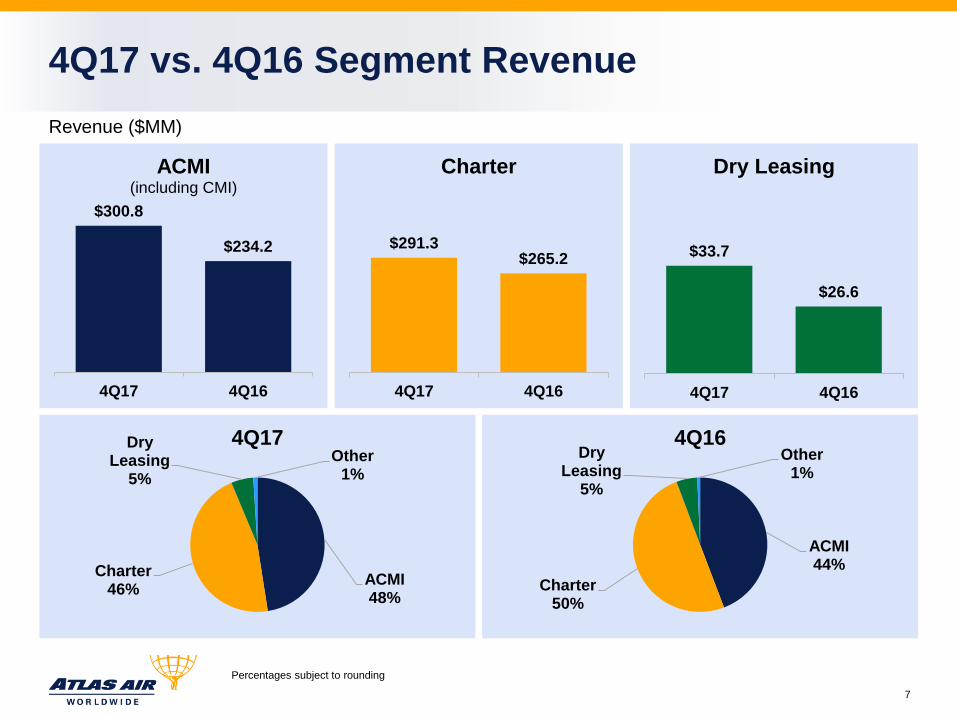
4Q17 vs. 4Q16 Segment Revenue
$300.8
$234.2
4Q17 4Q16
ACMI (including CMI)
$291.3 $265.2
4Q17 4Q16
Charter
$33.7
$26.6
4Q17 4Q16
Dry Leasing
ACMI 48%
Charter 46%
Dry Leasing
5%
Other 1%
4Q17
ACMI 44%
Charter 50%
Dry Leasing
5%
Other 1%
4Q16
Revenue ($MM)
8
Percentages subject to rounding
4Q17 vs. 4Q16 Segment Contribution
$90.1 $78.7
4Q17 4Q16
ACMI (including CMI)
$62.5 $55.1
4Q17 4Q16
Charter
$10.3
$8.4
4Q17 4Q16
Dry Leasing
ACMI 55%
Charter 39%
Dry Leasing
6%
4Q17
ACMI 55% Charter
39%
Dry Leasing
6%
4Q16
Direct Contribution ($MM)
9
*See Appendix for Non-GAAP reconciliation
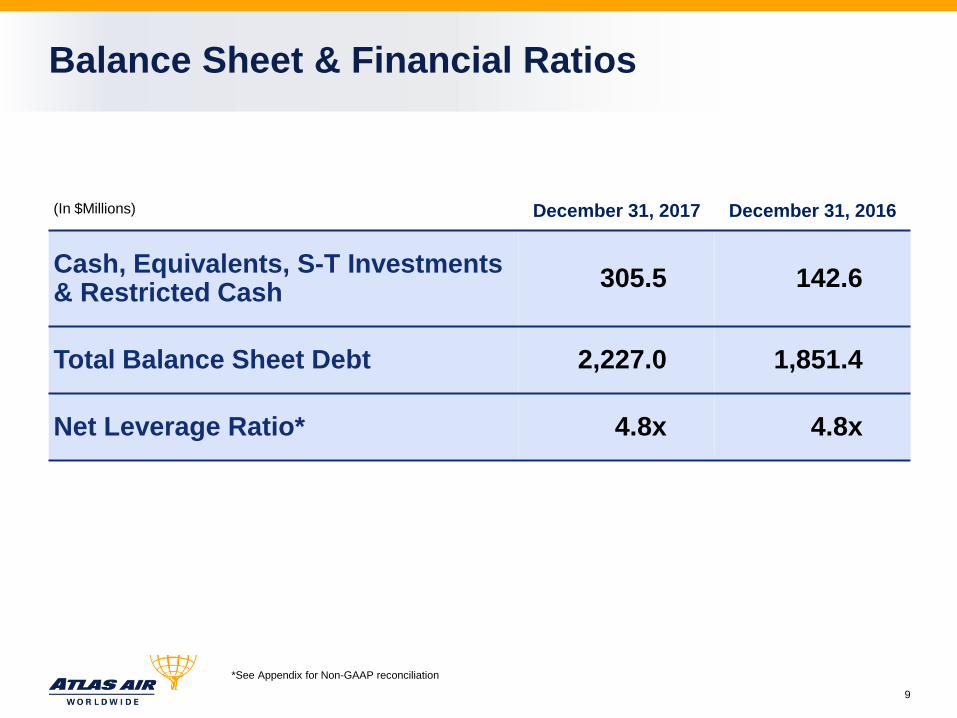
Balance Sheet & Financial Ratios
(In $Millions) December 31, 2017 December 31, 2016
Cash, Equivalents, S-T Investments & Restricted Cash
305.5 142.6
Total Balance Sheet Debt 2,227.0 1,851.4
Net Leverage Ratio* 4.8x 4.8x
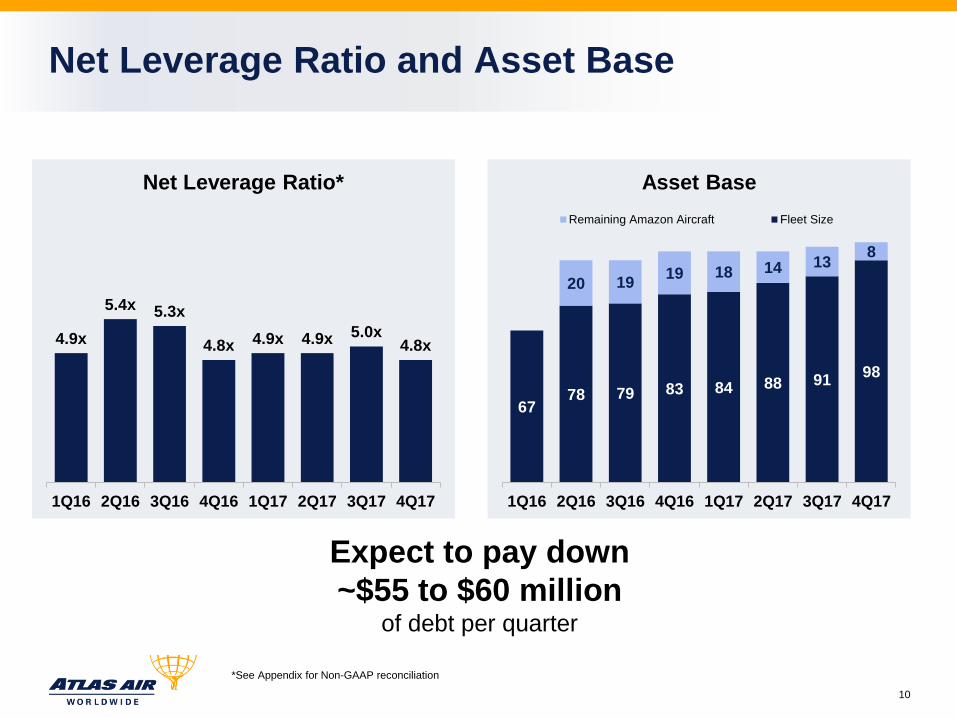
67 78 79 83 84 88 91
98
20 19 19 18 14 13
8
1Q16 2Q16 3Q16 4Q16 1Q17 2Q17 3Q17 4Q17
Asset Base
Remaining Amazon Aircraft Fleet Size
10
*See Appendix for Non-GAAP reconciliation
Net Leverage Ratio and Asset Base
4.9x
5.4x 5.3x
4.8x 4.9x 4.9x 5.0x 4.8x
1Q16 2Q16 3Q16 4Q16 1Q17 2Q17 3Q17 4Q17
Net Leverage Ratio*
Expect to pay down
~$55 to $60 million of debt per quarter
11
2017 an exciting year…
Record fourth-quarter earnings
Robust full-year earnings growth
Further business growth in 2018
Expect to generate higher revenue and earnings
Focus on express, e-commerce and fast-growing global markets
Strong airfreight environment – underpinned by global economic growth
Key Takeaways
Appendix
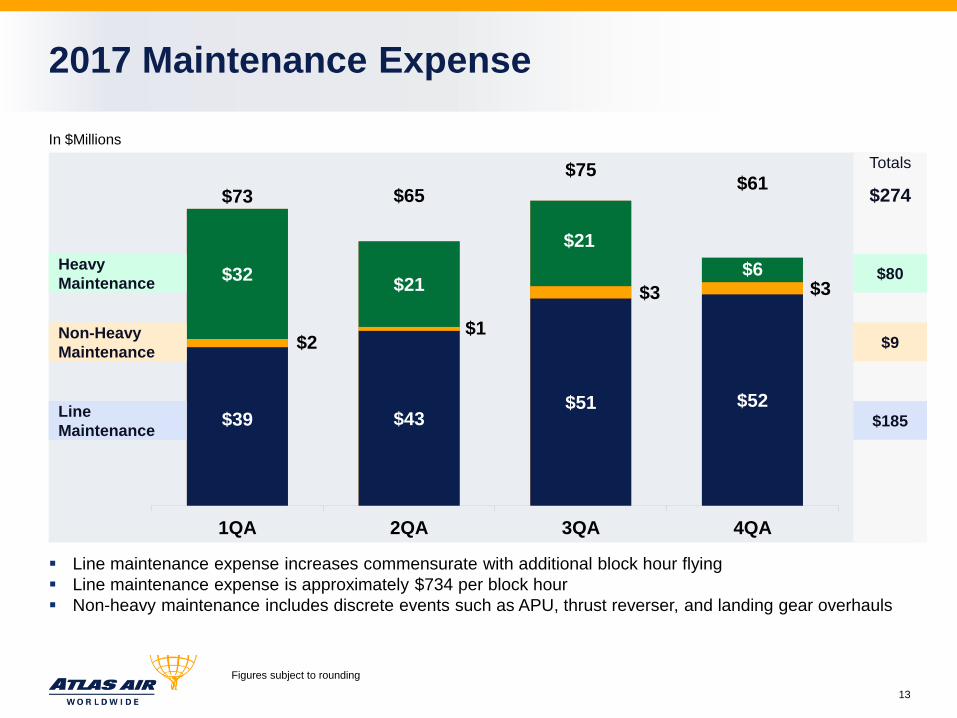
$73 $65
$75 $61
$39 $43 $51 $52
$2 $1
$3 $3 $32
$21
$21
$6
1QA 2QA 3QA 4QA
Totals
13
Figures subject to rounding
2017 Maintenance Expense
Heavy
Maintenance
Line
Maintenance
Non-Heavy
Maintenance
In $Millions
$80
$185
$9
$274
Line maintenance expense increases commensurate with additional block hour flying
Line maintenance expense is approximately $734 per block hour
Non-heavy maintenance includes discrete events such as APU, thrust reverser, and landing gear overhauls

$78
$94 $79
$65
$48 $57 $59 $62
$3
$4 $3 $2 $26
$33 $17
$1
1QE 2QE 3QE 4QE
Totals
14
Figures subject to rounding
2018 Maintenance Expense
Heavy
Maintenance
Line
Maintenance
Non-Heavy
Maintenance
In $Millions
$77
$226
$12
$315
Line maintenance expense increases commensurate with additional block hour flying
Line maintenance expense is approximately $750 per block hour
Non-heavy maintenance includes discrete events such as APU, thrust reverser, and landing gear overhauls
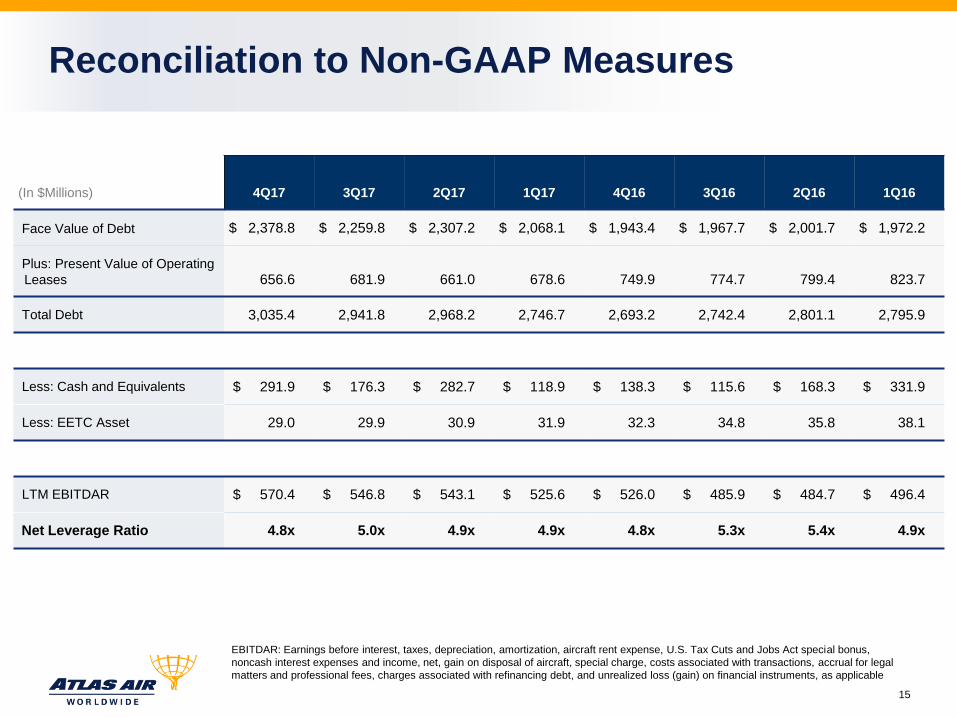
15
EBITDAR: Earnings before interest, taxes, depreciation, amortization, aircraft rent expense, U.S. Tax Cuts and Jobs Act special bonus,
noncash interest expenses and income, net, gain on disposal of aircraft, special charge, costs associated with transactions, accrual for legal
matters and professional fees, charges associated with refinancing debt, and unrealized loss (gain) on financial instruments, as applicable
Reconciliation to Non-GAAP Measures
(In $Millions) 4Q17 3Q17 2Q17 1Q17 4Q16 3Q16 2Q16 1Q16
Face Value of Debt $ 2,378.8 $ 2,259.8 $ 2,307.2 $ 2,068.1 $ 1,943.4 $ 1,967.7 $ 2,001.7 $ 1,972.2
Plus: Present Value of Operating
Leases 656.6 681.9 661.0 678.6 749.9 774.7 799.4 823.7
Total Debt 3,035.4 2,941.8 2,968.2 2,746.7 2,693.2 2,742.4 2,801.1 2,795.9
Less: Cash and Equivalents $ 291.9 $ 176.3 $ 282.7 $ 118.9 $ 138.3 $ 115.6 $ 168.3 $ 331.9
Less: EETC Asset 29.0 29.9 30.9 31.9 32.3 34.8 35.8 38.1
LTM EBITDAR $ 570.4 $ 546.8 $ 543.1 $ 525.6 $ 526.0 $ 485.9 $ 484.7 $ 496.4
Net Leverage Ratio 4.8x 5.0x 4.9x 4.9x 4.8x 5.3x 5.4x 4.9x
Thank You