Embed Size (px)
Citation preview

High level of orders received with greater diversity
Quarterly ReportJANUARY – MARCH 2018
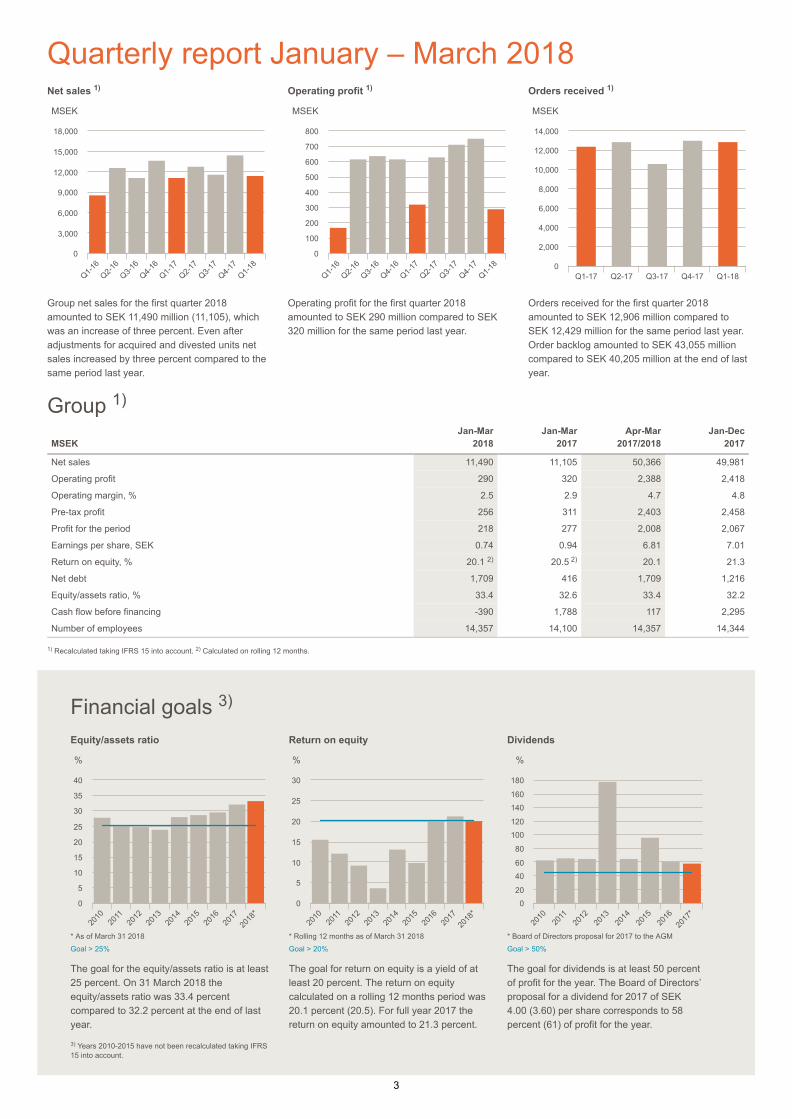
Net sales SEK 11,490 million (11,105)
Operating profit SEK 290 million (320)
Operating margin 2.5 percent (2.9)
Pre-tax profit SEK 256 million (311)
Earnings per share SEK 0.74 (0.94)
Orders received SEK 12,906 million (12,429)
As of this report orders received includes part of Industry, which hadan effect of SEK 1,546 million (1,760)
Order backlog SEK 43,055 million (38,149)
As of this report order backlog includes part of Industry, which had aneffect of SEK 3,563 million (3,459)
Cash flow before financing SEK -390 million (1,788)
Net debt SEK 1,709 million (416)
Equity/assets ratio 33.4 percent (32.6)
•
•
•
•
•
•
•
•
•
•
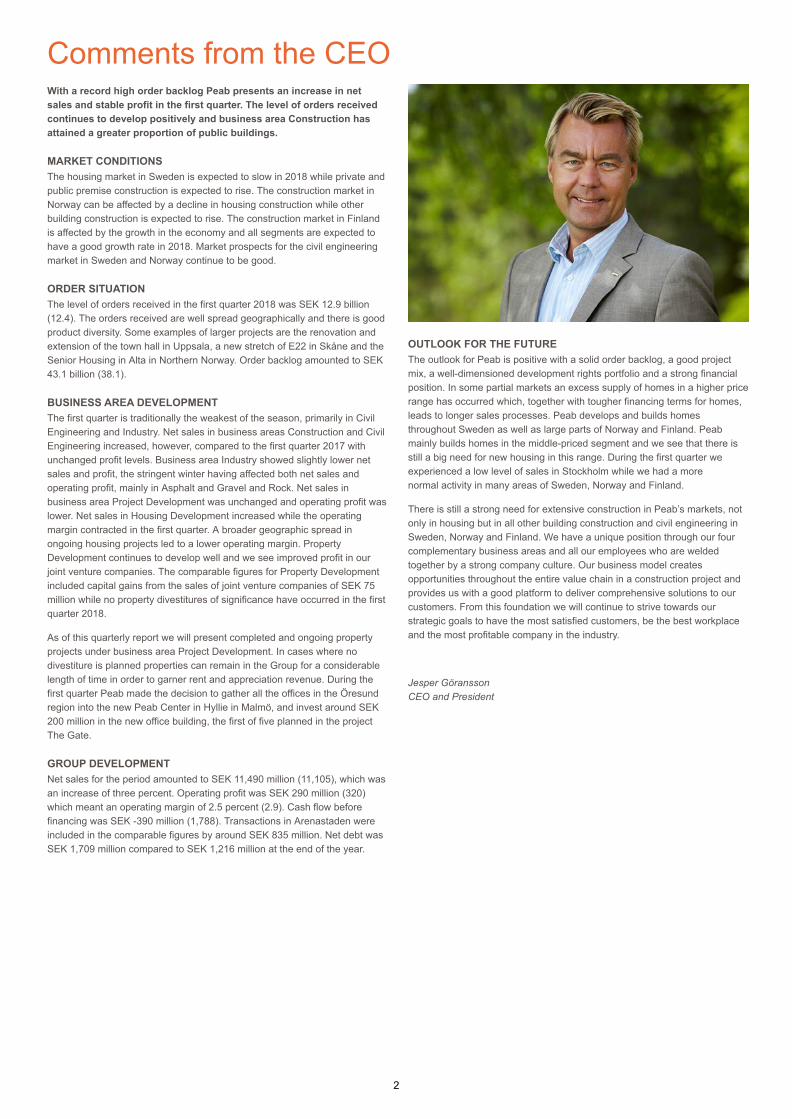
Comments from the CEOWith a record high order backlog Peab presents an increase in netsales and stable profit in the first quarter. The level of orders receivedcontinues to develop positively and business area Construction hasattained a greater proportion of public buildings.
MARKET CONDITIONSThe housing market in Sweden is expected to slow in 2018 while private andpublic premise construction is expected to rise. The construction market inNorway can be affected by a decline in housing construction while otherbuilding construction is expected to rise. The construction market in Finlandis affected by the growth in the economy and all segments are expected tohave a good growth rate in 2018. Market prospects for the civil engineeringmarket in Sweden and Norway continue to be good.
ORDER SITUATIONThe level of orders received in the first quarter 2018 was SEK 12.9 billion(12.4). The orders received are well spread geographically and there is goodproduct diversity. Some examples of larger projects are the renovation andextension of the town hall in Uppsala, a new stretch of E22 in Skåne and theSenior Housing in Alta in Northern Norway. Order backlog amounted to SEK43.1 billion (38.1).
BUSINESS AREA DEVELOPMENTThe first quarter is traditionally the weakest of the season, primarily in CivilEngineering and Industry. Net sales in business areas Construction and CivilEngineering increased, however, compared to the first quarter 2017 withunchanged profit levels. Business area Industry showed slightly lower netsales and profit, the stringent winter having affected both net sales andoperating profit, mainly in Asphalt and Gravel and Rock. Net sales inbusiness area Project Development was unchanged and operating profit waslower. Net sales in Housing Development increased while the operatingmargin contracted in the first quarter. A broader geographic spread inongoing housing projects led to a lower operating margin. PropertyDevelopment continues to develop well and we see improved profit in ourjoint venture companies. The comparable figures for Property Developmentincluded capital gains from the sales of joint venture companies of SEK 75million while no property divestitures of significance have occurred in the firstquarter 2018.
As of this quarterly report we will present completed and ongoing propertyprojects under business area Project Development. In cases where nodivestiture is planned properties can remain in the Group for a considerablelength of time in order to garner rent and appreciation revenue. During thefirst quarter Peab made the decision to gather all the offices in the Öresundregion into the new Peab Center in Hyllie in Malmö, and invest around SEK200 million in the new office building, the first of five planned in the projectThe Gate.
GROUP DEVELOPMENTNet sales for the period amounted to SEK 11,490 million (11,105), which wasan increase of three percent. Operating profit was SEK 290 million (320)which meant an operating margin of 2.5 percent (2.9). Cash flow beforefinancing was SEK -390 million (1,788). Transactions in Arenastaden wereincluded in the comparable figures by around SEK 835 million. Net debt wasSEK 1,709 million compared to SEK 1,216 million at the end of the year.
OUTLOOK FOR THE FUTUREThe outlook for Peab is positive with a solid order backlog, a good projectmix, a well-dimensioned development rights portfolio and a strong financialposition. In some partial markets an excess supply of homes in a higher pricerange has occurred which, together with tougher financing terms for homes,leads to longer sales processes. Peab develops and builds homesthroughout Sweden as well as large parts of Norway and Finland. Peabmainly builds homes in the middle-priced segment and we see that there isstill a big need for new housing in this range. During the first quarter weexperienced a low level of sales in Stockholm while we had a morenormal activity in many areas of Sweden, Norway and Finland.
There is still a strong need for extensive construction in Peab’s markets, notonly in housing but in all other building construction and civil engineering inSweden, Norway and Finland. We have a unique position through our fourcomplementary business areas and all our employees who are weldedtogether by a strong company culture. Our business model createsopportunities throughout the entire value chain in a construction project andprovides us with a good platform to deliver comprehensive solutions to ourcustomers. From this foundation we will continue to strive towards ourstrategic goals to have the most satisfied customers, be the best workplaceand the most profitable company in the industry.
Jesper Göransson CEO and President
2
Quarterly report January – March 2018Net sales
Group net sales for the first quarter 2018amounted to SEK 11,490 million (11,105), whichwas an increase of three percent. Even afteradjustments for acquired and divested units netsales increased by three percent compared to thesame period last year.
1)
MSEK
Q1-16
Q2-16
Q3-16
Q4-16
Q1-17
Q2-17
Q3-17
Q4-17
Q1-18
0
3,000
6,000
9,000
12,000
15,000
18,000
Operating profit
Operating profit for the first quarter 2018amounted to SEK 290 million compared to SEK320 million for the same period last year.
1)
MSEK
Q1-16
Q2-16
Q3-16
Q4-16
Q1-17
Q2-17
Q3-17
Q4-17
Q1-18
0
100
200
300
400
500
600
700
800
Orders received
Orders received for the first quarter 2018amounted to SEK 12,906 million compared toSEK 12,429 million for the same period last year.Order backlog amounted to SEK 43,055 millioncompared to SEK 40,205 million at the end of lastyear.
1)
MSEK
Q1-17 Q2-17 Q3-17 Q4-17 Q1-180
2,000
4,000
6,000
8,000
10,000
12,000
14,000
Group MSEK
Jan-Mar 2018
Jan-Mar 2017
Apr-Mar 2017/2018
Jan-Dec 2017
Net sales 11,490 11,105 50,366 49,981
Operating profit 290 320 2,388 2,418
Operating margin, % 2.5 2.9 4.7 4.8
Pre-tax profit 256 311 2,403 2,458
Profit for the period 218 277 2,008 2,067
Earnings per share, SEK 0.74 0.94 6.81 7.01
Return on equity, % 20.1 20.5 20.1 21.3
Net debt 1,709 416 1,709 1,216
Equity/assets ratio, % 33.4 32.6 33.4 32.2
Cash flow before financing -390 1,788 117 2,295
Number of employees 14,357 14,100 14,357 14,344
Recalculated taking IFRS 15 into account. Calculated on rolling 12 months.
1)
2) 2)
1) 2)
Financial goals 3)
Equity/assets ratio
* As of March 31 2018Goal > 25%
The goal for the equity/assets ratio is at least25 percent. On 31 March 2018 theequity/assets ratio was 33.4 percentcompared to 32.2 percent at the end of lastyear.
Years 2010-2015 have not been recalculated taking IFRS15 into account.
%
2010
2011
2012
2013
2014
2015
2016
2017
2018
*0
5
10
15
20
25
30
35
40
3)
Return on equity
* Rolling 12 months as of March 31 2018Goal > 20%
The goal for return on equity is a yield of atleast 20 percent. The return on equitycalculated on a rolling 12 months period was20.1 percent (20.5). For full year 2017 thereturn on equity amounted to 21.3 percent.
%
2010
2011
2012
2013
2014
2015
2016
2017
2018
*0
5
10
15
20
25
30
Dividends
* Board of Directors proposal for 2017 to the AGMGoal > 50%
The goal for dividends is at least 50 percentof profit for the year. The Board of Directors’proposal for a dividend for 2017 of SEK4.00 (3.60) per share corresponds to 58percent (61) of profit for the year.
%
2010
2011
2012
2013
2014
2015
2016
2017
*0
20
4060
80
100120
140160
180
3
Net sales and profit NEW ACCOUNTING PRINCIPLES FOR INCOMEIFRS 15 Revenue from contracts with customers, replaces as of 2018previous standards related to revenue recognition such as IAS 18Revenue, IAS 11 Construction contracts and IFRIC 15 Agreements for theconstruction of real estate. No material effects have been identified. Upuntil the end of 2017 there were differences between operative and legalaccounting in Project Development. This difference was also reflected inthe way executive management and the Board followed up the Group as awhole. The operative and segment accounting was based on thepercentage of completion. Swedish tenant-owned housing projects willcontinue to be recognized as previously through ”revenue over time” whileour own home developments in Sweden will, as of the implementation ofIFRS 15, change over to ”revenue over time”. IFRS 15 will not lead to anychanges in reporting regarding housing projects in Finland and Norwaycompared to the current application since revenue is first recognized whenthe home is handed over to the buyer. As of implementation of IFRS 15segment reporting mirrors legal reporting. The differences betweenoperative and legal reporting therefore no longer exist for either businessarea Project Development or the Group as a whole. For business areaProject Development this has entailed recalculating comparable figures inHousing Development. Peab has chosen to apply IFRS 15 retroactively byrecalculating the financial reports for 2017. The recalculations have nothad any material effect on either business area Project Development or theGroup as a whole. All comparable figures for 2017 and 2016 insubsequent reports are recalculated if not otherwise noted. For moreinformation regarding IFRS 15 and comparable figures please see note 1or www.peab.com/ifrs.
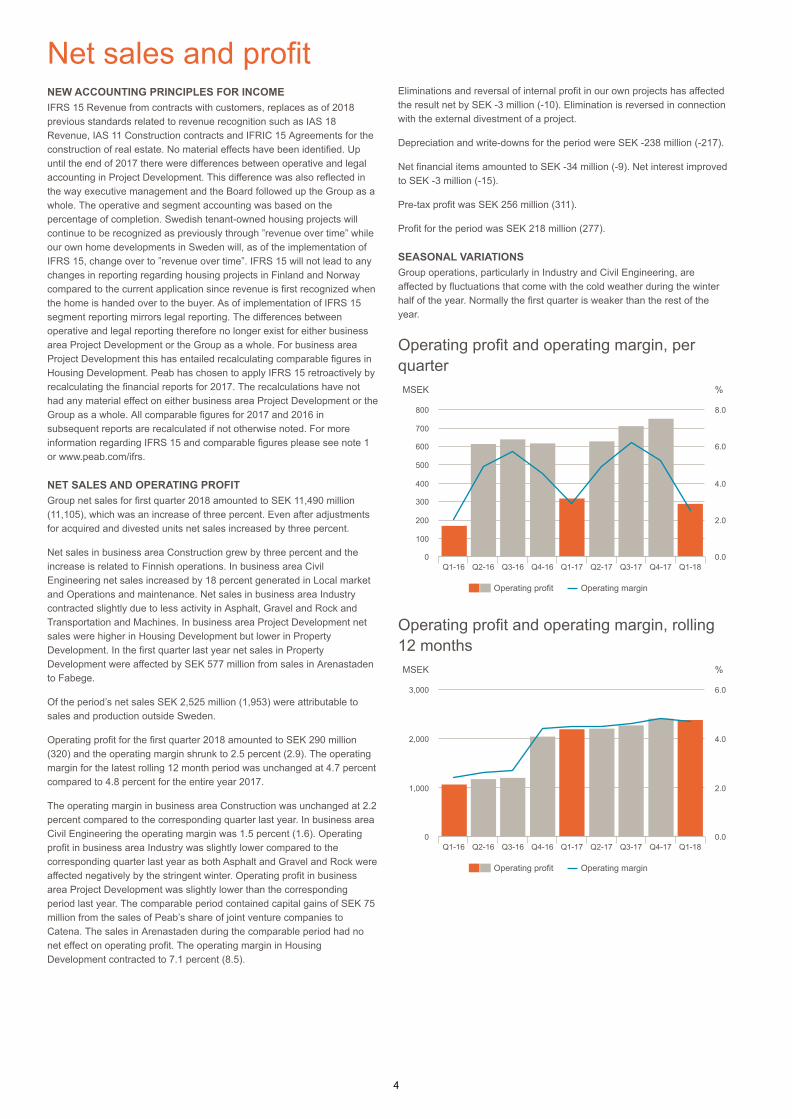
NET SALES AND OPERATING PROFITGroup net sales for first quarter 2018 amounted to SEK 11,490 million(11,105), which was an increase of three percent. Even after adjustmentsfor acquired and divested units net sales increased by three percent.
Net sales in business area Construction grew by three percent and theincrease is related to Finnish operations. In business area CivilEngineering net sales increased by 18 percent generated in Local marketand Operations and maintenance. Net sales in business area Industrycontracted slightly due to less activity in Asphalt, Gravel and Rock andTransportation and Machines. In business area Project Development netsales were higher in Housing Development but lower in PropertyDevelopment. In the first quarter last year net sales in PropertyDevelopment were affected by SEK 577 million from sales in Arenastadento Fabege.
Of the period’s net sales SEK 2,525 million (1,953) were attributable tosales and production outside Sweden.
Operating profit for the first quarter 2018 amounted to SEK 290 million(320) and the operating margin shrunk to 2.5 percent (2.9). The operatingmargin for the latest rolling 12 month period was unchanged at 4.7 percentcompared to 4.8 percent for the entire year 2017.
The operating margin in business area Construction was unchanged at 2.2percent compared to the corresponding quarter last year. In business areaCivil Engineering the operating margin was 1.5 percent (1.6). Operatingprofit in business area Industry was slightly lower compared to thecorresponding quarter last year as both Asphalt and Gravel and Rock wereaffected negatively by the stringent winter. Operating profit in businessarea Project Development was slightly lower than the correspondingperiod last year. The comparable period contained capital gains of SEK 75million from the sales of Peab’s share of joint venture companies toCatena. The sales in Arenastaden during the comparable period had nonet effect on operating profit. The operating margin in HousingDevelopment contracted to 7.1 percent (8.5).
Eliminations and reversal of internal profit in our own projects has affectedthe result net by SEK -3 million (-10). Elimination is reversed in connectionwith the external divestment of a project.
Depreciation and write-downs for the period were SEK -238 million (-217).
Net financial items amounted to SEK -34 million (-9). Net interest improvedto SEK -3 million (-15).
Pre-tax profit was SEK 256 million (311).
Profit for the period was SEK 218 million (277).
SEASONAL VARIATIONSGroup operations, particularly in Industry and Civil Engineering, areaffected by fluctuations that come with the cold weather during the winterhalf of the year. Normally the first quarter is weaker than the rest of theyear.
Operating profit and operating margin, perquarter
Operating profit and operating margin, rolling12 months
MSEK %
Q1-16 Q2-16 Q3-16 Q4-16 Q1-17 Q2-17 Q3-17 Q4-17 Q1-180
100
200
300
400
500
600
700
800
0.0
2.0
4.0
6.0
8.0
Operating profit Operating margin
MSEK %
Q1-16 Q2-16 Q3-16 Q4-16 Q1-17 Q2-17 Q3-17 Q4-17 Q1-180
1,000
2,000
3,000
0.0
2.0
4.0
6.0
Operating profit Operating margin
4
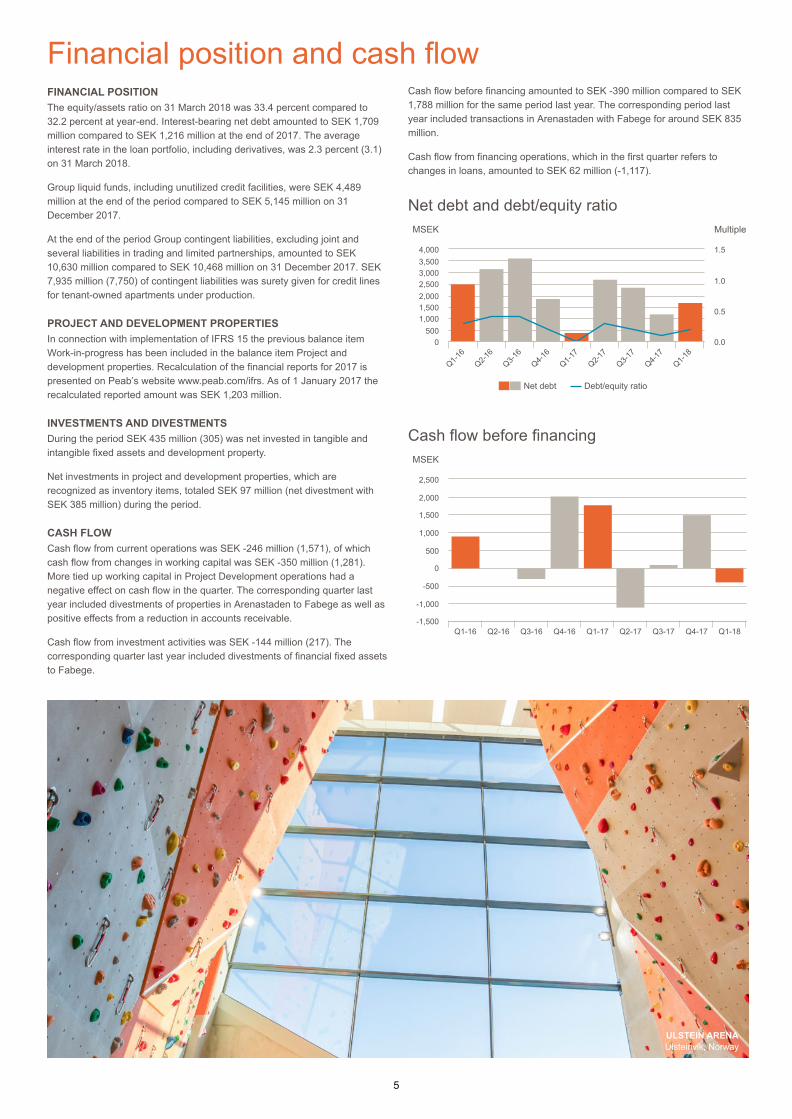
Financial position and cash flowFINANCIAL POSITIONThe equity/assets ratio on 31 March 2018 was 33.4 percent compared to32.2 percent at year-end. Interest-bearing net debt amounted to SEK 1,709million compared to SEK 1,216 million at the end of 2017. The averageinterest rate in the loan portfolio, including derivatives, was 2.3 percent (3.1)on 31 March 2018.
Group liquid funds, including unutilized credit facilities, were SEK 4,489million at the end of the period compared to SEK 5,145 million on 31December 2017.
At the end of the period Group contingent liabilities, excluding joint andseveral liabilities in trading and limited partnerships, amounted to SEK10,630 million compared to SEK 10,468 million on 31 December 2017. SEK7,935 million (7,750) of contingent liabilities was surety given for credit linesfor tenant-owned apartments under production.
PROJECT AND DEVELOPMENT PROPERTIESIn connection with implementation of IFRS 15 the previous balance itemWork-in-progress has been included in the balance item Project anddevelopment properties. Recalculation of the financial reports for 2017 ispresented on Peab’s website www.peab.com/ifrs. As of 1 January 2017 therecalculated reported amount was SEK 1,203 million.
INVESTMENTS AND DIVESTMENTSDuring the period SEK 435 million (305) was net invested in tangible andintangible fixed assets and development property.
Net investments in project and development properties, which arerecognized as inventory items, totaled SEK 97 million (net divestment withSEK 385 million) during the period.
CASH FLOWCash flow from current operations was SEK -246 million (1,571), of whichcash flow from changes in working capital was SEK -350 million (1,281).More tied up working capital in Project Development operations had anegative effect on cash flow in the quarter. The corresponding quarter lastyear included divestments of properties in Arenastaden to Fabege as well aspositive effects from a reduction in accounts receivable.
Cash flow from investment activities was SEK -144 million (217). Thecorresponding quarter last year included divestments of financial fixed assetsto Fabege.
Cash flow before financing amounted to SEK -390 million compared to SEK1,788 million for the same period last year. The corresponding period lastyear included transactions in Arenastaden with Fabege for around SEK 835million.
Cash flow from financing operations, which in the first quarter refers tochanges in loans, amounted to SEK 62 million (-1,117).
Net debt and debt/equity ratio
Cash flow before financing
MSEK Multiple
Q1-16
Q2-16
Q3-16
Q4-16
Q1-17
Q2-17
Q3-17
Q4-17
Q1-18
0500
1,0001,5002,0002,5003,0003,5004,000
0.0
0.5
1.0
1.5
Net debt Debt/equity ratio
MSEK
Q1-16 Q2-16 Q3-16 Q4-16 Q1-17 Q2-17 Q3-17 Q4-17 Q1-18-1,500
-1,000
-500
0
500
1,000
1,500
2,000
2,500
ULSTEIN ARENAUlsteinvik, Norway
5
Order situationImplementation of IFRS 15 Revenue from contracts with customers entailsnew disclosure demands which will be presented in the Annual Report2018. One of the disclosure demands refers to remaining performanceobligations, more often called order backlog. In quarterly reports Peab haspreviously chosen to present information on orders received and orderbacklog in business areas Construction, Civil Engineering and ProjectDevelopment. As of 2018 Industry will also present orders received andorder backlog for product areas Asphalt, Construction System and part ofRentals. In the other product areas in Industry contracts are usually shortand therefore orders received and order backlog are not presented forthem. Comparable figures regarding orders received and order backloghave been recalculated for 2017.
Orders received for the first quarter 2018 amounted to SEK 12,906 millioncompared to SEK 12,429 million for the same period last year. The level oforders received has risen in business area Construction and ProjectDevelopment but contracted in Industry. The level of orders receivedin business area Civil Engineering was relatively unchanged. The ordersreceived in the first quarter 2018 are well spread geographically and thereis good product diversity.
Order backlog yet to be produced at the end of the period increased toSEK 43,055 million compared to SEK 38,149 million at the end of thesame period last year. Of the total order backlog, 42 percent (40) isexpected to be produced after 2018 (2017). Swedish operations accountedfor 84 percent (83) of the order backlog.
Orders received
MSEKJan-Mar
2018Jan-Mar
2017Apr-Mar
2017/2018Jan-Dec
2017
Construction 8,144 7,865 29,559 29,280
Civil Engineering 3,859 3,800 14,250 14,191
Industry 1,546 1,760 4,938 5,152
Project Development 2,061 1,375 9,182 8,496
Eliminations -2,704 -2,371 -8,453 -8,120
Group 12,906 12,429 49,476 48,999
Order backlog
MSEK31 Mar
201831 Mar
201731 Dec
2017
Construction 28,428 25,716 26,805
Civil Engineering 11,889 10,052 10,832
Industry 3,563 3,459 2,533
Project Development 8,275 6,705 8,198
Eliminations -9,100 -7,783 -8,163
Group 43,055 38,149 40,205
We received several major contracts and agreements during the first quarter, including:Construction of 135 apartments in Esbo. The customer is theKojamo Group Lumo-Kodit Oy, Finland’s largest privatelandlord. The contract is worth around EUR 14 million.
Construction of an elementary school in Karleby, Finland. Thecustomer is Karleby Municipality and the contract is worth EUR 11million.
Construction of a new stretch of E22 between Sätaröd and Vä inthe middle of Skåne. The customer is The Swedish TransportAdministration and the contract is worth SEK 629 million.
Peab is developing and building new offices in Malmö and willinvest around SEK 200 million in the first stage of a total of fivebuildings planned for in the project The Gate. Peab’s own contractwork stands for SEK 122 million in the first stage and is included inorders received for business area Construction. The order hasbeen eliminated on Group level.
Construction of Björknäs Retirement Home in Boden. Thecustomer is Hemsö Norrbottenfastigheter KB and the contract isworth SEK 198 million.
Construction of the second stage of Vuorestalo School inTammerfors. The customer is Tammerfors Municipality and thecontract is worth EUR 13 million.
•
•
•
•
•
•
Construction of a new baggage garage, security control and hotelat Landvetter Airport in Gothenburg. The customer is Swedavia ABand the contract is worth SEK 454 million.
Renovation and extension of a juvenile detention facility inHässleholm. The customer is Specialfastigheter Sverige AB andthe contract is worth SEK 193 million.
Renovation of 470 apartments at Munkhöjden in Helsinki. Thecustomer is Asunto Oy Ulvilantie 29 and the contract is worth EUR16 million.
Renewed responsibility for the operation and maintenance offederal roads in the operational area Dalsland. The customer isThe Swedish Transport Administration and the contract is worthSEK 193 million.
Construction of Alta Senior Housing in Northern Norway. Thecustomer is Alta Municipality and the contract is worth NOK 591million.
Renovation and extension of the town hall in Uppsala. Thecustomer is Uppsala Municipality, Förvaltningsfastigheter AB andthe contract is worth SEK 840 million.
•
•
•
•
•
•
Project allocation of order backlog, 31 March2018MSEK
0
4,000
8,000
12,000
16,000
20,000
24,000
< 200 MSEK, 55% (58) 201 – 500 MSEK, 23% (28)501 – 1,000 MSEK, 16% (8) >1,000 MSEK, 6% (6)
Order backlog allocated over timeMSEK
Current financial year Next financial year Thereafter0
4,000
8,000
12,000
16,000
20,000
24,000
28,000
March 31, 2018 March 31, 2017
6
Overview business areasThe Peab Group is presented in four different business areas:Construction, Civil Engineering, Industry and Project Development. Thebusiness areas are also operating segments.
RECOGNITION OF INTERNAL PROJECTS BETWEEN BUSINESSAREAS CONSTRUCTION AND PROJECT DEVELOPMENTBusiness area Construction reports net sales and profit/loss referring tothe contract construction in our own housing projects, in rental projectsand other property projects to business area Project Development overtime. Business area Project Development reports net sales for bothcontract construction and the developer part of our own housing projects.The reported profit/loss consists of the profit/loss in the developer partrecognized over time.
PRESENTATION OF PROPERTY PROJECTS ON OUR OWNBALANCE SHEETThe underlying sales value of property projects on our own balance sheet,reported as project and development property, that are sold in the form of acompany via shares is recognized as net sales and the reported value onthe balance sheet is recognized as an expense. When property projectsreported as operations property or investment property are divested thenet effect on profit/loss is recognized as other operating income or otheroperating cost.
GROUP FUNCTIONSIn addition to the business areas, central companies, certain subsidiariesand other holdings are presented as Group functions. The centralcompanies primarily consist of the parent company Peab AB, Peab Finansand Peab Support (Shared service center).
Net sales and operating profit per business areaNet sales Operating profit Operating margin
MSEK
Jan- Mar
2018
Jan- Mar
2017Apr-Mar
2017/2018
Jan- Dec
2017
Jan- Mar
2018
Jan- Mar
2017Apr-Mar
2017/2018
Jan- Dec
2017
Jan- Mar
2018
Jan- Mar
2017Apr-Mar
2017/2018
Jan- Dec
2017
Construction 6,563 6,386 26,903 26,726 143 139 606 602 2.2% 2.2% 2.3% 2.3%
Civil Engineering 2,816 2,388 12,253 11,825 42 39 377 374 1.5% 1.6% 3.1% 3.2%
Industry 2,178 2,237 12,702 12,761 -38 -23 852 867 -1.7% -1.0% 6.7% 6.8%
Project Development 2,287 2,212 8,418 8,343 201 222 783 804 8.8% 10.0% 9.3% 9.6%
– of which Property Development 156 659 510 1,013 50 90 58 98 32.1% 13.7% 11.4% 9.7%
– of which Housing Development 2,131 1,553 7,908 7,330 151 132 725 706 7.1% 8.5% 9.2% 9.6%
Group functions 259 235 1,017 993 -55 -47 -236 -228
Eliminations -2,613 -2,353 -10,927 -10,667 -3 -10 6 -1
Group 11,490 11,105 50,366 49,981 290 320 2,388 2,418 2.5% 2.9% 4.7% 4.8%
7
Business area ConstructionWith local roots close to customers business area Con structionperforms contract work for both external and internal customers.Construction projects include everything from new production ofhousing, public and commercial premises to renovations andextensions as well as construction maintenance.
Operations in business area Construction are run via some 150 localoffices around the Nordic area, organized in eleven regions in Sweden,three in Norway and two in Finland. There are three specialized housingproduction regions in Stockholm, Gothenburg and the Öresund region.Construction maintenance operations are run in a nationwide regionprimarily focused on the big city areas. Other regions are responsible forall types of construction projects in their geographic area.
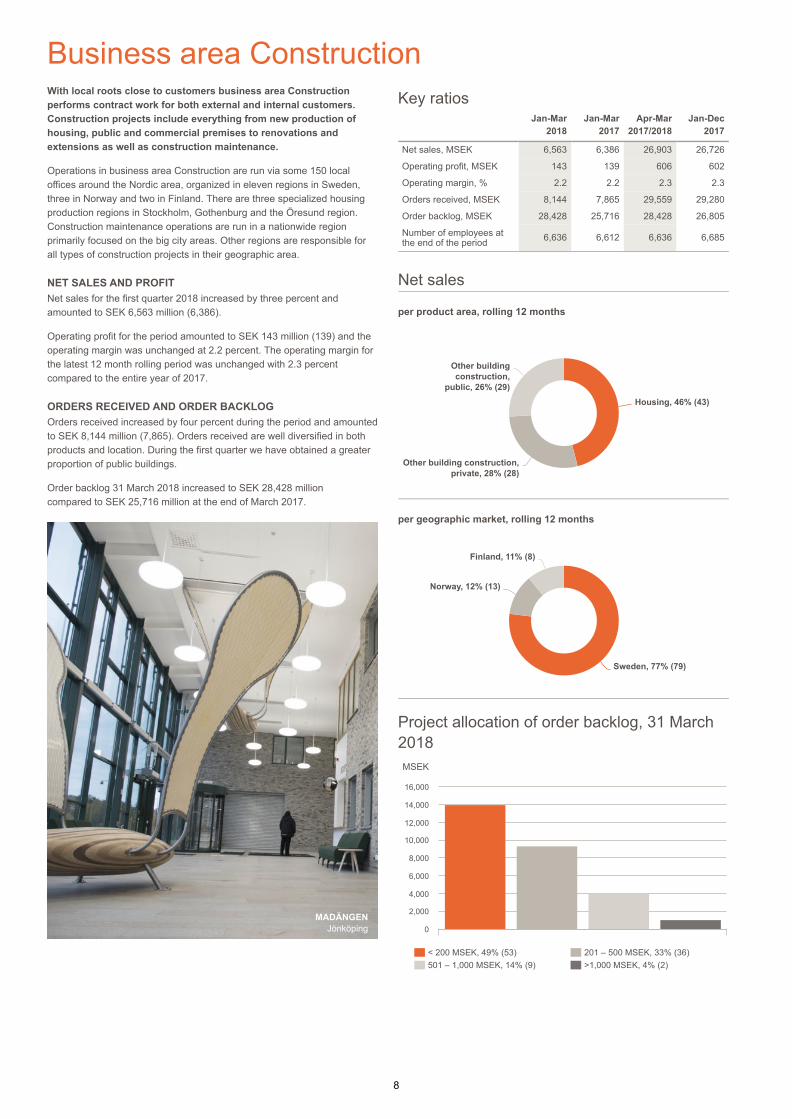
NET SALES AND PROFITNet sales for the first quarter 2018 increased by three percent andamounted to SEK 6,563 million (6,386).
Operating profit for the period amounted to SEK 143 million (139) and theoperating margin was unchanged at 2.2 percent. The oper ating margin forthe latest 12 month rolling period was unchanged with 2.3 percentcompared to the entire year of 2017.
ORDERS RECEIVED AND ORDER BACKLOGOrders received increased by four percent during the period and amountedto SEK 8,144 million (7,865). Orders received are well diversified in bothproducts and location. During the first quarter we have obtained a greaterproportion of public buildings.
Order backlog 31 March 2018 increased to SEK 28,428 millioncompared to SEK 25,716 million at the end of March 2017.
MADÄNGENJönköping
Key ratiosJan-Mar
2018Jan-Mar
2017Apr-Mar
2017/2018Jan-Dec
2017
Net sales, MSEK 6,563 6,386 26,903 26,726
Operating profit, MSEK 143 139 606 602
Operating margin, % 2.2 2.2 2.3 2.3
Orders received, MSEK 8,144 7,865 29,559 29,280
Order backlog, MSEK 28,428 25,716 28,428 26,805
Number of employees atthe end of the period 6,636 6,612 6,636 6,685
Net sales
per product area, rolling 12 months
per geographic market, rolling 12 months
Project allocation of order backlog, 31 March2018
Housing, 46% (43)
Other building construction,private, 28% (28)
Other buildingconstruction,
public, 26% (29)
Sweden, 77% (79)
Norway, 12% (13)
Finland, 11% (8)
MSEK
0
2,000
4,000
6,000
8,000
10,000
12,000
14,000
16,000
< 200 MSEK, 49% (53) 201 – 500 MSEK, 33% (36)501 – 1,000 MSEK, 14% (9) >1,000 MSEK, 4% (2)
8
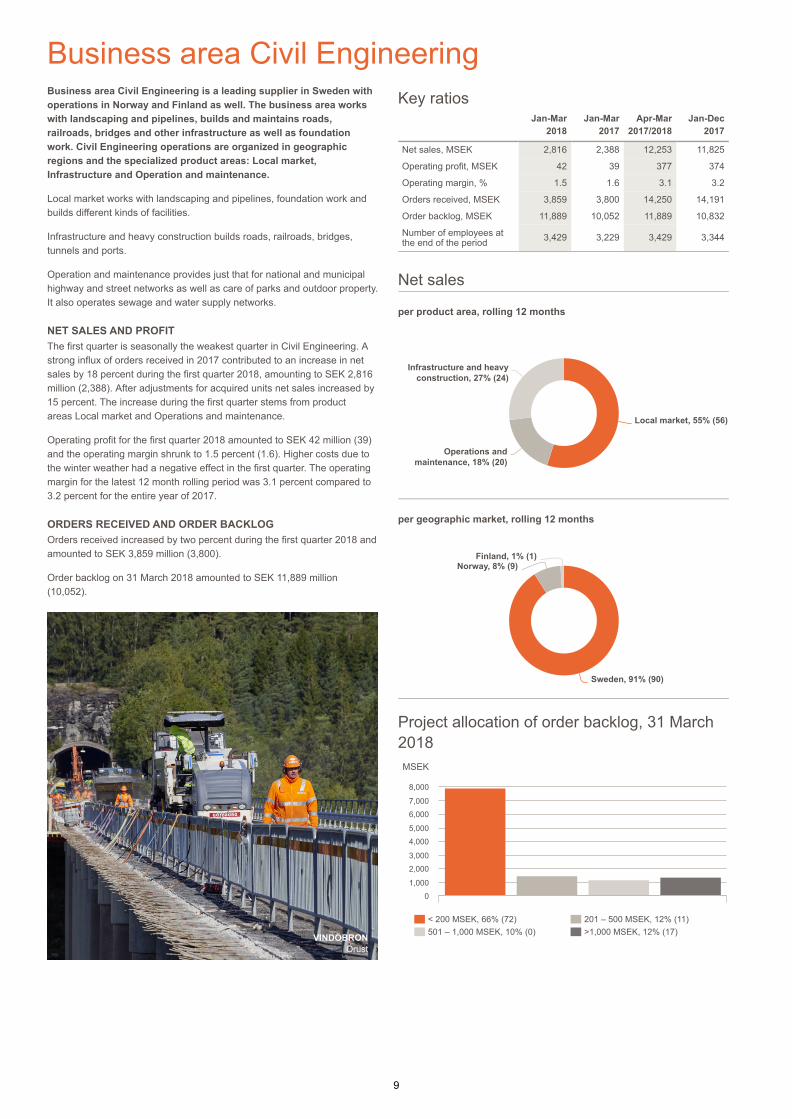
Business area Civil EngineeringBusiness area Civil Engineering is a leading supplier in Sweden withoperations in Norway and Finland as well. The business area workswith landscaping and pipelines, builds and maintains roads,railroads, bridges and other infrastructure as well as foundationwork. Civil Engineering operations are organized in geographicregions and the specialized product areas: Local market,Infrastructure and Operation and maintenance.
Local market works with landscaping and pipelines, foundation work andbuilds different kinds of facilities.
Infrastructure and heavy construction builds roads, railroads, bridges,tunnels and ports.
Operation and maintenance provides just that for national and municipalhighway and street networks as well as care of parks and outdoor property.It also operates sewage and water supply networks.
NET SALES AND PROFITThe first quarter is seasonally the weakest quarter in Civil Engineering. Astrong influx of orders received in 2017 contributed to an increase in netsales by 18 percent during the first quarter 2018, amounting to SEK 2,816million (2,388). After adjustments for acquired units net sales increased by15 percent. The increase during the first quarter stems from productareas Local market and Operations and maintenance.
Operating profit for the first quarter 2018 amounted to SEK 42 million (39)and the operating margin shrunk to 1.5 percent (1.6). Higher costs due tothe winter weather had a negative effect in the first quarter. The operatingmargin for the latest 12 month rolling period was 3.1 percent compared to3.2 percent for the entire year of 2017.
ORDERS RECEIVED AND ORDER BACKLOGOrders received increased by two percent during the first quarter 2018 andamounted to SEK 3,859 million (3,800).
Order backlog on 31 March 2018 amounted to SEK 11,889 million(10,052).
VINDÖBRONOrust
Key ratiosJan-Mar
2018Jan-Mar
2017Apr-Mar
2017/2018Jan-Dec
2017
Net sales, MSEK 2,816 2,388 12,253 11,825
Operating profit, MSEK 42 39 377 374
Operating margin, % 1.5 1.6 3.1 3.2
Orders received, MSEK 3,859 3,800 14,250 14,191
Order backlog, MSEK 11,889 10,052 11,889 10,832
Number of employees atthe end of the period 3,429 3,229 3,429 3,344
Net sales
per product area, rolling 12 months
per geographic market, rolling 12 months
Project allocation of order backlog, 31 March2018
Local market, 55% (56)
Operations andmaintenance, 18% (20)
Infrastructure and heavyconstruction, 27% (24)
Sweden, 91% (90)
Norway, 8% (9)Finland, 1% (1)
MSEK
01,000
2,0003,000
4,0005,000
6,0007,000
8,000
< 200 MSEK, 66% (72) 201 – 500 MSEK, 12% (11)501 – 1,000 MSEK, 10% (0) >1,000 MSEK, 12% (17)
9
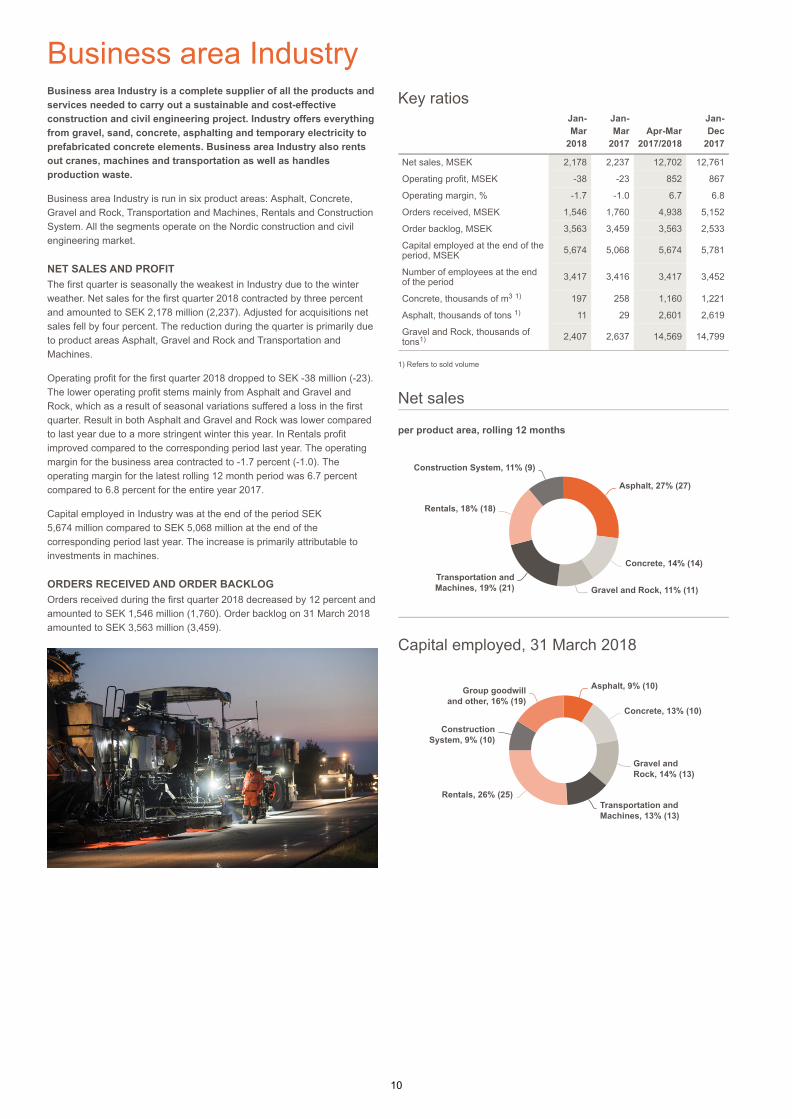
Business area IndustryBusiness area Industry is a complete supplier of all the products andservices needed to carry out a sustainable and cost-effectiveconstruction and civil engineering project. Industry offers everythingfrom gravel, sand, concrete, asphalting and temporary electricity toprefabricated concrete elements. Business area Industry also rentsout cranes, machines and transportation as well as handlesproduction waste.
Business area Industry is run in six product areas: Asphalt, Concrete,Gravel and Rock, Transportation and Machines, Rentals and ConstructionSystem. All the segments operate on the Nordic construction and civilengineering market.
NET SALES AND PROFITThe first quarter is seasonally the weakest in Industry due to the winterweather. Net sales for the first quarter 2018 contracted by three percentand amounted to SEK 2,178 million (2,237). Adjusted for acquisitions netsales fell by four percent. The reduction during the quarter is primarily dueto product areas Asphalt, Gravel and Rock and Transportation andMachines.
Operating profit for the first quarter 2018 dropped to SEK -38 million (-23).The lower operating profit stems mainly from Asphalt and Gravel andRock, which as a result of seasonal variations suffered a loss in the firstquarter. Result in both Asphalt and Gravel and Rock was lower comparedto last year due to a more stringent winter this year. In Rentals profitimproved compared to the corresponding period last year. The operatingmargin for the business area contracted to -1.7 percent (-1.0). Theoperating margin for the latest rolling 12 month period was 6.7 percentcompared to 6.8 percent for the entire year 2017.
Capital employed in Industry was at the end of the period SEK5,674 million compared to SEK 5,068 million at the end of thecorresponding period last year. The increase is primarily attributable toinvestments in machines.
ORDERS RECEIVED AND ORDER BACKLOGOrders received during the first quarter 2018 decreased by 12 percent andamounted to SEK 1,546 million (1,760). Order backlog on 31 March 2018amounted to SEK 3,563 million (3,459).
Key ratiosJan-Mar
2018
Jan-Mar
2017Apr-Mar
2017/2018
Jan-Dec
2017
Net sales, MSEK 2,178 2,237 12,702 12,761
Operating profit, MSEK -38 -23 852 867
Operating margin, % -1.7 -1.0 6.7 6.8
Orders received, MSEK 1,546 1,760 4,938 5,152
Order backlog, MSEK 3,563 3,459 3,563 2,533
Capital employed at the end of theperiod, MSEK 5,674 5,068 5,674 5,781
Number of employees at the endof the period 3,417 3,416 3,417 3,452
Concrete, thousands of m 197 258 1,160 1,221
Asphalt, thousands of tons 11 29 2,601 2,619
Gravel and Rock, thousands oftons 2,407 2,637 14,569 14,799
1) Refers to sold volume
Net sales
per product area, rolling 12 months
Capital employed, 31 March 2018
3 1)
1)
1)
Asphalt, 27% (27)
Concrete, 14% (14)
Gravel and Rock, 11% (11)Transportation andMachines, 19% (21)
Rentals, 18% (18)
Construction System, 11% (9)
Asphalt, 9% (10)
Concrete, 13% (10)
Gravel andRock, 14% (13)
Transportation andMachines, 13% (13)
Rentals, 26% (25)
ConstructionSystem, 9% (10)
Group goodwilland other, 16% (19)
10
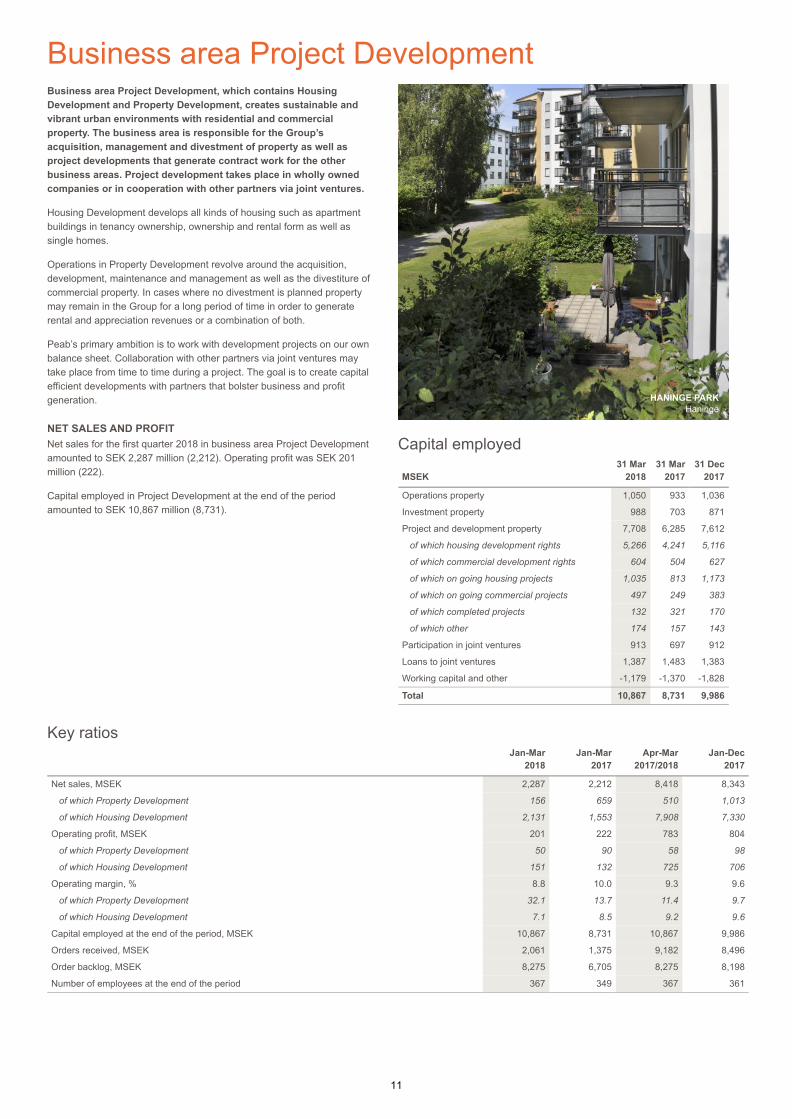
Business area Project DevelopmentBusiness area Project Development, which contains HousingDevelopment and Property Development, creates sustainable andvibrant urban environments with residential and commercialproperty. The business area is responsible for the Group’sacquisition, management and divestment of property as well asproject developments that generate contract work for the otherbusiness areas. Project development takes place in wholly ownedcompanies or in cooperation with other partners via joint ventures.
Housing Development develops all kinds of housing such as apartmentbuildings in tenancy ownership, ownership and rental form as well assingle homes.
Operations in Property Development revolve around the acquisition,development, maintenance and management as well as the divestiture ofcommercial property. In cases where no divestment is planned propertymay remain in the Group for a long period of time in order to generaterental and appreciation revenues or a combination of both.
Peab’s primary ambition is to work with development projects on our ownbalance sheet. Collaboration with other partners via joint ventures maytake place from time to time during a project. The goal is to create capitalefficient developments with partners that bolster business and profitgeneration.
NET SALES AND PROFITNet sales for the first quarter 2018 in business area Project Developmentamounted to SEK 2,287 million (2,212). Operating profit was SEK 201million (222).
Capital employed in Project Development at the end of the periodamounted to SEK 10,867 million (8,731).
HANINGE PARKHaninge
Capital employed
MSEK31 Mar
201831 Mar
201731 Dec
2017
Operations property 1,050 933 1,036
Investment property 988 703 871
Project and development property 7,708 6,285 7,612
of which housing development rights 5,266 4,241 5,116
of which commercial development rights 604 504 627
of which on going housing projects 1,035 813 1,173
of which on going commercial projects 497 249 383
of which completed projects 132 321 170
of which other 174 157 143
Participation in joint ventures 913 697 912
Loans to joint ventures 1,387 1,483 1,383
Working capital and other -1,179 -1,370 -1,828
Total 10,867 8,731 9,986
Key ratiosJan-Mar
2018Jan-Mar
2017Apr-Mar
2017/2018Jan-Dec
2017
Net sales, MSEK 2,287 2,212 8,418 8,343
of which Property Development 156 659 510 1,013
of which Housing Development 2,131 1,553 7,908 7,330
Operating profit, MSEK 201 222 783 804
of which Property Development 50 90 58 98
of which Housing Development 151 132 725 706
Operating margin, % 8.8 10.0 9.3 9.6
of which Property Development 32.1 13.7 11.4 9.7
of which Housing Development 7.1 8.5 9.2 9.6
Capital employed at the end of the period, MSEK 10,867 8,731 10,867 9,986
Orders received, MSEK 2,061 1,375 9,182 8,496
Order backlog, MSEK 8,275 6,705 8,275 8,198
Number of employees at the end of the period 367 349 367 361
11
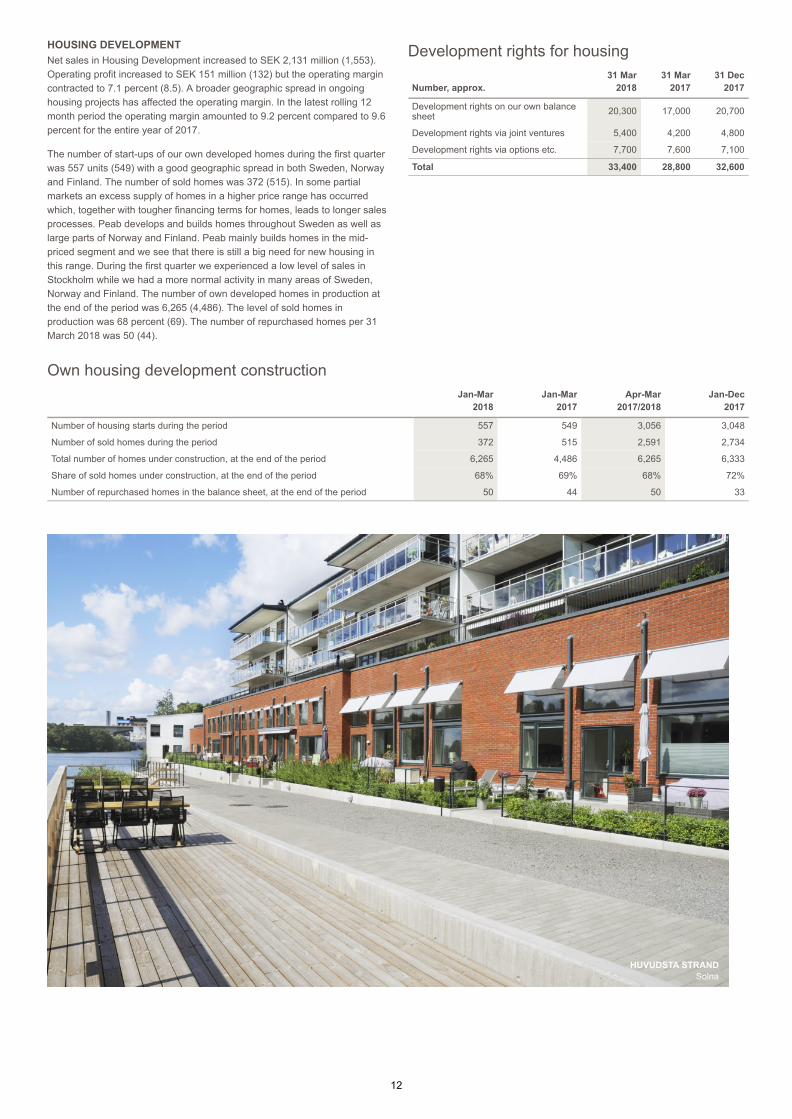
HOUSING DEVELOPMENTNet sales in Housing Development increased to SEK 2,131 million (1,553).Operating profit increased to SEK 151 million (132) but the operating margincontracted to 7.1 percent (8.5). A broader geographic spread in ongoinghousing projects has affected the operating margin. In the latest rolling 12month period the operating margin amounted to 9.2 percent compared to 9.6percent for the entire year of 2017.
The number of start-ups of our own developed homes during the first quarterwas 557 units (549) with a good geographic spread in both Sweden, Norwayand Finland. The number of sold homes was 372 (515). In some partialmarkets an excess supply of homes in a higher price range has occurredwhich, together with tougher financing terms for homes, leads to longer salesprocesses. Peab develops and builds homes throughout Sweden as well aslarge parts of Norway and Finland. Peab mainly builds homes in the mid-priced segment and we see that there is still a big need for new housing inthis range. During the first quarter we experienced a low level of sales inStockholm while we had a more normal activity in many areas of Sweden,Norway and Finland. The number of own developed homes in production atthe end of the period was 6,265 (4,486). The level of sold homes inproduction was 68 percent (69). The number of repurchased homes per 31March 2018 was 50 (44).
Development rights for housing
Number, approx.31 Mar
201831 Mar
201731 Dec
2017
Development rights on our own balancesheet 20,300 17,000 20,700
Development rights via joint ventures 5,400 4,200 4,800
Development rights via options etc. 7,700 7,600 7,100
Total 33,400 28,800 32,600
Own housing development constructionJan-Mar
2018Jan-Mar
2017Apr-Mar
2017/2018Jan-Dec
2017
Number of housing starts during the period 557 549 3,056 3,048
Number of sold homes during the period 372 515 2,591 2,734
Total number of homes under construction, at the end of the period 6,265 4,486 6,265 6,333
Share of sold homes under construction, at the end of the period 68% 69% 68% 72%
Number of repurchased homes in the balance sheet, at the end of the period 50 44 50 33
HUVUDSTA STRANDSolna
12
PROPERTY DEVELOPMENTNet sales and operating profit from operations are derived from acquisitions,development, maintaining and managing wholly owned property, shares inthe result from partly owned companies as well as capital gains/losses fromthe divestiture of completed projects and shares in partly owned companies.
During the first quarter 2018 net sales in Property Development were SEK156 million (659) and operating profit was SEK 50 million (90). The firstquarter last year included divestitures of assets in Arenastaden to Fabege,which affected net sales by SEK 577 million but had no effect on operatingprofit. The first quarter last year also included a capital gains effect of SEK 75million attributable to the divestiture of joint venture companies to Catena.
Our partially owned companies continue to develop well and profit in the firstquarter from partially owned companies amounted to SEK 35 million (28).
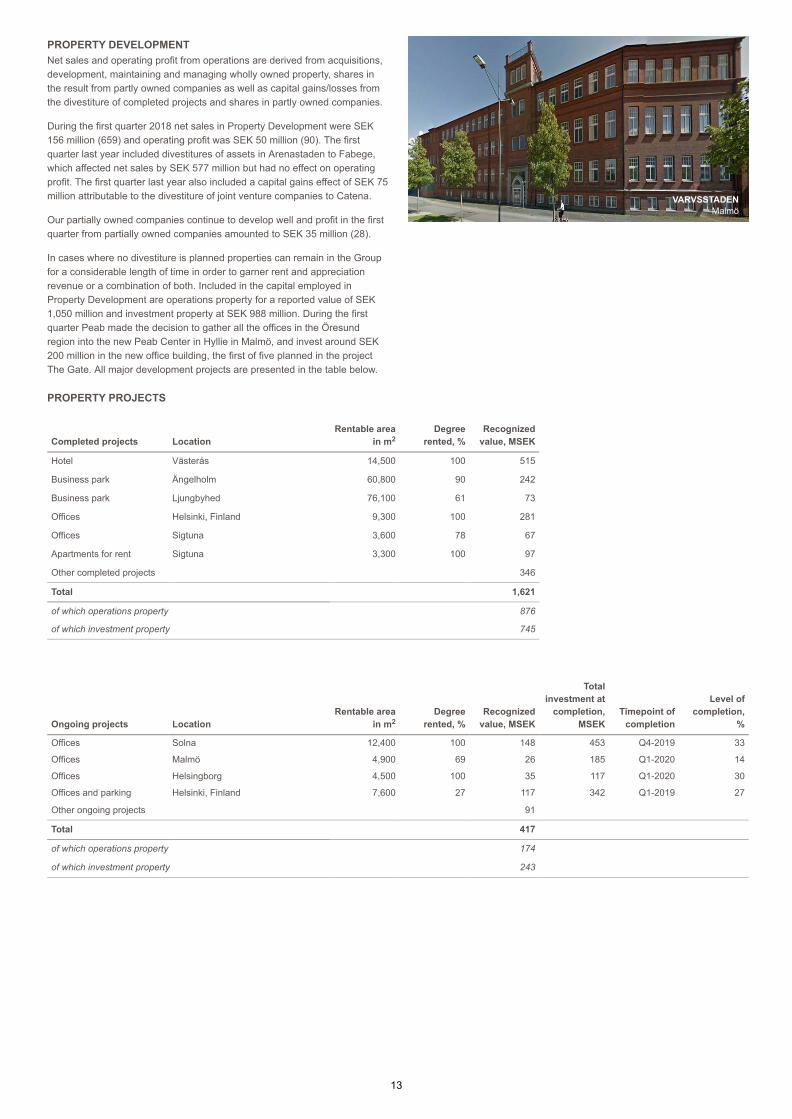
In cases where no divestiture is planned properties can remain in the Groupfor a considerable length of time in order to garner rent and appreciationrevenue or a combination of both. Included in the capital employed inProperty Development are operations property for a reported value of SEK1,050 million and investment property at SEK 988 million. During the firstquarter Peab made the decision to gather all the offices in the Öresundregion into the new Peab Center in Hyllie in Malmö, and invest around SEK200 million in the new office building, the first of five planned in the projectThe Gate. All major development projects are presented in the table below.
VARVSSTADENMalmö
PROPERTY PROJECTS
Completed projects LocationRentable area
in mDegree
rented, %Recognized
value, MSEK
Hotel Västerås 14,500 100 515
Business park Ängelholm 60,800 90 242
Business park Ljungbyhed 76,100 61 73
Offices Helsinki, Finland 9,300 100 281
Offices Sigtuna 3,600 78 67
Apartments for rent Sigtuna 3,300 100 97
Other completed projects 346
Total 1,621
of which operations property 876
of which investment property 745
Ongoing projects LocationRentable area
in mDegree
rented, %Recognized
value, MSEK
Totalinvestment at
completion,MSEK
Timepoint ofcompletion
Level ofcompletion,
%
Offices Solna 12,400 100 148 453 Q4-2019 33
Offices Malmö 4,900 69 26 185 Q1-2020 14
Offices Helsingborg 4,500 100 35 117 Q1-2020 30
Offices and parking Helsinki, Finland 7,600 27 117 342 Q1-2019 27
Other ongoing projects 91
Total 417
of which operations property 174
of which investment property 243
2
2
13
SIGNIFICANT JOINT VENTURESPeab’s significant joint venture companies Fastighets AB Centur, TornetBostadsproduktion AB, Fastighets AB ML4 and Point Hyllie Holding AB aredeveloping well and via them Peab has built up considerable indirectholdings in investment property and development property for bothcommercial and residential purposes. Ongoing returns are in the form ofshares in the profit from joint ventures recognized in operating profit andinterest income on lending. Changes in market values that effect bookedvalues in joint venture companies are not reported in Peab’s profit.
Significant joint ventures
1) Valued at fair value in joint venture companies. The market prices on properties that affect the recognized values in joint venture companies are not recognized in Peab’s profit.
FASTIGHETS AB CENTUROwn, manage and develop commercial property and housing.
Peab’s share: 50 percent Partner: Balder Location: Stockholm, Gothenburg and the Öresund region Recognized value on properties 31 March 2018 :SEK 5,085 million (4,809) Peab’s portion of unrecognized fair value exclusive tax : SEK328 million (275) Major ongoing projects: Hotel Stay-at Varvsstaden, MalmöRentable area 3,900 m , Lyckholms, Gothenburg Rentable area6,400 m
1)
1)
2
2
TORNET BOSTADS PRODUKTION ABBuild and manage attractive and environmentally friendly rentals inlarger cities in Sweden.
Peab’s share: 31 percent Partner: Riksbyggen, Folksam and Balder Location: Stockholm, the Mälaren region, Gothenburg and theÖresund region Recognized value on properties 31 March 2018 : SEK 2,959million (2,363) Peab’s portion of unrecognized fair value exclusive tax : SEK167 million (131) Major ongoing projects: Munkebäck, Gothenburg Rentable area14,800 m , Kungsängen, Upplandsbro Rentable area 7,900 m andseveral apartment building projects in Västerås, Helsingborg, Malmöand Örebro.
1)
1)
2´ 2
FASTIGHETS AB ML4Own and manage the research facility Max IV. The facility is rented toLund University.
Peab’s share: 50 percent Partner: Wihlborgs Location: Lund Recognized value on properties 31 March 2018: SEK 1,848 million(1,865)
POINT HYLLIE HOLDING ABDevelop, own and manage the office property The Point as well asown and manage the hotel property Värdshuset 5 (Operator QualityHotel View)
Peab’s share: 50 percent Partner: Volito Location: Hyllie, Malmö Recognized value of properties 31 March 2018: SEK 843 million(706) Major ongoing projects: 29 floor office building, The Point, Rentablearea 20,000 m2
14
The construction marketSWEDENBuilding construction investments continued to grow in 2017, but the rateslowed and the result was only a marginal increase. Mainly growth in newproduction of single homes and apartment buildings leveled out but eveninvestments in apartment building renovations developed poorly. Althoughgrowth in the economy could affect the housing market positively, due tothe higher demands on amortization and reports about over productionand difficulties in renting out apartments in newly built housing, initiatedhousing investments are expected to shrink. After a strong start last year,construction of premises slowed and all in all investments rose along thesame level as housing construction. Public investments developedhorizontally while private investments rose due to a lift in industrialconstruction. In 2018 and 2019 building construction is expected tocontract slightly as the housing market settles down. Civil engineeringinvestments were unchanged in 2017 compared to the previous year, but itlooks like they could grow at a relatively good rate during 2018 and 2019.
NORWAYThe Norwegian construction market developed positively in 2017. Theincrease had a broad base with both housing and premise constructioncontributing. Nonetheless, as a result of settling price developments,housing construction is expected to contract in 2018. However, otherbuilding construction investments with private premises in the lead areexpected to rise in 2018, driven by good development of privateconsumption and employment growth. All in all few changes are expectedin total construction investments in 2018 and 2019. Civil engineeringinvestments showed strong growth in 2017 and it looks like this gooddevelopment will continue in 2018 and 2019, stimulated by the growingeconomy and political programs.
FINLANDGrowth in Finland’s economy is the highest it has been for years andconfidence is strong in both households and business. After a dramaticincrease in building construction investments in 2016 there was a slightturndown in 2017. A decrease in premise construction was behind thisdecline which was, however, softened by a continued increase in housinginvestments. All in all, building construction volumes are expected to growat a relatively good rate in both 2018 and 2019. This positive developmentwill most likely touch all the sectors. Civil engineering investments rosemarginally in 2017 and the forecast indicates an increase in 2018 followedby leveling out in 2019.
Housing2018 2019 2020
Sweden
Norway
Finland
Forecast for started-up housing investments, new and renovations Source: Industrifakta
Other building construction2018 2019 2020
Sweden
Norway
Finland
Forecast for started-up other building construction investments, new and renovations (Industry,office/retail etc. and public premises)
Source: Industrifakta
Civil engineering2018 2019 2020
Sweden
–
Norway –
Finland
–
Forecast for civil engineering investments Source: Industrifakta
Worse forecast compared to the previous quarterly report
Better forecast compared to the previous quarterly report
Same forecast compared to the previous quarterly report
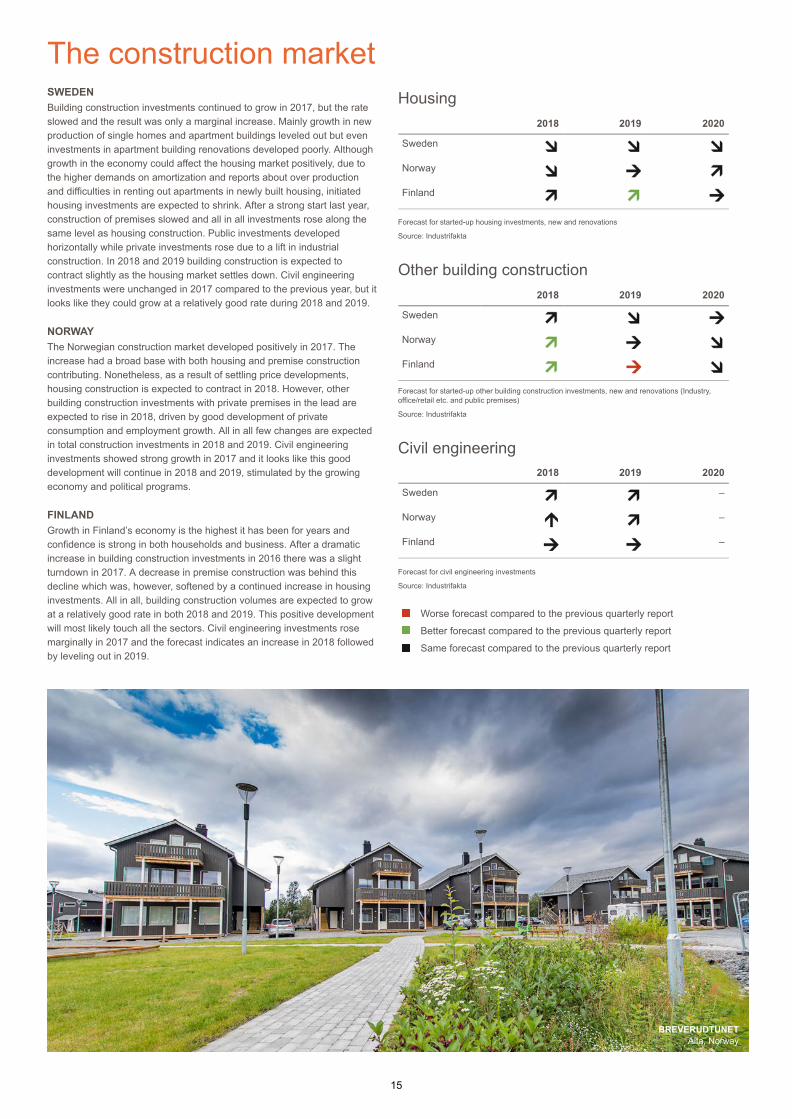
BREVERUDTUNETAlta, Norway
15
Other informationRISKS AND UNCERTAINTY FACTORSPeab’s business is exposed to operational and financial risks. The impactof these risks on Peab’s result and position depends on how well the day-to-day business is handled in the company. In addition, Peab facescircumstantial risks such as developments in the economy and alteredconditions like changes in laws and regulations and other politicaldecisions.
Handling operational risks is a constant ongoing process since there arealways a large number of projects that are beginning, up and running andending. Operational risks are taken care of in the line organization in eachbusiness area. Peab’s business is to a large extent project related. Greyareas concerning contract terms can lead to borderline issues followed bynegotiations with customers.
The financial risks are connected to tying up capital and the need forcapital, primarily in the form of interest rate risk and refinancing risk.Financial risks are dealt with on Group level. For further information onrisks and uncertainty factors, see the 2017 Annual Report.
HOLDINGS OF OWN SHARESAt the beginning of 2018 Peab’s own B shareholding was 1,086,984 whichcorresponds to 0.4 percent of the total number of shares. No changeshave taken place during the first quarter 2018.
THE PEAB SHAREPeab’s B share is listed on the Nasdaq Stockholm, Large Cap list. As of 4May 2018, the price of the Peab share was SEK 73.70, an increase of fourpercent during 2018. During the same period, the Swedish stock marketincreased by 1.5 percent according to the general index in the businessmagazine “Affärsvärlden”. During 2018 the Peab share has been quoted ata maximum of SEK 82.30 and a minimum of SEK 62.60.
16
Report on the Group income statementMSEK
Jan-Mar 2018
Jan-Mar 2017
Apr-Mar 2017/2018
Jan-Dec 2017
Net sales 11,490 11,105 50,366 49,981
Production costs -10,482 -10,234 -45,477 -45,229
Gross profit 1,008 871 4,889 4,752
Sales and administrative expenses -737 -656 -2,695 -2,614
Other operating income 25 118 212 305
Other operating costs -6 -13 -18 -25
Operating profit 290 320 2,388 2,418
Financial income 27 20 198 191
Financial expenses -61 -29 -183 -151
Net financial items -34 -9 15 40
Pre-tax profit 256 311 2,403 2,458Tax -38 -34 -395 -391
Profit for the period 218 277 2,008 2,067
Profit for the period, attributable to:
Shareholders in parent company 218 277 2,008 2,067
Non-controlling interests 0 – 0 0
Profit for the period 218 277 2,008 2,067
Key ratios Earnings per share before and after dilution, SEK 0.74 0.94 6.81 7.01
Average number of outstanding shares, million 295.0 295.0 295.0 295.0
Return on capital employed, % 18.1 16.6 18.1 18.7
Return on equity, % 20.1 20.5 20.1 21.3
1) Calculated on rolling 12 months
Report on the Group income statement and other comprehensive incomein summaryMSEK
Jan-Mar 2018
Jan-Mar 2017
Apr-Mar 2017/2018
Jan-Dec 2017
Profit for the period 218 277 2,008 2,067
Other comprehensive income Items that can be reclassified or have been reclassified to income for the period Translation differences from translation of foreign operations for the period 130 -19 96 -53
Translation differences transferred to profit for the period – -2 0 -2
Changes for the period in fair value of available-for-sale financial assets – -47 -8 -55
Changes in fair value of cash flow hedges for the period 8 15 105 112
Shares in joint ventures’ other comprehensive income 1 0 1 0
Tax referring to items that can be reclassified or have been reclassified to income for the period 6 -5 -5 -16
Other comprehensive income for the period 145 -58 189 -14
Total comprehensive income for the period 363 219 2,197 2,053
Total comprehensive income for the period, attributable to: Shareholders in parent company 363 219 2,197 2,053
Non-controlling interests 0 – 0 0
Total comprehensive income for the period 363 219 2,197 2,053
1) 1)
1) 1)
17
Report on financial position for the Group in summaryMSEK
31 Mar 2018
31 Mar 2017
31 Dec 2017
Assets
Intangible assets 2,205 2,038 2,167
Tangible assets 5,549 4,912 5,508
Investment property 988 704 871
Interest-bearing long-term receivables 1,382 1,724 1,520
Other financial fixed assets 1,187 1,412 1,147
Deferred tax recoverables 10 63 13
Total fixed assets 11,321 10,853 11,226
Project and development properties 7,708 6,285 7,612
Inventories 461 390 399
Interest-bearing current receivables 563 77 411
Other current receivables 11,666 9,948 11,882
Liquid funds 289 1,725 595
Total current assets 20,687 18,425 20,899
Total assets 32,008 29,278 32,125
Equity and liabilities Equity 10,688 9,559 10,332
Liabilities Interest-bearing long-term liabilities 2,358 2,570 2,573
Deferred tax liabilities 142 327 201
Other long-term liabilities 849 755 840
Total long-term liabilities 3,349 3,652 3,614
Interest-bearing current liabilities 1,585 1,372 1,169
Other current liabilities 16,386 14,695 17,010
Total current liabilities 17,971 16,067 18,179
Total liabilities 21,320 19,719 21,793
Total equity and liabilities 32,008 29,278 32,125
Key ratios Capital employed 14,631 13,501 14,074
Equity/assets ratio, % 33.4 32.6 32.2
Net debt 1,709 416 1,216
Equity per share, SEK 36.23 32.41 35.02
Number of outstanding shares at the end of the period, million 295.0 295.0 295.0
18
Report on changes in Group’s equity in summaryMSEK
31 Mar 2018
31 Mar 2017
31 Dec 2017
Equity attributable to shareholders in parent company Opening equity on 1 January 10,331 9,380 9,380Adjustment for retroactive application of IFRS 9 per 1 January 2018 -7 – –
Adjustment for retroactive application of IFRS 15 per 1 January 2017 – -40 -40
Adjusted equity on 1 January 10,324 9,340 9,340
Profit for the period 218 277 2,067
Other comprehensive income for the period 145 -58 -14
Total comprehensive income for the period 363 219 2,053
Cash dividends – – -1,062
Acquisition of non-controlling interests, previous controlling interests – – 0
Closing equity 10,687 9,559 10,331
Non-controlling interests Opening equity on 1 January 1 0 0Total comprehensive income for the period 0 – 0
Acquisition of partially owned subsidiaries, non-controlling interests already – – 1
Closing equity 1 0 1
Total closing equity 10,688 9,559 10,332
19
Report on Group cash flow in summaryMSEK
Jan-Mar 2018
Jan-Mar 2017
Apr-Mar 2017/2018
Jan-Dec 2017
Cash flow from current operations before changes in working capital 104 290 2,610 2,796Increase (-) / Decrease (+) of project and development properties -79 379 -1,145 -687
Increase (-) / Decrease (+) of inventories -59 -27 -60 -28
Increase (-) / Decrease (+) of current receivables/current liabilities -212 929 -383 758
Cash flow from changes in working capital -350 1,281 -1,588 43
Cash flow from current operations -246 1,571 1,022 2,839
Acquisition of subsidiaries / businesses, net effect on liquid funds -15 -8 -167 -160
Disposal of subsidiaries / businesses, net effect on liquid funds – – 4 4
Acquisition of fixed assets -235 -296 -1,904 -1,965
Sales of fixed assets 106 521 1,162 1,577
Cash flow from investment operations -144 217 -905 -544
Cash flow before financing -390 1,788 117 2,295Increase (+) / Decrease (-) of interest-bearing liabilities 62 -1,117 -509 -1,688
Dividend distributed to shareholders in parent company – – -1,062 -1,062
Cash flow from financing operations 62 -1,117 -1,571 -2,750
Cash flow for the period -328 671 -1,454 -455
Cash at the beginning of the period 595 1,062 1,725 1,062
Exchange rate differences in cash 22 -8 18 -12
Cash at the end of the period 289 1,725 289 595
20
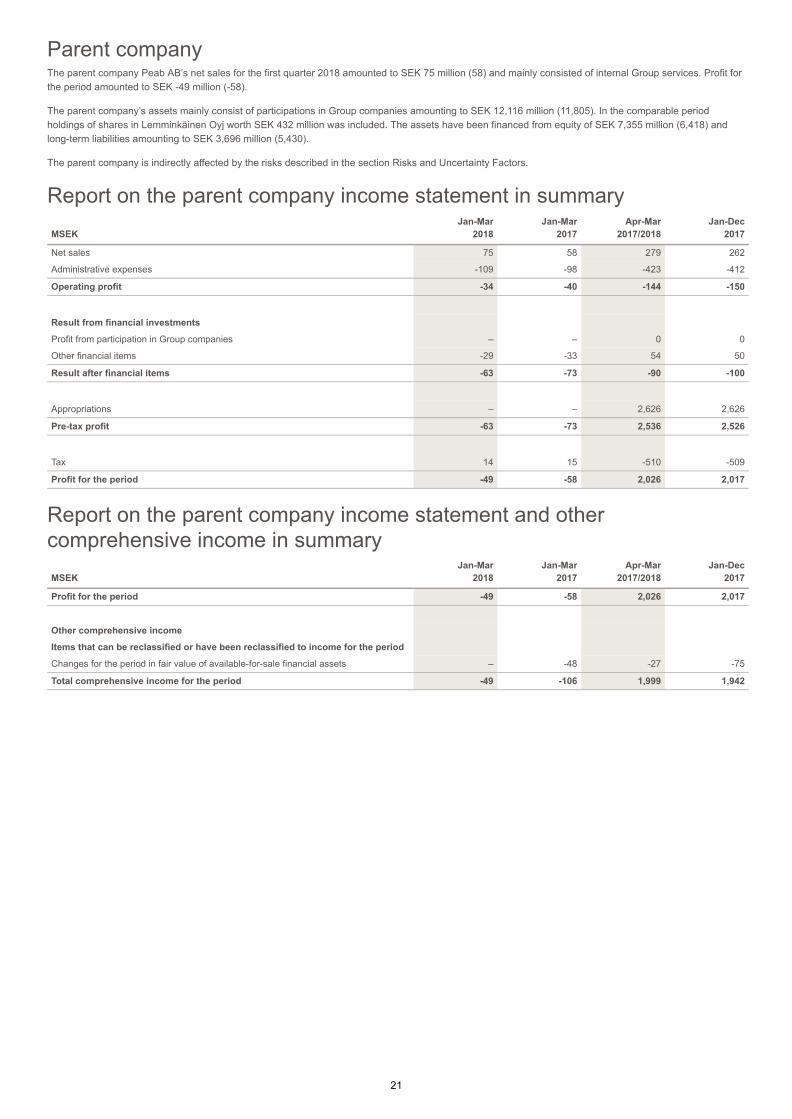
Parent companyThe parent company Peab AB’s net sales for the first quarter 2018 amounted to SEK 75 million (58) and mainly consisted of internal Group services. Profit forthe period amounted to SEK -49 million (-58).
The parent company’s assets mainly consist of participations in Group companies amounting to SEK 12,116 million (11,805). In the comparable periodholdings of shares in Lemminkäinen Oyj worth SEK 432 million was included. The assets have been financed from equity of SEK 7,355 million (6,418) andlong-term liabilities amounting to SEK 3,696 million (5,430).
The parent company is indirectly affected by the risks described in the section Risks and Uncertainty Factors.
Report on the parent company income statement in summaryMSEK
Jan-Mar 2018
Jan-Mar 2017
Apr-Mar 2017/2018
Jan-Dec 2017
Net sales 75 58 279 262
Administrative expenses -109 -98 -423 -412
Operating profit -34 -40 -144 -150
Result from financial investments Profit from participation in Group companies – – 0 0
Other financial items -29 -33 54 50
Result after financial items -63 -73 -90 -100
Appropriations – – 2,626 2,626
Pre-tax profit -63 -73 2,536 2,526
Tax 14 15 -510 -509
Profit for the period -49 -58 2,026 2,017
Report on the parent company income statement and othercomprehensive income in summaryMSEK
Jan-Mar 2018
Jan-Mar 2017
Apr-Mar 2017/2018
Jan-Dec 2017
Profit for the period -49 -58 2,026 2,017
Other comprehensive income Items that can be reclassified or have been reclassified to income for the period Changes for the period in fair value of available-for-sale financial assets – -48 -27 -75
Total comprehensive income for the period -49 -106 1,999 1,942
21
Report on financial position for the parent company in summaryMSEK
31 Mar 2018
31 Mar 2017
31 Dec 2017
Assets
Fixed assets
Intangible fixed assets 43 – 38Tangible fixed assets 1 1 1
Financial fixed assets
Participation in Group companies 12,116 11,805 12,116
Other securities held as fixed assets 0 432 0
Deferred tax recoverables 110 98 110
Total financial fixed assets 12,226 12,335 12,226
Total fixed assets 12,270 12,336 12,265
Current assets
Current receivables
Accounts receivable 4 1 1
Receivables from Group companies 68 70 3,472
Current tax assets 92 25 –
Other receivables 61 44 4
Prepaid expenses and accrued income 14 12 15
Total current receivables 239 152 3,492
Liquid funds 0 0 0
Total current assets 239 152 3,492
Total assets 12,509 12,488 15,757
Equity and liabilities
Equity
Restricted equity 1,904 1,884 1,901
Non-restricted equity 5,451 4,534 5,503
Total equity 7,355 6,418 7,404
Untaxed reserves 1,315 522 1,315
Provisions
Other provisions 33 29 32
Total provisions 33 29 32
Long-term liabilities
Liabilities to Group companies 3,696 5,430 6,326
Total long-term liabilities 3,696 5,430 6,326
Current liabilities
Accounts payable 22 19 25
Liabilities to Group companies 14 6 347
Current tax liabilities – – 225
Other liabilities 8 5 7
Accrued expenses and deferred income 66 59 76
Total current liabilities 110 89 680
Total liabilities 3,806 5,519 7,006
Total equity and liabilities 12,509 12,488 15,757
22
Note 1 – Accounting principlesThe quarterly report has been prepared according to the IFRS standards that have been adopted by EU as well as the interpretations of the valid standardsadopted by EU, IFRICs. This report for the Group has been prepared according to IAS 34, Interim financial reporting as well as applicable regulations in theAnnual Accounts Act. The parent company quarterly report has been prepared according to chapter 9 in the Annual Accounts Act, Quarterly reports and RFR2, Accounting rules for legal entities. The quarterly report has been prepared for the Group and parent company according to the same accounting principlesand conditions applied in the latest Annual Report, except for the amended accounting principles described below.
In addition to the financial reports and their accompanying notes further information according to IAS 34.16A can be found in other sections of the quarterlyreport.
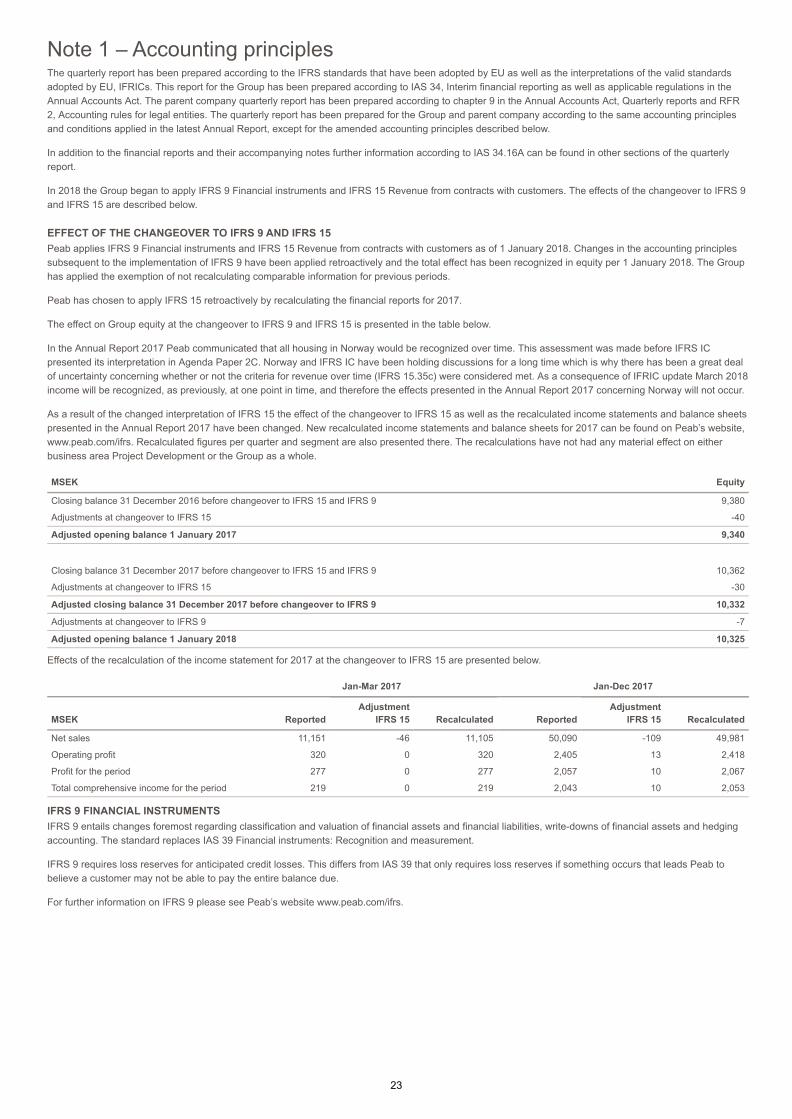
In 2018 the Group began to apply IFRS 9 Financial instruments and IFRS 15 Revenue from contracts with customers. The effects of the changeover to IFRS 9and IFRS 15 are described below.
EFFECT OF THE CHANGEOVER TO IFRS 9 AND IFRS 15Peab applies IFRS 9 Financial instruments and IFRS 15 Revenue from contracts with customers as of 1 January 2018. Changes in the accounting principlessubsequent to the implementation of IFRS 9 have been applied retroactively and the total effect has been recognized in equity per 1 January 2018. The Grouphas applied the exemption of not recalculating comparable information for previous periods.
Peab has chosen to apply IFRS 15 retroactively by recalculating the financial reports for 2017.
The effect on Group equity at the changeover to IFRS 9 and IFRS 15 is presented in the table below.
In the Annual Report 2017 Peab communicated that all housing in Norway would be recognized over time. This assessment was made before IFRS ICpresented its interpretation in Agenda Paper 2C. Norway and IFRS IC have been holding discussions for a long time which is why there has been a great dealof uncertainty concerning whether or not the criteria for revenue over time (IFRS 15.35c) were considered met. As a consequence of IFRIC update March 2018income will be recognized, as previously, at one point in time, and therefore the effects presented in the Annual Report 2017 concerning Norway will not occur.
As a result of the changed interpretation of IFRS 15 the effect of the changeover to IFRS 15 as well as the recalculated income statements and balance sheetspresented in the Annual Report 2017 have been changed. New recalculated income statements and balance sheets for 2017 can be found on Peab’s website,www.peab.com/ifrs. Recalculated figures per quarter and segment are also presented there. The recalculations have not had any material effect on eitherbusiness area Project Development or the Group as a whole.
MSEK Equity
Closing balance 31 December 2016 before changeover to IFRS 15 and IFRS 9 9,380
Adjustments at changeover to IFRS 15 -40
Adjusted opening balance 1 January 2017 9,340
Closing balance 31 December 2017 before changeover to IFRS 15 and IFRS 9 10,362
Adjustments at changeover to IFRS 15 -30
Adjusted closing balance 31 December 2017 before changeover to IFRS 9 10,332
Adjustments at changeover to IFRS 9 -7
Adjusted opening balance 1 January 2018 10,325
Effects of the recalculation of the income statement for 2017 at the changeover to IFRS 15 are presented below.
Jan-Mar 2017 Jan-Dec 2017
MSEK ReportedAdjustment
IFRS 15 Recalculated ReportedAdjustment
IFRS 15 Recalculated
Net sales 11,151 -46 11,105 50,090 -109 49,981
Operating profit 320 0 320 2,405 13 2,418
Profit for the period 277 0 277 2,057 10 2,067
Total comprehensive income for the period 219 0 219 2,043 10 2,053
IFRS 9 FINANCIAL INSTRUMENTSIFRS 9 entails changes foremost regarding classification and valuation of financial assets and financial liabilities, write-downs of financial assets and hedgingaccounting. The standard replaces IAS 39 Financial instruments: Recognition and measurement.
IFRS 9 requires loss reserves for anticipated credit losses. This differs from IAS 39 that only requires loss reserves if something occurs that leads Peab tobelieve a customer may not be able to pay the entire balance due.
For further information on IFRS 9 please see Peab’s website www.peab.com/ifrs.
23
IFRS 15 REVENUE FROM CONTRACTS WITH CUSTOMERSIFRS 15 Revenue from contracts with customers, replaces IAS 18 Revenue, IAS 11 Construction contracts and IFRIC 15 Agreements for the construction ofreal estate.
For business area Project Development implementing IFRS 15 means our own home (villas) developments in Sweden are reported according to so-called“income over time”. Swedish tenant-owned housing projects will continue to be recognized as previously through “income over time”. IFRS 15 has not led toany changes in reporting regarding housing projects in Finland and Norway since income is first recognized when the home is turned over to the buyer.
After implementation of IFRS 15 segment reporting mirrors legal reporting. The differences between operative and legal reporting no longer exist afterimplementation of IFRS 15. In regards to Peab’s construction contract operations in business area Construction and Civil Engineering, IFRS 15 does not entailany material change in when income is recognized or for what amount. The changeover to IFRS 15 does not entail any material change for business areaIndustry either.
For further information on IFRS 15 please see Peab’s website www.peab.com/ifrs.
IFRS 16 LEASESIFRS 16 Leases will replace IAS 17 Leases as of 1 January 2019. Peab does not plan to prematurely apply the standard. IFRS 16 will require Peab as alessee to report all leasing contracts as assets and liabilities on the balance sheet, representing the right to use the leased asset respectively the obligation topay leasing fees. Regarding leasing contracts, depreciation of the leasing asset and interest costs on the leasing liability are recognized in the incomestatement. Peab is running a special project to implement, and determine the effect of, IFRS 16 on the Group’s profit and position as well as additionaldisclosures. Peab’s balance sheet total is expected to increase through activating contracts that are currently classified as operational, the operating profit isexpected to improve while financial costs are expected to grow. Peab estimates that the balance sheet total will increase by around two-five percent but theanalysis must be completed before any possible final effects can be quantified. Furthermore, the effects will be influenced by which of the available changeovermethods Peab chooses to use for the changeover to IFRS 16, a choice Peab has not yet made.
PARENT COMPANYIFRS 15 Revenue from contracts with customers will have no effect on parent company revenue accounting. IFRS 9 Financial instruments, entails new rulesfor writing down receivables based on anticipated credit losses. The parent company’s current receivables from Group companies fall within the area ofapplication for impairment rules in IFRS 9. The receivables are overwhelmingly Group contributions that are settled shortly after the balance sheet date. Onmaterial grounds no reserve is reported for anticipated credit losses regarding these receivables. Otherwise IFRS 9 had no effect on accounting on 1 January2018. The new standard IFRS 16 Leasing does not affect the parent company since the standard is exempt from application in legal entities and leasing in theparent company is insignificant.
24
Note 2 – Income allocationGroup Jan-Mar 2018 MSEK Construction
CivilEngineering Industry
ProjectDevelopment
Groupfunctions Eliminations Group
Allocation per external/internal customer External sales 5,312 2,488 1,394 2,272 24 0 11,490
Internal sales 1,251 328 784 15 235 -2,613 –
Total 6,563 2,816 2,178 2,287 259 -2,613 11,490
Allocation per country Sweden 5,072 2,479 1,970 1,503 222 -2,281 8,965
Norway 752 309 100 178 22 -118 1,243
Finland 738 28 106 606 15 -213 1,280
Other 1 2 -1 2
Total 6,563 2,816 2,178 2,287 259 -2,613 11,490
Allocation per type of customer
Public sector 2,398 1,754 166 3 12 4,333
Private customers 2,914 734 1,228 2,269 12 7,157
Internal customers 1,251 328 784 15 235 -2,613 –
Total 6,563 2,816 2,178 2,287 259 -2,613 11,490
Allocation per point in time At one point in time 9 12 1,261 809 27 -441 1,677
Over time 6,554 2,802 436 1,428 212 -1,864 9,568
Income from rent 2 481 50 20 -308 245
Total 6,563 2,816 2,178 2,287 259 -2,613 11,490
1) Income from rent is recognized according to IAS 17
Allocation per type of income
Contract work 6,552 2,802 436 1,428 -1,650 9,568
Sales of products 1 831 -284 548
Sales of property projects 777 -3 774
Transportation services etc. 408 -140 268
Administrative services 2 212 -214 –
Income from rent 2 481 50 20 -308 245
Other 8 12 22 32 27 -14 87
Total 6,563 2,816 2,178 2,287 259 -2,613 11,490
1)
25
Group Jan-Mar 2017 MSEK Construction
CivilEngineering Industry
ProjectDevelopment
Groupfunctions Eliminations Group
Allocation per external/internal customer External sales 5,351 2,068 1,464 2,200 22 0 11,105
Internal sales 1,035 320 773 12 213 -2,353 –
Total 6,386 2,388 2,237 2,212 235 -2,353 11,105
Allocation per country Sweden 5,045 2,087 1,997 1,895 208 -2,080 9,152
Norway 816 271 149 181 17 -77 1,357
Finland 524 30 88 136 10 -195 593
Other 1 3 -1 3
Total 6,386 2,388 2,237 2,212 235 -2,353 11,105
Allocation per type of customer
Public sector 2,471 1,455 309 4 13 4,252
Private customers 2,880 613 1,155 2,196 9 6,853
Internal customers 1,035 320 773 12 213 -2,353 –
Total 6,386 2,388 2,237 2,212 235 -2,353 11,105
Allocation per point in time At one point in time 18 10 1,353 882 25 -440 1,848
Over time 6,368 2,378 531 1,281 199 -1,675 9,082
Income from rent 353 49 11 -238 175
Total 6,386 2,388 2,237 2,212 235 -2,353 11,105
1) Income from rent is recognized according to IAS 17
Allocation per type of income
Contract work 6,367 2,378 530 1,281 -1,474 9,082
Sales of products 1 834 -269 566
Sales of property projects 850 850
Transportation services etc. 481 -152 329
Administrative services 1 1 199 -201 –
Income from rent 353 49 11 -238 175
Other 17 10 38 32 25 -19 103
Total 6,386 2,388 2,237 2,212 235 -2,353 11,105
1)
26
Group Jan-Dec 2017 MSEK Construction
CivilEngineering Industry
ProjectDevelopment
Groupfunctions Eliminations Group
Allocation per external/internal customer
External sales 22,073 10,319 9,206 8,282 101 49,981
Internal sales 4,653 1,506 3,555 61 892 -10,667 –
Total 26,726 11,825 12,761 8,343 993 -10,667 49,981
Allocation per country Sweden 20,694 10,470 11,226 6,969 862 -9,329 40,892
Norway 3,304 1,237 1,075 434 84 -391 5,743
Finland 2,722 118 446 940 47 -942 3,331
Other 6 14 -5 15
Total 26,726 11,825 12,761 8,343 993 -10,667 49,981
Allocation per type of customer
Public sector 8,712 7,388 2,685 19 92 18,896
Private customers 13,361 2,931 6,521 8,263 9 31,085
Internal customers 4,653 1,506 3,555 61 892 -10,667 –
Total 26,726 11,825 12,761 8,343 993 -10,667 49,981
Allocation per point in time At one point in time 96 51 6,251 3,015 119 -2,107 7,425
Over time 26,625 11,771 4,914 5,161 832 -7,589 41,714
Income from rent 5 3 1,596 167 42 -971 842
Total 26,726 11,825 12,761 8,343 993 -10,667 49,981
1) Income from rent is recognized according to IAS 17
Allocation per type of income
Contract work 26,619 11,771 4,911 5,159 -6,750 41,710
Sales of products 6 3,847 -1,238 2,615
Sales of property projects 2,802 -26 2,776
Transportation services etc. 2 2,186 -728 1,460
Administrative services 6 3 2 832 -839 4
Income from rent 5 3 1,596 167 42 -971 842
Other 90 49 218 213 119 -115 574
Total 26,726 11,825 12,761 8,343 993 -10,667 49,981
1)
27
Note 3 – Operating segmentGroup Jan-Mar 2018 MSEK
Con- struction
Civil Engineering Industry
Project Development
Group functions Eliminations Group
External sales 5,312 2,488 1,394 2,272 24 0 11,490
Internal sales 1,251 328 784 15 235 -2,613 –
Total income 6,563 2,816 2,178 2,287 259 -2,613 11,490
Operating profit 143 42 -38 201 -55 -3 290
Operating margin, % 2.2 1.5 -1.7 8.8 2.5
Net finance -34
Pre-tax profit 256
Tax -38
Profit for the period 218
Capital employed (closing balance) 5,674 10,867
Group Jan-Mar 2017 MSEK
Con- struction
Civil Engineering Industry
Project Development
Group functions Eliminations Group
External sales 5,351 2,068 1,464 2,200 22 0 11,105
Internal sales 1,035 320 773 12 213 -2,353 –
Total income 6,386 2,388 2,237 2,212 235 -2,353 11,105
Operating profit 139 39 -23 222 -47 -10 320
Operating margin, % 2.2 1.6 -1.0 10.0 2.9
Net finance -9
Pre-tax profit 311
Tax -34
Profit for the period 277Capital employed (closing balance) 5,068 8,731
Group Jan-Dec 2017 MSEK
Con- struction
Civil Engineering Industry
Project Development
Group functions Eliminations Group
External sales 22,073 10,319 9,206 8,282 101 0 49,981
Internal sales 4,653 1,506 3,555 61 892 -10,667 –
Total income 26,726 11,825 12,761 8,343 993 -10,667 49,981
Operating profit 602 374 867 804 -228 -1 2,418
Operating margin, % 2.3 3.2 6.8 9.6 4.8
Net finance 40
Pre-tax profit 2,458
Tax -391
Profit for the year 2,067
Capital employed (closing balance) 5,781 9,986
28
Note 4 – Financial assets and liabilities valued at fair valueThe table below shows the allocated level for financial assets and financial liabilities recognized at fair value in the Group’s balance sheet. Measurement of fairvalue is based on a three level hierarchy;
Level 1: prices that reflect quoted prices on an active market for identical assets. Level 2: based on direct or indirect inputs observable to the market not included in level 1. Level 3: based on inputs unobservable to the market.
For a description of how fair value has been calculated see the Annual Report 2017, note 35. The fair value of financial assets and liabilities is estimated to be,in principle, the same as their recognized values.
Group 31 Mar 2018 31 Mar 2017 31 Dec 2017
MSEK Level 1 Level 2 Level 3 Total Level 1 Level 2 Level 3 Total Level 1 Level 2 Level 3 Total
Assets
Other securities held as fixed assets 71 71 432 55 487 59 59
Whereof shareholding in listed company – 432 432 –
Whereof investment in unlisted funds 71 71 55 55 59 59
Other long-term receivables 2 2 – 2 2
Whereof commodity hedging with futures 2 2 – 2 2
Other current receivables 1 1 1 1 4 4
Whereof currency swaps 1 1 1 1 4 4
Total assets – 3 71 74 432 1 55 488 – 6 59 65Liabilities
Other long-term liabilities 36 23 59 80 26 106 44 23 67
Whereof interest rate swaps 36 36 80 80 44 44
Whereof contingent consideration 23 23 26 26 23 23
Other current liabilities 10 11 21 3 3 2 11 13
Whereof currency swaps 10 10 3 3 2 2
Whereof contingent consideration 11 11 – 11 11
Total liabilities – 46 34 80 – 83 26 109 – 46 34 80
Parent company 31 Mar 2018 31 Mar 2017 31 Dec 2017
MSEK Level 1 Level 2 Level 3 Total Level 1 Level 2 Level 3 Total Level 1 Level 2 Level 3 Total
Assets
Other securities held as fixed assets – 432 432 –
Whereof shareholding in listed company – 432 432 –
Total assets – – – – 432 – – 432 – – – –
The tables below is a reconciliation between the opening and closing balance for assets and liabilities included in level 3.
Group Other securities held as fixed asset
MSEK 31 mar 2018 31 mar 2017 31 dec 2017
Opening balance 59 54 54Investments during the period 5 1 17
Repayments during the period – – -14
Dividends received – – -1
Reported in profit for the period * 7 – -2
Reported in other comprehensive income – – 5
Closing balance 71 55 59
* Reported in net financial items
Group Contingent consideration
MSEK 31 mar 2018 31 mar 2017 31 dec 2017
Opening balance 34 23 23Acquisitions during the period – 3 11
Reported in profit for the period
Interest expense (discount) * 0 0 0
Closing balance 34 26 34
The contingent consideration will amount to at least SEK 3 million and at most SEK 38 million. * Reported in net financial items
29

Future financial informationQuarterly report January-June 2018 17 August 2018
Quarterly report January-September 2018 9 November 2018
Year-end Report 2018 8 February 2019
Annual and Sustainability Report 2018 April 2019
Förslöv, 7 May 2018
Jesper Göransson CEO and President
The information in this interim report has not been reviewed separately bythe company’s auditors.
••••
30
Quarterly dataGroup
MSEKJan-Mar
2018Oct-Dec
2017Jul-Sep
2017Apr-Jun
2017Jan-Mar
2017Oct-Dec
2016Jul-Sep
2016Apr-Jun
2016Jan-Mar
2016
Net sales 11,490 14,490 11,595 12,791 11,105 13,673 11,197 12,600 8,584
Production costs -10,482 -13,103 -10,431 -11,461 -10,234 -12,409 -10,107 -11,323 -7,869
Gross profit 1,008 1,387 1,164 1,330 871 1,264 1,090 1,277 715
Sales and administrative expenses -737 -695 -528 -735 -656 -700 -478 -697 -564
Other operating income 25 71 78 38 118 59 30 37 23
Other operating costs -6 -10 0 -2 -13 -4 -3 0 -5
Operating profit 290 753 714 631 320 619 639 617 169
Financial income 27 118 17 36 20 66 24 40 65
Financial expenses -61 -46 -26 -50 -29 -71 -37 -59 -76
Net finance -34 72 -9 -14 -9 -5 -13 -19 -11
Pre-tax profit 256 825 705 617 311 614 626 598 158
Tax -38 -145 -120 -92 -34 -96 -96 -94 -25
Profit for the period 218 680 585 525 277 518 530 504 133
Profit for the period, attributable to: Shareholders in parent company 218 680 585 525 277 518 530 504 133
Non-controlling interests 0 0 – – – 0 0 0 0
Profit for the period 218 680 585 525 277 518 530 504 133
Key ratios Earnings per share, SEK 0.74 2.31 1.98 1.78 0.94 1.76 1.80 1.71 0.45
Average number of outstanding shares,million 295.0 295.0 295.0 295.0 295.0 295.0 295.0 295.0 295.0
Capital employed (closing balance) 14,631 14,074 14,438 13,874 13,501 14,362 15,005 13,702 13,418
Equity (closing balance) 10,688 10,332 9,757 9,170 9,559 9,340 8,698 8,023 8,253
31
Business areas
MSEKJan-Mar
2018Oct-Dec
2017Jul-Sep
2017Apr-Jun
2017Jan-Mar
2017Oct-Dec
2016Jul-Sep
2016Apr-Jun
2016Jan-Mar
2016
Net sales Construction 6,563 7,631 5,721 6,988 6,386 6,992 5,510 6,420 5,199
Civil Engineering 2,816 3,787 2,819 2,831 2,388 3,292 2,654 2,765 2,029
Industry 2,178 3,684 3,420 3,420 2,237 3,462 3,449 3,356 1,894
Project Development 2,287 2,205 1,926 2,000 2,212 2,263 1,486 2,187 1,268
– of which Property Development 156 117 131 106 659 148 130 1,031 76
– of which Housing Development 2,131 2,088 1,795 1,894 1,553 2,115 1,356 1,156 1,192
Group functions 259 262 242 254 235 242 226 225 204
Eliminations -2,613 -3,079 -2,533 -2,702 -2,353 -2,578 -2,128 -2,353 -2,010
Group 11,490 14,490 11,595 12,791 11,105 13,673 11,197 12,600 8,584
Operating profit Construction 143 180 121 162 139 147 127 152 116
Civil Engineering 42 136 89 110 39 120 93 105 37
Industry -38 302 342 246 -23 227 336 202 -12
Project Development 201 246 174 162 222 235 110 187 59
– of which Property Development 50 6 -3 5 90 20 -37 102 4
– of which Housing Development 151 240 177 157 132 215 147 85 55
Group functions -55 -128 -4 -49 -47 -60 -6 -29 -27
Eliminations -3 17 -8 0 -10 -50 -21 0 -4
Group 290 753 714 631 320 619 639 617 169
Operating profit, %
Construction 2.2 2.4 2.1 2.3 2.2 2.1 2.3 2.4 2.2
Civil Engineering 1.5 3.6 3.2 3.9 1.6 3.6 3.5 3.8 1.8
Industry -1.7 8.2 10.0 7.2 -1.0 6.6 9.7 6.0 -0.6
Project Development 8.8 11.2 9.0 8.1 10.0 10.4 7.4 8.6 4.7
– of which Property Development 32.1 5.1 -2.3 4.7 13.7 13.5 -28.5 9.9 5.3
– of which Housing Development 7.1 11.5 9.9 8.3 8.5 10.2 10.8 7.4 4.6
Group functions
Eliminations
Group 2.5 5.2 6.2 4.9 2.9 4.5 5.7 4.9 2.0
Order situation, MSEK
Orders received 12,906 13,039 10,651 12,880 12,429
Order backlog at the end of the period 43,055 40,205 40,211 39,470 38,149
32
Alternative performance measures and financialdefinitionsAlternative performance measures are used to describe the development of operations and to enhance comparability between periods. These are not definedunder IFRS but correspond to the methods applied by executive management and Board of Directors to measure the company’s financial performance.Alternative performance measures should not be viewed as a substitute for financial information presented in accordance with IFRS but rather as acomplement. For more information see www.peab.com/alternative-performance-measures.
Available liquidityLiquid funds and short-term investments along with unutilized creditfacilities.Shows the Group´s available liquidity.
Capital employed for the business areasTotal assets in the business areas at the end of the period reduced bydeferred tax recoverables and internal receivables from the internalbank Peab Finans with deductions for non-interest-bearing liabilities,provisions and deferred tax liabilities. The measurement is used tomeasure capital utilization and its effectiveness for the business areas,and is only presented as a net amount per business area.
Capital employed for the GroupTotal assets at the end of the period less non-interest-bearing operatingliabilities and provisions. The measurement is used to measure capitalutilization and its effectiveness.
Earnings per shareProfit for the period attributable to shareholders in parent companydivided by the average number of outstanding shares during the period.
Equity/assets ratioEquity as a percentage of total assets at the end of the period. Showsfinancial position.
Equity per shareEquity attributable to shareholders in parent company divided by thenumber of outstanding shares at the end of the period.
Net debtInterest-bearing liabilities less liquid funds and interest-bearing assets.
Net debt/equity ratioInterest-bearing net debt in relation to equity. Shows financial position.
Net investmentsThe change in the period of the reported value of current assets (CB-OB) plus depreciation and write-downs.
Operating marginOperating profit as a percentage of net sales.
Order backlogThe value at the end of the period of the remaining income in ongoingproduction plus orders received yet to be produced.
Orders receivedThe sum of orders received during the period. Measures how neworders replace produced work.
Return on capital employedThe pre-tax profit of the rolling 12 month period with the addition offinancial expenses in percent of the average (last four quarters) capitalemployed. The measurement is used to measure capital efficiency andto allocate capital for new investments.
Return on equityThe profit of the rolling 12 month period attributable to shareholders ofshares in the parent company divided by the average (last fourquarters) equity attributable to shareholders of shares in the parentcompany. The measurement is used to create efficient business and arational capital structure.
33
Peab is one of the leading construction and civilengineering companies in the Nordic area withoperations in Sweden, Norway and Finland.Peab affects society and the environment for the people who now and in the future will live withwhat we develop, build and construct. Peab is also a big employer with local roots and hasconsequently a considerable responsibility.
Peab participates in developing a more sustainable society. This means that Peab strives to meet thedemands and expectations from our surroundings and at the same time create new businessopportunities.
Peab’s business contributes to society by developing and building new homes and offices, publicfunctions like schools, libraries, hospitals and infrastructure in the form of bridges and roads. In otherwords we make a difference in daily life in both small and large places.
Long-term relationships with customers and suppliers result in better social, environmental andeconomic conditions. Stable profitability generates the funds necessary to develop our business andreturns for our shareholders.
Net sales
SEK 50billionEmployees, appr.
15 000
Photographers: Bert Leandersson, Cecilia Hatløy, Peter Steen, Viktoria Uyanih, Ørjan Bertelsen
Business modelPeab is characterized by a decentralized and cost-efficient organizationwith four cooperating business areas whose operations are based onlocal entrepreneurship close to customers. Our business model withfour business areas creates opportunities throughout the value chain ina construction project.
Business area Construction works witheverything from new construction ofhomes, public and commercial premisesto renovations and extensions as wellas offering construction services.
Business area Civil Engineering isactive on the local civil engineeringmarket as well as in larger Nordicinfrastructure projects like highways,railroads and bridges. It also operatesand maintains streets and roads.
Business area Industry delivers, amongother things, ballast, concrete, asphalt,temporary electricity and prefabricatedconcrete elements to external customersand the other business areas in Peab.The business area also provides cranes,machines and transportation as well ashandling production waste.
Business area Project Developmenthandles Group acquisitions as wellas development, management anddivestment of residential and commercialproperty. Housing Development is mainlygeared towards private consumers whileProperty Development is aimed at realestate investors.
Four collaborating business areas create added value