Embed Size (px)
Citation preview
Page 1 of 34
S Supplemental Disclosures
Safe Harbour: Some information in this report may contain forward-looking statements. We have based these forward-looking statements on our current beliefs, expectations, and intentions as to facts, actions and events that will or may occur in the future. Such statements generally are identified by forward-looking words such as “believe”, “plan”, “anticipate”, “continue”, “estimate”, “expect”, “may”, “will” or other similar words.
A forward-looking statement may include a statement of the assumptions or bases underlying the forward-looking statement. We have chosen these assumptions or bases in good faith, and we believe that they are reasonable in all material respects. However, we caution you that forward-looking statements and assumed facts or bases almost always vary from actual results, and the differences between the results implied by the forward-looking statements and assumed facts or bases and the actual results could be material depending on the circumstances. You should also keep in mind that any forward-looking statement made by us in this report or elsewhere speaks only of the date on which we made it. New risks and uncertainties come up from time to time, and it is impossible for us to predict these events or how they may affect us. We have no duty to, and do not intend to, update or revise the forward-looking statements in this report after the date hereof. In light of these risks and uncertainties, any forward-looking statement made in this report or elsewhere may or may not occur and has to be read and understood along with this supplemental disclosure.
General Risk: Investments in equity and equity-related securities involve a degree of risk and investors should not invest in the equity shares of the Company unless they can afford to take the risk of losing their investment. For taking an investment decision, investors must rely on their own examination of the Company including the risks involved.
Convenience Translation: All references in this report to “Rs” are to Indian Rupees and all references herein to “US$” are to United States Dollars.
We publish our financial statements in Indian Rupees, the legal currency of the Republic of India. All amounts translated into United States Dollars in this report are provided solely for the convenience of the reader, and no representation is made that the Indian Rupee or United States Dollar amounts referred to herein could have been or could be converted into United States Dollars or Indian Rupees respectively, as the case may be, at any particular rate, the rates stated in this report, or at all.
Others: In this report, the terms “we”, “us”, “our”, “the Company” or “the Group”, unless otherwise specified or the context otherwise implies, refer to Reliance Communications Limited (“Reliance Communications”) and its affiliates, including, inter alia, FLAG Telecom Group Limited (“FLAG”), Reliance Telecom Limited (“RTL”), Reliance Communications Infrastructure Limited (“RCIL”) and Reliance Infratel Limited (“Reliance Infratel”). Further abbreviations are defined within this report.
Any discrepancies in any table between total and sums of the amounts listed are due to rounding off.
Disclaimer: This communication does not constitute an offer of securities for sale in the United States. Securities may not be sold in the United States absent registration or an exemption from registration under the U.S. Securities Act of 1933, as amended. Any public offering of securities to be made in the United States will be made by means of a prospectus and will contain detailed information about the Company and its management, as well as financial statements.
Quarterly Report on the Unaudited Financial Results for the Quarter and Year ended March 31, 2009
Reliance Communications Limited Registered office: H Block, 1st Floor, Dhirubhai Ambani Knowledge City, Navi Mumbai - 400710
April 30, 2009

Page 2 of 34
Page 3 of 34
Table of Contents
1. Performance Snapshot ................................................................................................... 4
2. Overview ......................................................................................................................... 5
3. Financial Highlight ........................................................................................................ 11
4. Key Performance Indicators ......................................................................................... 16
5. Basis of Presentation of Financial Statements ............................................................ 18
6. Financial Statements .................................................................................................... 23
7. Accounting Policies ...................................................................................................... 24
8. Notes to Accounts. (As reported to stock exchanges) ................................................ 29
9. Glossary ........................................................................................................................ 31
Page 4 of 34
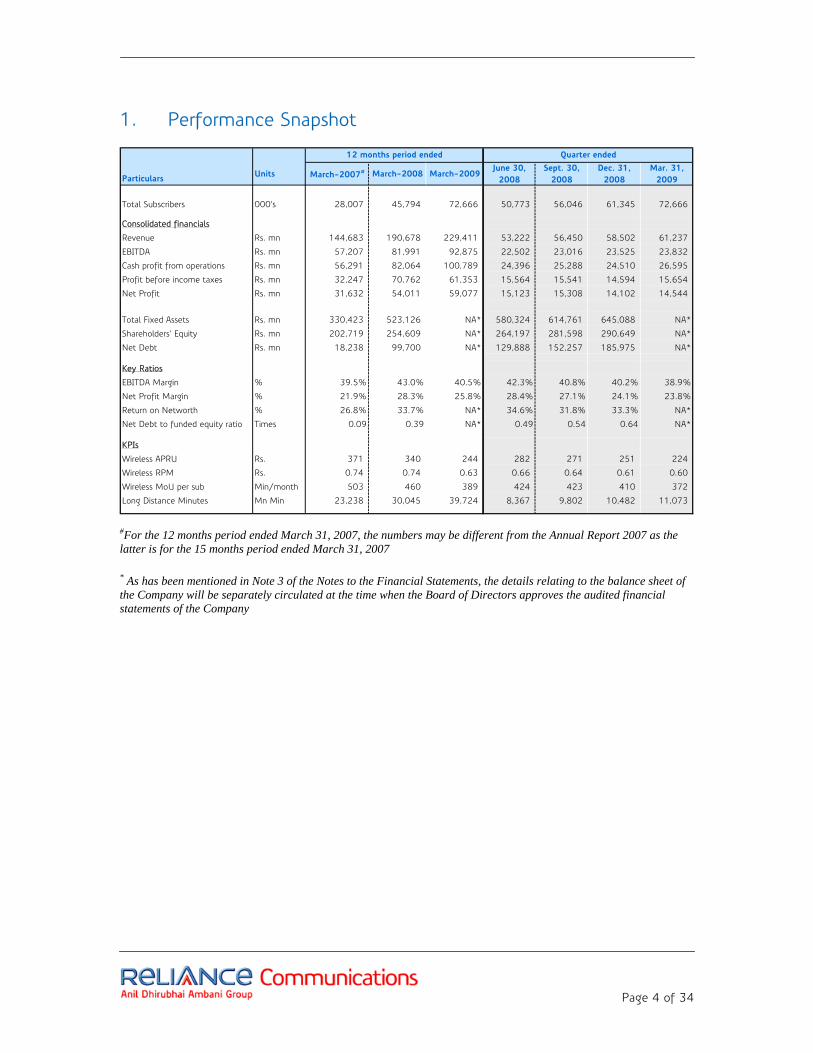
1. Performance Snapshot
Particulars Units March-2007# March-2008 March-2009June 30,
2008Sept. 30,
2008Dec. 31,
2008Mar. 31,
2009
Total Subscribers 000’s 28,007 45,794 72,666 50,773 56,046 61,345 72,666
Consolidated financials
Revenue Rs. mn 144,683 190,678 229,411 53,222 56,450 58,502 61,237
EBITDA Rs. mn 57,207 81,991 92,875 22,502 23,016 23,525 23,832
Cash profit from operations Rs. mn 56,291 82,064 100,789 24,396 25,288 24,510 26,595
Profit before income taxes Rs. mn 32,247 70,762 61,353 15,564 15,541 14,594 15,654
Net Profit Rs. mn 31,632 54,011 59,077 15,123 15,308 14,102 14,544
Total Fixed Assets Rs. mn 330,423 523,126 NA* 580,324 614,761 645,088 NA*
Shareholders' Equity Rs. mn 202,719 254,609 NA* 264,197 281,598 290,649 NA*
Net Debt Rs. mn 18,238 99,700 NA* 129,888 152,257 185,975 NA*
Key Ratios
EBITDA Margin % 39.5% 43.0% 40.5% 42.3% 40.8% 40.2% 38.9%
Net Profit Margin % 21.9% 28.3% 25.8% 28.4% 27.1% 24.1% 23.8%
Return on Networth % 26.8% 33.7% NA* 34.6% 31.8% 33.3% NA*
Net Debt to funded equity ratio Times 0.09 0.39 NA* 0.49 0.54 0.64 NA*
KPIs
Wireless APRU Rs. 371 340 244 282 271 251 224
Wireless RPM Rs. 0.74 0.74 0.63 0.66 0.64 0.61 0.60
Wireless MoU per sub Min/month 503 460 389 424 423 410 372
Long Distance Minutes Mn Min 23,238 30,045 39,724 8,367 9,802 10,482 11,073
Quarter ended12 months period ended
#For the 12 months period ended March 31, 2007, the numbers may be different from the Annual Report 2007 as the latter is for the 15 months period ended March 31, 2007 * As has been mentioned in Note 3 of the Notes to the Financial Statements, the details relating to the balance sheet of the Company will be separately circulated at the time when the Board of Directors approves the audited financial statements of the Company
Page 5 of 34
2. Overview
2.1. Introduction
Reliance Communications Limited (“Reliance Communications” or “the Company”) is India’s largest integrated communications service provider in the private sector with over 77 million individual, enterprise, and carrier customers.
We operate pan-India across the full spectrum of wireless, wireline, and long distance, voice, data, video and internet communication services. We also have an extensive international presence through the provision of long distance voice, data and internet services and submarine cable network infrastructure globally.
2.2. Strategic Business Units
The business of Reliance Communications is organized into three strategic customer-facing business units: Wireless, Global, and Broadband. In addition, subsidiaries of Reliance Communications are engaged, inter alia, in the ownership, operation and development of telecom infrastructure, such as wireless communications sites and towers. Our strategic business units are supported by our fully integrated, state-of-the-art network and operations platform and by the largest retail distribution and customer service facilities of any communications service provider in India.
2.2.1. Wireless
We offer CDMA and GSM based wireless services on a nationwide basis, including mobile and fixed wireless voice, data, and value added services for individual consumers and enterprises.
Following the recent roll-out of our GSM network, we are now the only player in the country offering both GSM and CDMA (dual technology) services on a nationwide basis.
We not only provide telecom connectivity to the mass market consumer segment but also, as an Integrated Telecom Service Provider, we offer total telecom solutions to our corporate, SME & SoHo customers.
Our portfolio of products includes mobile handsets, fixed wireless phones/terminals, high-speed internet data cards and Blackberry services. Our primary brands are Reliance Mobile for the mobile portfolio of services, Reliance Hello for the fixed wireless portfolio of services and Reliance Netconnect for wireless data services. We offer a unique wireless multi media experience under the brand Reliance Mobile World.
We also offer public calling office (“PCO”) services over our wireless network through independent retail operators of such facilities. We have pioneered rural telephony initiatives that are supported by the Government of India’s Universal Services Obligation (USO) Fund. Additionally, we provide connectivity for devices such as point of sale terminals, lottery terminals, and ATM terminals.
Page 6 of 34
We are among the top two providers of wireless communication services in the country, with a wireless subscriber base of over 73 million as of March 31, 2009 representing a market share of 18.8%. We are also the second largest seller of mobile handsets/devices in the country, and the largest service provider engaged in this activity. Due to our unique strength in high speed wireless data transmission, we have nearly 60% market share of the data card and USB modem market for laptops and PCs. In addition, we are the largest PCO operator in the private sector with over 50% market share.
2.2.2. Global
We offer comprehensive national and international long distance voice, video and data network services on an integrated and highly scalable platform. Our business segments comprise Data, Voice, WiMAX and NLD. We have wholesale, enterprise and retail product offerings in each business segment.
In India, we provide long distance business services including wholesale voice, bandwidth and infrastructure services. Globally, we provide carrier’s carrier voice, carrier’s carrier bandwidth, enterprise data and consumer voice services.
In Voice, we offer ILD carriage and termination to other carriers as well as, on an inter segment basis, to other business units of Reliance Communications as part of the wholesale product offering. We entered the long distance market in India in mid-2003 and are one of the largest carriers of international voice minutes with a market share of 30% for ILD wholesale inbound traffic.
In Voice, as part of our retail offering we offer virtual international calling services to retail customers for calls to 200 international destinations including India under the brand Reliance Global Call. Our retail services are available to customers in eight countries including the United States, Canada, the United Kingdom, Australia, New Zealand, Hong Kong and Malaysia. We have over 2 million customers for our Reliance Global Call service. Usage of Reliance Global Call accounts for 40% of total retail market calls from the United States to India.
In NLD, we offer NLD carriage and termination to other carriers as well as, on an inter segment basis, to other business units of Reliance Communications. We also offer bandwidth and infrastructure services to other operators.
Our international Data business is underpinned by our ownership of the largest private submarine cable system in the world, directly connecting 40 countries from the East coast of the United States, to Europe, the Middle East, India, South and East Asia, through to Japan. The network seamlessly interconnects with our 175,000 route kilometres fibre optic cables within India. We are further expanding our global network with implementation of the FLAG Next Generation Network cable system.
As part of wholesale offering, we offer national and international (submarine cable) network infrastructure on both an Indefeasible Right of Use (“IRU”) and leased circuit

Page 7 of 34
basis, internet bandwidth, IPLC to carriers, ISPs, content providers and enterprises globally.
We have a very strong and rapidly growing enterprise business segment outside India.
Our acquisition of Yipes Holdings Inc. in 2007 has made us among the top 10 Managed Ethernet services providers in the U.S. Our acquisition of Vanco Group Limited in 2008, has strengthened our position in the global enterprise data market. We have over 1,400 enterprise customers globally in developed markets of the US, UK, France, Germany, Benelux, Singapore and Australia. In December 2008, Reliance Globalcom has made an entry into Gartner’s Magic Quadrant.
Our WiMAX business segment is currently focused on acquiring licenses in several emerging markets.
2.2.3. Broadband
We offer the most comprehensive portfolio of enterprise voice, data, video, internet and IT infrastructure services provided by any operator in India. These services include: national and international private leased circuits, broadband internet access, audio and video conferencing, MPLS-VPN, remote access VPN, Centrex, toll-free services and managed internet data centre (“IDC”) services. We offer unique, value-added products and services to large, medium and small enterprises for their communications, networking, and IT infrastructure needs across the country. We have a product range of more than 38 products to suit the needs of all customer segments, more than any other service provider in India.
We launched our enterprise broadband services in the first half of 2005. We are leveraging our existing metro fibre optic networks to establish direct building connectivity on-net. Currently we are operating in 44 cities in India with close to 930,000 buildings connected directly to our network serving close to 1.38 million access lines.
Our primary building access technology is metro Ethernet LAN, which offers performance and cost advantages versus other access technologies in areas with high service potential. Our Metro Ethernet LAN technology gives us a significant edge in delivering high bandwidth data services, as compared with all of our competitors who operate on predominantly copper networks. In cities where we are not currently providing wireline direct building connectivity, we have selectively deployed wireless LMDS to access targeted buildings in accordance with our customers requirements. In the top 10 cities of India, we have augmented building connectivity program through deployment of WiMAX 802.16d technology. We propose to use the Wimax technology to provide last mile to our Enterprise Customers in more than 100 Cities in PAN India in FY 2010.

Page 8 of 34
We have established an enterprise customer base that includes over 850 of the Top 1,000 Indian enterprises and MNCs. We are also expanding our enterprise subscriber base rapidly in the SME segment. We are the clear market leader in IDC services (Reliance Data Center) with 60% market share. We also maintain leadership in other high growth segments of the market such as MPLS-VPN and Centrex solutions.
2.2.4. Reliance Big TV
We launched nationwide satellite TV services on 19th August, 2008 under our wholly-owned subsidiary Reliance Big TV Limited. These services are available on the Direct To Home (DTH) format to consumers in India.
Reliance Big TV uses state-of-the-art MPEG 4 technology to deliver over 200 broadcast channels and over 30 exclusive movie channels to its subscribers. We will also deliver high definition content and Dolby digital voice quality to our viewers on this platform to create a highly personalized video experience.
Reliance Big TV is available at more than 100,000 outlets across 6,500 towns in the country. The retail and distribution reach, as well as other elements of infrastructure established for our wireless network, have been leveraged to expand our DTH presence.
Reliance Big TV currently has 1.5 million subscribers, about 12% of the DTH market in India within a short span of launch. This is the fastest ramp up ever achieved by any DTH operator in the world.
2.3. Network and Operating Facilities
We have India’s widest network coverage encompassing 23,000 towns, 600,000 villages & all major railway routes & highways which covers 90% of the country’s population.
Our national inter-city long distance network is the largest next generation network in India, with over 160,000 route kilometres of ducted fibre optic cables, We have a totally unique asset in over 25,000 route kilometres of ducted fibre optic cables installed in the leading cities in India. The entire inter-city and metro fibre optic backbone network is deployed in a ring and mesh architecture and is MPLS enabled. The Reliance Data Network has over 180 MPLS integrated network nodes.
We have over 304,000 sq. ft. of IDC capacity in multiple locations and plan to add more IDC capacity to meet growing demand. Our network operating centre in Navi Mumbai, India, is one of the most advanced in the world. The entire range of our products and services is enabled by streamlined, fully integrated, flow through operating and business support systems. These facilities provide us with by far the most superior platform in India for offering bandwidth intensive, feature rich, converged services and solutions for consumers, enterprises, and carrier customers with virtually limitless scalability.

Page 9 of 34
Our national networks are integrated with our international networks.
With the acquisition of Vanco, Reliance Globalcom will get significant advantage through Vanco’s relationship with over 700 global, regional and domestic carriers capable of offering services in 230 countries. Vanco’s Managed Network Services are currently available in over 40,000 locations across 163 countries.
Through our acquisition of Yipes Holdings Inc. we own 22,000 kms of metro fibre network in the U.S. in 14 metros. Our customers can get seamless end-to-end connectivity to these key business markets.
Our consumer and SME offerings are supported by one of the most extensive and powerful distribution networks in India with throughput capacity for over 24 million handsets per annum. The backbone of our retail presence is nearly 2,000 exclusive Reliance World and Reliance Express stores with a presence in over 700 Indian cities. These stores offer customer activation and after sales service. Reliance World stores also operate as broadband experience centres offering a range of broadband internet and video conferencing applications. Together with preferred retailers, we have a branded retail presence in over 1,300 towns. We have a plan for aggressive expansion in our branded retail outlets during the course of this financial year. Furthermore, we have over 600,000 retailers who offer sale of Reliance Mobile connections or recharge of our prepaid mobile and FWP’s in our coverage footprint. Our customer service is further supported by about 10,000-employee, multi-lingual contact centre facilities.
Page 10 of 34
2.4. Principal Operating Companies
Reliance Communications Limited is the Flagship company and is also the holding company for the other major operating companies in the Group. Reliance Communications provides wireless, wireline, broadband, and long distance services in India and overseas. Its major assets are the wireless network, transmission networks used in its business, and the contact centres. Following the recent roll-out of our GSM network, we now provide CDMA based wireless services in 20 Circles and GSM based wireless services in 14 Circles.
Reliance Globalcom Limited (“RGL”) which was earlier known as FLAG Telecom Group Ltd, is a subsidiary of Reliance Communications. RGL encompassing Enterprise Services, Capacity Sales, Managed Services and a highly successful bouquet of Retail products & services comprising of Global Voice, Internet Solutions and Value Added Services. Its major assets are the FLAG Atlantic, FLAG North Asia Loop, FLAG Europe Asia and FALCON submarine cable systems.
Reliance Telecom Limited (“RTL”) is a wholly owned subsidiary of Reliance Communications. RTL provides GSM-based wireless services in 8 service areas, and owns the GSM wireless networks in its service areas. We have received requisite Government approvals and spectrum to roll-out CDMA services in additional 2 Circles.
Reliance Communications Infrastructure Limited (“RCIL”) is a wholly owned subsidiary of Reliance Communications. RCIL provides wireless multimedia (Reliance Mobile World) and internet access (Reliance Netconnect) services to customers of Reliance Communications.
Reliance Infratel Limited owns, operates, and develops telecom infrastructure, primarily consisting of wireless communication sites and towers. It currently owns all of the towers used by Reliance Communications’ CDMA and GSM wireless networks and is developing additional towers to meet the needs of Reliance Communications and other customers. Reliance Infratel is currently a subsidiary of Reliance Communications through RCIL.
Page 11 of 34
3. Financial Highlight
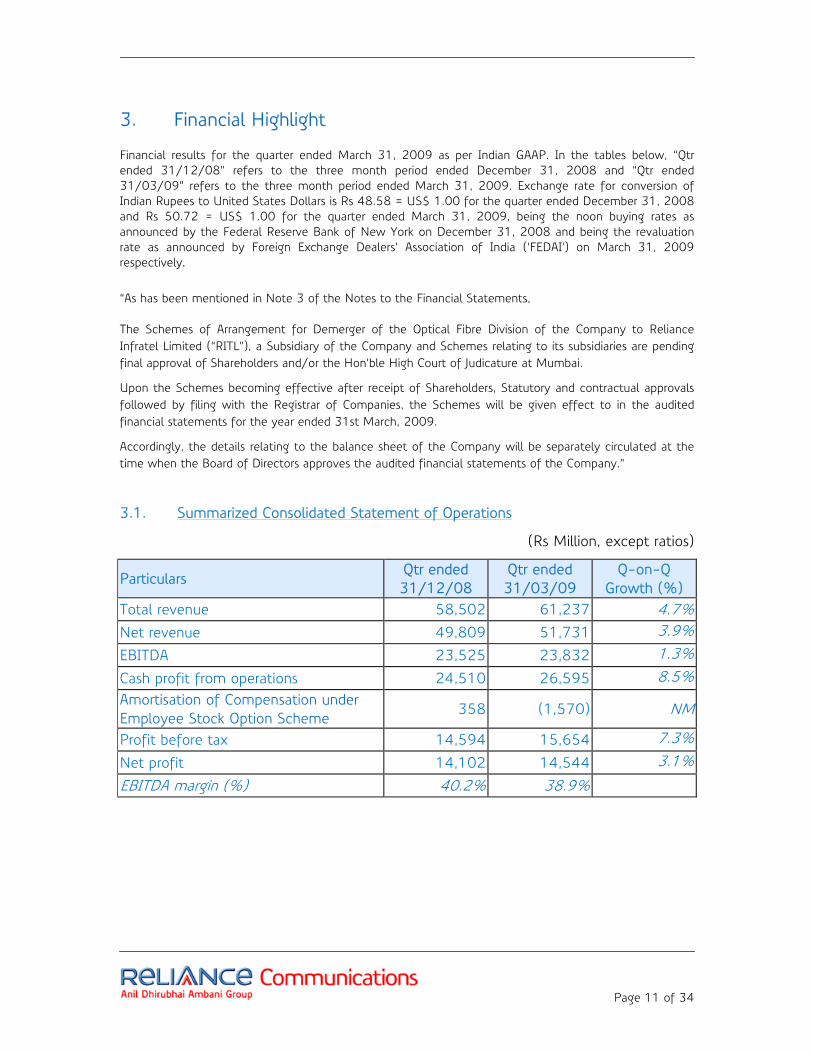
Financial results for the quarter ended March 31, 2009 as per Indian GAAP. In the tables below, “Qtr ended 31/12/08” refers to the three month period ended December 31, 2008 and “Qtr ended 31/03/09” refers to the three month period ended March 31, 2009. Exchange rate for conversion of Indian Rupees to United States Dollars is Rs 48.58 = US$ 1.00 for the quarter ended December 31, 2008 and Rs 50.72 = US$ 1.00 for the quarter ended March 31, 2009, being the noon buying rates as announced by the Federal Reserve Bank of New York on December 31, 2008 and being the revaluation rate as announced by Foreign Exchange Dealers’ Association of India (‘FEDAI’) on March 31, 2009 respectively.
“As has been mentioned in Note 3 of the Notes to the Financial Statements,
The Schemes of Arrangement for Demerger of the Optical Fibre Division of the Company to Reliance Infratel Limited (“RITL”), a Subsidiary of the Company and Schemes relating to its subsidiaries are pending final approval of Shareholders and/or the Hon’ble High Court of Judicature at Mumbai.
Upon the Schemes becoming effective after receipt of Shareholders, Statutory and contractual approvals followed by filing with the Registrar of Companies, the Schemes will be given effect to in the audited financial statements for the year ended 31st March, 2009.
Accordingly, the details relating to the balance sheet of the Company will be separately circulated at the time when the Board of Directors approves the audited financial statements of the Company.”
3.1. Summarized Consolidated Statement of Operations
(Rs Million, except ratios)
Particulars Qtr ended 31/12/08
Qtr ended 31/03/09
Q-on-Q Growth (%)
Total revenue 58,502 61,237 4.7% Net revenue 49,809 51,731 3.9% EBITDA 23,525 23,832 1.3% Cash profit from operations 24,510 26,595 8.5% Amortisation of Compensation under Employee Stock Option Scheme
358 (1,570) NM
Profit before tax 14,594 15,654 7.3% Net profit 14,102 14,544 3.1% EBITDA margin (%) 40.2% 38.9%
Page 12 of 34
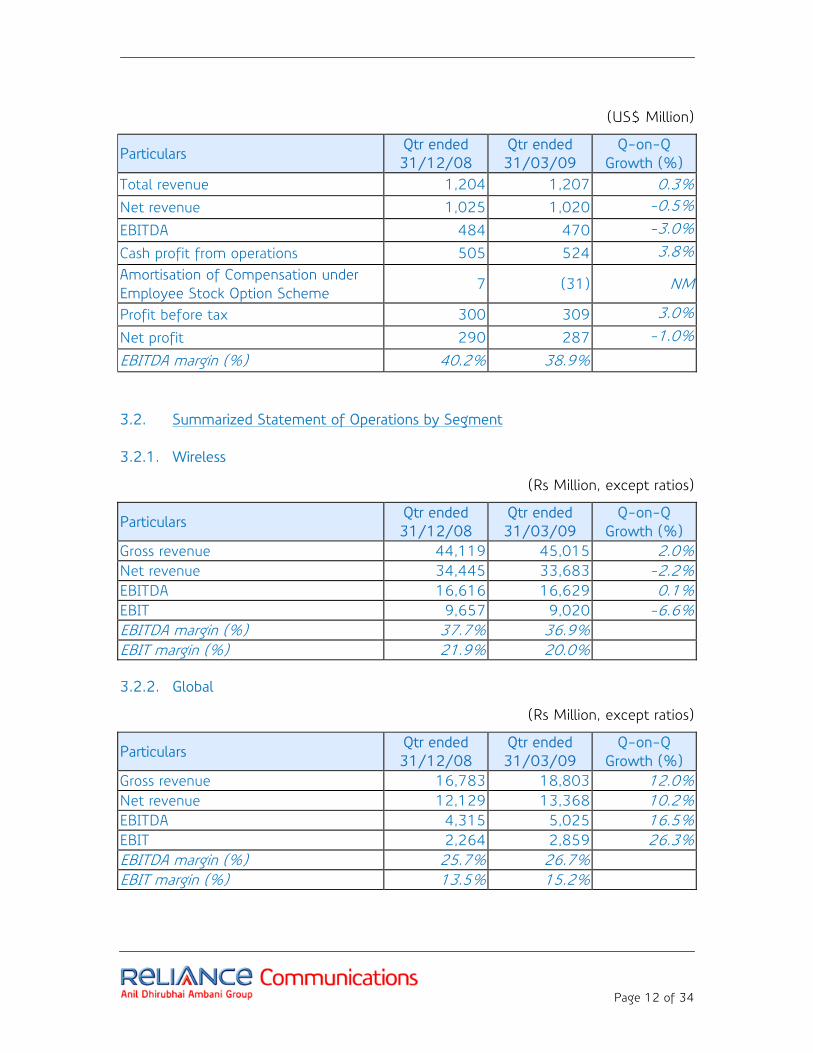
(US$ Million)
Particulars Qtr ended 31/12/08
Qtr ended 31/03/09
Q-on-Q Growth (%)
Total revenue 1,204 1,207 0.3% Net revenue 1,025 1,020 -0.5% EBITDA 484 470 -3.0% Cash profit from operations 505 524 3.8% Amortisation of Compensation under Employee Stock Option Scheme
7 (31) NM
Profit before tax 300 309 3.0% Net profit 290 287 -1.0% EBITDA margin (%) 40.2% 38.9% 3.2. Summarized Statement of Operations by Segment 3.2.1. Wireless
(Rs Million, except ratios)
Particulars Qtr ended 31/12/08
Qtr ended 31/03/09
Q-on-Q Growth (%)
Gross revenue 44,119 45,015 2.0% Net revenue 34,445 33,683 -2.2% EBITDA 16,616 16,629 0.1% EBIT 9,657 9,020 -6.6% EBITDA margin (%) 37.7% 36.9% EBIT margin (%) 21.9% 20.0% 3.2.2. Global
(Rs Million, except ratios)
Particulars Qtr ended 31/12/08
Qtr ended 31/03/09
Q-on-Q Growth (%)
Gross revenue 16,783 18,803 12.0% Net revenue 12,129 13,368 10.2% EBITDA 4,315 5,025 16.5% EBIT 2,264 2,859 26.3% EBITDA margin (%) 25.7% 26.7% EBIT margin (%) 13.5% 15.2%

Page 13 of 34
3.2.3. Broadband
(Rs Million, except ratios)
Particulars Qtr ended 31/12/08
Qtr ended 31/03/09
Q-on-Q Growth (%)
Gross revenue 6,542 7,075 8.1% Net revenue 5,682 6,178 8.7% EBITDA 2,760 3,160 14.5% EBIT 1,926 2,090 8.5% EBITDA margin (%) 42.2% 44.7% EBIT margin (%) 29.4% 29.5% Note: “Net revenue” in 3.2.1, 3.2.2, and 3.3.3 above represents gross segment revenue less license fees and access charges. 3.2.4. Others
(Rs Million, except ratios)
Particulars Qtr ended 31/12/08
Qtr ended 31/03/09
Q-on-Q Growth (%)
Other income 3,183 3,132 -1.6% Other expenses 3,288 4,109 25.0% EBITDA (105) (977) NM EBIT (391) (1,562) NM Note: “Other income” in 3.2.4 above represents revenue earned from operating activities not included in segments (as defined). “Other expenses” in 3.2.4 above represents expenses related to such activities and unallocated corporate expenses.
Page 14 of 34
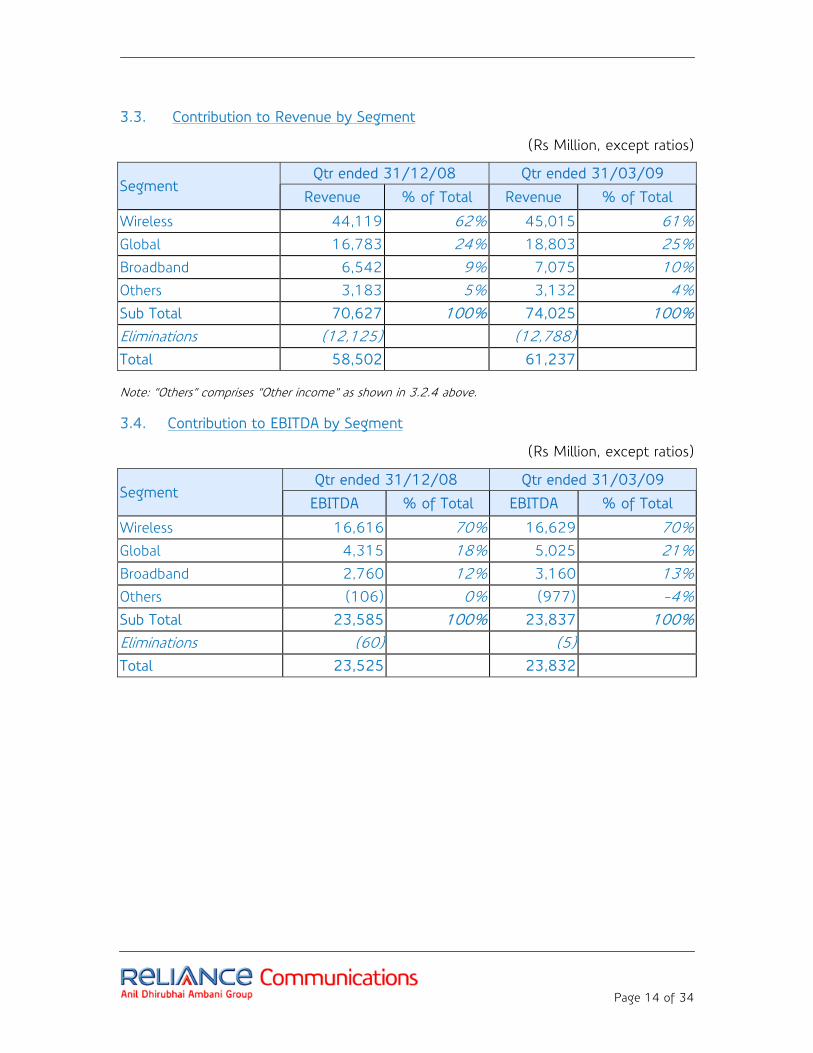
3.3. Contribution to Revenue by Segment
(Rs Million, except ratios)
Segment Qtr ended 31/12/08 Qtr ended 31/03/09
Revenue % of Total Revenue % of Total
Wireless 44,119 62% 45,015 61% Global 16,783 24% 18,803 25% Broadband 6,542 9% 7,075 10% Others 3,183 5% 3,132 4% Sub Total 70,627 100% 74,025 100% Eliminations (12,125) (12,788) Total 58,502 61,237 Note: “Others” comprises “Other income” as shown in 3.2.4 above.
3.4. Contribution to EBITDA by Segment
(Rs Million, except ratios)
Segment Qtr ended 31/12/08 Qtr ended 31/03/09
EBITDA % of Total EBITDA % of Total
Wireless 16,616 70% 16,629 70% Global 4,315 18% 5,025 21% Broadband 2,760 12% 3,160 13% Others (106) 0% (977) -4% Sub Total 23,585 100% 23,837 100% Eliminations (60) (5) Total 23,525 23,832
Page 15 of 34
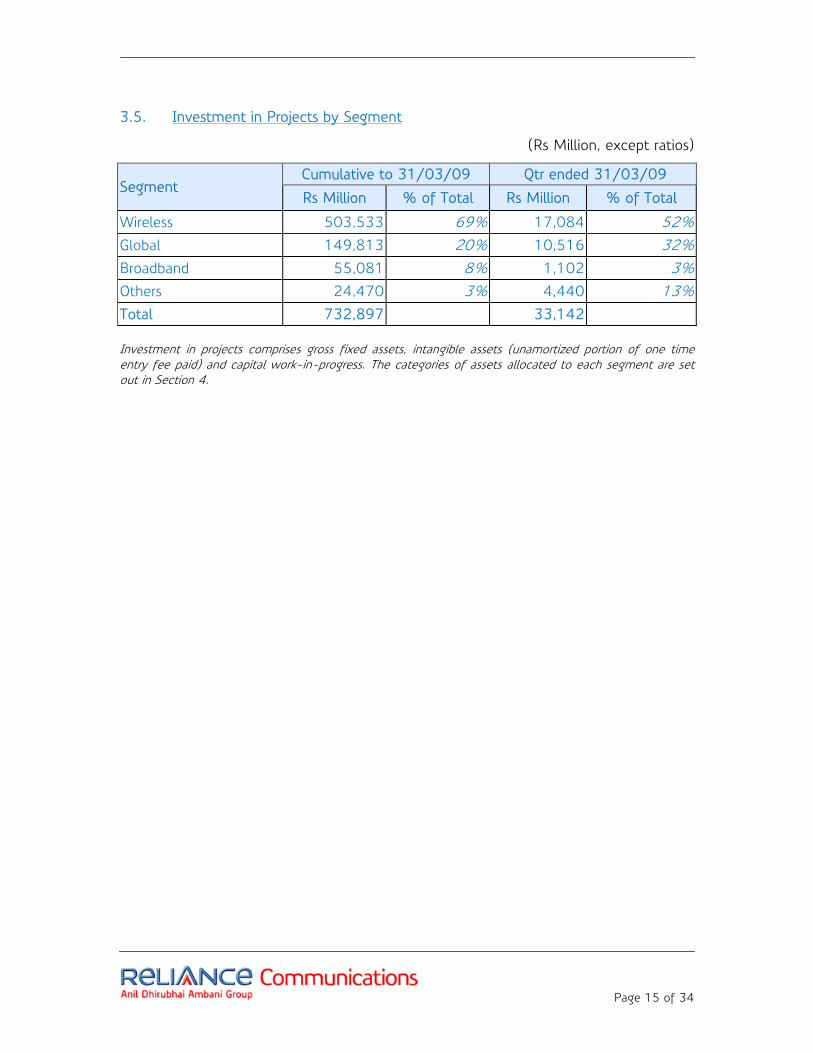
3.5. Investment in Projects by Segment
(Rs Million, except ratios)
Segment Cumulative to 31/03/09 Qtr ended 31/03/09
Rs Million % of Total Rs Million % of Total
Wireless 503,533 69% 17,084 52% Global 149,813 20% 10,516 32% Broadband 55,081 8% 1,102 3% Others 24,470 3% 4,440 13% Total 732,897 33,142 Investment in projects comprises gross fixed assets, intangible assets (unamortized portion of one time entry fee paid) and capital work-in-progress. The categories of assets allocated to each segment are set out in Section 4.
Page 16 of 34
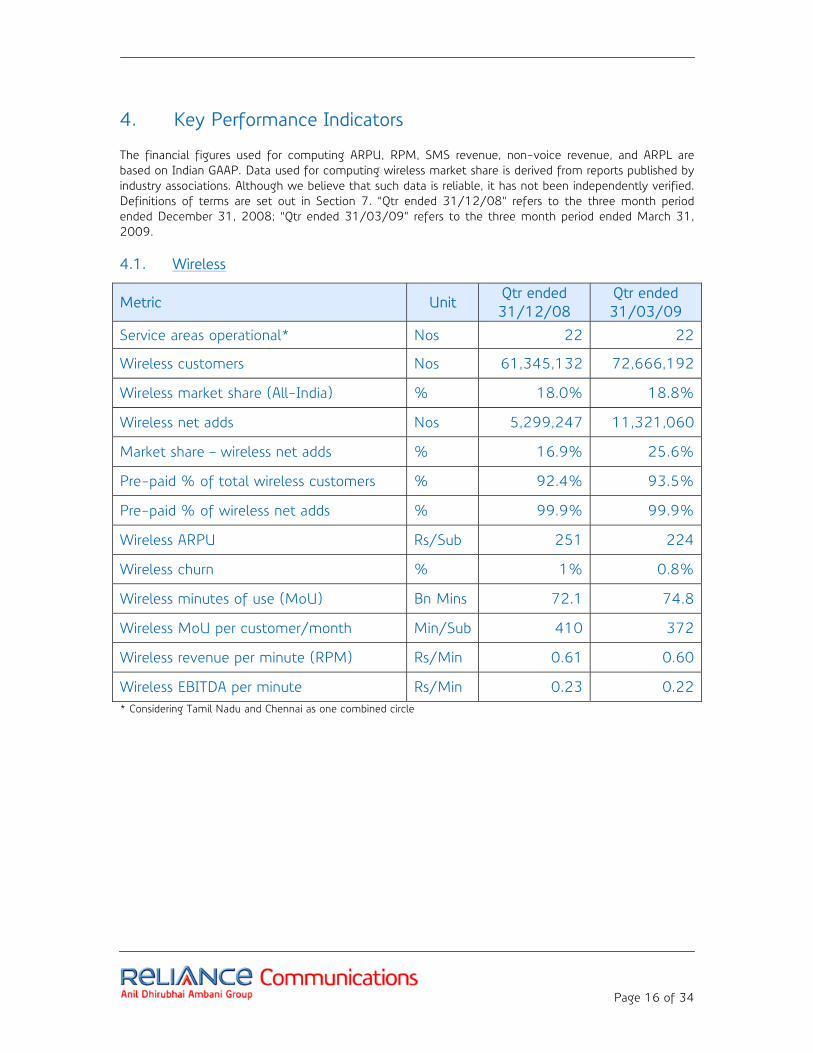
4. Key Performance Indicators
The financial figures used for computing ARPU, RPM, SMS revenue, non-voice revenue, and ARPL are based on Indian GAAP. Data used for computing wireless market share is derived from reports published by industry associations. Although we believe that such data is reliable, it has not been independently verified. Definitions of terms are set out in Section 7. “Qtr ended 31/12/08” refers to the three month period ended December 31, 2008; “Qtr ended 31/03/09” refers to the three month period ended March 31, 2009. 4.1. Wireless
Metric Unit Qtr ended 31/12/08
Qtr ended 31/03/09
Service areas operational* Nos 22 22
Wireless customers Nos 61,345,132 72,666,192
Wireless market share (All-India) % 18.0% 18.8%
Wireless net adds Nos 5,299,247 11,321,060
Market share – wireless net adds % 16.9% 25.6%
Pre-paid % of total wireless customers % 92.4% 93.5%
Pre-paid % of wireless net adds % 99.9% 99.9%
Wireless ARPU Rs/Sub 251 224
Wireless churn % 1% 0.8%
Wireless minutes of use (MoU) Bn Mins 72.1 74.8
Wireless MoU per customer/month Min/Sub 410 372
Wireless revenue per minute (RPM) Rs/Min 0.61 0.60
Wireless EBITDA per minute Rs/Min 0.23 0.22 * Considering Tamil Nadu and Chennai as one combined circle
Page 17 of 34
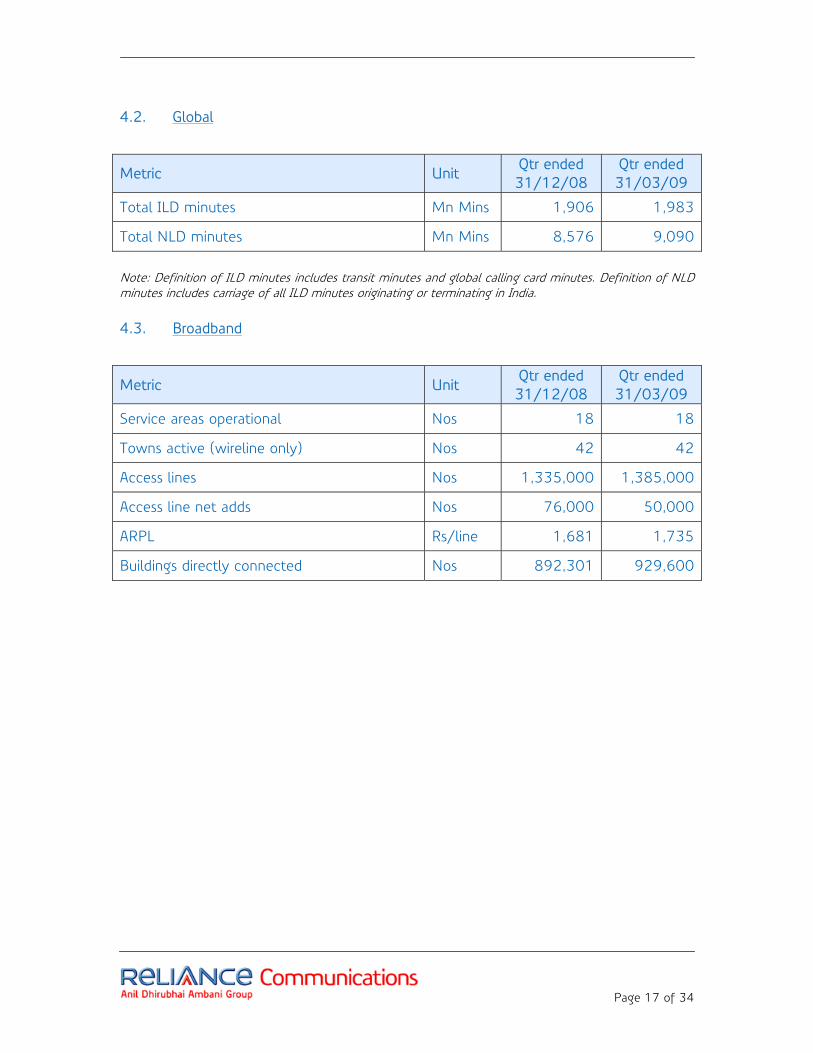
4.2. Global
Metric Unit Qtr ended 31/12/08
Qtr ended 31/03/09
Total ILD minutes Mn Mins 1,906 1,983
Total NLD minutes Mn Mins 8,576 9,090
Note: Definition of ILD minutes includes transit minutes and global calling card minutes. Definition of NLD minutes includes carriage of all ILD minutes originating or terminating in India. 4.3. Broadband
Metric Unit Qtr ended 31/12/08
Qtr ended 31/03/09
Service areas operational Nos 18 18
Towns active (wireline only) Nos 42 42
Access lines Nos 1,335,000 1,385,000
Access line net adds Nos 76,000 50,000
ARPL Rs/line 1,681 1,735
Buildings directly connected Nos 892,301 929,600
Page 18 of 34
5. Basis of Presentation of Financial Statements
5.1. Reporting Periods
The financial year end of Reliance Communications Limited is March 31. Each financial year (“FY”) is referred to by the calendar year in which the particular financial year end occurs. The current financial year will be for a period of 12 months, commenced on April 1, 2008 and ending on March 31, 2009.
5.2. Consolidated and Segment Financial Results
5.2.1. Revenues Revenues of the Company have been reported in the following manner:
Consolidated Revenues and Segment Gross Revenues
Consolidated revenues of the Company have been classified as “Services and Sales” revenue. This represents revenues earned from the provision of services and from the sale of network infrastructure on an IRU basis. For the purposes of business segment reporting, revenues have been classified under three segments namely “Wireless”, “Global”, and “Broadband”. The lines of business included in each segment and the basis of segment revenue reporting is described in Section 5.3 below. Revenue earned from operating activities not included in these segments (as defined) is shown as “Other Income” under “Others” in the segment analysis.
Elimination of Inter Segment Revenues
Revenues for each business segment are reported at gross level where inter segment revenue is also included. Hence, revenue of one segment, from inter segment source, is reported as the expense of the related segment. Elimination takes place in determining consolidated revenues for the Company.
For the purpose of determining transfer pricing between segments, open market wholesale rates for comparable services or, where applicable, rates stipulated by the regulatory authorities have been adopted.
Page 19 of 34
5.2.2. Net Revenues by Segment
“Net Revenues” represent revenues earned less direct variable operating expenses in the nature of: (1) revenue share (including levies for Universal Service Obligation), and spectrum fees (referred to collectively as “License Fees”); and (2) charges for access, carriage, interconnection, and termination (referred to collectively as “Access Charges”).
Expenses included under License Fees are currently incurred as a percentage of adjusted gross revenue. Expenses included under Access Charges, on the basis of fixed or ceiling cost per minute, or are determined by commercial negotiation with other carriers and between our business segments, as appropriate. Access Charges and license Fees are disclosed in aggregate as part of the classification of “Operating Expenses” in the consolidated statement of operations. Net Revenues are reported for each business segment. 5.2.3. Operating Expenses
Operating expenses of the Company have been reported in the following manner:
Consolidated and Segment Gross Operating Expenses
Consolidated operating expenses of the Company have been classified under four categories of costs, namely “Access Charges and license Fees”, “Network Operations”, “Employees”, and “Selling, General & Administrative”.
Elimination of Inter Segment Expenses
Principles, as stated in 5.2.1 above, have been followed for reporting gross operating expenses of each segment and elimination of such expenses in determining consolidated EBITDA for the Company.
5.3. Composition of Segments
Financial performance of the Company has been reported under the following three business segments:
Wireless
Global
Broadband
Financial results by segment include all products and services covered by the individual segment as described below. Operating activities not included in the segments (as defined below) are grouped under “Others”.
Page 20 of 34
5.3.1. Wireless
The Wireless segment functions in a retail mode. Wireless services are offered on both CDMA and GSM technology platforms. Wireless services consist mainly of the following:
Mobile services for individuals and corporate customers, including local and long
distance voice, messaging, wireless internet access, wireless multimedia and value added services. Services are offered on both pre-paid and post paid bases.
Fixed wireless phone and terminal services are mainly for residential and SME
customers, including local and long distance voice, messaging, wireless internet access, wireless multimedia, and value added services. Services are offered on both pre-paid and post paid bases.
Public calling offices and coin collection boxes for local and long distance voice
using fixed wireless phones and terminals. Service is provided to independent retail operators of such facilities on a pre-paid basis.
Assets allocated to this business segment include: radio equipment (base trans-receiver stations (BTSs), microwave towers, antennas, mobile switching centers (MSCs), and related electronics, software and systems for operations); intra-city access networks (ducts and optical fiber) other than in 44 cities; utilities, servers, customer premises equipment, and license fees.
Page 21 of 34
5.3.2. Global
The global segment provides wholesale and retail voice and data services from many international locations. It provides the following services to the wireless and broadband segments of Reliance Communications on an inter segment basis and to other telecom companies (on a carrier’s carrier basis) and enterprises in India and across the globe:
National inter-circle (NLD) carriage services for voice, data, and internet.
NLD bandwidth and infrastructure services for other service providers.
International long distance (ILD) carriage services for voice, data, and internet.
IRUs and leased circuits for international voice and data connectivity through
submarine cable systems, together with cable restoration and maintenance services.
Global Ethernet services to enterprise customers across four industry verticals i.e. financial, legal, healthcare and Government
International managed data services, including IP-VPN.
Virtual international calling and voice content services provided by overseas operating units in USA, UK, Canada, Australia, New Zealand, Hong Kong, Singapore and Malaysia in a retail mode to individual customers for calling India and global destinations.
Managed contact centre solutions for call centres in India and overseas.
NLD and ILD assets are allocated to this segment. NLD assets include: transport equipment and electronics; transmission networks (ducts and optical fiber) connecting various Media Convergence Nodes (MCNs) across all circles; buildings, utilities, and license fees. ILD assets include: dedicated ports and switches, electronics, infrastructure at various points of presence and other cable systems not owned and operated by the Company. In addition, the submarine cable systems, cable landing stations, switching equipment for PoPs and associated facilities of FLAG, are included in this segment.
5.3.3. Broadband
All services provided through wireline, LMDS etc. and involving the provision of IT infrastructure are covered under this segment. Services are provided across various customer groups including residential, SMEs, and large corporates. Products and services include the following:
Voice Products: E1 DID, Centrex, PBX trunks, One Office Duo, toll free, Audio
conferencing, and fixed line phones.
Page 22 of 34
Data products: VPN, leased lines, IPLCs, Ethernet, video conferencing, Remote Access VPN, internet data centre (IDC) services (including managed hosting, applications, storage, and disaster recovery), and broadband internet.
Assets allocated to this segment include: in-building wiring and building access networks from building access nodes in all locations where active; intra-city access networks (ducts and optical fiber) in 44 cities; internet data centers; digital loop carriers (DLC), routers, modems and related electronics; customer premises equipment (CPE) and license fees. 5.3.4. Others
Others comprise operating activities not included in the segments as defined above. These activities include DTH services, retailing (Reliance World), property leasing and investments. Assets shown under Others mainly comprise properties owned by the Company, including the Dhirubhai Ambani Knowledge City, and property and fittings (including electronics for video-conferencing and other digital services) used by Reliance World retail outlets.

Page 23 of 34
6. Financial Statements
Financial results for the quarter ended March 31, 2009 as per Indian GAAP. An explanation of the basis of presentation is set out in Section 5. In the tables below, “Qtr ended 31/12/08” refers to the three month period ended December 31, 2008 and “Qtr ended 31/03/09” refers to the three month period ended March 31, 2009. Previous quarter’s figures have been re-grouped, re-arranged and re-classified wherever necessary. 6.1. Consolidated Results of Operations
(Rs. Million, except ratios)
Particulars Qtr ended 31/12/08
Qtr ended 31/03/09
Total revenues 58,502 61,237 Services and sales 58,502 61,237
Total operating expenses 34,977 37,405 Access charges and license fees 8,693 9,506 Network operations 11,666 13,582 Employees 4,383 4,213 SG&A 10,235 10,104
EBITDA before exceptional item 23,525 23,832 Finance charges (net) (1,496) (1,678) Depreciation / amortization 10,069 11,426 Amortisation of Compensation under Employee Stock Option Scheme
358 (1,570)
Profit before tax 14,594 15,654 Provision for tax (including Fringe benefit tax and Deferred tax)
153 485
Net profit after tax (before adjustment of share of Minority Interest/ Associates) 14,441 15,169
Share of Minority and associates 339 625 Net profit after tax (after adjustment of share of Minority Interest/ Associates)
14,102 14,544
Ratios EBITDA margin (%) 40.2% 38.9% Net profit margin (%) 24.1% 23.8%

Page 24 of 34
7. Accounting Policies
Set out below are the significant accounting policies to the Consolidated Statement of Operations and the Consolidated Balance Sheet. 7.1. Principles of Consolidation
Consolidation has been carried out in compliance with the applicable Accounting Standards, viz., AS 21 and AS 23, issued by the Institute of Chartered Accountants of India. 7.2. Other Significant Accounting Policies
7.2.1. Basis of Preparation of Financial Statements
The financial statements have been prepared under the historical cost convention in accordance with the generally accepted accounting principles in India and the provisions of the Companies Act, 1956. 7.2.2. Use of Estimates
The presentation of financial statements requires estimates and assumptions to be made that affect the reported amount of assets and liabilities on the date of the financial statements and the reported amount of revenues and expenses during the reporting period. Difference between the actual results and estimates are recognized in the period in which the results are known/materialized.
7.2.3. Fixed Assets
Fixed assets are stated at cost net of cenvat/value added tax and include amount added on revaluation less accumulated depreciation, amortization and impairment loss, if any.
All costs including financing cost until commencement of commercial operations relating to borrowings attributable to fixed assets, are capitalized.
Expenses incurred relating to projects prior to commencement of commercial
operation are considered as project development expenditure and shown under capital work-in-progress.
In respect of operating leases, rentals are expensed with reference to lease terms
and other considerations in compliance with the provisions of the AS 19 issued by The Institute of Chartered Accountants of India, except for rentals pertaining to the period up to the date of commencement of commercial operations, which are capitalized.

Page 25 of 34
In respect of finance leases, the lower of the fair value of the assets and present value of the minimum lease rentals is capitalized as fixed assets with corresponding amount shown as liabilities for leased assets in compliance with the provisions of the AS 19 issued by The Institute of Chartered Accountants of India. The principal component in the lease rental in respect of the above is adjusted against liabilities for leased assets and the interest component is recognized as an expense in the year in which the same is incurred except in case of assets used for capital projects where it is capitalized.
Entry fees paid for telecom licenses and indefeasible right of connectivity are stated
at cost for acquiring the same less accumulated amortization. These are classified as part of fixed assets.
7.2.4. Depreciation/Amortization
Depreciation on fixed assets is provided on straight line method at the rates and in the manner prescribed in Schedule XIV to the Companies Act, 1956 except in cases of cable systems, telecom electronic equipment, customer premises equipment and certain other assets for which useful life has been considered based on technical estimation. Depreciation is net of the amount adjusted from Provision for Business Restructuring in accordance with the Scheme.
Depreciation on assets taken on finance lease is provided over the remaining period
of lease from the commencement of commercial operations.
Leasehold land is depreciated over the period of the lease term.
Intangible assets, namely entry fees for telecom licenses and indefeasible right of connectivity are amortized equally over the balance period of licenses or indefeasible rights from the date of commencement of commercial services or acquisition.
The depreciation schedule for various classes of assets is as follows:
Asset Class Period (Years)
Leasehold Land Over the lease period
Building 30 & 60
Plant and Machinery 10-20
Furniture and Fixture 10
Office Equipment 5-10
Vehicles 5
Page 26 of 34
7.2.5. Impairment of Assets
An asset is treated as impaired when the carrying cost of assets exceeds its recoverable value. An impairment loss is charged to the profit and loss account in the year in which an asset is identified as impaired. The impairment loss recognized in prior accounting periods is reversed if there has been a change in the estimate of recoverable amount. 7.2.6. Investments
Investments are classified into long term and current investments. Investments which are intended to be held for more than one year are classified as long term investments and investments which are intended to be held for less than one year, are classified as current investments. Current investments are carried at lower of cost and quoted/fair value, computed category wise. Long term investments are stated at cost. Provision for diminution in the value of long term investments is made only if such a decline is other than temporary in the opinion of the management. 7.2.7. Inventories
Inventories are valued at lower of cost or net realizable value. Cost of communication devices and accessories and stores and spares are determined on weighted average basis, or net realizable value whichever is less. 7.2.8. Employee Retirement Benefits
Gratuity and leave encashment liabilities are provided for based on actuarial valuation. While Company's contributions towards provident fund and superannuation fund are provided on actual contribution basis in accordance with the related stipulation. 7.2.9. Borrowing Cost
Borrowing costs that are attributable to the acquisition or construction of qualifying assets are capitalized as part of the cost of such assets up to the commencement of commercial operations. A qualifying asset is one that necessarily takes substantial period of time to get ready for intended use. Other borrowing costs are recognized as expense in the year in which they are incurred.
7.2.10. Foreign Currency Transactions
Transactions denominated in foreign currencies are normally recorded at the exchange rates prevailing at the time of the transaction.
Monetary items denominated in foreign currencies at the year end are restated at
year end rates. In case of monetary items, which are covered by forward exchange contracts, the difference between the year end rate and the rate on the date of the
Page 27 of 34
contract is recognized as exchange difference and the premium paid on forward contracts has been recognized over the life of the contract.
Non monetary foreign currency items are carried at cost.
Any income or expense on account of currency exchange difference, either on
settlement or on translation, is recognized in the profit and loss account, except in accordance with Schedule VI till March 30, 2009 on amount of liabilities and borrowings related to acquisition of fixed assets, which are adjusted in carrying cost of fixed assets.
Any income or loss arising out of marking derivative contracts to market price is
recognized in the profit and loss account.
7.2.11. Revenue Recognition
Revenue (income) is recognized as and when the services are performed on the basis of actual usage of the Company's network. Revenue on upfront charges for services with lifetime validity and fixed validity periods are recognized over the estimated useful life of subscribers and specified fixed validity period, where significant. The estimated useful life is consistent with estimated churn of the subscribers. 7.2.12. Provision for Doubtful Debts
Provision is made in the accounts for doubtful debts in cases where the management considers the debts to be doubtful of recovery. 7.2.13. Miscellaneous Expenditure
Miscellaneous expenses are charged to profit and loss account as and when they are incurred. 7.2.14. Taxes on Income
Provision for income tax is made on the basis of estimated taxable income for the year at current rates. Tax expenses comprise both current tax and deferred tax at the applicable enacted or substantively enacted rates. Current tax represents the amount of income tax payable/recoverable in respect of the taxable income/loss for the reporting period. Deferred tax represents the effect of timing difference between taxable income and accounting income for the reporting period that originate in one period and are capable of reversal in one or more subsequent periods. 7.2.15. Government Grants
Subsidies provided by Government for providing telecom services in rural areas are recognized as operating income.
Page 28 of 34
7.2.16. Provisions, Contingent Liabilities and Contingent Assets
Provisions involving substantial degree of estimation in measurement are recognized when there is a present obligation as a result of past events and it is probable that there will be an outflow of resources. Contingent liabilities are not recognized but are disclosed in the notes. Contingent assets are neither recognized nor disclosed in the financial statements.

Page 29 of 34
8. Notes to Accounts. (As reported to stock exchanges)
1. The Company is pursuing aggressive capex plans which include significant expansion of nation wide wireless network. The Company has funded these initiatives primarily by long term borrowings in foreign currency and Foreign Currency Convertible Bonds (FCCBs). In compliance of Schedule VI of the Companies Act, 1956 (Schedule VI) and on the basis of legal advice received by the Company, changes to the amount of liability and borrowings related to acquisition of fixed assets consequent upon short term fluctuations in foreign exchange rates upto 30th March, 2009 are adjusted in the carrying cost of fixed assets. Had the accounting treatment as per Accounting Standard (“AS”) 11 been continued to be followed by the Company, the net profit after tax for the quarter and the year ended on 31st March, 2009 would have been lower by Rs.47,191 lakh and Rs.1,68,895 lakh for realized and Rs. 32,240 lakh and Rs. 2,84,385 lakh for unrealized currency exchange fluctuations respectively. This excludes an amount of Rs. 31,903 lakh and Rs.1,46,577 lakh for the quarter and the year ended on 31st March, 2009 on FCCBs for which the Company will not be liable, if the FCCBs are converted on or before the due date i.e. 1st May, 2011 and 18th February, 2012.
Pursuant to the amendment to Schedule VI, with effect from 31st March, 2009,
the Company has with effect from 31st March, 2009 adopted the accounting treatment as per AS 11.
2. During the quarter, the Company has repurchased and cancelled 100 Foreign
Currency Convertible Bonds (FCCBs) of the Face Value of USD 1,00,000 each, as per approval of the Reserve Bank of India, at a discount. This has resulted in a saving of Rs.1,586 lakh which has been reflected as part of Other Income. Consequent upon such repurchase and cancellation, the Company’s obligations to convert the said FCCBs into Shares, if so claimed by the FCCB Holders and/ or to redeem the same in foreign currency, have come to an end vis-à-vis the cancelled FCCBs.
3. The Scheme of Arrangement for demerger of the Optical Fibre Division of the
Company to Reliance Infratel Limited (“RITL”), a subsidiary of the Company and Schemes relating to its subsidiaries are pending final approval of Shareholders and/ or the Hon’ble High Court of Judicature at Mumbai. Upon the Schemes becoming effective after receipt of Shareholders, Statutory and contractual approvals followed by filing with the Registrar of Companies, the Schemes will be given effect to in the audited financial statements for the year ended 31st March, 2009.

Page 30 of 34
4. The Company operates two Employee Stock Option Schemes (ESOS 2008 and ESOS 2009). Amortization of compensation under Employee Stock Option Schemes includes a further charge of Rs. 747 lakh (Previous Year: Rs.1,617 lakh) for Options which have been vested under ESOS 2008. Amounts earlier charged in respect of surrendered Options under ESOS 2008 have been reversed in the quarter ended 31st March, 2009. No amount is chargeable in respect of Options granted under ESOS 2009.
5. Based on legal advise received, the Company and its key subsidiaries will not be
liable for tax consequent upon deductions under incentive provisions such as Section 80 IA as also on account of deductions permitted in the computation of book profits for the purposes of Section 115 JB of the Income Tax Act. Provision in these unaudited financial statements for tax is limited to the provision which would be required in the audited financial statements, referred to in Note 4 above.
Page 31 of 34
9. Glossary
Key Performance Indicators and Financial Terms
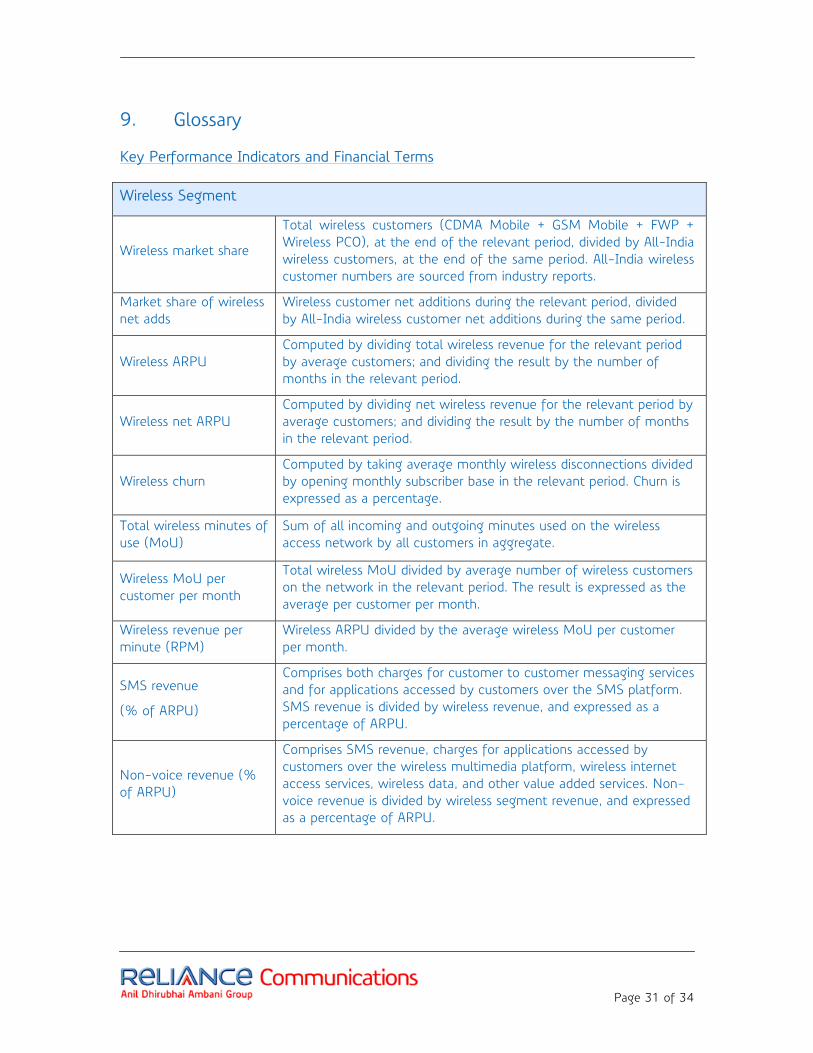
Wireless Segment
Wireless market share
Total wireless customers (CDMA Mobile + GSM Mobile + FWP + Wireless PCO), at the end of the relevant period, divided by All-India wireless customers, at the end of the same period. All-India wireless customer numbers are sourced from industry reports.
Market share of wireless net adds
Wireless customer net additions during the relevant period, divided by All-India wireless customer net additions during the same period.
Wireless ARPU Computed by dividing total wireless revenue for the relevant period by average customers; and dividing the result by the number of months in the relevant period.
Wireless net ARPU Computed by dividing net wireless revenue for the relevant period by average customers; and dividing the result by the number of months in the relevant period.
Wireless churn Computed by taking average monthly wireless disconnections divided by opening monthly subscriber base in the relevant period. Churn is expressed as a percentage.
Total wireless minutes of use (MoU)
Sum of all incoming and outgoing minutes used on the wireless access network by all customers in aggregate.
Wireless MoU per customer per month
Total wireless MoU divided by average number of wireless customers on the network in the relevant period. The result is expressed as the average per customer per month.
Wireless revenue per minute (RPM)
Wireless ARPU divided by the average wireless MoU per customer per month.
SMS revenue
(% of ARPU)
Comprises both charges for customer to customer messaging services and for applications accessed by customers over the SMS platform. SMS revenue is divided by wireless revenue, and expressed as a percentage of ARPU.
Non-voice revenue (% of ARPU)
Comprises SMS revenue, charges for applications accessed by customers over the wireless multimedia platform, wireless internet access services, wireless data, and other value added services. Non-voice revenue is divided by wireless segment revenue, and expressed as a percentage of ARPU.
Page 32 of 34
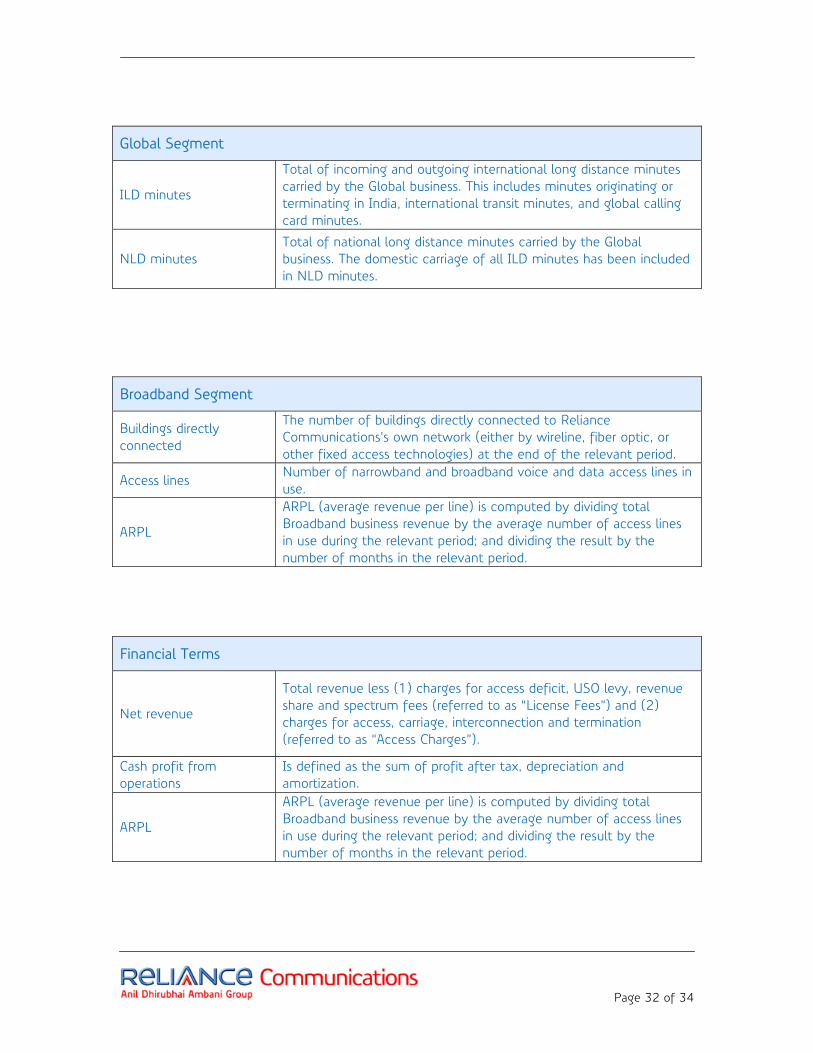
Global Segment
ILD minutes
Total of incoming and outgoing international long distance minutes carried by the Global business. This includes minutes originating or terminating in India, international transit minutes, and global calling card minutes.
NLD minutes Total of national long distance minutes carried by the Global business. The domestic carriage of all ILD minutes has been included in NLD minutes.
Broadband Segment
Buildings directly connected
The number of buildings directly connected to Reliance Communications's own network (either by wireline, fiber optic, or other fixed access technologies) at the end of the relevant period.
Access lines Number of narrowband and broadband voice and data access lines in use.
ARPL
ARPL (average revenue per line) is computed by dividing total Broadband business revenue by the average number of access lines in use during the relevant period; and dividing the result by the number of months in the relevant period.
Financial Terms
Net revenue
Total revenue less (1) charges for access deficit, USO levy, revenue share and spectrum fees (referred to as “License Fees”) and (2) charges for access, carriage, interconnection and termination (referred to as “Access Charges”).
Cash profit from operations
Is defined as the sum of profit after tax, depreciation and amortization.
ARPL
ARPL (average revenue per line) is computed by dividing total Broadband business revenue by the average number of access lines in use during the relevant period; and dividing the result by the number of months in the relevant period.

Page 33 of 34

Page 34 of 34