Embed Size (px)
Citation preview

QUARTERLY REPORT ON
AGRI COMMODITIESAPRIL TO JUNE 2013

AGRI COMMODITIES APRIL TO JUNE 2013
2
India has many growing seasons due to prevalence of high/low temperature
through a long period.
Kharif crop refers to the planting, cultivation and harvesting of any domesticated
plant sown in the rainy (monsoon) season on the Asian subcontinent. Such crops
are planted for autumn harvest and may also be called the summer or monsoon
crop in India.
Kharif crops are usually sown with the beginning of the first rains in July, during the
south-west monsoon season. India the kharif season varies by crop and state, with
kharif starting at the earliest in May and ending at the latest in January, but is
popularly considered to start in June and to end in October. Crops which require
large quantities of water are cultivated during the Kharif season.
This season is also called as hot weather period / pre monsoon season. This period
is characterized by high temperature. The temperature is higher in north compared
south. March to May month is the summer season. The weather gets hotter steadily
from the beginning of March. April & May are the hottest months of the year. The
average temperature is 30-40C. The rainfall receives during this period are mainly
useful for preparatory cultivation. In this period hot wind blows & sometimes dust
storms also take place. Some time these dust storms create problems due to their
intensity for considerable period.
The main Kharif crops are :
1. Rice,
2. Sugar-cane,
3. Jute,
4. Cotton,
5. Tobacco,
6. Maize etc.
These crops cover 65% of total cultivated area.
Rabi crops or Rabi harvest refers to agricultural crops sown in winter and harvested
in the summer season. The term is derived from the Arabic word for "spring", which
is used in the Indian subcontinent. The Rabi crop is the spring harvest (also known
as the "winter crop") in Indian subcontinent.
The Rabi Season starts in the middle of October when the south-west monsoon
retreats and the north-east Monsoon begins. Seeds are sown in October and crops
are harvested in March and April. Generally, crops which require less water are
grown during the rabi season.
This season is called as cold weather period. January & February months are the
cold months in the most parts of the country. Temperature distribution over India
KHARIF CROP OR SUMMER CROP
RABI CROP OR WINTER CROP
OVERVIEW: CROPPING SEASONS IN INDIA
shows a marked decrease from south to north. In north India average temperature
during this season is about 10-15 degree and in south India is about 21-28 degree.
Weather during this period is cool, dry & pleasant with dew-fall during morning.
This period is practically rainless except occasional drizzles.
The main rabi crops are:
1. Wheat,
2. Barley,
3. Gram,
4. Mustard,
5. Linseed etc.
These crops require cooler conditions and less moisture Rabi crops account for
33% of cropped area.
There are certain crops which are grown throughout the year in all parts of the
country under artificial irrigation, they are called zaid crops.
The chief Zaid crops are :
1. Rice
2. Maize
3. Melons
4. Groundnut
5. Water melons
6. Cucumber
7. Leafy
8. Tuber vegetables etc.
For the large farming community of Punjab and Haryana, Baisakhi marks a New
Year's time as it is time to harvest rabi crop. On Baisakhi, farmers thank god for the
bountiful crop and pray for good times ahead. People buy new clothes and make
merry by singing, dancing and enjoying the best of festive food.
Everyday farming scenes of sowing, harvesting, winnowing and gathering of crops
are expressed through zestful movements of the body to the accompaniment of
ballads and dhol music.
In Assam in the northeastern part of India, a harvest festival called Bhogali Bihu is
celebrated to mark the end of the harvest season in mid-January. In southern parts
of India, particularly in Andhra Pradesh, Tamil Nadu and Mumbai, the Bhogi festival
is celebrated on the last day of 'Maarkali', which is also the first day of the farmer
festival Pongal.
ZAID CROP
SIGNIFICANCE OF CROP HARVESTING FOR FARMERS

AGRI COMMODITIES APRIL TO JUNE 2013
3
TYPES OF FARMING
Dry
Farming
Meaning Followed in States Crops growns
Humid
Farming
Irrigation
Farming
Shifting
Cultivation
Plantation
Farming
Single
Cropping
Double
Cropping
Multiple
Cropping
Arable
Farming
A system under which farming is carried on in the regions
where the rainfall is scanty i.e. less than 50 Cm annually
and where irrigation facilities are either absent or very
little.
A system of farming practised in regions where the rainfall
is adequate i.e. between 100 Cm to 200 Cm without the
help of irrigation.
A system of farming under which crops are grown with
the help of irrigation i.e. supply of water from rivers,
reservoirs, tanks, wells to land for cultivation in regions of
seasonal or low rainfall.
Its means the migratory subsistence farming. Under this
system, a plot of land is cultivated for a few years and
then, when the crop yield declines because of soil
exhaustion and the effects of pests and weeds, is
deserted for another area.
Plantation farming means the cultivation of a single cash
crop in plantations or estates on a large scale. The farming
is carried on with the help of technically advanced
methods of cultivation and tools.
Also known as mono-cropping or mono-culture is a
system of farming under which the cultivators grow one
crop from the lands during the year.
A system under which two crops are raised by the farmers
from the same plot of land during the year.
Multiple cropping is a system under which the farmer grown
more than two crops from the same plot of land during the
year. It is a highly intensive system of farming.
It is a system under which the farms are used only for the
cultivation of crops
The system of farming by which different crops are
alternately grown on the same land in a specific order.
Mixed cropping means the cultivation of more than one
crop simultaneously on the same piece of land. The two
crops are sown together but harvested at different times
because the growth period of the plants of the different
crop varies.
Crop
Rotation
Mixed
Cropping
Gujarat, Rajasthan, South Punjab,
Northern Maharashtra
West Coast, West Bengal, Parts of
Bihar, U.P and Assam.
Western U.P., Punjab, Haryana, Parts of
Bihar, Orissa, A.P., Tamil Nadu,
Karnataka etc.
Assam, Meghalaya, Nagaland, Manipur,
Tripura, Mizoram, Arunchal Pradesh,
Madhya Pradesh, Orissa and Andhra
Pradesh
Assam, West Bengal, Karnataka,
Kerala & Tamil Nadu
Assam, Darjeeling, Kerala
West Bengal, Kerala, Uttar Pradesh
Maharashtra, Uttar Pradesh, Madhya
Pradesh
Punjab, Rajasthan
Gujrat, Madhya Pradesh, Rajasthan
Gujrat, Maharashtra
Jowar and Bajra
Rice, Sugarcane, jute etc
Rice, sugarcane, cotton, wheat,
tobacco etc.
Rainfed rice, Maize, buck wheat, small
millets, root crops and vegetables
Coffee plantations, tea plantations,
rubber plantations
Tea, Coffee, etc.
Rice
Food crops and cash crops
Leguminous crops like pulses are
grown alternately with wheat, barley or
mustard
Early maturing crops are mixed with
groundnut, cotton or pulses which
mature late
Cotton, tobacco, vegetables

AGRI COMMODITIES APRIL TO JUNE 2013
4
CROPS HARVESTED IN APRIL – JUNE QUARTER
CHANA
INTRODUCTION
Chana (Gram) is one of the oldest pulses known and cultivated in Asia and Europe.
Chana is widely appreciated as health food. This light brown colored pulse is
considered to be a good source of protein and is also called by the name of
Garbanzo beans. Chana, also called Bengal gram or chick pea, is the premiere pulse
crop in the Indian subcontinent. India is the largest consumer and producer of
chana in the world. Chana is used as an edible seed and is also used for making
flour throughout the globe.
Having a capacity to stand in drought conditions, this crop doesn't have the
requirement of being fed with nitrogen fertilizers. There are basically two varieties of
chana (gram):
Desi Chana– These are spilt peas and are relatively smaller in size having a thicker
seed coat. They appear dark brown in color .
Kabuli Chana– Kabuli Chana has a whitish-cream color and are relatively bigger in
size having a thinner seed coat. They are generally used in soups /salads or as flour.
Chana is a Rabi crop sown during the winter months in India. Fertile sandy and loam
soil with good drainage is required for cultivation. Cooler climate and low rainfall
suits chana cultivation. Kabuli type is grown in temperate regions, while the desi
type chana is grown in the semi-arid tropics. India is the world largest pulses
producing country accounting for around 27-28% of world total pulses production.
Chana is the largest pulses produced around world accounting for 40% of pulses
production. India is the largest producer and consumer of chana in the world. Chana
is the most important of pulse crops grown in India, ranking fourth among the grain
crops in acreage and production.
Chana is planted in India during Rabi season i.e. in the months of October to
December and is harvested in February, March and April.
As it is sensitive to rainfall, an appropriate drainage system is required otherwise it
can hamper the yield levels of product. The peak arrival period begins from March-
April at the major trading centers of the country.
This crop is often cultivated as a sole crop but sometimes it is also grown
rotationally with other crops such as jowar, bajra, wheat and coriander.
CULTIVATION AND SEASONALITY
CROP CALENDAR
CHANA CROP CALENDAR
Country
India
Jan Feb Mar Apr May Jun July Aug Sep Oct Nov Dec
Harvesting Sowing
DOMESTIC SCENARIO
India is the largest producer of Chana in the world sharing 67% of the total world
production.
The major Chana growing States are Madhya Pradesh, Maharashtra, Rajasthan,
Uttar Pradesh and Andhra Pradesh. Madhya Pradesh is the largest producer of
Chana approx 47% of total production followed by Rajasthan, Uttar Pradesh and
Maharashtra.
47%
14%
12%
9%
6%4%
2%6%
CHANA PRODUCING STATES (2012-13e)
MP
Rajasthan
Uttar Pradesh
Maharashtra
Andhra Pradesh
Karnataka
Chatisghar
Others
MAJOR TRADING HUBS IN INDIA
MAJOR TRADING CENTRES - CHANA

AGRI COMMODITIES APRIL TO JUNE 2013
5
The major trading centres for chana in India are Indore, Mumbai, Delhi, Bikaner,
Hyderabad, Latur, Akola, Kanpur, Chennai and Jaipur. Indore is the major market for
chana, which along with Akola, Latur etc set prices for this commodity.
According to advance Estimates released Total pulses output for 2012-13 season
has been pegged at 17.58 mn tn, down 3.3% compared to previous year. There has
been a sharp increase in the chana output estimates on the back of higher acreage
and good yield.
Chana Production is expected to rise to 8.57 million tonnes for 2013-14 compare to
last year of 7.9million tonnes due to increased in area under cultivation and
favorable weather condition. India's production depends upon the monsoon rains
and the moisture availability in the soil since most of the area under this crop falls
under rain fed regions.
DEMAND SUPPLY FUNDAMENTALS
2004-05 2005-06 2006-07 2007-08 2008-09 2009-10 2010-11 2011-12 2012-13 2013-
14*
0
1
2
3
4
5
6
7
8
9
5.47 5.66.33
5.757.06 7.48 8.25
7.58 7.98.57
CHANA PRODUCTION IN INDIA
Source:Ministry of Agriculture
Fig
in M
illio
ns T
onn
es
CHANA AREA AND YIELD
Years Area ( in 000 ha ) Yield(in Kg /ha)
2004-05
2005-06
2006-07
2007-08
2008-09
2009-10
2010-11
2011-12
2012-13*
6710
6930
7490
7540
7893
8210
9668
8960
9320
815
808
845
762
895
915
895
912
-
YIELD & AREA OF CHANA
Indian chana yield is in the range of 800 to 900 kg per hectare from 2004-05 to
2011-12. Due to its dependence of monsoon rain, as most of the chana growing
area falls under rainfed conditions, its yield fluctuates.
MINIMUM SUPPORT PRICE (MSP)
Government timely revises Minimum Support Prices (MSP) on timely basis to
encourage farmer to grow more of the crop and also to keep in line with cost of
production. The Minimum Support Price (MSP) for Chana (Gram) is rising
continuously. The main reason behind this move of Government is to encourage the
farmers to enhance the output. The MSP of Chana is increased to Rs 3,000 per
quintal for the 2013-14 marketing year from Rs 2,800 per quintal in the marketing
year 2012-13. This should also encourage farmers mainly in Rajasthan to go for
Chana sowing.
As per the latest release of Department of Commerce (GOI), imports of chickpea for
the current year have risen over the previous year. As also, depreciation in Indian rupee
has resulted in costlier imports which in turn have made domestic pulses prices dearer.
IMPORT AND EXPORT OF CHANA FROM INDIA
2007-08 2008-09 2009-2010 2010-2011 2011-12
0.00
0.05
0.10
0.15
0.20
0.25
0.30
0.35
0.150.20
0.34
0.10
0.20
0.160.13
0.10
0.20
0.06
INDIA CHANA EXPORTS & IMPORTS
YEARS
IMPORT
EXPORT
FIG
IN
MIL
LIO
NS
TO
NN
ES
Being largest producer and consumer of chana, India also imports chana from
Australia, Canada, Turkey and Myanmar while it exports kabuli chana to US, UK,
Saudi Arabia and UAE. The exports of chana are declining gradually after imposition
of export ban in June 2006. However, kabuli chana is exported as it is exempted
from the ban.
The current chana crop is higher by about 15 per cent over last year. This may lead
to lower imports at around 3 mt in 2013-14,said by President, India Pulses and
Grains Association.

NAME TREND CMP SUPPORT KEY LEVELS RESISTANCE
S1 S2 S3 R1 R2 R3
CHANA BULLISH 3439 3330 3210 3050 3520 3710 3960 4175
AGRI COMMODITIES APRIL TO JUNE 2013
6
CHANA TRADING SPECIFICATIONS
Spot Market Trading Futures Market Trading
Bags/Pack Size Quotation/Base Value Delivery Center Unit of trading Quotation/Base Value Delivery Center
100,60,50 kg at Delhi,
Bikaner & 90,60,50 kg
at Indore
Rs/Quintal Indore,Delhi Bikaner 100 MT Rs/Quintal Indore,Delhi Bikaner
CHANA STOCK LIMIT
State
Maharashtra
Rajasthan
Delhi
Retailer
5
3
5
Wholesaler/
Stockist
50
100
200
Current Stock Limit (in Tons)
Government regularly takes measures to control the rising pulses prices by
imports, imposing stock limits and moral persuasion. Central government imposes
the stock limits with the help of state government and looking at the production and
stock availability of various states the stock limits are decided by the states.
Different limits are applicable for wholesaler and retailers.
GLOBAL SCENARIO
69%
8%
3%
3%
3%
2%
2%2%
2%6%
CHANA MAJOR PRODUCING COUNTRIES
2012-13e
India
Turkey
Iran
Mexico
Pakistan
Ethopia
Canada
Australia
Myanmar
Others
Chana is produced in various countries across the countries. India is the largest
producer (around 70%) in the world. India is also the largest consumer of chana
accounting for 88-90% of world's consumption. Canada and Australia though
produce just 2% of world's crop they are among the major exporter mainly on
account of limited consumption. Pakistan produces around 2% and consumes 90%
of its production.
Chana can withstand moisture stress to a certain extent. However, the
production highly fluctuates between years, depending on the rains received
and the moisture availability in the soil.
The sentiments of traders play a significant role currently, as a consequence of
the lack of free-flow of information.
Stocks present with stockists and the stocks-to-consumption ratio.
MARKET INFLUENCING FACTORS
•
•
•
TRADING SPECIFICATIONS OF CHANA
•
•
•
•
CURRENT FUNDAMENTALS DRIVING THE MARKETS
•
•
•
•
•
•
•
•
•
OUTLOOK
Imports and the crop situation in the countries from where imports originate,
viz., Canada, Australia, Myanmar.
Obstruction in the information movement
Prices of the other competitive pulses produced
Black-marketing and hoarding
Expectations of higher output this season against restricted buying further
influenced the prices.
The current chana crop is higher by about 15 per cent over last year. This may
lead to lower imports at around 3 mt in 2013-14.
The Government has been trying to encourage production of pulses, but the
efforts have not paid off significantly. The Commission for Agriculture Costs
and Prices (CACP) has suggested to the Government to levy 10 per cent import
duty on pulses and open up exports to encourage domestic production.
Presently, there is no import duty on pulses, while exports of many varieties are
banned. CACP believes that imposing 10 per cent duty on imports would
enhance domestic output by attracting more irrigated areas under pulses.
Indirectly, such a move would result in saving on fertiliser subsidy as pulses are
nitrogen fixing and help towards stabilising production.
Supplies from the new crop have started arriving in Andhra Pradesh,
Karnataka, Maharashtra and Madhya Pradesh, and are likely to rise further.
Meanwhile, chana sown area surged to 93.20 lakh ha. as compared from
89.60 lakh ha. in last year.
However, expectations of higher output and rising arrivals from the new season
crop in the physical market restricted the gains.
According to IBIS, imports of chana in the month of February declined to 0.46
lakh metric tonnes compared to 2.31 lakh metric tonnes during the previous
month.
Agriculture Canada forecasts exports of chickpeas will reach 60,000 MT this
season and 65,000 MT in the coming marketing year.
Chana is expected to continue to trade in the range to lower in coming 2-3 weeks
tracking increasing arrivals of the new crop coupled with higher imports. However,
sharp downside may be capped as demand will emerge at lower levels. Also, prices
may not sustain below Rs 3020 as farmers will not liquidate their produce below
these levels. Technically, on break and close below Rs. 3100 prices could come
down to 2800 to 2650.
AGRI COMMODITIES APRIL TO JUNE 2013
7
RICE
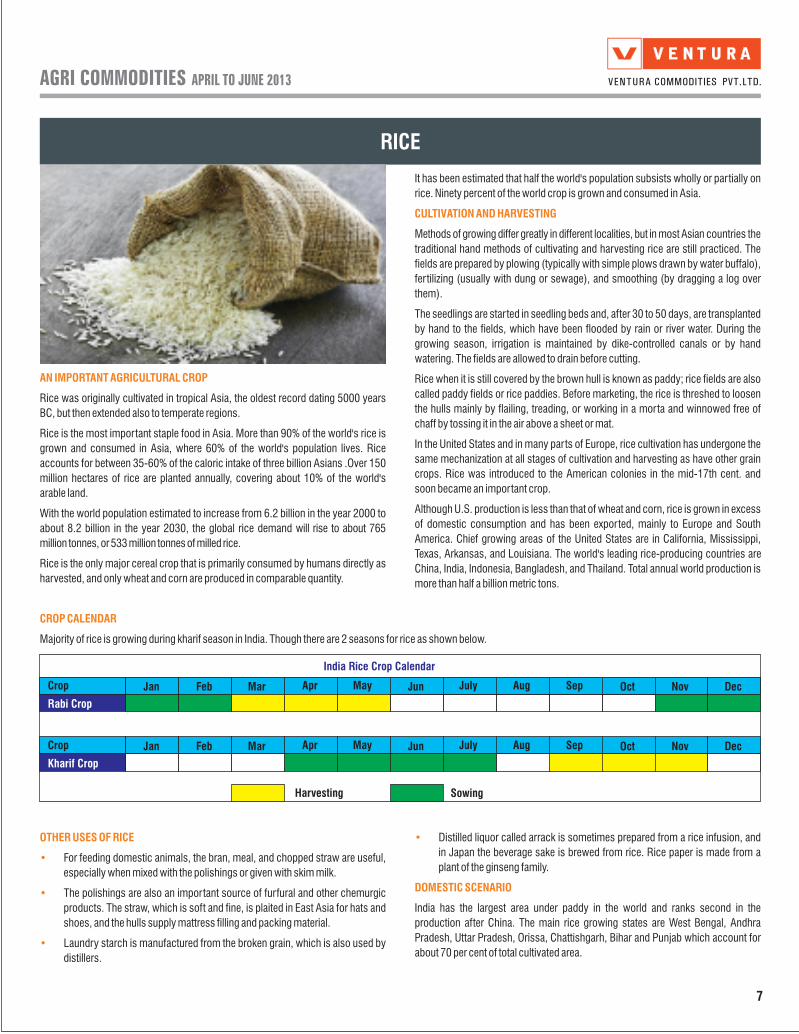
AN IMPORTANT AGRICULTURAL CROP
Rice was originally cultivated in tropical Asia, the oldest record dating 5000 years
BC, but then extended also to temperate regions.
Rice is the most important staple food in Asia. More than 90% of the world's rice is
grown and consumed in Asia, where 60% of the world's population lives. Rice
accounts for between 35-60% of the caloric intake of three billion Asians .Over 150
million hectares of rice are planted annually, covering about 10% of the world's
arable land.
With the world population estimated to increase from 6.2 billion in the year 2000 to
about 8.2 billion in the year 2030, the global rice demand will rise to about 765
million tonnes, or 533 million tonnes of milled rice.
Rice is the only major cereal crop that is primarily consumed by humans directly as
harvested, and only wheat and corn are produced in comparable quantity.
It has been estimated that half the world's population subsists wholly or partially on
rice. Ninety percent of the world crop is grown and consumed in Asia.
Methods of growing differ greatly in different localities, but in most Asian countries the
traditional hand methods of cultivating and harvesting rice are still practiced. The
fields are prepared by plowing (typically with simple plows drawn by water buffalo),
fertilizing (usually with dung or sewage), and smoothing (by dragging a log over
them).
The seedlings are started in seedling beds and, after 30 to 50 days, are transplanted
by hand to the fields, which have been flooded by rain or river water. During the
growing season, irrigation is maintained by dike-controlled canals or by hand
watering. The fields are allowed to drain before cutting.
Rice when it is still covered by the brown hull is known as paddy; rice fields are also
called paddy fields or rice paddies. Before marketing, the rice is threshed to loosen
the hulls mainly by flailing, treading, or working in a morta and winnowed free of
chaff by tossing it in the air above a sheet or mat.
In the United States and in many parts of Europe, rice cultivation has undergone the
same mechanization at all stages of cultivation and harvesting as have other grain
crops. Rice was introduced to the American colonies in the mid-17th cent. and
soon became an important crop.
Although U.S. production is less than that of wheat and corn, rice is grown in excess
of domestic consumption and has been exported, mainly to Europe and South
America. Chief growing areas of the United States are in California, Mississippi,
Texas, Arkansas, and Louisiana. The world's leading rice-producing countries are
China, India, Indonesia, Bangladesh, and Thailand. Total annual world production is
more than half a billion metric tons.
CULTIVATION AND HARVESTING
CROP CALENDAR
Majority of rice is growing during kharif season in India. Though there are 2 seasons for rice as shown below.
OTHER USES OF RICE
•
•
•
For feeding domestic animals, the bran, meal, and chopped straw are useful,
especially when mixed with the polishings or given with skim milk.
The polishings are also an important source of furfural and other chemurgic
products. The straw, which is soft and fine, is plaited in East Asia for hats and
shoes, and the hulls supply mattress filling and packing material.
Laundry starch is manufactured from the broken grain, which is also used by
distillers.
•
DOMESTIC SCENARIO
Distilled liquor called arrack is sometimes prepared from a rice infusion, and
in Japan the beverage sake is brewed from rice. Rice paper is made from a
plant of the ginseng family.
India has the largest area under paddy in the world and ranks second in the
production after China. The main rice growing states are West Bengal, Andhra
Pradesh, Uttar Pradesh, Orissa, Chattishgarh, Bihar and Punjab which account for
about 70 per cent of total cultivated area.
India Rice Crop Calendar
Crop Jan Feb Mar Apr May Jun July Aug Sep Oct Nov Dec
Harvesting Sowing
Rabi Crop
Crop Jan Feb Mar Apr May Jun July Aug Sep Oct Nov Dec
Kharif Crop

AGRI COMMODITIES APRIL TO JUNE 2013
8
West Bengal
Andhra Pradesh
Uttar Pradesh
Punjab
Orissa
Others
15.8
12.71
11.9110.86 7.31
41.41
Major Rice Producing States (2012-13e)
% Production to All India
India is one of the world's largest producer of rice, accounting for 20% of all world
rice production..
The India's rice production reached to a record high of 100 million tonnes in 2012-
13 crop-year.
RICE AREA AND YIELD
Years Area (in 000 ha) Yield(Rough MT/hec)
2004-05
2005-06
2006-07
2007-08
2008-09
2009-10
2010-11
2011-12
2012-13e
42300
43400
44000
43770
45400
41850
44000
44500
43000
2.95
3.17
3.18
3.31
3.28
3.19
3.25
3.27
3.52
2004-05
2005-06
2006-07
2007-08
2008-09
2009-10
2010-11
2011-12
2012-13e
0
20000
40000
60000
80000
100000
120000
83130 9179093350
9669099180
89090 95300 105310
101000
RICE PRODUCTION IN INDIA
YearsFig in 000 Tonnes
COMPARISON OF RICE BALANCE SHEET
Fundamentals
Beginning stocks
Production
Imports
Consumption
Exports
Total Supply
Ending Stocks
2012-2013e
25226
101000
-
95000
7600
126226
23626
2011-12
23500
105310
-
93334
10250
128810
25226
Rice Balance Sheet 2011-12 & 2012-2013e – India (in '000' tonnes)
MINIMUM SUPPORT PRICE (MSP)
The MSP for RICE has been increased to Rs 1,250 per quintal from Rs 1,080 in the
previous year. Higher MSP has been announced to give better returns to paddy
farmers, whose cost of cultivation has risen substantially due to rise in cost of labor,
power and fertilizer.
2004-05 2005-06 2006-07 2007-08 2008-09 2009-10 2010-11 2011-12 2012-13
0
200
400
600
800
1000
1200
1400
630 640700
850
10001080 1100 1080
1250
RICE MSP
Years
Rs/
Qui
ntal
DEMAND SUPPLY FUNDAMENTALS
MONTHLY RICE ARRIVALS 2012 Vs 2013
SPOT MARKET TRADING SPECIFICATIONS
Commodity Bags/Pack SizeQuotation / Base Value
Types of Rice export by India
Rice Rs/Quintal
Parboiled rice Basmati RiceWhite Rice
Long Grain Yellow RiceIR-64 RiceRaw Rice
50Kg in Haryana, Punjab,
Sirsa,70 Kg in Wrangle & 35 Kg
in Khamanon

AGRI COMMODITIES APRIL TO JUNE 2013
9
GLOBAL SCENARIO
Rice is a food staple worldwide and China is the world's leading rice producing
country, producing just over one-third (33.9%) of the world's rice supply. India is
the world's second largest producer and exporter. Among the exporting countries,
Thailand, Vietnam, India and Pakistan are the major countries exporting rice in size
able quantity.
143000
101000 3690034000
27710
20500
104961
Major Rice Producing Countries (2012-13e)
Figures in 000' MT
China
India
Indonesia
Bangladesh
Vietnam
Thailand
Others
RICE EXPORTS FROM INDIA
Total rice exports in 2012-13 drop 29 per cent less than last year, as Indian
exporters are slowly raising prices.
Gulf region remains the major markets for Indian basmati rice and inside Gulf, Saudi
Arabia accounts for the major chunk of basmati imports from India.
Major destinations for India's non-basmati rice exports are Bangladesh, Australia,
Bahrain, Ethiopia, Djibouti, France, Germany, U.K., Hong Kong, Korea, Sri-Lanka,
Maldives, Mauritius, Malaysia, Nigeria etc.
However, with a bumper harvest in excess of 100 mt in 2011-12 and record stocks
of a little over 34 mt in state-run warehouses, India will continue to remain a major
player in the global market till at least June 2013, even if on a lower scale than 2011-
12.
2004-052005-06
2006-072007-08
2008-092009-10
2010-112011-12
2012-13e
0
2000
4000
6000
8000
10000
12000
45694688 5740
4654
21492228
4637
10250
7600
EXPORTS OF RICE FROM INDIA
YEARSSource:USDA
Fig
in 0
00 T
onnes
MARKET INFLUENCING FACTORS
Weather:
Minimum Support Price:
Role of weather in rice production is immense. Temperature, rainfall and
soil moisture are the important parameters that determine the crop condition.
Further, natural calamities can also affect crops. Markets keep watch of these
developments.
Changes in the minimum support prices (MSP) by the
government also have immense impact on the price of rice.
Government policies:
Substitute Product:
Consumption:
Seasonal cycles:
Demand:
CURRENT FUNDAMENTALS DRIVING THE MARKETS
•
•
•
•
OUTLOOK
Exchange rates, Fiscal policies, Export incentives and
export promotion also influence price.
Availability of substitute products at cheaper rate may lead to
weakness in demand. This situation happens especially when the main products
price tends to become higher.
Rice consumption depends on two factors - population and Income.
Let's take for example Asia. Rice is the staple food of Asia. Low-income groups
consume more rice according to the per capita income increase. But as the income
increases, there arrives a point when the consumption starts to dip. Income growth
and reduction in population result in a low consumption of rice.
Seasonal cycles are present in rice cultivation. Price tends to be
lower as harvesting progresses and produce starts coming into the market. At the
time of sowing and before harvesting price tends to rise in view of tight supply
situation.
Export demands as well as domestic demand.
Rice export of India 74.67 lakh tons during April-December 2012 against
71.75 lakh tons in the full fiscal year of 2011-12.
As the export price of Indian rice was more competitive than the Thai rice,
India has displaced Thailand from the position of top exporter of rice during
2011-12,” said Minister of State Commerce and Industry D Purandeswari.
The export performance of both the countries in coming years would depend
upon quantum of production of rice in India and Thailand as also the overall
global supply scenario and other nuances of internal trade in agricultural
commodities.
In the global market, the 2012/13 world production forecast was raised 2.3
million tons to a record 468.1 million tons, with productions forecasts raised
for Cambodia, India, and Peru.
Last year, India became the world's largest rice exporter for the first time in recorded
history, helped by consecutive bumper harvests and a huge surplus accumulated
due to three-year ban on rice exports. The country exported around 10.4 million
tons of rice (including 3.48 million tons basmati, and 6.9 million tons non-basmati)
in 2011-12. However, India's rice exports are likely to drop about 20-30% in 2013
due to higher domestic prices and bumper crop in the international market.

AGRI COMMODITIES APRIL TO JUNE 2013
10
RAPE / MUSTARD SEED
INTRODUCTION
Mustard seeds are yellowish colored, small seeds that are used as a spice in many
countries. These seeds are obtained from bush like mustard plant that belongs to
the genus Brassica that also include vegetables like cabbage and turnips.
CROP CALENDAR
The crop starts flowering in the months of December, January and February. The harvesting period is from March to May. It needs a right proportion of rainfall that is provided
by the monsoon during the sowing seasons of the crop. The rapeseed/mustard crop is actually acts as a very good cover of soil in winters.
Rapeseed belongs to the plant of the same genus and also known as canola in many
countries. In old English, rapum is a name of the present day turnip and the name
rapeseed is derived from rapum only.
Mustard seed and rapeseed have great importance in many countries as spices.
But, these seeds have important by-products too. Rapeseeds and mustard seeds
are sources of rapeseed/mustard seed oil and oilcake. Yellow colored oil is obtained
by extraction process of the crushed rape/mustard seeds. In the market, rape oil is
not distinguished from mustard oil as both of these come from the same species
and possess same properties.
During the production of oil, pressed cakes of the seeds are left over that have some
amount of oil content. These cakes are distilled to make oil cakes, which serves as
an animal feed. In the production process, around 37% oil is yielded and the rest is
oil cake.
Mustard/Rapeseed cultivation is done widely throughout the world. It is basically a
winter crop and it requires a temperate climate to prosper. The planting season or
the sowing period in India is during the Rabi season i.e. October to December.
CULTIVATION PATTERN
Mustard Seed Crop Calendar
Country
India
Jan Feb Mar Apr May Jun July Aug Sep Oct Nov Dec
Harvesting Sowing
DOMESTIC SCENARIO
In India, mustard seed is grown as a rabi crop, which is sowed during October-
December and the harvesting begins from March onwards. The largest mustard
seed producing states in India are Rajasthan (45%), Haryana (13%), Madhya
Pradesh (13%) and Uttar Pradesh (11%).
Rajasthan and Haryana produce the major share of rape/mustard contributing to
over 50% of the total Indian produce. It also has the maximum area under cultivation
for this crop.
Mustard seeds are yellowish colored, small seeds that are used as a spice in many
countries. These seeds are obtained from bush like mustard plant that belongs to
the genus Brassica that also include vegetables like cabbage and turnips.
MAJOR TRADING HUBS IN INDIA
Delhi, Kota and Hapur are the major market for mustard in India and the prices of
these markets serve as 'reference' for other subsidiary markets.
MAJOR TRADING CENTRES – MUSTARD SEED

AGRI COMMODITIES APRIL TO JUNE 2013
11
DEMAND SUPPLY FUNDAMENTALS
In India, mustard seed is the third largest produced oilseed after soybean and
groundnut. Mustard seed production is fluctuating over year, as this crop is growing
mainly on rain fed area.
The unfavorable weather conditions during November-December 2011 not only
hampered planting but also affected the mustard seed yield. The drop in area under
mustard seed cultivation by 3.5% to 7mn hectares and yield by 4% has resulted in a
drop in output by 12% to 6.2 mn tonne in 2011-12.
2004-052005-06
2006-072007-08
2008-092009-10
2010-112011-12
2012-13
0
1000
2000
3000
4000
5000
6000
7000
80006500 7000
58005450
67006400 7100
6200 6800
RAPE MUSTARD SEED PRODUCTION
YEARSSource :-USDA
Fig
in 0
00
to
nn
es
MUSTARD AREA &YIELD
Years Area (in 000 Ha) Yield (Kg/Hec)
2008-09
2009-10
2010-11
2011-12
2012-13
6600
6450
7250
7000
6750
900
920
980
940
1001
COMPARISON OF MUSTARD SEED BALANCE SHEET
Fundamentals
Production
Imports
Consumption
Exports
Total Supply
Ending Stocks
Beginning Stocks
2012-2013e
6800
-
6900
-
7104
204
304
2011-2012
6200
-
6825
-
7129
304
929
Mustard Seed Balance Sheet 2011-2012 & 2012-2013e - India
(in '000' tonnes)
MINIMUM SUPPORT PRICE (MSP)
In the past two years, the government has hiked the MSP of oilseeds, along with that
of mustard seed, to boost production and reduce the dependency on import. From
Rs 2,500 per quintal in 2011-12, the government raised the support price to Rs
3,000 per quintal in 2012-13.
2004-05 2005-06 2006-07 2007-08 2008-09 2009-10 2010-11 2011-12 2012-13
0
500
1000
1500
2000
2500
3000
3500
1700 1715 1715 1800 1830 1830 1850
2500
3000
MSP OF MUSTARD SEED
YEARS
Rs/
Qui
ntal
SPOT PRICE OF MUSTARD SEED VS YOY ARRIVALS
The prices in the country are largely dependent on the domestic production of
mustard seed and its arrivals in the market. Peak arrival period is between February
and May in these markets. Thereafter, arrivals start declining and least in the month
of July.
IMPORT & EXPORT OF MUSTARD SEED
• India is self-sufficient in mustard seed and oil as import and export of the
commodity is almost non-existent.
MUSTARD TRADING SPECIFICATIONS
Spot Market Trading Futures Market Trading
Bags/Pack Size Quotation/Base Value Delivery Center Unit of trading Quotation/Base Value Delivery Center
85 kg Rs/Quintal Kota, Hapur ,Haryana 100 MT Rs/Quintal
Alwar,Kota,Sri Ganga nagar,Bikaner(Rajasthan),
Hapur & Agra (UP)
CONTRACT SPECIFICATION OF MUSTARD SEED

AGRI COMMODITIES APRIL TO JUNE 2013
12
NCDEX ACCREDITED WAREHOUSE OF MUSTARD SEED
GLOBAL SCENARIO
The global mustard seed production has grown at 4.08% CAGR in the past two decades
and is currently 60.55 million tonne (2011-12). Regarding the production of rape/
mustard oil, China holds the first place followed by Canada and India and France.
MARKET INFLUENCING FACTORS
•
•
•
•
•
•
•
•
•
CURRENT FUNDAMENTALS DRIVING THE MARKETS
•
•
•
•
•
•
OUTLOOK
Various supply-demand factors revolving around the global edible oil scenario
Influence of internationally traded substitutes (Palm, soya oil)
The nature of the existing supply
The presence of a large unorganized crushing sector
Government policies and intervention.
The ups and downs in production, arrivals in the mandis, international prices
of other oilseeds and oils
Stocks present with stockist and the stocks-to-consumption ratio.
Weather plays a profound influence in determining the trader's sentiments and
the production.
The price of other major oilseeds like castor, soybean, also influence the
prices of Rmseeds.
Surge in the main winter-sown rapeseed crop due to favourable weather has
helped in production rise.
Output of rapeseed rose about 22% to 6.8 million ton in the 2012-13 harvest,
said the Central Organisation for Oil Industry and Trade (COOIT).
In a bid to arrest spiraling prices of edible oil in the state, the Gujarat
government recently imposed stock limit on edible oil and oil seeds with
immediate effect.
The state government's move of limiting stock of oilseeds and edible oils has
come in the wake of groundnut oil prices touching Rs 2,100 per tin of 15 litres,
almost double than last year.
A conference on Oilseeds industry held at Agra to discuss the likely supply
scenario of Rabi oilseeds. The Industry estimated 71.5 Lakh tons of RMseed
production this year.
As per the latest USDA report, China rapeseed production is projected at 13.5
million tons, up 0.9million based on increased area and yield indicated in
recently released official government statistics.
RM Seed is expected to continue to trade in the range to lower in coming 2-3 weeks
as output of rapeseed rose about 22 percent to 6.8 million tonnes in the 2012/13
harvest, said the Central Organisation for Oil Industry and Trade (COOIT), which
was giving its estimate after the crop had been harvested. After the recent surge in
prices, we feel correction in mustard seed till Rs 3,250-3,200 will provide a fresh
buying opportunity. Buying should be avoided at current levels. The demand-
supply scenario for the domestic market projects higher supply of most rabi crops.
Weather developments in Argentina and US will determine meal exports from India.
This will be an important factor to watch out for.
Mustard Seed - Ncdex Accredited Warehouse
State City Warehouse
Rajasthan Alwar
LTC Commercial Company Private LimitedJICS Logistics
Star Agriwarehousing and Collateral Management Ltd.
NCMSL Commodity Multilink Point
Rajasthan BikanerJanhavi Promoters Pvt.Ltd
JICS Logistics
Uttar Pradesh
Hapur NCMSL Commodity Multilink Point
Haryana HisarThe Haryana State Co-op Supply &
Marketing Federation Limited
Rajasthan Kota
NCMSL Commodity Multilink PointStar Agriwarehousing and
Collateral Management Ltd. Total Logistics (India) Private Limited
Shree Shubham Logistics LimitedJICS Logistics
Rajasthan Jaipur
Star Agriwarehousing and Collateral Management Ltd.
Total Logistics (India) Private LimitedACE Audit Control and Expertise (India) Pvt. Ltd.
JICS LogisticsLTC Commercial Company Private Limited
NCMSL Commodity Multilink Point
S1 S2 S3 R1 R2 R3
MUSTARD SEED BULLISH 3470 3350 3230 3020 3700 3944 4250 4500
NAME TREND CMP SUPPORT KEY LEVELS RESISTANCE

AGRI COMMODITIES APRIL TO JUNE 2013
13
MAIZE
INTRODUCTION
Maize (Indian Corn) constitutes a primary poultry feed ingredient.
Corn is generally grown in two seasons. The first is Kharif, for which sowing starts
in June and harvested October onwards. Karnataka, Andhra Pradesh, Gujarat,
Maharashtra and Orissa have Kharif crops.
The second is Rabi, for which sowing starts from November and harvested by May.
Rabi crop is mainly grown in Bihar and coastal Andhra Pradesh. In Tamil Nadu corn
production starts from January and peaks by April. Corn may also be produced in
small quantities during other times of the year.
Corn has several uses. It is used in the poultry and animal feed industry, in starch
and food industry, in breweries and for human consumption. In the poultry feed
industry, corn constitutes about 60% of the feed and hence is extremely a
significant raw material.
Maize is the only crop which has got the highest weight of production even as
compared to rice and wheat. The planting of the maize crop is done in the spring
season so that it could get the benefit of the rains in this season. Rains for this crop,
are very important as maize is very sensitive to drought. This crop is generally
cultivated in a two or three crop rotation. The cultivation of maize involves the
following steps:
Planting – Planting of the crop is when the crop is planted. The planting of
maize is generally done in mid of April to mid of May.
Silking – Silking is the most crucial stage in the crop cultivation. It means
pollination of the crop.
Doughing – When the maize crop starts to show a thick substance, the crop is
said to be doughed.
Denting- During the process of doughing, the plant spends all its resources in
the formation of those dough like substance and this causes the plant to
reduce and a 'dent' starts to show, on the end of the substance. This is called
denting.
Maturing – When the green foliage is gone and maize appears from the
opening of the foliage, the crop is said to be matured.
Harvesting – The crop usually gets matured around the year end and then it
harvested.
CULTIVATION PATTERN
•
•
•
•
•
•
CROP CALENDAR
Maize Crop Calendar
Country
India
Jan Feb Mar Apr May Jun July Aug Sep Oct Nov Dec
Harvesting Sowing
DOMESTIC SCENARIO
India's produces around 10-14 million tons of maize annually. This contributes to
about 2% of the total world production. Most of the corn produced in India mainly
comes from the southern Corn Belt states of Karnataka and Andhra Pradesh. In
India, major maize producing states are Karnataka, Andhra Pradesh and Bihar.
Other states including Tamil Nadu, Uttar Pradesh, Madhya Pradesh, Maharashtra,
and Orissa are producers of a smaller scale.
MAJOR TRADING HUBS IN INDIA
MAJOR TRADING CENTRES – MAIZE

AGRI COMMODITIES APRIL TO JUNE 2013
14
DEMAND SUPPLY FUNDAMENTALS
Indian maize prices were at a record high in 2011-12 due to a substantial increase in
exports due to the weak Indian rupee. The performance of competing crops and
price of maize crop influences area, production and yield of maize. For the last five
years the area under maize has increased considerably
Maize is grown in all the three seasons in an area of 8.6 to 8.9 lakh ha with an annual
production of 2.1 to 2.5 million tonnes. Earlier in 50's and 60's, the maize
production was improved through crop management techniques and increasing the
area under cultivation. Now it is being improved through improvement in yield levels.
2004-05
2005-06
2006-07
2007-08
2008-09
2009-10
2010-11
2011-12
2012-13
0
5000
10000
15000
20000
25000
1418014710
1510018960 19730
16720
2173021570
21000MAIZE PRODUCTION
YEARS
Fig
in 0
00 to
nnes
MAIZE AREA & YIELD
Years Area (in 000 Ha) Yield(Million/Ha)
2004-05
2005-06
2006-07
2007-08
2008-09
2009-10
2010-11
2011-12
2012-13
7500
7600
7800
8260
8170
8330
8600
8670
8930
1.89
1.94
1.94
2.3
2.41
2.01
2.53
2.49
2.35
COMPARISON OF MAIZE BALANCE SHEET
Fundamentals
Beginning Stocks
Production
Imports
Consumption
Exports
Total Supply
Ending Stocks
2012-2013e
407
21000
-
18000
3000
7104
407
2011-2012
511
21570
-
17000
4674
22081
407
Maize Balance Sheet 2011-2012 & 2012-2013e - India (in '000' tonnes)
MINIMUM SUPPORT PRICE (MSP)
The Government of India has increased the Minimum Support Price (MSP) of maize
of Fair Average Quality (FAQ) from Rs. 980 per quintal to Rs. 1175 per quintal for the
crop year 2012-2013.Every year, the Government of India determines the Minimum
Support Price of maize based on the recommendations of the Commission for
Agricultural Cost and Prices (CACP).
MSP OF MAIZE
1400
1200
1000
800
600
400
200
02004-05 2005-06 2006-07 2007-08 2008-09 2009-10 2010-11 2011-12 2012-13
YEARS
525 540 540620
840 840 880980
1175
Rs/
Qui
ntal
SPOT PRICES OF MAIZE - KARNATAKA Vs YOY ARRIVALS
Davangere is the major maize producing district in Karnataka accounting for 25 per
cent of the state production. The kharif maize crop has started arriving in major
mandies of Karnataka. The late arrival of monsoon has delayed maize arrivals in
Davanagere. The widespread drought and weak crop prospects worldwide has
raised the prices of maize in Karnataka.
MAIZE TRADING SPECIFICATIONS
MAIZE TRADING SPECIFICATIONS
Spot Market Trading Futures Market Trading
Bags/Pack Size Quotation/Base Value Delivery Center Unit of trading Quotation/Base Value Delivery Center
50,60,100 kg Rs/Quintal 100 MT Rs/Quintal
Banglore, Davangere Kanpur, Bahraich(UP), Patna,
Chapra(Bihar)
(Karnataka), Nizamabad, Davangere, Karimnagar, Delhi,Sangli

AGRI COMMODITIES APRIL TO JUNE 2013
15
MAIZE - NCDEX ACCREDITED WAREHOUSE
Maize - Ncdex Accredited Warehouse
State City Warehouse
Rajasthan NimbaheraLTC Commercial Company Private Limited
NCMSL Commodity Multilink Point
Andhra PradeshNizamabad
Andhra Pradesh State Warehousing CorporationJICS Logistics
NCMSL Commodity Multilink Point
Madhya Pradesh Ratlam NCMSL Commodity Multilink Point
Uttar Pradesh Bahraich NCMSL Commodity Multilink Point
Maharashtra Jalna NCMSL Commodity Multilink Point
Karnataka Davangere NCMSL Commodity Multilink Point
GLOBAL SCENARIO
The US is the leading producer of Maize with 40 per cent of the global production.
China and Brazil comes on the 2nd and 3rd place India is Asia's biggest maize
producer behind China. The US is the largest exporter of maize while, India
contributes about 2 percent of global trade. Indian maize prices were at a record
high in 2011-12 due to a substantial increase in exports due to the weak Indian
rupee. The performance of competing crops and price of maize crop influences
area, production and yield of maize.
MAIZE EXPORTS FROM INDIA
Indian maize prices were at a record high in 2011-12 due to a substantial increase in
exports due to the weak Indian rupee. According to reports, India exported around
S1 S2 S3 R1 R2 R3
NAME TREND CMP SUPPORT KEY LEVELS RESISTANCE
MAIZE BULLISH 1323 1220 1035 950 1485 1650 1800 1980
2004-05 2005-06 2006-07 2007-08 2008-09 2009-10 2010-11 2011-12 2012-13
0
1000
2000
3000
4000
5000
448 521
1208
4473
2608
1939
3376
4674
3000
Maize Exports
Years
Fig
in 0
00 T
onne
s
4mt of the 2011-12 corn output mainly to Far-East nations such as Malaysia,
Singapore and Indonesia and Vietnam. Egypt and Iran are new buyers of Indian corn
this year.
Weather of the area in which it is produced and natural calamities like floods,
droughts etc
Temperature, rainfall and soil moisture in the cultivating areas.
Demand for the maize in poultry and industrial uses
Changes in the government policies relating to the minimum support prices
Cheaper prices of the substitute product
Seasonal cycles: Price tends to be lower as harvesting progresses and
produce starts coming into the market. At the time of sowing and before
harvesting price tends to rise in view of tight supply situation.
Carryover stocks, consumption and the import-export policy also affects the
prices
Technological changes and improvements
Maize exports in the current season are expected to be lower by about a third
over last year's record high of 4.7 million tonnes on a lower crop and rising
domestic demand.
Trader expects maize exports to be in the region of around 3-3.5 MT for the
crop marketing year-ending August 2013.
The lower output in the kharif season has already resulted in a decline in
exports during the first half,” an official with a multinational exporting firm
said.
Maize output in 2012-13 is pegged at around 21 MT on account of lower crop in
Karnataka, Andhra Pradesh, Maharashtra and Rajasthan due to erratic monsoons.
Further, the maize has an export window only for the next two to three months
till June-July after which the global supplies are expected to ease.
The rabi maize crop in Bihar, which has been slightly delayed, looks higher by
about 20 per cent. There is a potential to export till June-July.
With easing global supplies from August and prices coming under pressure, as
reflected in the Chicago futures, exports from India were likely to be unviable.
The Chicago corn prices have eased on better planting prospects in the US
and Brazil.
Reports said corn planting in the US for 2013 is forecast to touch 97.75
million hectares, the highest in 77 years.
The long-term price trend in the domestic market is likely to remain bullish due to a
robust export demand. According to reports, India exported around 4mt of the
2011-12 corn output mainly to Far-East nations such as Malaysia, Singapore and
Indonesia and Vietnam. Egypt and Iran are new buyers of Indian corn this year.
Domestic demand for India is pegged at 17-18 million tonnes annually.
MARKET INFLUENCING FACTORS
•
•
•
•
•
•
•
•
CURRENT FUNDAMENTALS DRIVING THE MARKETS
•
•
•
•
•
•
•
•
•
OUTLOOK

Bigha
0.598
1.477
1.000
Acre
1.000
2.471
1.674
Hectare
0.405
1.000
0.677
Square Feet
43560.0
107639.1
17424.0Bigha
Acre
Hectare
CONVERSION TABLE – AREA
Wheat (Kg)
27.24
Soybean (Kg)
27.24
Corn (Kg)
25.42US Bushel
CONVERSION TABLE – VOLUME
US Gallon
1.000
9.309
0.264
US Bushel
0.107
1.000
0.028
Litre
3.785
35.239
1.000
US Gallon
US Bushel
Litre
CONVERSION TABLE – WEIGHTMaund Pound (lb) Kilogram Quintal Metric Ton
Maund
Pound (lb)
Kilogram
Quintal
Bales
Metric Ton
1.000
0.012
0.027
2.679
4.550
26.792
82.287
1.000
2.205
220.462
480.000
2204.630
37.324
0.454
1.000
100.000
170.000
1000.000
0.373
0.005
0.010
1.000
1.700
10.000
0.037
0.000
0.001
0.100
0.217
1.000
501.1
1,277.4
1,585.3
2,417.0
42.7
15.0
14.4 14.3
14.1
13.8
13
14
15
16
0
500
1000
1500
2000
2500
3000
CASTOR SEED RAWWOOLH2 SUGAR PADDY CASTOR OIL
%Rs
Cr
TOP 5 NSEL COMMODITIES ANNUAL RETURNS (%) MARCH 2013
AVG ANNUALISED RETURNS % (MARCH)TURNOVER (Rs In Cr) MARCH