Embed Size (px)
Citation preview
Energy
on European Electricity MarketsMarket Observatory for EnergyDG EnergyVolume 11(issue 4, fourth quarter of 2018)
Quarterly Report
1
DISCLAIMER: This report prepared by the Market Observatory for Energy of the European Commission aims at enhancing public access to information about prices of electricity in the Members States of the European Union. Our goal is to keep this information timely and accurate. If errors are brought to our attention, we will try to correct them. However the Commission accepts no responsibility or liability whatsoever with regard to the information contained in this publication. Copyright notice: Reproduction is authorised provided the source is acknowledged. © European Commission, Directorate-General for Energy, Market Observatory for Energy, 2019 Commission européenne, B-1049 Bruxelles / Europese Commissie, B-1049 Brussel – Belgium E-mail: [email protected]
2
CONTENT
1 Electricity market fundamentals ........................................................................................ 5
1.1 Demand side factors ............................................................................................................... 5
1.2 Supply side factors .................................................................................................................. 7
2 European wholesale electricity markets ....................................................................... 10
2.1 European wholesale electricity markets and their international comparison ..................... 10
2.2 Traded volumes and cross border flows .............................................................................. 16
3 Regional wholesale markets .............................................................................................. 21
3.1 Central Western Europe (Austria, Belgium, France, Germany, the Netherlands, Switzerland) 21
3.2 British Isles (UK, Ireland) ....................................................................................................... 24
3.3 Northern Europe (Denmark, Estonia, Finland, Latvia, Lithuania, Norway, Sweden) ............ 27
3.4 Apennine Peninsula (Italy) ..................................................................................................... 29
3.5 Iberian Peninsula (Spain and Portugal)................................................................................. 31
3.6 Central Eastern Europe (Czechia, Hungary, Poland, Romania, Slovakia, Slovenia) .............. 33
3.7 South Eastern Europe (Bulgaria, Croatia, Greece and Serbia) ............................................. 35
4 Retail markets in the EU and outside Europe .............................................................. 37
4.1 Retail electricity prices in the EU capital cities ..................................................................... 42
4.2 International comparison of retail electricity prices ............................................................. 44
5 Glossary ..................................................................................................................................... 45
3
HIGHLIGHTS OF THE REPORT
In October 2018, the joined wholesale price zone of Austria and Germany was separated. The measure was taken in order to facilitate the operation of the TSOs.
In France the nuclear electricity generation increased in Q4 2018 since more plants were cleared from the inspections of the entire French nuclear power fleet.
The Belgium market was expected to face serious supply concerns in Q4 2018 due to ongoing maintenance at the nuclear power stations. While power shortages did not materialize the Belgium wholesale price increased in Q4 2018 by 24% compared to Q4 in 2017
The long tendency of gradual decoupling of the evolution of electricity consumption and GDP was confirmed in the fourth quarter of 2018. While the EU GDP growth continued to decelerate electricity consumption rose, driven mainly by industrial demand as heating needs were subdued due to warmer than usual meteorological conditions.
The steady increase of the prices of emission allowances was maintained in Q4 2018. In the last weeks of 2018 the price rose above 25 €/t for the first time, denting the competitiveness of hydrocarbon power generation sources
The leading wholesale indicator was trading in the range of 60 €/MWh in Q4 2018, continuing on a rising trend that started in 2016 but also showing signs that it can be sustained at that level or even reversed
There were fewer occurrences of negative prices in October-December 2018 than in Q4 2017, implying an improving market operation in a context of a steady increase of RES generation sources
Industrial prices for electricity remained on a diverging path across the EU for all monitored consumer bands. Industrial prices in the EU were lower than in Japan, on par with China and Korea but more expensive than in the US by about 40 €/MWh
The energy component of prices paid by households increased in all but four Member States from September 2017 to September 2018, including Germany and Spain, two countries with relatively high share of variable renewable energy. Network charges and taxes remained stable across the EU on a y-o-y comparison
4
EXECUTIVE SUMMARY
In the last quarter of 2018 the European benchmark day-ahead baseload wholesale electricity price index stood
at 61 €/MWh on average, adding 1-2 €/MWh compared to the Q3 2018 average and being almost 25% higher than Q4 2017 when it stood at 44 €/MWh. The spread across regional monthly price averages ranged from more than 30 €/MWh in October to less than 20 €/MWh in December with the overall wholesale price dispersion across different markets in Europe being on par with previous quarters.
Economic growth decelerated for a fifth quarter in a row but remained positive at about 1.5%. Electricity consumption in Q4 2018 in the EU showed a measured increase in year-on-year comparison by about 1.2%, mainly driven by industrial demand as heating needs were lower than usual due to mild meteorological conditions.
Natural gas prices receded from September highs but remained well above 20 €/MWh, getting support from stronger demand in the winter season. Year-on-year, the prices increased by about 4 €/MWh. In Q4 2018 Coal prices were at 80 €/t, comparable to Q4 2017 but decreasing strongly from levels recorded in the summer, primarily owing to strong global demand for coal in the Asian markets.
Carbon prices continued their upward trend in Q4 2018 and at the end of the year they crossed above 25 €/tCO2e for the first time, as market players continued to price in the changes in the Market Stability Reserve (MSR) of the European Emission Trading System.
Profitability of coal-fired generation improved and in some cases returned to positive ranges in several EU Member States. As a consequence, the consumption of coal in the power sector increased in Q4 2018.
Industrial prices for electricity remained on a diverging path across the EU for all monitored consumer bands. Industrial prices in the EU were lower than in Japan, on par with China and Korea but more expensive than in the US by about 40 €/MWh
The energy component of prices paid by households increased in all but four Member States from September 2017 to September 2018, including Germany and Spain, two countries with relatively high share of variable renewable energy. Network charges and taxes remained stable across the EU on a y-o-y comparison
5
1 Electricity market fundamentals
1.1 Demand side factors
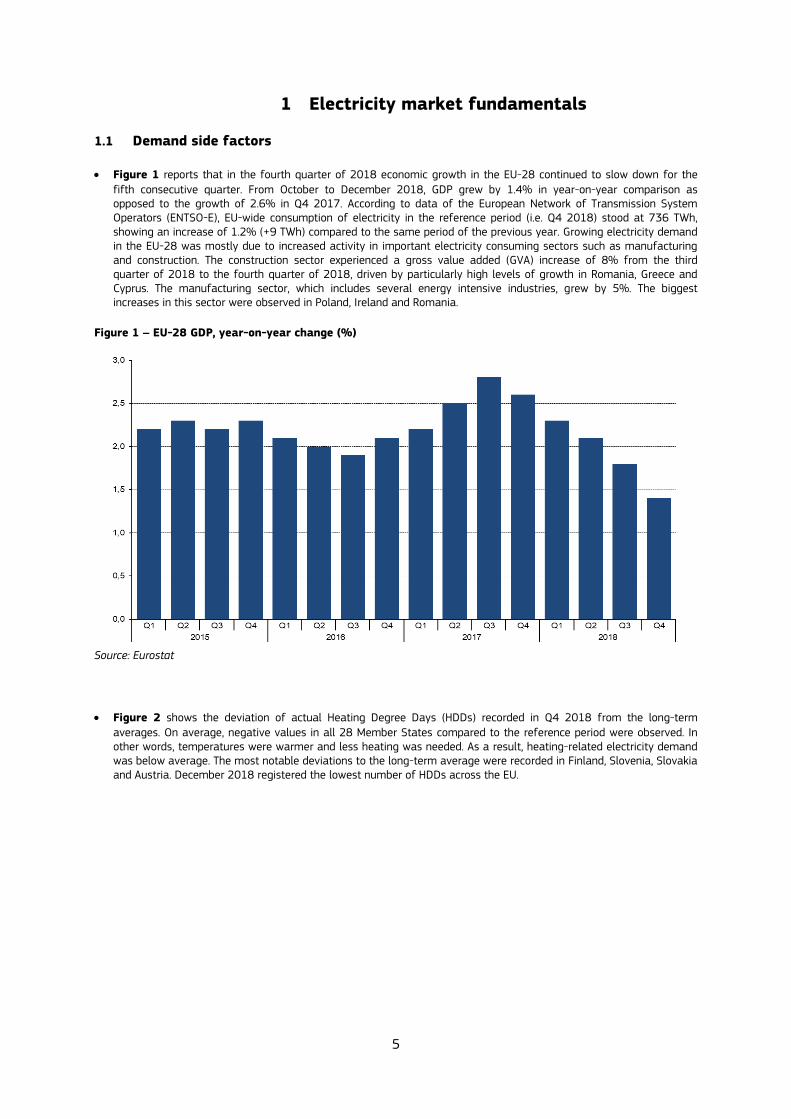
Figure 1 reports that in the fourth quarter of 2018 economic growth in the EU-28 continued to slow down for the
fifth consecutive quarter. From October to December 2018, GDP grew by 1.4% in year-on-year comparison as opposed to the growth of 2.6% in Q4 2017. According to data of the European Network of Transmission System Operators (ENTSO-E), EU-wide consumption of electricity in the reference period (i.e. Q4 2018) stood at 736 TWh, showing an increase of 1.2% (+9 TWh) compared to the same period of the previous year. Growing electricity demand in the EU-28 was mostly due to increased activity in important electricity consuming sectors such as manufacturing and construction. The construction sector experienced a gross value added (GVA) increase of 8% from the third quarter of 2018 to the fourth quarter of 2018, driven by particularly high levels of growth in Romania, Greece and Cyprus. The manufacturing sector, which includes several energy intensive industries, grew by 5%. The biggest increases in this sector were observed in Poland, Ireland and Romania.
Figure 1 – EU-28 GDP, year-on-year change (%)
Source: Eurostat
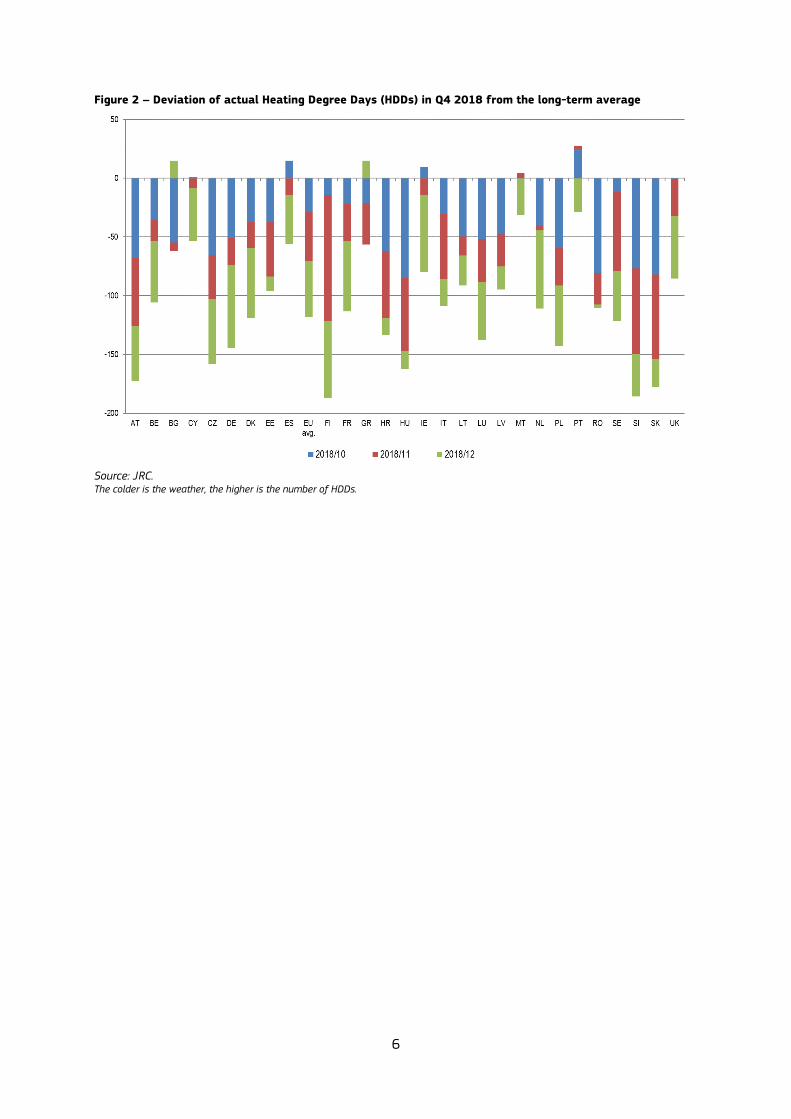
Figure 2 shows the deviation of actual Heating Degree Days (HDDs) recorded in Q4 2018 from the long-term averages. On average, negative values in all 28 Member States compared to the reference period were observed. In other words, temperatures were warmer and less heating was needed. As a result, heating-related electricity demand was below average. The most notable deviations to the long-term average were recorded in Finland, Slovenia, Slovakia and Austria. December 2018 registered the lowest number of HDDs across the EU.
6
Figure 2 – Deviation of actual Heating Degree Days (HDDs) in Q4 2018 from the long-term average
Source: JRC. The colder is the weather, the higher is the number of HDDs.
7
1.2 Supply side factors
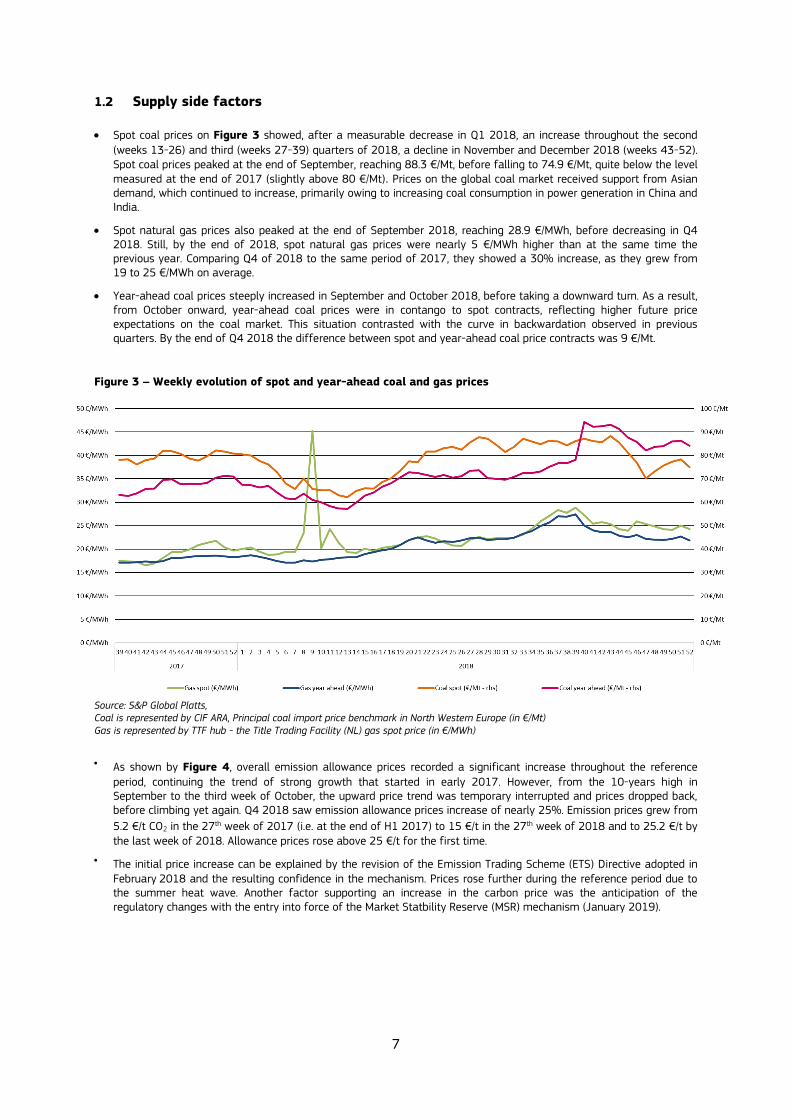
Spot coal prices on Figure 3 showed, after a measurable decrease in Q1 2018, an increase throughout the second
(weeks 13-26) and third (weeks 27-39) quarters of 2018, a decline in November and December 2018 (weeks 43-52). Spot coal prices peaked at the end of September, reaching 88.3 €/Mt, before falling to 74.9 €/Mt, quite below the level measured at the end of 2017 (slightly above 80 €/Mt). Prices on the global coal market received support from Asian demand, which continued to increase, primarily owing to increasing coal consumption in power generation in China and India.
Spot natural gas prices also peaked at the end of September 2018, reaching 28.9 €/MWh, before decreasing in Q4 2018. Still, by the end of 2018, spot natural gas prices were nearly 5 €/MWh higher than at the same time the previous year. Comparing Q4 of 2018 to the same period of 2017, they showed a 30% increase, as they grew from 19 to 25 €/MWh on average.
Year-ahead coal prices steeply increased in September and October 2018, before taking a downward turn. As a result, from October onward, year-ahead coal prices were in contango to spot contracts, reflecting higher future price expectations on the coal market. This situation contrasted with the curve in backwardation observed in previous quarters. By the end of Q4 2018 the difference between spot and year-ahead coal price contracts was 9 €/Mt.
Figure 3 – Weekly evolution of spot and year-ahead coal and gas prices
Source: S&P Global Platts, Coal is represented by CIF ARA, Principal coal import price benchmark in North Western Europe (in €/Mt) Gas is represented by TTF hub - the Title Trading Facility (NL) gas spot price (in €/MWh)
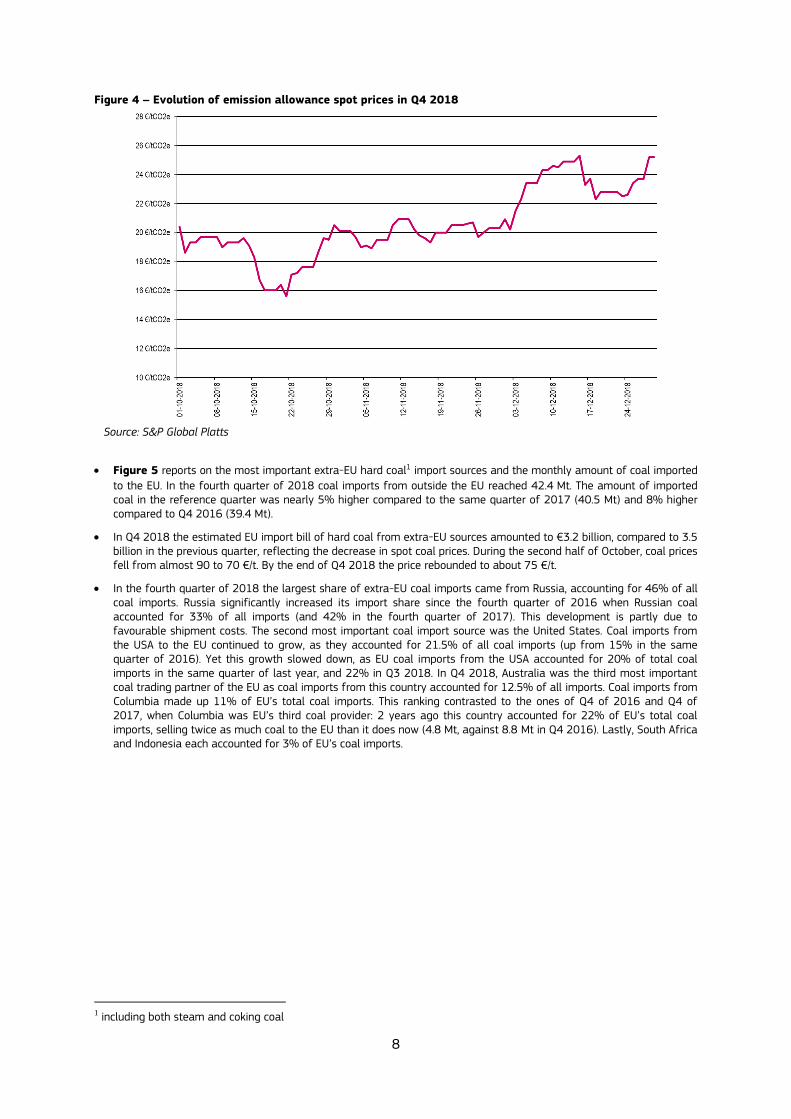
As shown by Figure 4, overall emission allowance prices recorded a significant increase throughout the reference
period, continuing the trend of strong growth that started in early 2017. However, from the 10-years high in September to the third week of October, the upward price trend was temporary interrupted and prices dropped back, before climbing yet again. Q4 2018 saw emission allowance prices increase of nearly 25%. Emission prices grew from
5.2 €/t CO₂ in the 27th week of 2017 (i.e. at the end of H1 2017) to 15 €/t in the 27th week of 2018 and to 25.2 €/t by the last week of 2018. Allowance prices rose above 25 €/t for the first time.
The initial price increase can be explained by the revision of the Emission Trading Scheme (ETS) Directive adopted in February 2018 and the resulting confidence in the mechanism. Prices rose further during the reference period due to the summer heat wave. Another factor supporting an increase in the carbon price was the anticipation of the regulatory changes with the entry into force of the Market Statbility Reserve (MSR) mechanism (January 2019).
8
Figure 4 – Evolution of emission allowance spot prices in Q4 2018
Source: S&P Global Platts
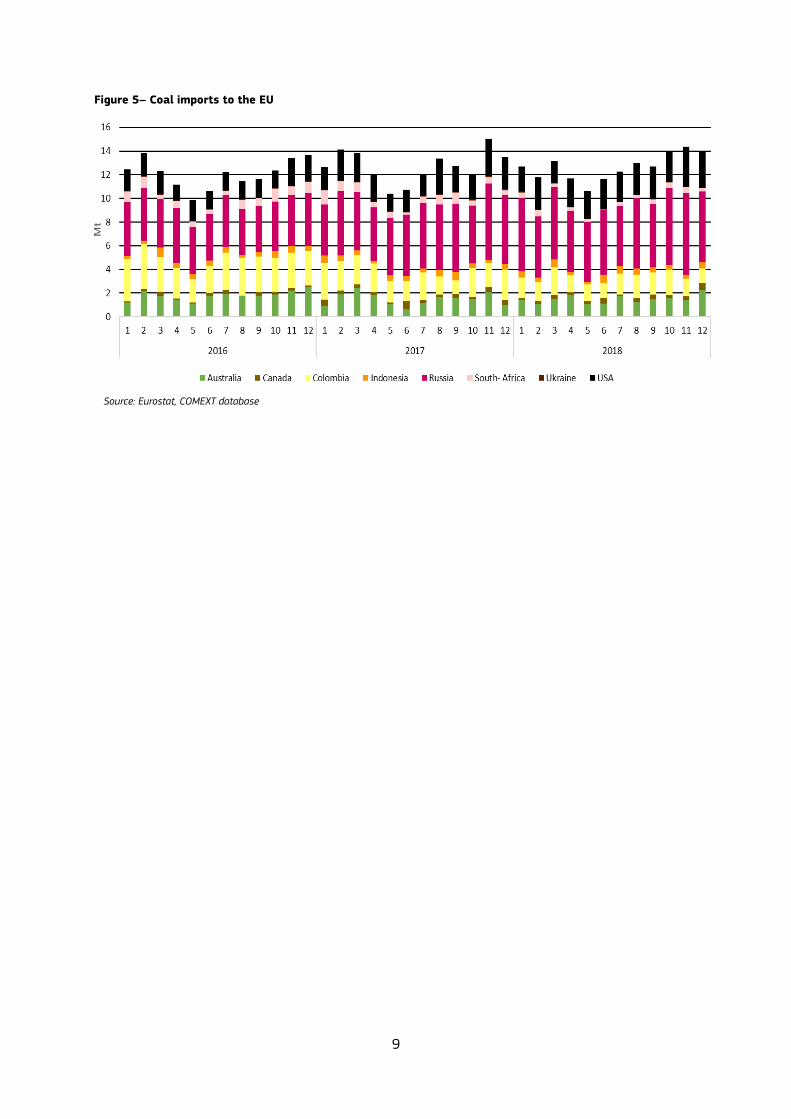
Figure 5 reports on the most important extra-EU hard coal1 import sources and the monthly amount of coal imported
to the EU. In the fourth quarter of 2018 coal imports from outside the EU reached 42.4 Mt. The amount of imported coal in the reference quarter was nearly 5% higher compared to the same quarter of 2017 (40.5 Mt) and 8% higher compared to Q4 2016 (39.4 Mt).
In Q4 2018 the estimated EU import bill of hard coal from extra-EU sources amounted to €3.2 billion, compared to 3.5 billion in the previous quarter, reflecting the decrease in spot coal prices. During the second half of October, coal prices fell from almost 90 to 70 €/t. By the end of Q4 2018 the price rebounded to about 75 €/t.
In the fourth quarter of 2018 the largest share of extra-EU coal imports came from Russia, accounting for 46% of all coal imports. Russia significantly increased its import share since the fourth quarter of 2016 when Russian coal accounted for 33% of all imports (and 42% in the fourth quarter of 2017). This development is partly due to favourable shipment costs. The second most important coal import source was the United States. Coal imports from the USA to the EU continued to grow, as they accounted for 21.5% of all coal imports (up from 15% in the same quarter of 2016). Yet this growth slowed down, as EU coal imports from the USA accounted for 20% of total coal imports in the same quarter of last year, and 22% in Q3 2018. In Q4 2018, Australia was the third most important coal trading partner of the EU as coal imports from this country accounted for 12.5% of all imports. Coal imports from Columbia made up 11% of EU’s total coal imports. This ranking contrasted to the ones of Q4 of 2016 and Q4 of 2017, when Columbia was EU’s third coal provider: 2 years ago this country accounted for 22% of EU’s total coal imports, selling twice as much coal to the EU than it does now (4.8 Mt, against 8.8 Mt in Q4 2016). Lastly, South Africa and Indonesia each accounted for 3% of EU’s coal imports.
1 including both steam and coking coal
9
Figure 5– Coal imports to the EU
Source: Eurostat, COMEXT database
10
2 European wholesale electricity markets
2.1 European wholesale electricity markets and their international comparison
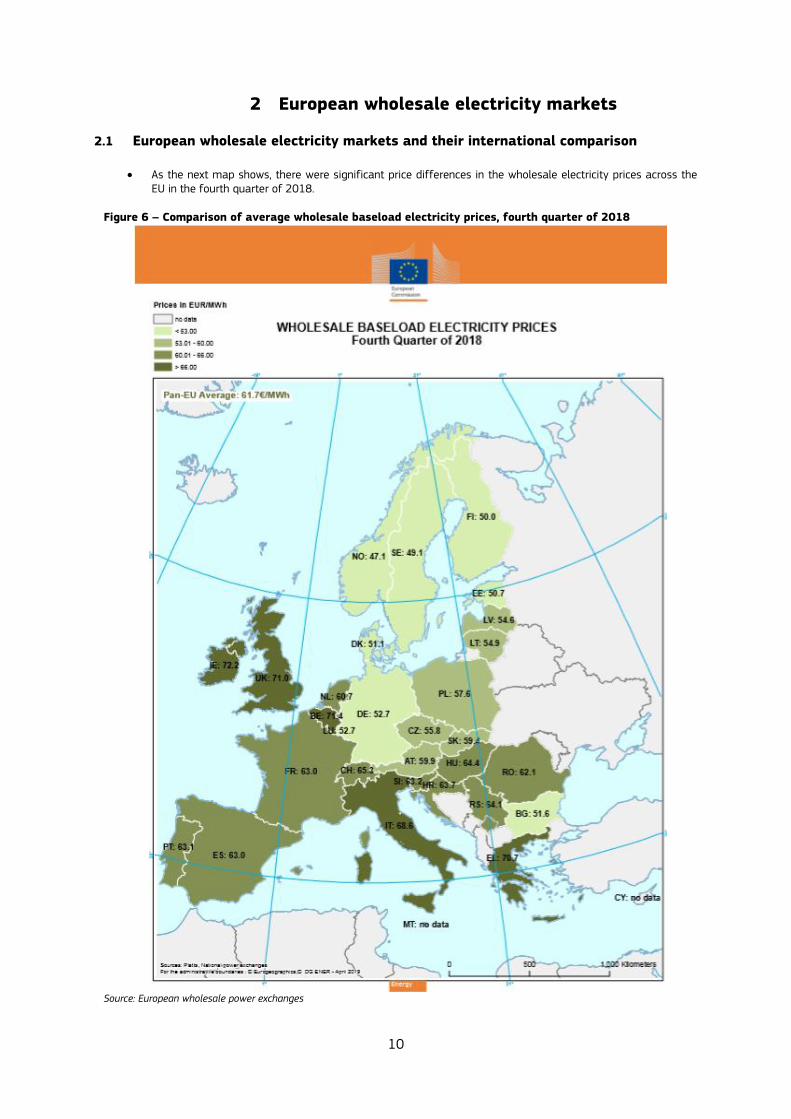
As the next map shows, there were significant price differences in the wholesale electricity prices across the EU in the fourth quarter of 2018.
Figure 6 – Comparison of average wholesale baseload electricity prices, fourth quarter of 2018
Source: European wholesale power exchanges
11
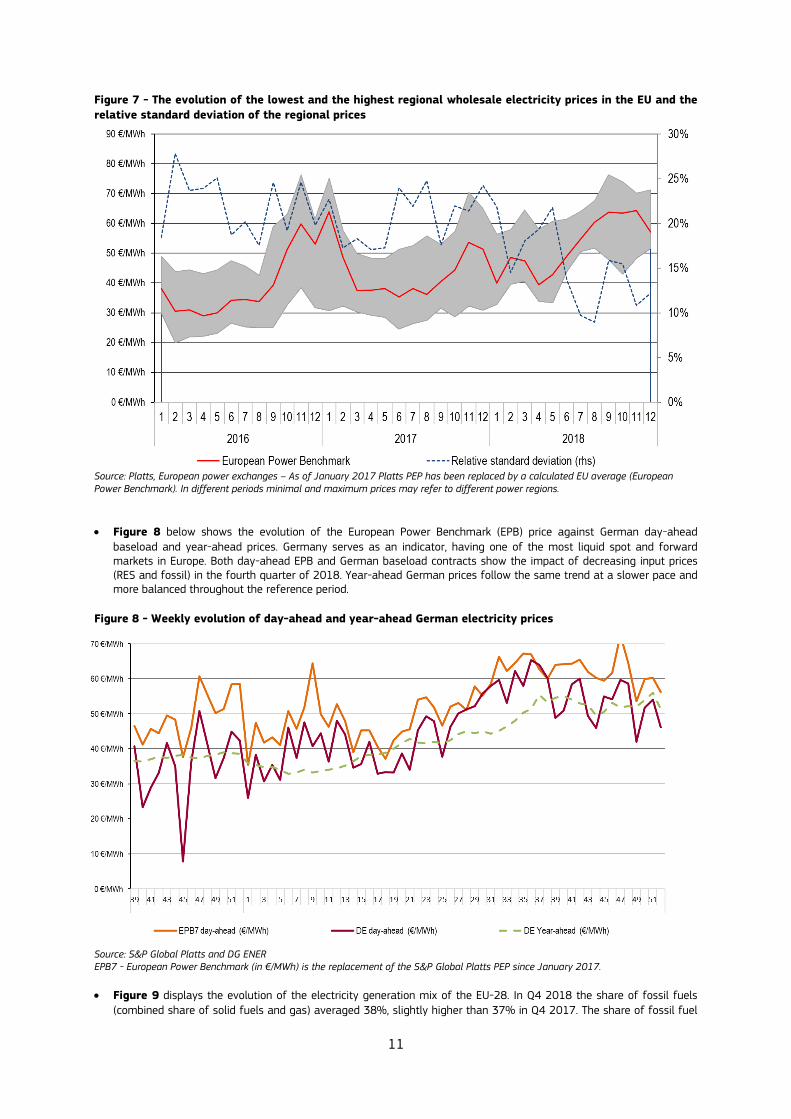
Figure 7 - The evolution of the lowest and the highest regional wholesale electricity prices in the EU and the
relative standard deviation of the regional prices
Source: Platts, European power exchanges – As of January 2017 Platts PEP has been replaced by a calculated EU average (European Power Benchmark). In different periods minimal and maximum prices may refer to different power regions.
Figure 8 below shows the evolution of the European Power Benchmark (EPB) price against German day-ahead
baseload and year-ahead prices. Germany serves as an indicator, having one of the most liquid spot and forward markets in Europe. Both day-ahead EPB and German baseload contracts show the impact of decreasing input prices (RES and fossil) in the fourth quarter of 2018. Year-ahead German prices follow the same trend at a slower pace and more balanced throughout the reference period.
Figure 8 - Weekly evolution of day-ahead and year-ahead German electricity prices
Source: S&P Global Platts and DG ENER EPB7 - European Power Benchmark (in €/MWh) is the replacement of the S&P Global Platts PEP since January 2017.
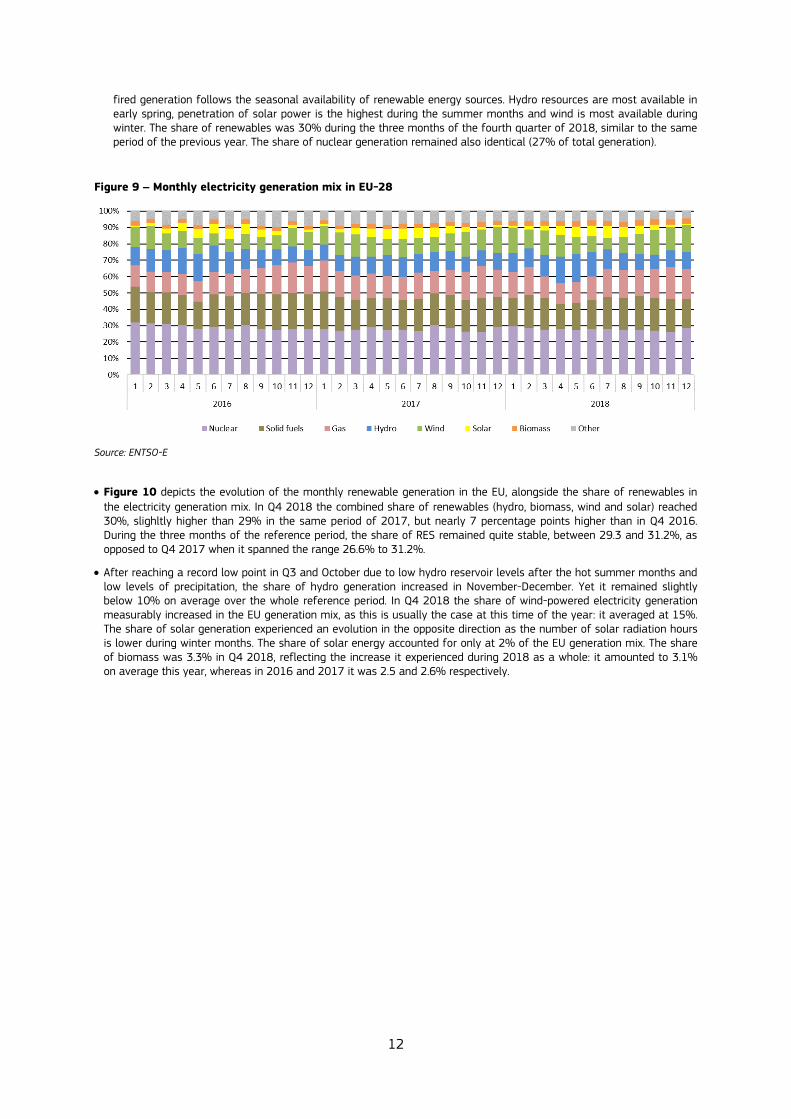
Figure 9 displays the evolution of the electricity generation mix of the EU-28. In Q4 2018 the share of fossil fuels (combined share of solid fuels and gas) averaged 38%, slightly higher than 37% in Q4 2017. The share of fossil fuel
12
fired generation follows the seasonal availability of renewable energy sources. Hydro resources are most available in early spring, penetration of solar power is the highest during the summer months and wind is most available during winter. The share of renewables was 30% during the three months of the fourth quarter of 2018, similar to the same period of the previous year. The share of nuclear generation remained also identical (27% of total generation).
Figure 9 – Monthly electricity generation mix in EU-28
Source: ENTSO-E
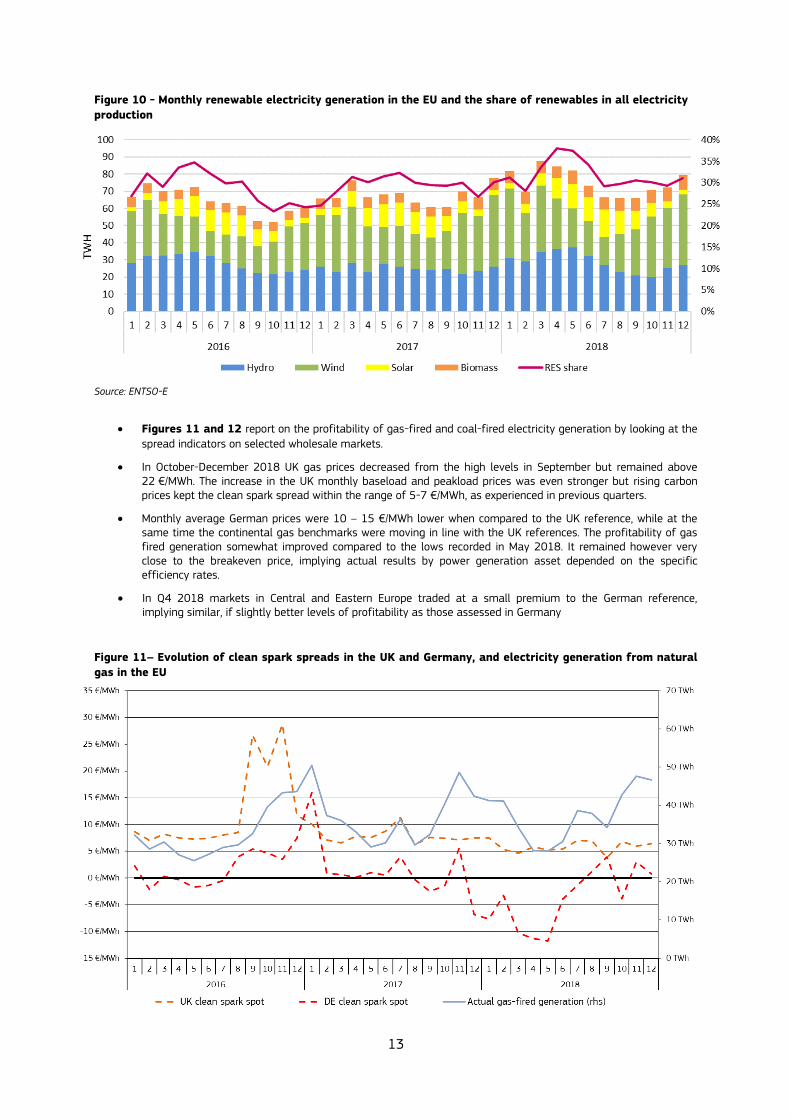
Figure 10 depicts the evolution of the monthly renewable generation in the EU, alongside the share of renewables in the electricity generation mix. In Q4 2018 the combined share of renewables (hydro, biomass, wind and solar) reached 30%, slighltly higher than 29% in the same period of 2017, but nearly 7 percentage points higher than in Q4 2016. During the three months of the reference period, the share of RES remained quite stable, between 29.3 and 31.2%, as opposed to Q4 2017 when it spanned the range 26.6% to 31.2%.
After reaching a record low point in Q3 and October due to low hydro reservoir levels after the hot summer months and low levels of precipitation, the share of hydro generation increased in November-December. Yet it remained slightly below 10% on average over the whole reference period. In Q4 2018 the share of wind-powered electricity generation measurably increased in the EU generation mix, as this is usually the case at this time of the year: it averaged at 15%. The share of solar generation experienced an evolution in the opposite direction as the number of solar radiation hours is lower during winter months. The share of solar energy accounted for only at 2% of the EU generation mix. The share of biomass was 3.3% in Q4 2018, reflecting the increase it experienced during 2018 as a whole: it amounted to 3.1% on average this year, whereas in 2016 and 2017 it was 2.5 and 2.6% respectively.
13
Figure 10 - Monthly renewable electricity generation in the EU and the share of renewables in all electricity
production
Source: ENTSO-E
Figures 11 and 12 report on the profitability of gas-fired and coal-fired electricity generation by looking at the
spread indicators on selected wholesale markets.
In October-December 2018 UK gas prices decreased from the high levels in September but remained above 22 €/MWh. The increase in the UK monthly baseload and peakload prices was even stronger but rising carbon prices kept the clean spark spread within the range of 5-7 €/MWh, as experienced in previous quarters.
Monthly average German prices were 10 – 15 €/MWh lower when compared to the UK reference, while at the same time the continental gas benchmarks were moving in line with the UK references. The profitability of gas fired generation somewhat improved compared to the lows recorded in May 2018. It remained however very close to the breakeven price, implying actual results by power generation asset depended on the specific efficiency rates.
In Q4 2018 markets in Central and Eastern Europe traded at a small premium to the German reference, implying similar, if slightly better levels of profitability as those assessed in Germany
Figure 11– Evolution of clean spark spreads in the UK and Germany, and electricity generation from natural
gas in the EU
14
Source: S&P Global Platts and ENTSO-E
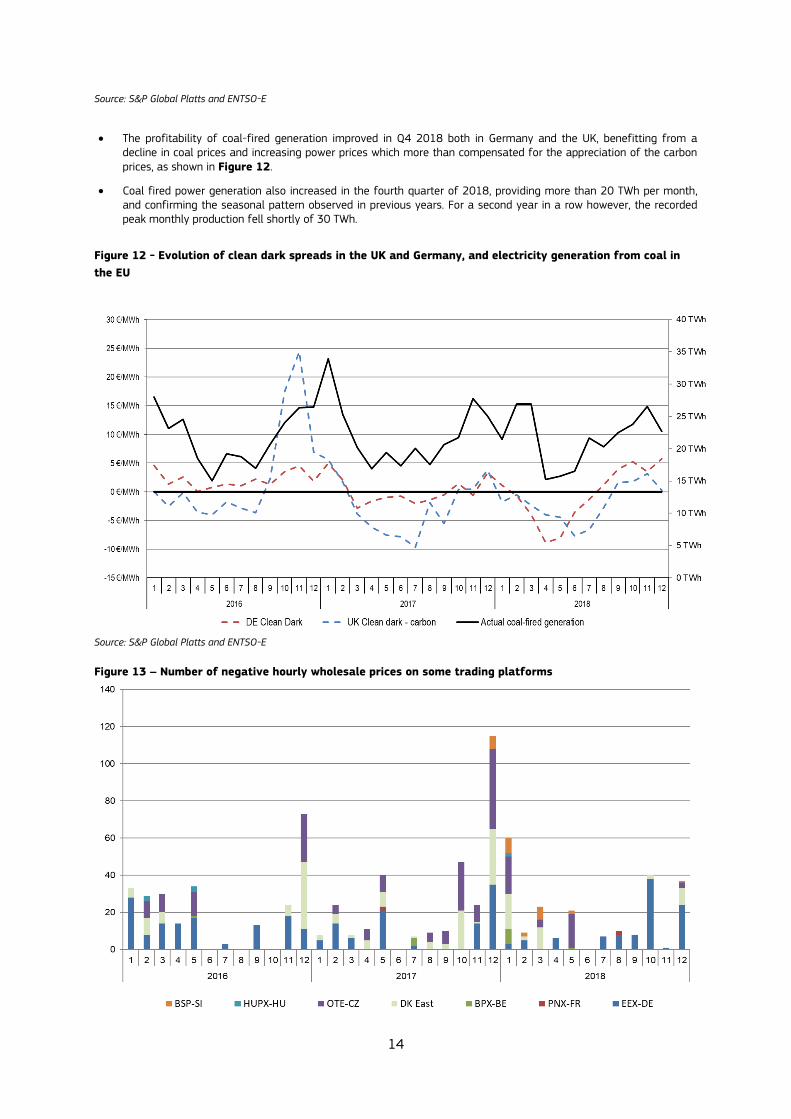
The profitability of coal-fired generation improved in Q4 2018 both in Germany and the UK, benefitting from a decline in coal prices and increasing power prices which more than compensated for the appreciation of the carbon prices, as shown in Figure 12.
Coal fired power generation also increased in the fourth quarter of 2018, providing more than 20 TWh per month, and confirming the seasonal pattern observed in previous years. For a second year in a row however, the recorded peak monthly production fell shortly of 30 TWh.
Figure 12 - Evolution of clean dark spreads in the UK and Germany, and electricity generation from coal in
the EU
Source: S&P Global Platts and ENTSO-E
Figure 13 – Number of negative hourly wholesale prices on some trading platforms
15
Source: Platts, European wholesale electricity markets
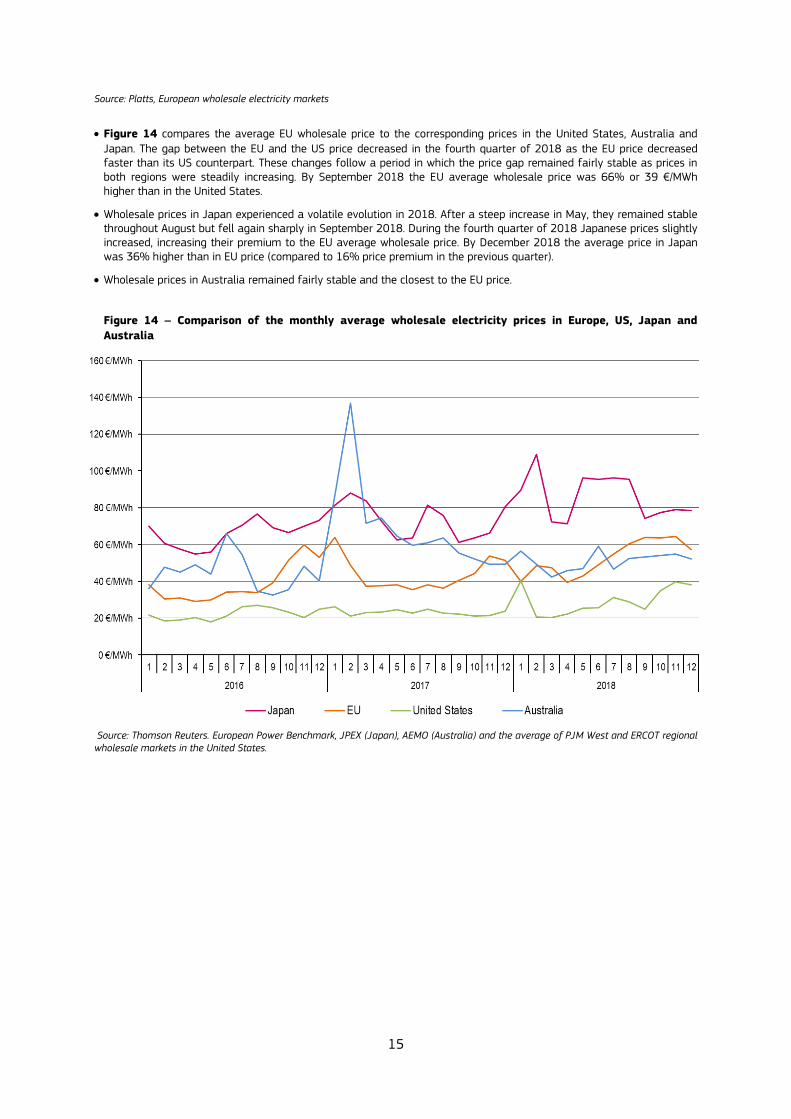
Figure 14 compares the average EU wholesale price to the corresponding prices in the United States, Australia and
Japan. The gap between the EU and the US price decreased in the fourth quarter of 2018 as the EU price decreased faster than its US counterpart. These changes follow a period in which the price gap remained fairly stable as prices in both regions were steadily increasing. By September 2018 the EU average wholesale price was 66% or 39 €/MWh higher than in the United States.
Wholesale prices in Japan experienced a volatile evolution in 2018. After a steep increase in May, they remained stable throughout August but fell again sharply in September 2018. During the fourth quarter of 2018 Japanese prices slightly increased, increasing their premium to the EU average wholesale price. By December 2018 the average price in Japan was 36% higher than in EU price (compared to 16% price premium in the previous quarter).
Wholesale prices in Australia remained fairly stable and the closest to the EU price.
Figure 14 – Comparison of the monthly average wholesale electricity prices in Europe, US, Japan and
Australia
Source: Thomson Reuters. European Power Benchmark, JPEX (Japan), AEMO (Australia) and the average of PJM West and ERCOT regional wholesale markets in the United States.
16
2.2 Traded volumes and cross border flows
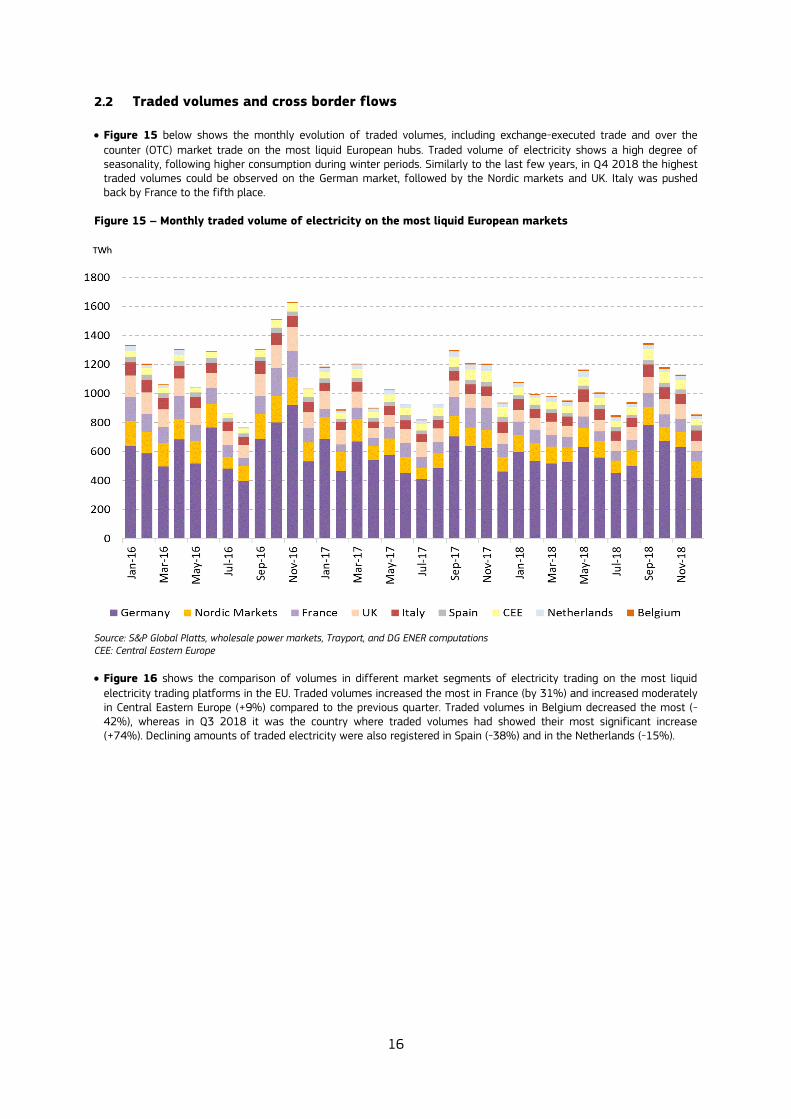
Figure 15 below shows the monthly evolution of traded volumes, including exchange-executed trade and over the
counter (OTC) market trade on the most liquid European hubs. Traded volume of electricity shows a high degree of seasonality, following higher consumption during winter periods. Similarly to the last few years, in Q4 2018 the highest traded volumes could be observed on the German market, followed by the Nordic markets and UK. Italy was pushed back by France to the fifth place.
Figure 15 – Monthly traded volume of electricity on the most liquid European markets
Source: S&P Global Platts, wholesale power markets, Trayport, and DG ENER computations CEE: Central Eastern Europe
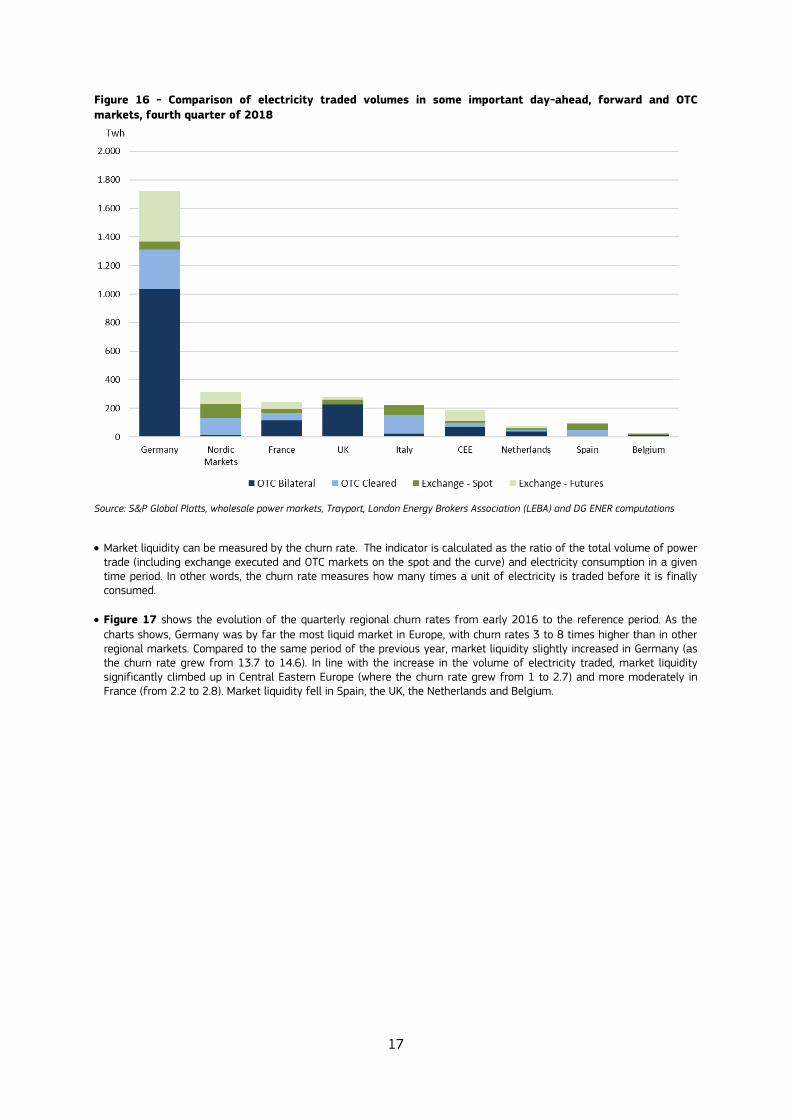
Figure 16 shows the comparison of volumes in different market segments of electricity trading on the most liquid
electricity trading platforms in the EU. Traded volumes increased the most in France (by 31%) and increased moderately in Central Eastern Europe (+9%) compared to the previous quarter. Traded volumes in Belgium decreased the most (-42%), whereas in Q3 2018 it was the country where traded volumes had showed their most significant increase (+74%). Declining amounts of traded electricity were also registered in Spain (-38%) and in the Netherlands (-15%).
17
Figure 16 - Comparison of electricity traded volumes in some important day-ahead, forward and OTC
markets, fourth quarter of 2018
Source: S&P Global Platts, wholesale power markets, Trayport, London Energy Brokers Association (LEBA) and DG ENER computations
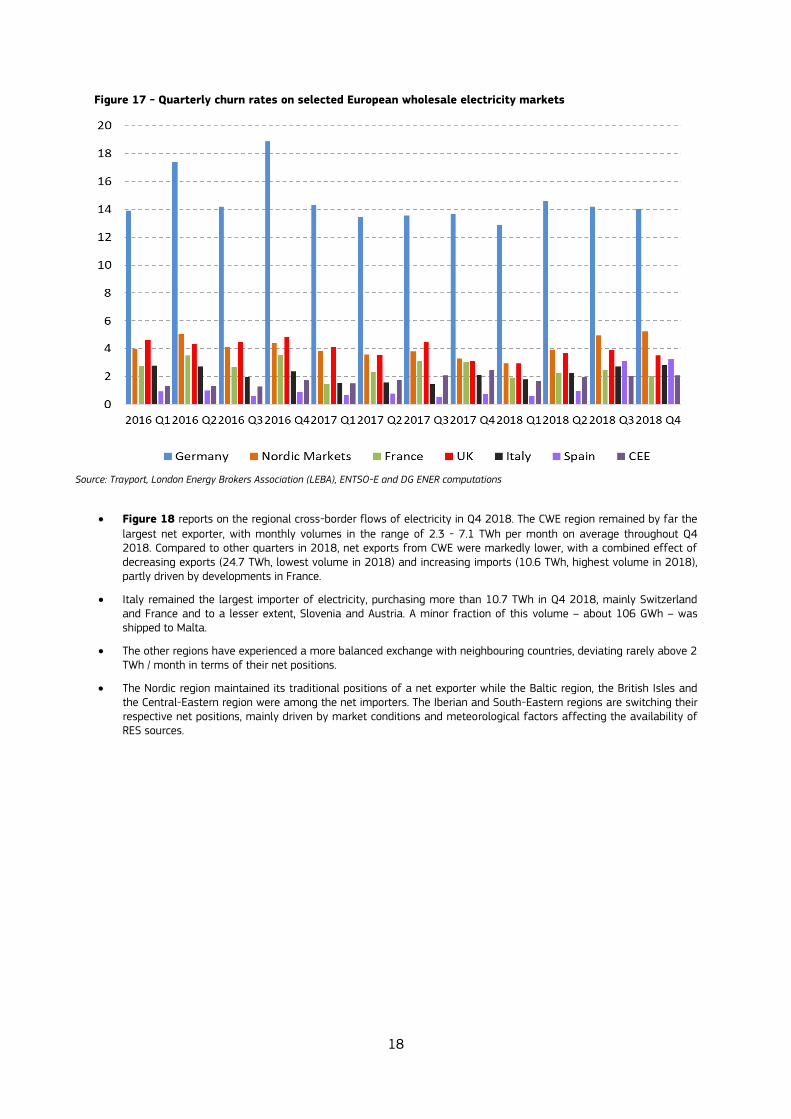
Market liquidity can be measured by the churn rate. The indicator is calculated as the ratio of the total volume of power trade (including exchange executed and OTC markets on the spot and the curve) and electricity consumption in a given time period. In other words, the churn rate measures how many times a unit of electricity is traded before it is finally consumed.
Figure 17 shows the evolution of the quarterly regional churn rates from early 2016 to the reference period. As the
charts shows, Germany was by far the most liquid market in Europe, with churn rates 3 to 8 times higher than in other regional markets. Compared to the same period of the previous year, market liquidity slightly increased in Germany (as the churn rate grew from 13.7 to 14.6). In line with the increase in the volume of electricity traded, market liquidity significantly climbed up in Central Eastern Europe (where the churn rate grew from 1 to 2.7) and more moderately in France (from 2.2 to 2.8). Market liquidity fell in Spain, the UK, the Netherlands and Belgium.
18
Figure 17 - Quarterly churn rates on selected European wholesale electricity markets
Source: Trayport, London Energy Brokers Association (LEBA), ENTSO-E and DG ENER computations
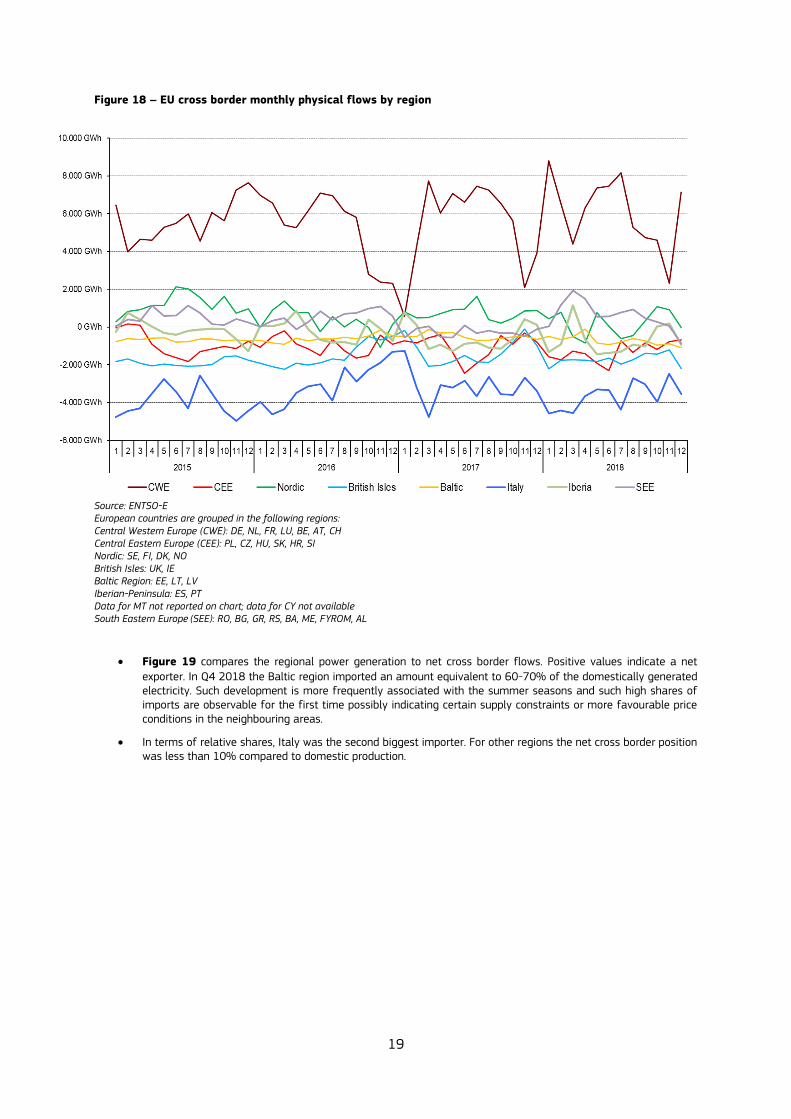
Figure 18 reports on the regional cross-border flows of electricity in Q4 2018. The CWE region remained by far the
largest net exporter, with monthly volumes in the range of 2.3 - 7.1 TWh per month on average throughout Q4 2018. Compared to other quarters in 2018, net exports from CWE were markedly lower, with a combined effect of decreasing exports (24.7 TWh, lowest volume in 2018) and increasing imports (10.6 TWh, highest volume in 2018), partly driven by developments in France.
Italy remained the largest importer of electricity, purchasing more than 10.7 TWh in Q4 2018, mainly Switzerland and France and to a lesser extent, Slovenia and Austria. A minor fraction of this volume – about 106 GWh – was shipped to Malta.
The other regions have experienced a more balanced exchange with neighbouring countries, deviating rarely above 2 TWh / month in terms of their net positions.
The Nordic region maintained its traditional positions of a net exporter while the Baltic region, the British Isles and the Central-Eastern region were among the net importers. The Iberian and South-Eastern regions are switching their respective net positions, mainly driven by market conditions and meteorological factors affecting the availability of RES sources.
19
Figure 18 – EU cross border monthly physical flows by region
Source: ENTSO-E European countries are grouped in the following regions: Central Western Europe (CWE): DE, NL, FR, LU, BE, AT, CH Central Eastern Europe (CEE): PL, CZ, HU, SK, HR, SI Nordic: SE, FI, DK, NO British Isles: UK, IE Baltic Region: EE, LT, LV Iberian-Peninsula: ES, PT Data for MT not reported on chart; data for CY not available South Eastern Europe (SEE): RO, BG, GR, RS, BA, ME, FYROM, AL
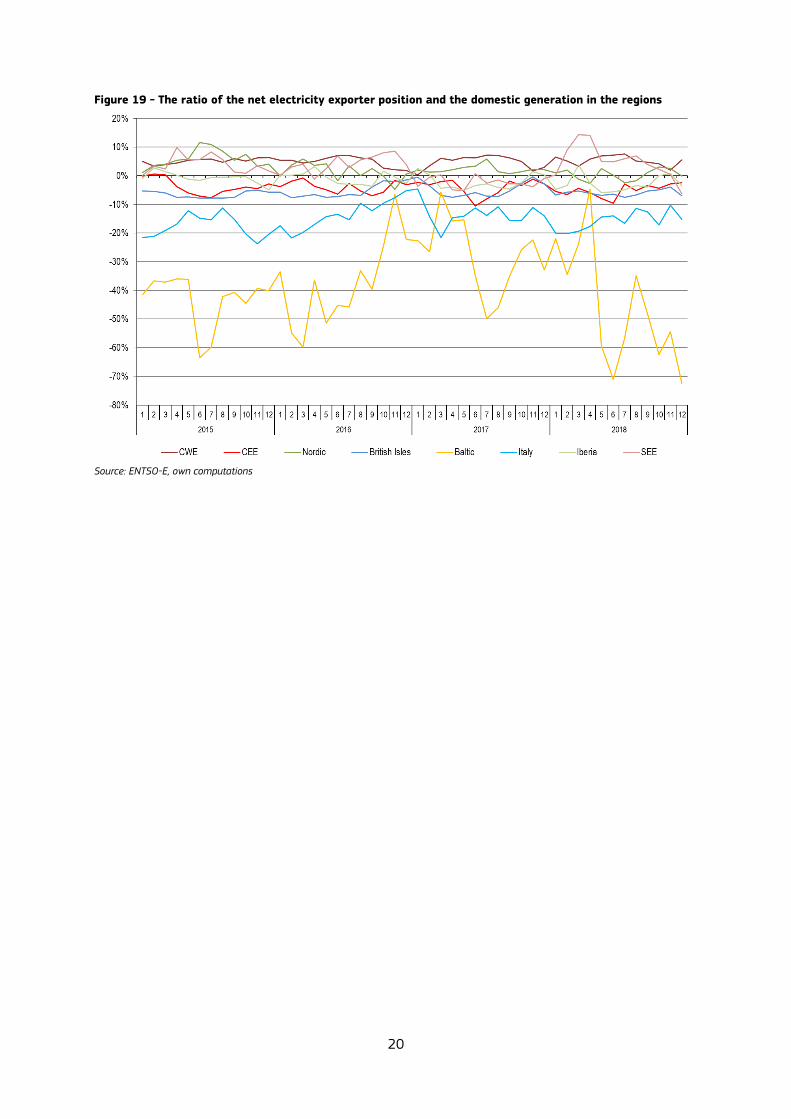
Figure 19 compares the regional power generation to net cross border flows. Positive values indicate a net
exporter. In Q4 2018 the Baltic region imported an amount equivalent to 60-70% of the domestically generated electricity. Such development is more frequently associated with the summer seasons and such high shares of imports are observable for the first time possibly indicating certain supply constraints or more favourable price conditions in the neighbouring areas.
In terms of relative shares, Italy was the second biggest importer. For other regions the net cross border position was less than 10% compared to domestic production.
20
Figure 19 - The ratio of the net electricity exporter position and the domestic generation in the regions
Source: ENTSO-E, own computations
21
3 Regional wholesale markets
3.1 Central Western Europe (Austria, Belgium, France, Germany, the Netherlands,
Switzerland)
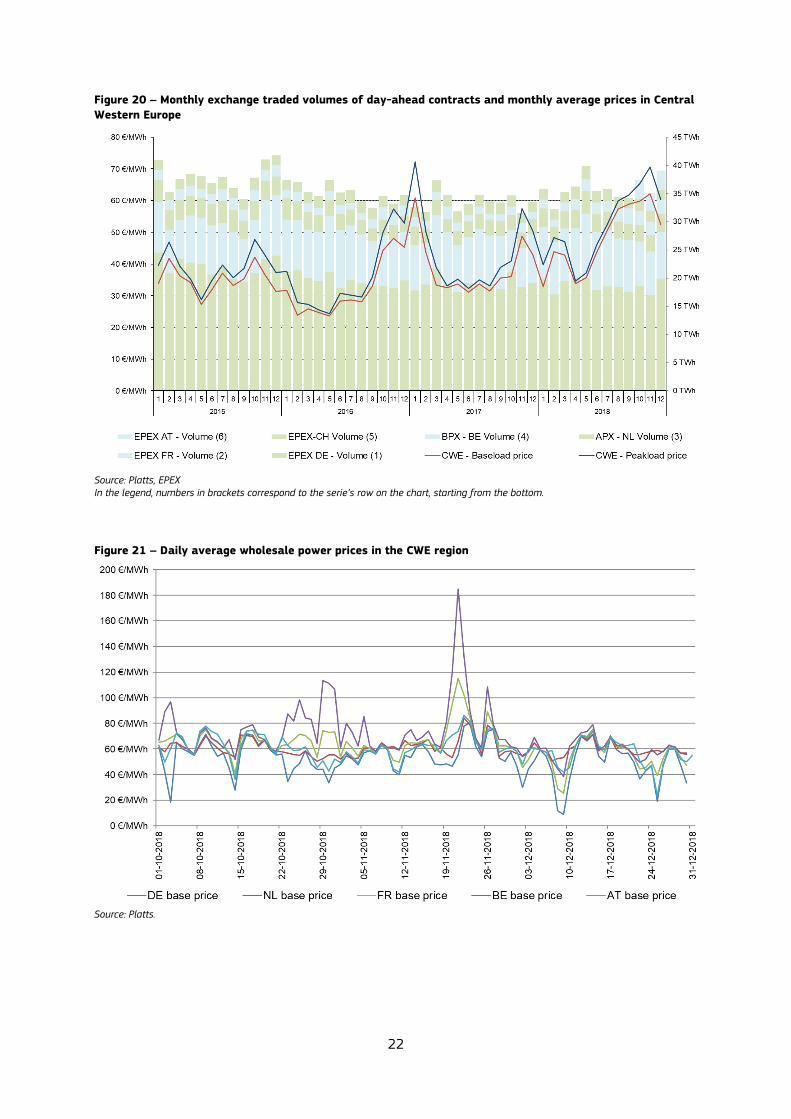
In Q4 of 2018 the monthly average wholesale baseload electricity prices in the CWE region increased compared to Q3 2018. This pattern is also visible in Figure 20 for the previous years. In November 2018, the monthly average
wholesale baseload electricity price reached with 62 €/MWh a three-years high. However, after this peak the average baseload electricity price decreased to 52 €/MWh in December 2018. Accordingly, the monthly average wholesale peakload electricity price peaked with 71 €/MWh in November and fell back to 60 €/MWh in December 2018.
The daily average wholesale electricity prices within the CWE region varies considerably in Q4 2018 as shown in Figure 21. Strong volatility is visible for the Belgium market where daily baseload price vary from 39 €/MWh to 185 €/MWh. The French daily wholesale electricity baseload price ranges from 25 €/MWh to 115 €/MWh and the German daily baseload price between 9 €/MWh and 80 €/MWh. Whereas, for the Netherlands the daily baseload price stays between 51 €/MWh and 84 €/MWh and is subject to little volatility compared to the rest of the CWE region.
In October 2018, the joined wholesale price zone of Austria and Germany was separated. The measure was taken in order to facilitate the operation of the TSOs. The traded montly volume of the Austrian day-ahead market is with 3.3 TWh comparable in size to APX in the Netherlands as Figure 20 shows. Although, the market integration between the
German and Austrian wholesale market continues to be high, price differences are now possible. As visible in Figure
21, the Austrian baseload price was on average 7.32 €/MWh higher compared to the German market. The price
differences ranges from a maximum of +42.11 €/MWh (03.10.2018) to a minimum of -0.02 €/MWh (08.11.2018). However, the average price difference is strongly driven by the volatility at the German market due to low price spikes, which is not passed on to the Austrian market.
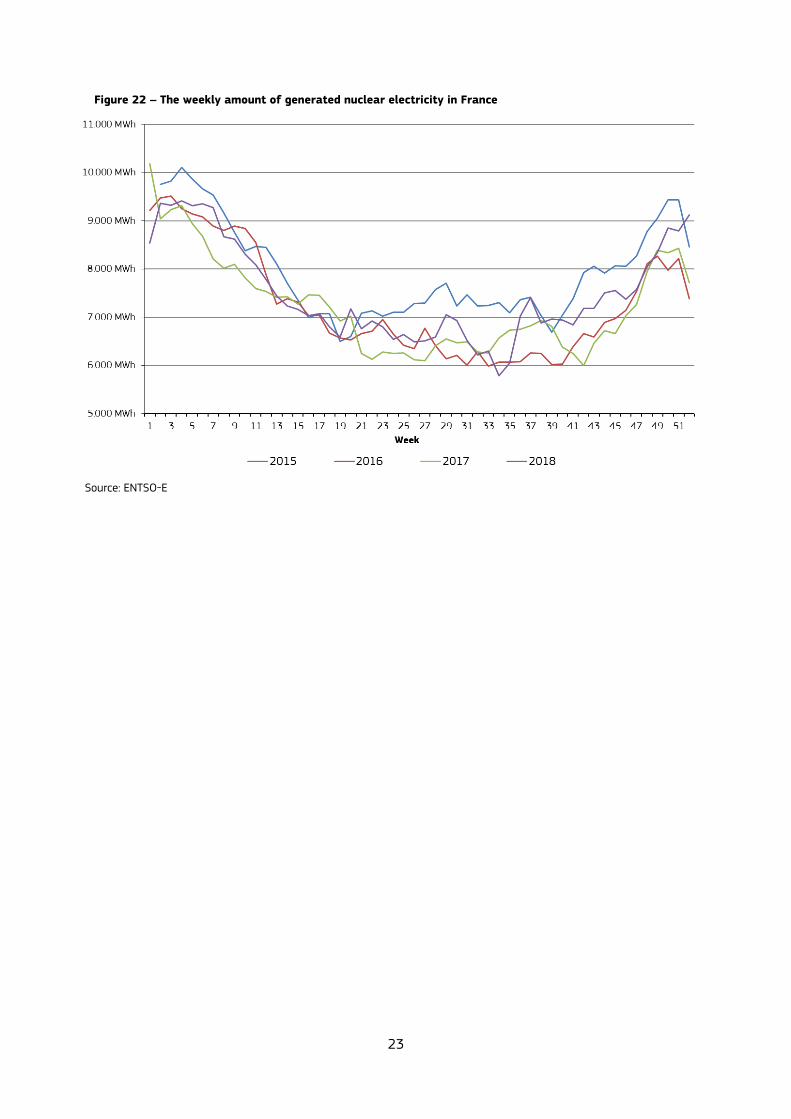
In France the nuclear electricity generation increased strongly in Q4 of 2018 as visible in Figure 22. Compared to Q4
of 2017 the nuclear electricity generation increased by 8.6 %. Starting at the end of 2016 the entire French nuclear power fleet is subject to inspections and intensive maintenance. More power plants were cleared from the inspections by September and November 2018 and thereby more nuclear generation capacity available compared to 2017. However, the inspections are scheduled to continue throughout the first quarter of 2019 and therefore the nuclear electricity generation in Q4 2018 is still 6.1 % below the generation of Q4 2015.
The Belgium market was expected to face serious supply concerns in Q4 2018. Due to ongoing maintanence at the nuclear power stations Doel and Tihange the generation capacity was limited. However, power shortages as feared did not materliaze. The milder weather kept HDD below average and demand moderate during Q4. Moreover, the Belgium market profited from the increased nuclear capacity in France and in general cross-border trade. Nevertheless, the Belgium wholesale price was notebly the highest in the region and subject to several price spikes as shown in Figure 21. On average, the Belgium wholesale price increased in Q4 2018 by 24% compared to Q4 in 2017 and 2016.
22
Figure 20 – Monthly exchange traded volumes of day-ahead contracts and monthly average prices in Central
Western Europe
Source: Platts, EPEX In the legend, numbers in brackets correspond to the serie’s row on the chart, starting from the bottom.
Figure 21 – Daily average wholesale power prices in the CWE region
Source: Platts.
23
Figure 22 – The weekly amount of generated nuclear electricity in France
Source: ENTSO-E
24
3.2 British Isles (UK, Ireland)
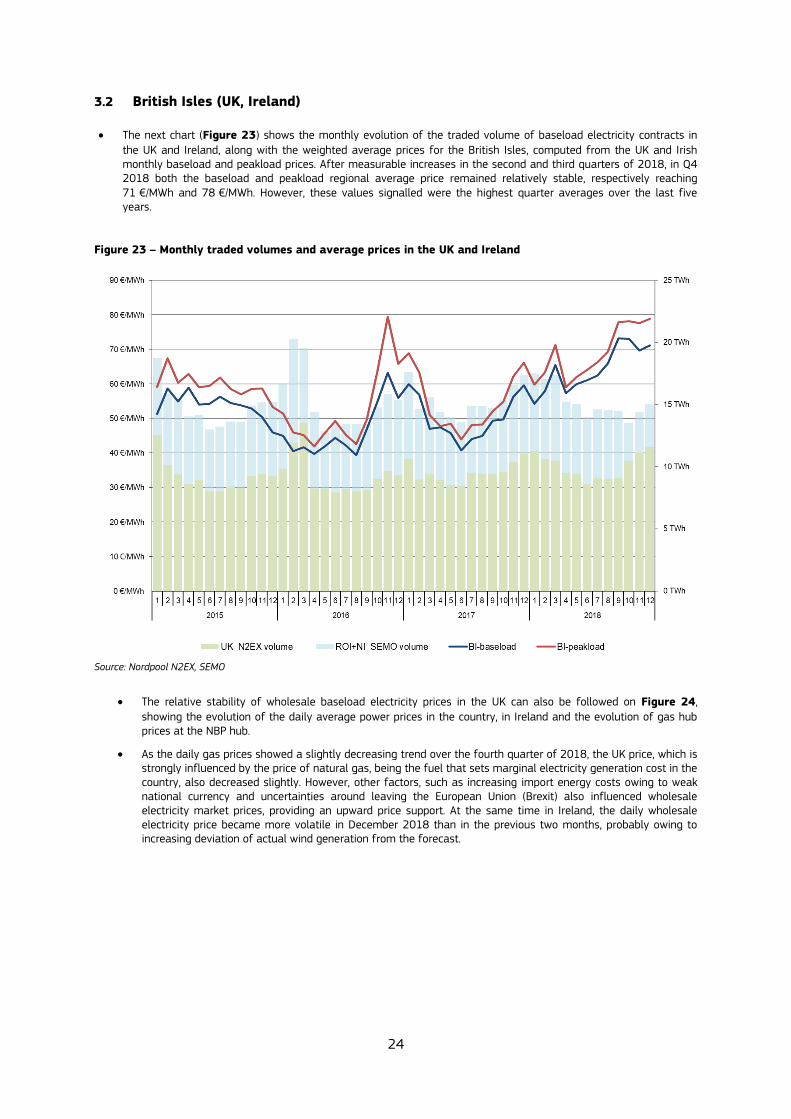
The next chart (Figure 23) shows the monthly evolution of the traded volume of baseload electricity contracts in
the UK and Ireland, along with the weighted average prices for the British Isles, computed from the UK and Irish monthly baseload and peakload prices. After measurable increases in the second and third quarters of 2018, in Q4 2018 both the baseload and peakload regional average price remained relatively stable, respectively reaching 71 €/MWh and 78 €/MWh. However, these values signalled were the highest quarter averages over the last five years.
Figure 23 – Monthly traded volumes and average prices in the UK and Ireland
Source: Nordpool N2EX, SEMO
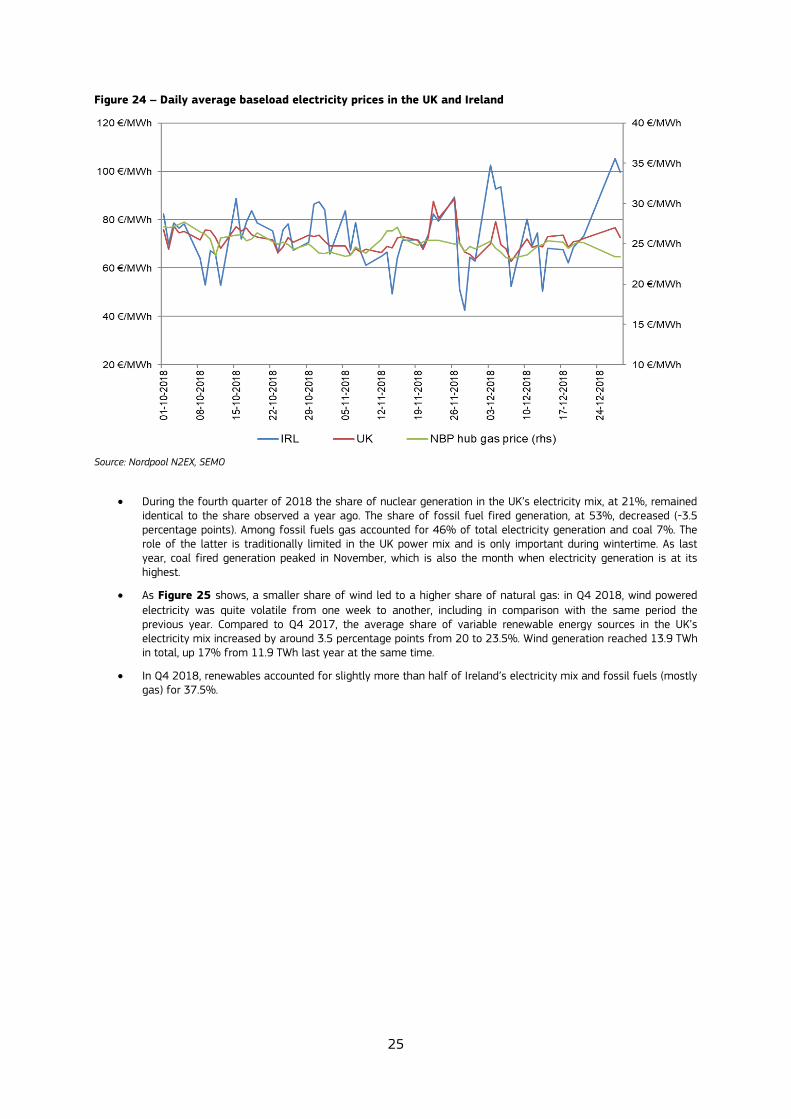
The relative stability of wholesale baseload electricity prices in the UK can also be followed on Figure 24,
showing the evolution of the daily average power prices in the country, in Ireland and the evolution of gas hub prices at the NBP hub.
As the daily gas prices showed a slightly decreasing trend over the fourth quarter of 2018, the UK price, which is strongly influenced by the price of natural gas, being the fuel that sets marginal electricity generation cost in the country, also decreased slightly. However, other factors, such as increasing import energy costs owing to weak national currency and uncertainties around leaving the European Union (Brexit) also influenced wholesale electricity market prices, providing an upward price support. At the same time in Ireland, the daily wholesale electricity price became more volatile in December 2018 than in the previous two months, probably owing to increasing deviation of actual wind generation from the forecast.
25
Figure 24 – Daily average baseload electricity prices in the UK and Ireland
Source: Nordpool N2EX, SEMO
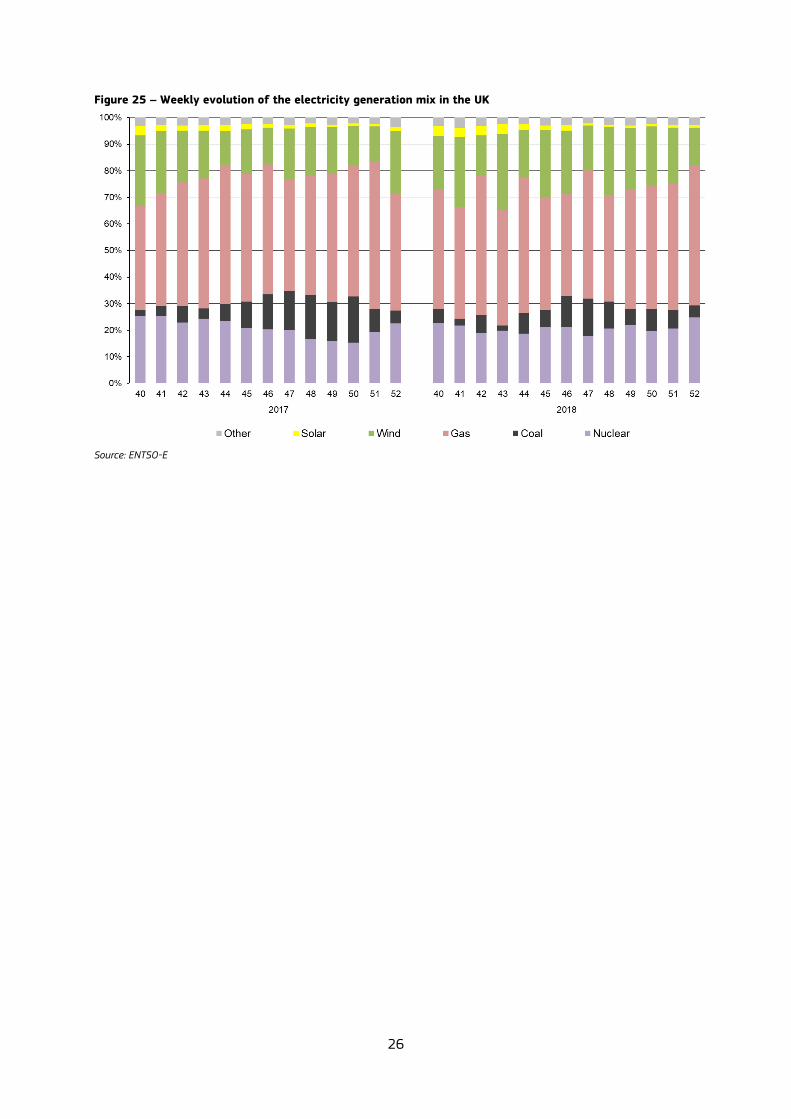
During the fourth quarter of 2018 the share of nuclear generation in the UK’s electricity mix, at 21%, remained identical to the share observed a year ago. The share of fossil fuel fired generation, at 53%, decreased (-3.5 percentage points). Among fossil fuels gas accounted for 46% of total electricity generation and coal 7%. The role of the latter is traditionally limited in the UK power mix and is only important during wintertime. As last year, coal fired generation peaked in November, which is also the month when electricity generation is at its highest.
As Figure 25 shows, a smaller share of wind led to a higher share of natural gas: in Q4 2018, wind powered
electricity was quite volatile from one week to another, including in comparison with the same period the previous year. Compared to Q4 2017, the average share of variable renewable energy sources in the UK’s electricity mix increased by around 3.5 percentage points from 20 to 23.5%. Wind generation reached 13.9 TWh in total, up 17% from 11.9 TWh last year at the same time.
In Q4 2018, renewables accounted for slightly more than half of Ireland’s electricity mix and fossil fuels (mostly gas) for 37.5%.
26
Figure 25 – Weekly evolution of the electricity generation mix in the UK
Source: ENTSO-E
27
3.3 Northern Europe (Denmark, Estonia, Finland, Latvia, Lithuania, Norway, Sweden)
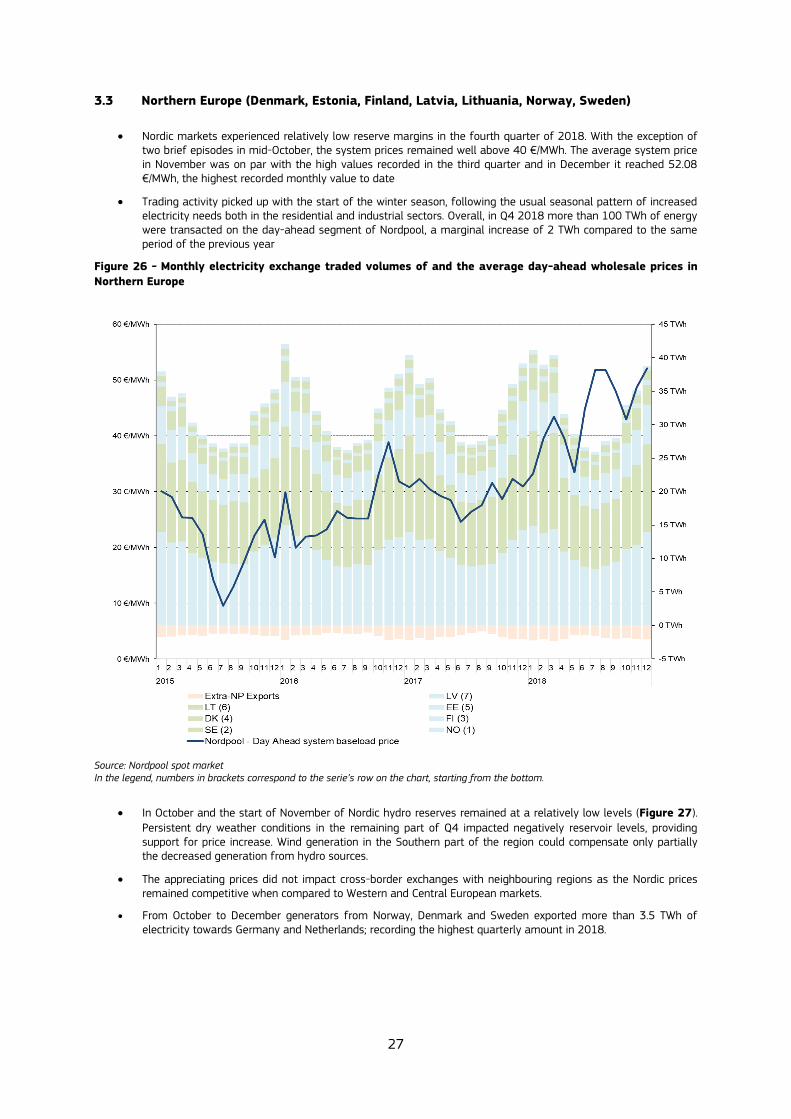
Nordic markets experienced relatively low reserve margins in the fourth quarter of 2018. With the exception of two brief episodes in mid-October, the system prices remained well above 40 €/MWh. The average system price in November was on par with the high values recorded in the third quarter and in December it reached 52.08 €/MWh, the highest recorded monthly value to date
Trading activity picked up with the start of the winter season, following the usual seasonal pattern of increased electricity needs both in the residential and industrial sectors. Overall, in Q4 2018 more than 100 TWh of energy were transacted on the day-ahead segment of Nordpool, a marginal increase of 2 TWh compared to the same period of the previous year
Figure 26 - Monthly electricity exchange traded volumes of and the average day-ahead wholesale prices in
Northern Europe
Source: Nordpool spot market In the legend, numbers in brackets correspond to the serie’s row on the chart, starting from the bottom.
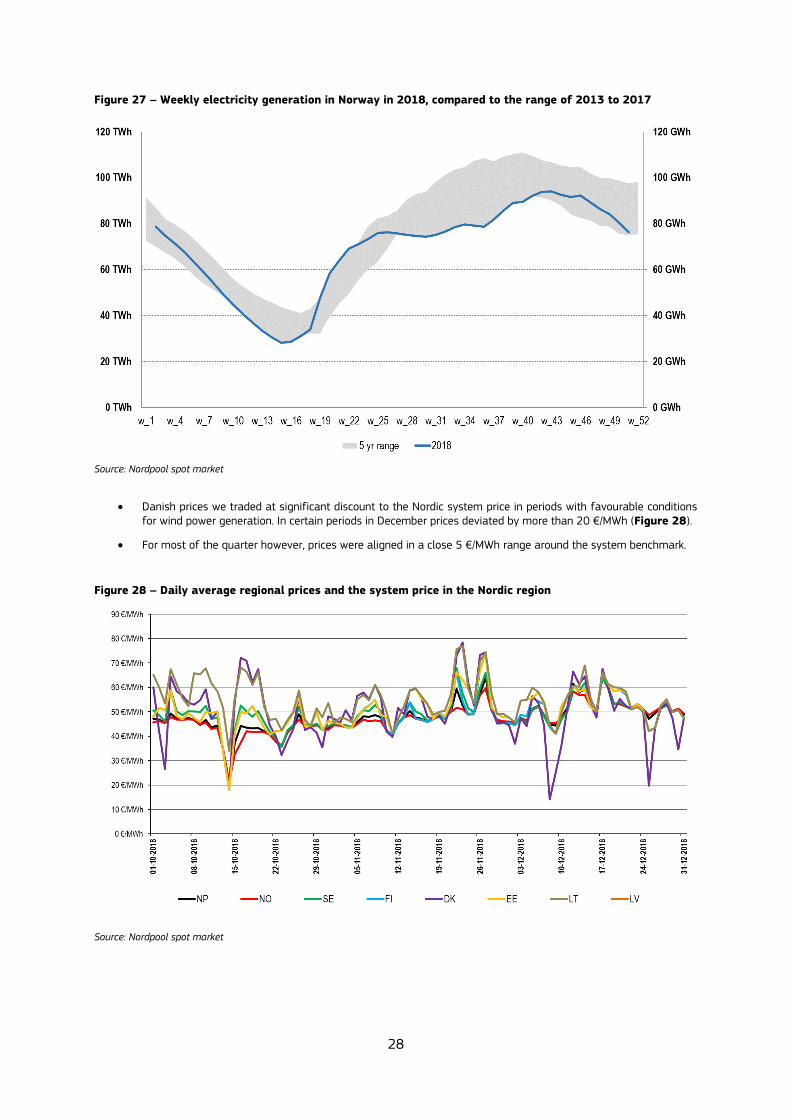
In October and the start of November of Nordic hydro reserves remained at a relatively low levels (Figure 27).
Persistent dry weather conditions in the remaining part of Q4 impacted negatively reservoir levels, providing support for price increase. Wind generation in the Southern part of the region could compensate only partially the decreased generation from hydro sources.
The appreciating prices did not impact cross-border exchanges with neighbouring regions as the Nordic prices remained competitive when compared to Western and Central European markets.
From October to December generators from Norway, Denmark and Sweden exported more than 3.5 TWh of electricity towards Germany and Netherlands; recording the highest quarterly amount in 2018.
28
Figure 27 – Weekly electricity generation in Norway in 2018, compared to the range of 2013 to 2017
Source: Nordpool spot market
Danish prices we traded at significant discount to the Nordic system price in periods with favourable conditions for wind power generation. In certain periods in December prices deviated by more than 20 €/MWh (Figure 28).
For most of the quarter however, prices were aligned in a close 5 €/MWh range around the system benchmark.
Figure 28 – Daily average regional prices and the system price in the Nordic region
Source: Nordpool spot market
29
3.4 Apennine Peninsula (Italy)
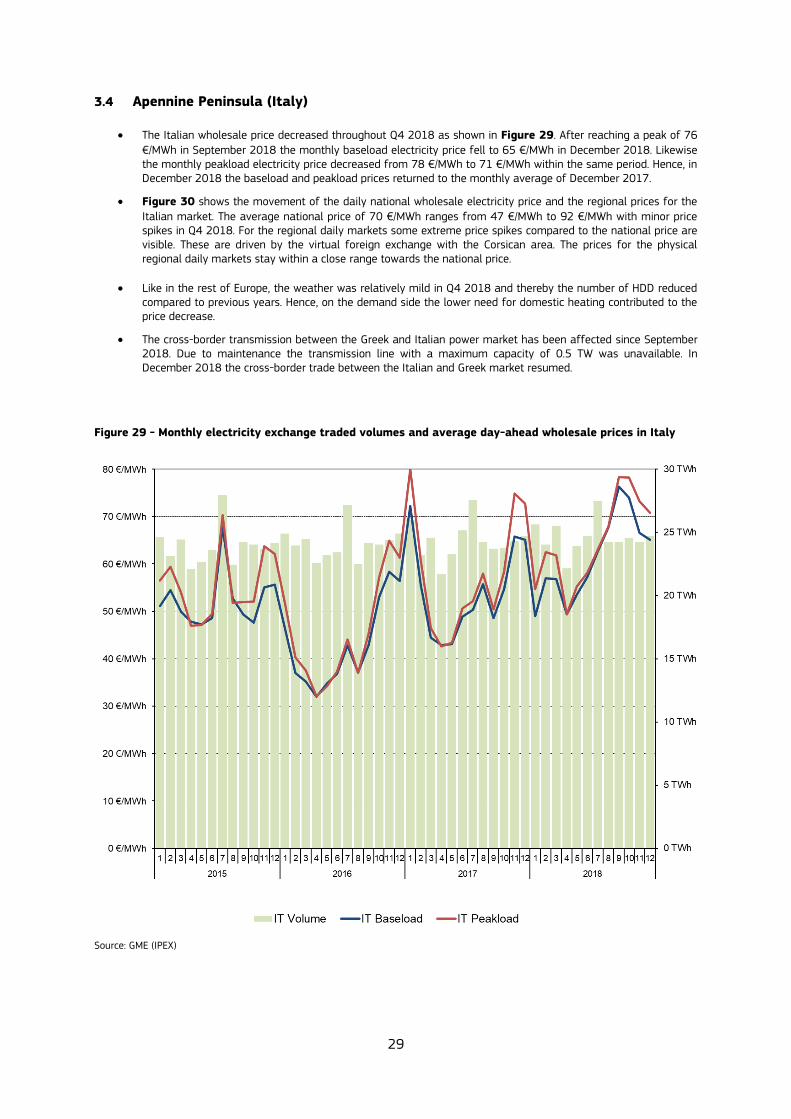
The Italian wholesale price decreased throughout Q4 2018 as shown in Figure 29. After reaching a peak of 76
€/MWh in September 2018 the monthly baseload electricity price fell to 65 €/MWh in December 2018. Likewise the monthly peakload electricity price decreased from 78 €/MWh to 71 €/MWh within the same period. Hence, in December 2018 the baseload and peakload prices returned to the monthly average of December 2017.
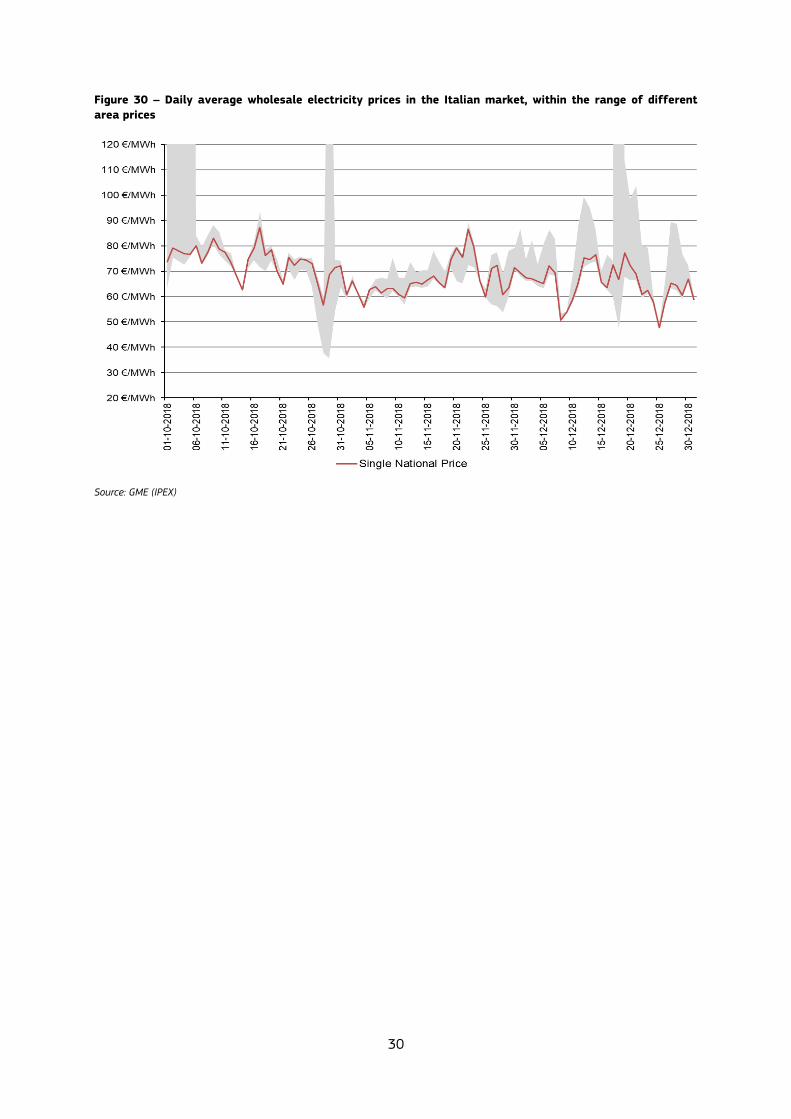
Figure 30 shows the movement of the daily national wholesale electricity price and the regional prices for the
Italian market. The average national price of 70 €/MWh ranges from 47 €/MWh to 92 €/MWh with minor price spikes in Q4 2018. For the regional daily markets some extreme price spikes compared to the national price are visible. These are driven by the virtual foreign exchange with the Corsican area. The prices for the physical regional daily markets stay within a close range towards the national price.
Like in the rest of Europe, the weather was relatively mild in Q4 2018 and thereby the number of HDD reduced compared to previous years. Hence, on the demand side the lower need for domestic heating contributed to the price decrease.
The cross-border transmission between the Greek and Italian power market has been affected since September 2018. Due to maintenance the transmission line with a maximum capacity of 0.5 TW was unavailable. In December 2018 the cross-border trade between the Italian and Greek market resumed.
Figure 29 - Monthly electricity exchange traded volumes and average day-ahead wholesale prices in Italy
Source: GME (IPEX)
30
Figure 30 – Daily average wholesale electricity prices in the Italian market, within the range of different
area prices
Source: GME (IPEX)
31
3.5 Iberian Peninsula (Spain and Portugal)
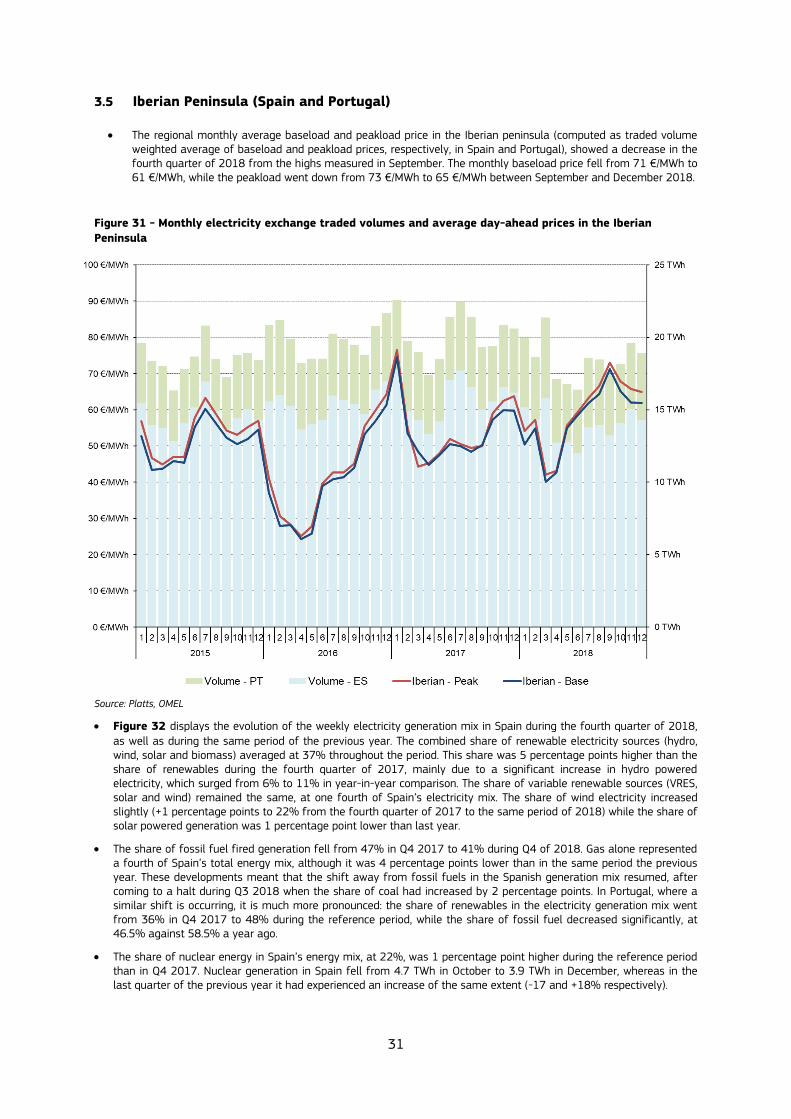
The regional monthly average baseload and peakload price in the Iberian peninsula (computed as traded volume weighted average of baseload and peakload prices, respectively, in Spain and Portugal), showed a decrease in the fourth quarter of 2018 from the highs measured in September. The monthly baseload price fell from 71 €/MWh to 61 €/MWh, while the peakload went down from 73 €/MWh to 65 €/MWh between September and December 2018.
Figure 31 - Monthly electricity exchange traded volumes and average day-ahead prices in the Iberian
Peninsula
Source: Platts, OMEL
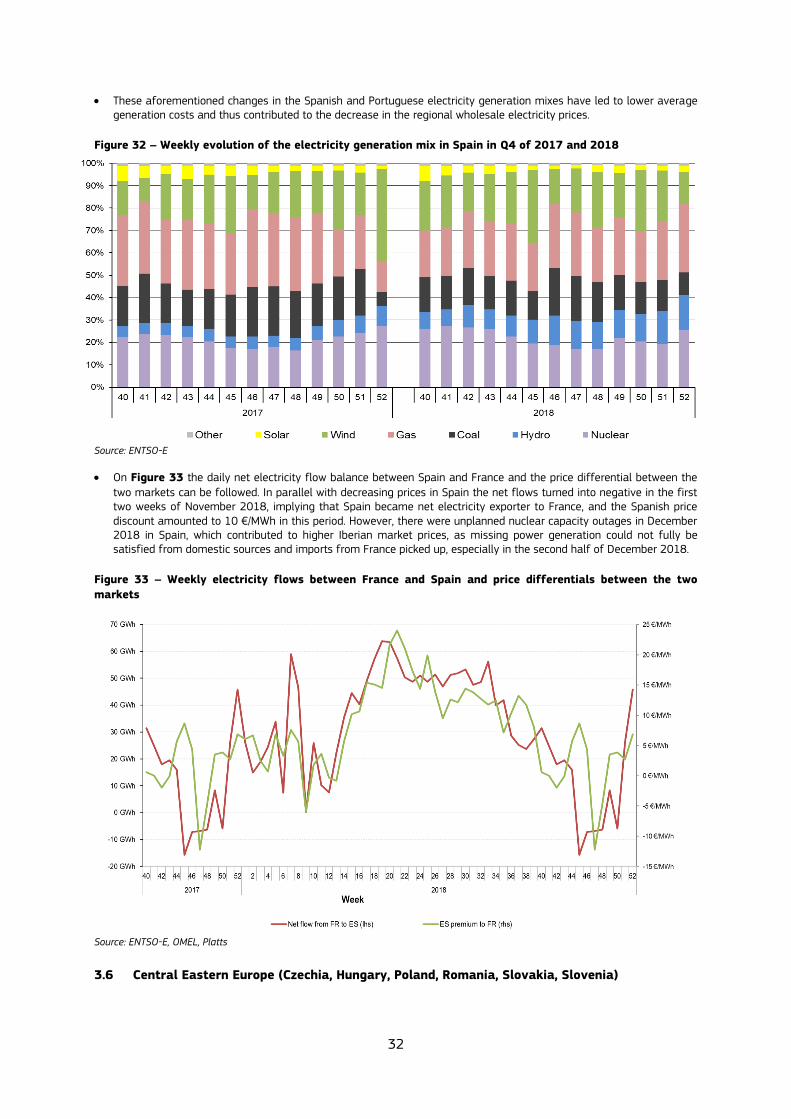
Figure 32 displays the evolution of the weekly electricity generation mix in Spain during the fourth quarter of 2018, as well as during the same period of the previous year. The combined share of renewable electricity sources (hydro, wind, solar and biomass) averaged at 37% throughout the period. This share was 5 percentage points higher than the share of renewables during the fourth quarter of 2017, mainly due to a significant increase in hydro powered electricity, which surged from 6% to 11% in year-in-year comparison. The share of variable renewable sources (VRES, solar and wind) remained the same, at one fourth of Spain’s electricity mix. The share of wind electricity increased slightly (+1 percentage points to 22% from the fourth quarter of 2017 to the same period of 2018) while the share of solar powered generation was 1 percentage point lower than last year.
The share of fossil fuel fired generation fell from 47% in Q4 2017 to 41% during Q4 of 2018. Gas alone represented a fourth of Spain’s total energy mix, although it was 4 percentage points lower than in the same period the previous year. These developments meant that the shift away from fossil fuels in the Spanish generation mix resumed, after coming to a halt during Q3 2018 when the share of coal had increased by 2 percentage points. In Portugal, where a similar shift is occurring, it is much more pronounced: the share of renewables in the electricity generation mix went from 36% in Q4 2017 to 48% during the reference period, while the share of fossil fuel decreased significantly, at 46.5% against 58.5% a year ago.
The share of nuclear energy in Spain’s energy mix, at 22%, was 1 percentage point higher during the reference period than in Q4 2017. Nuclear generation in Spain fell from 4.7 TWh in October to 3.9 TWh in December, whereas in the last quarter of the previous year it had experienced an increase of the same extent (-17 and +18% respectively).
32
These aforementioned changes in the Spanish and Portuguese electricity generation mixes have led to lower average generation costs and thus contributed to the decrease in the regional wholesale electricity prices.
Figure 32 – Weekly evolution of the electricity generation mix in Spain in Q4 of 2017 and 2018
Source: ENTSO-E
On Figure 33 the daily net electricity flow balance between Spain and France and the price differential between the
two markets can be followed. In parallel with decreasing prices in Spain the net flows turned into negative in the first two weeks of November 2018, implying that Spain became net electricity exporter to France, and the Spanish price discount amounted to 10 €/MWh in this period. However, there were unplanned nuclear capacity outages in December 2018 in Spain, which contributed to higher Iberian market prices, as missing power generation could not fully be satisfied from domestic sources and imports from France picked up, especially in the second half of December 2018.
Figure 33 – Weekly electricity flows between France and Spain and price differentials between the two
markets
Source: ENTSO-E, OMEL, Platts
3.6 Central Eastern Europe (Czechia, Hungary, Poland, Romania, Slovakia, Slovenia)
33
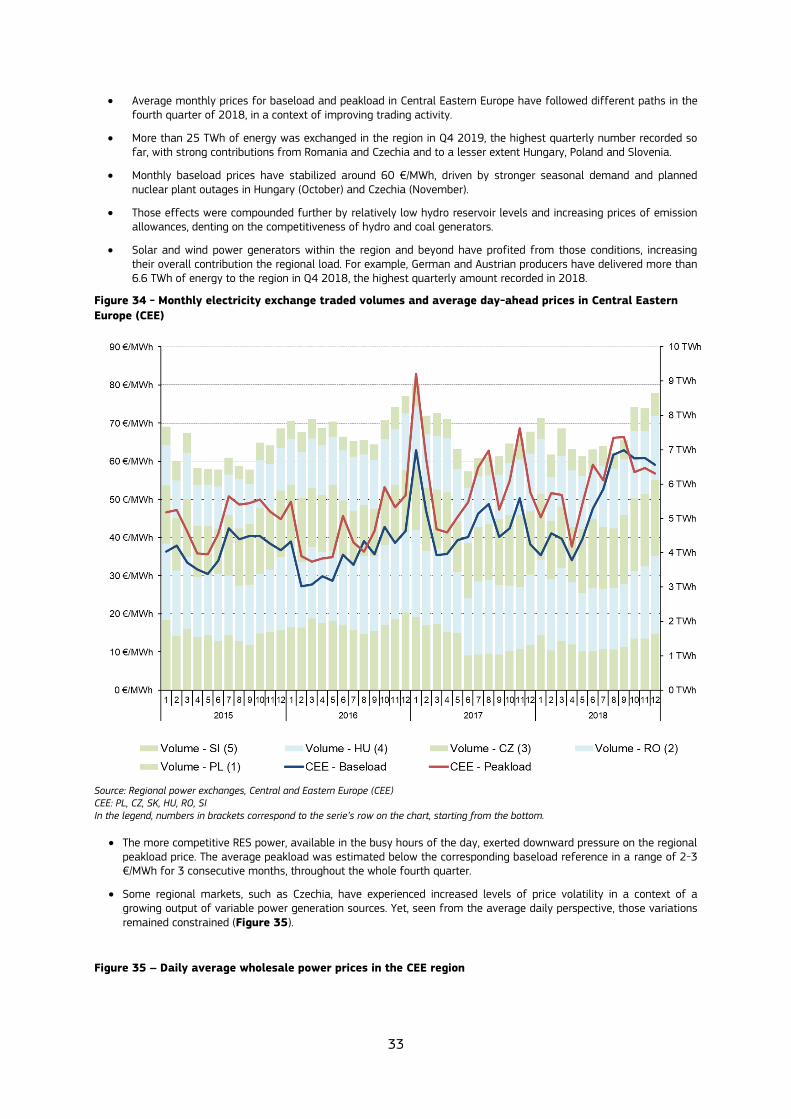
Average monthly prices for baseload and peakload in Central Eastern Europe have followed different paths in the fourth quarter of 2018, in a context of improving trading activity.
More than 25 TWh of energy was exchanged in the region in Q4 2019, the highest quarterly number recorded so far, with strong contributions from Romania and Czechia and to a lesser extent Hungary, Poland and Slovenia.
Monthly baseload prices have stabilized around 60 €/MWh, driven by stronger seasonal demand and planned nuclear plant outages in Hungary (October) and Czechia (November).
Those effects were compounded further by relatively low hydro reservoir levels and increasing prices of emission allowances, denting on the competitiveness of hydro and coal generators.
Solar and wind power generators within the region and beyond have profited from those conditions, increasing their overall contribution the regional load. For example, German and Austrian producers have delivered more than 6.6 TWh of energy to the region in Q4 2018, the highest quarterly amount recorded in 2018.
Figure 34 - Monthly electricity exchange traded volumes and average day-ahead prices in Central Eastern
Europe (CEE)
Source: Regional power exchanges, Central and Eastern Europe (CEE) CEE: PL, CZ, SK, HU, RO, SI In the legend, numbers in brackets correspond to the serie’s row on the chart, starting from the bottom.
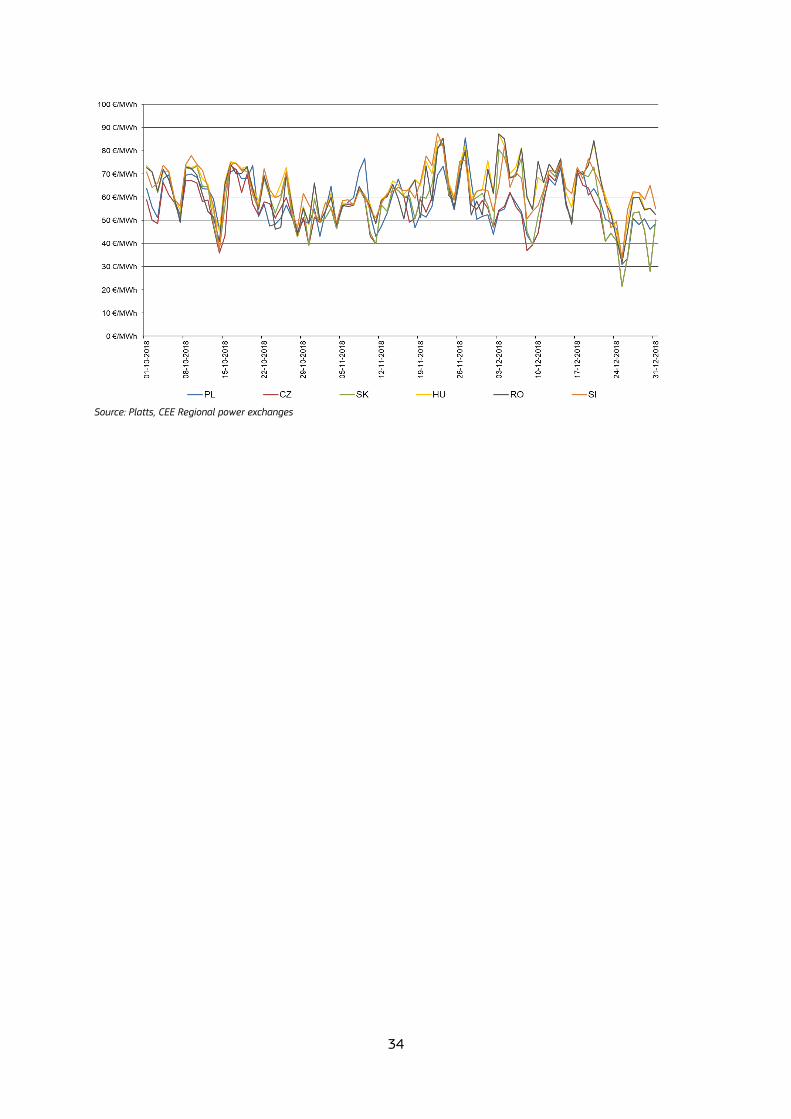
The more competitive RES power, available in the busy hours of the day, exerted downward pressure on the regional peakload price. The average peakload was estimated below the corresponding baseload reference in a range of 2-3 €/MWh for 3 consecutive months, throughout the whole fourth quarter.
Some regional markets, such as Czechia, have experienced increased levels of price volatility in a context of a growing output of variable power generation sources. Yet, seen from the average daily perspective, those variations remained constrained (Figure 35).
Figure 35 – Daily average wholesale power prices in the CEE region
34
Source: Platts, CEE Regional power exchanges
35
3.7 South Eastern Europe (Bulgaria, Croatia, Greece and Serbia)
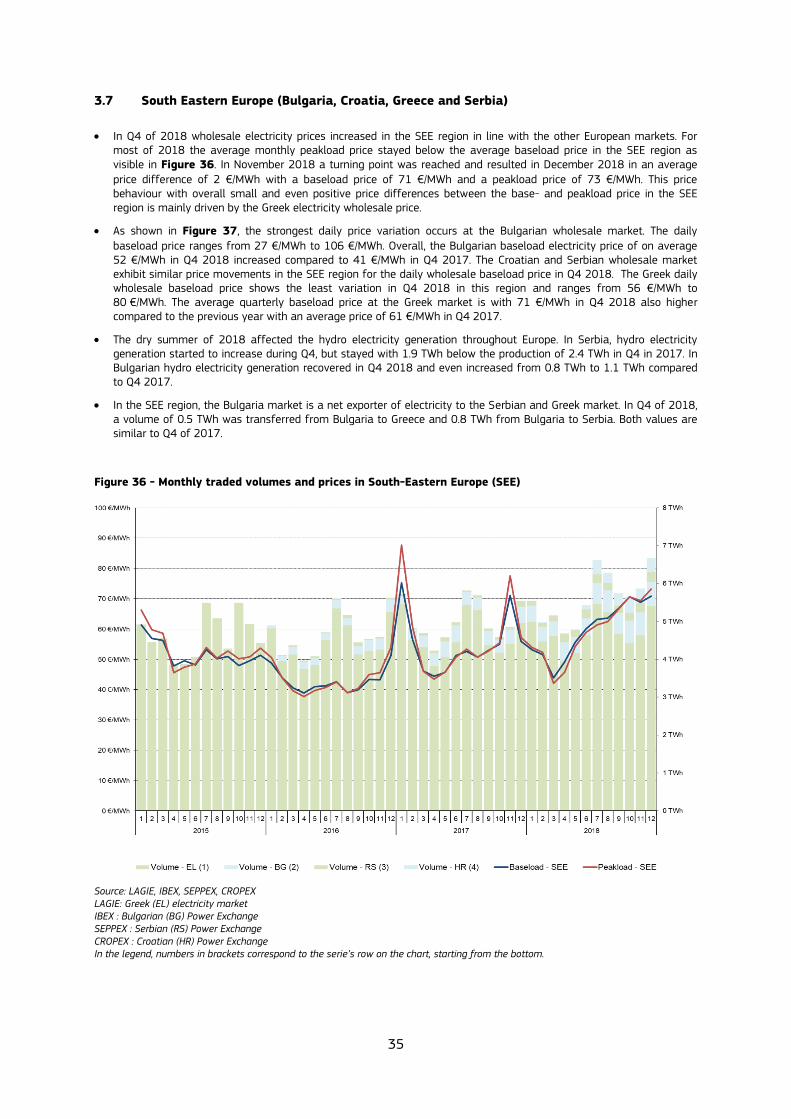
In Q4 of 2018 wholesale electricity prices increased in the SEE region in line with the other European markets. For most of 2018 the average monthly peakload price stayed below the average baseload price in the SEE region as visible in Figure 36. In November 2018 a turning point was reached and resulted in December 2018 in an average price difference of 2 €/MWh with a baseload price of 71 €/MWh and a peakload price of 73 €/MWh. This price behaviour with overall small and even positive price differences between the base- and peakload price in the SEE region is mainly driven by the Greek electricity wholesale price.
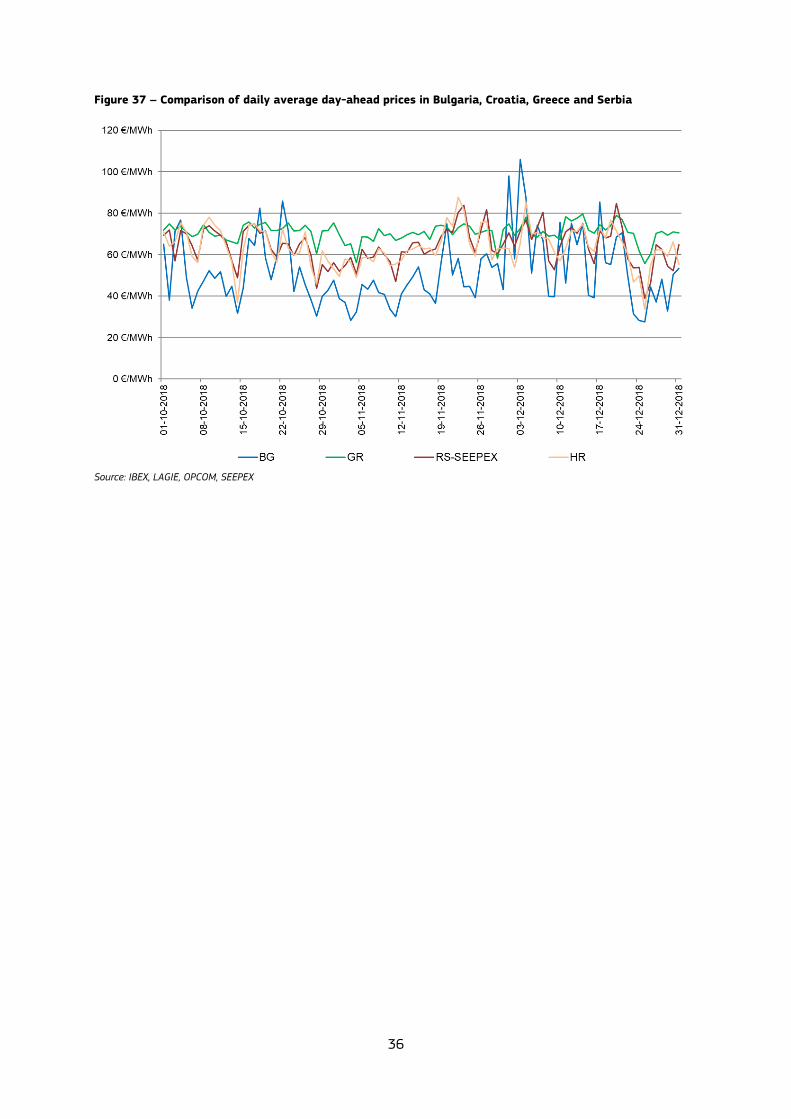
As shown in Figure 37, the strongest daily price variation occurs at the Bulgarian wholesale market. The daily
baseload price ranges from 27 €/MWh to 106 €/MWh. Overall, the Bulgarian baseload electricity price of on average 52 €/MWh in Q4 2018 increased compared to 41 €/MWh in Q4 2017. The Croatian and Serbian wholesale market exhibit similar price movements in the SEE region for the daily wholesale baseload price in Q4 2018. The Greek daily wholesale baseload price shows the least variation in Q4 2018 in this region and ranges from 56 €/MWh to 80 €/MWh. The average quarterly baseload price at the Greek market is with 71 €/MWh in Q4 2018 also higher compared to the previous year with an average price of 61 €/MWh in Q4 2017.
The dry summer of 2018 affected the hydro electricity generation throughout Europe. In Serbia, hydro electricity generation started to increase during Q4, but stayed with 1.9 TWh below the production of 2.4 TWh in Q4 in 2017. In Bulgarian hydro electricity generation recovered in Q4 2018 and even increased from 0.8 TWh to 1.1 TWh compared to Q4 2017.
In the SEE region, the Bulgaria market is a net exporter of electricity to the Serbian and Greek market. In Q4 of 2018, a volume of 0.5 TWh was transferred from Bulgaria to Greece and 0.8 TWh from Bulgaria to Serbia. Both values are similar to Q4 of 2017.
Figure 36 - Monthly traded volumes and prices in South-Eastern Europe (SEE)
Source: LAGIE, IBEX, SEPPEX, CROPEX LAGIE: Greek (EL) electricity market IBEX : Bulgarian (BG) Power Exchange SEPPEX : Serbian (RS) Power Exchange CROPEX : Croatian (HR) Power Exchange In the legend, numbers in brackets correspond to the serie’s row on the chart, starting from the bottom.
36
Figure 37 – Comparison of daily average day-ahead prices in Bulgaria, Croatia, Greece and Serbia
Source: IBEX, LAGIE, OPCOM, SEEPEX
37
4 Retail markets in the EU and outside Europe
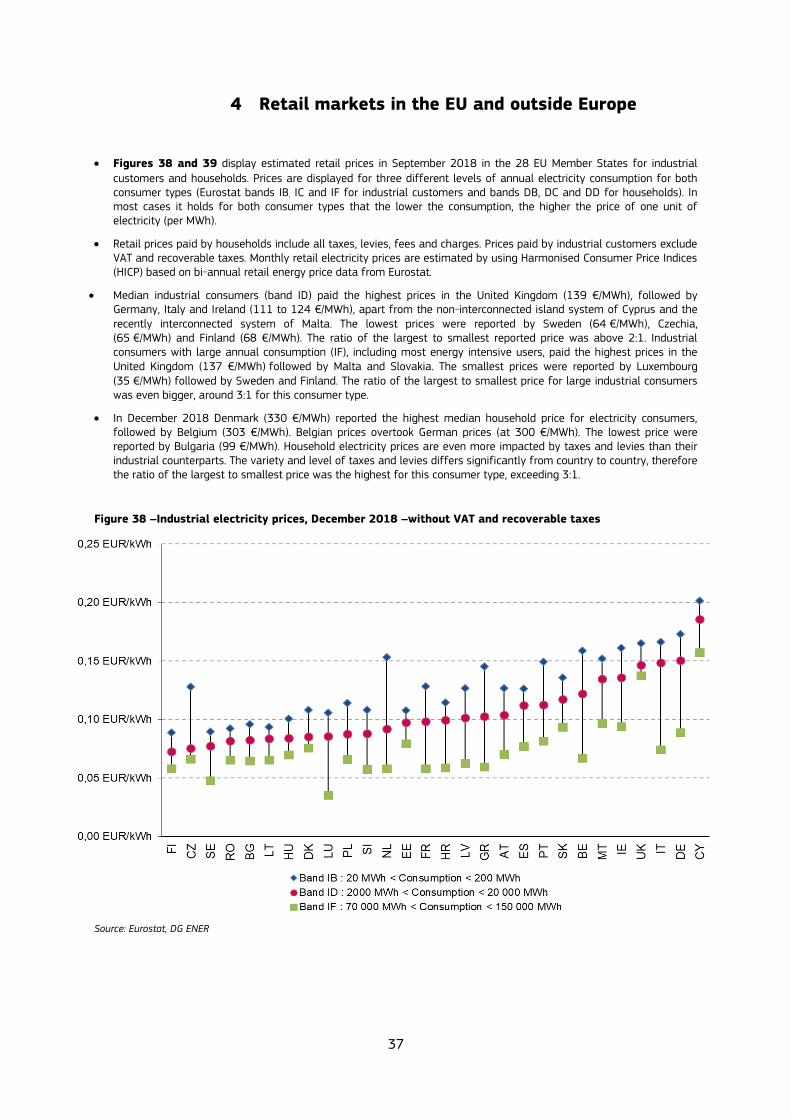
Figures 38 and 39 display estimated retail prices in September 2018 in the 28 EU Member States for industrial
customers and households. Prices are displayed for three different levels of annual electricity consumption for both consumer types (Eurostat bands IB, IC and IF for industrial customers and bands DB, DC and DD for households). In most cases it holds for both consumer types that the lower the consumption, the higher the price of one unit of electricity (per MWh).
Retail prices paid by households include all taxes, levies, fees and charges. Prices paid by industrial customers exclude VAT and recoverable taxes. Monthly retail electricity prices are estimated by using Harmonised Consumer Price Indices (HICP) based on bi-annual retail energy price data from Eurostat.
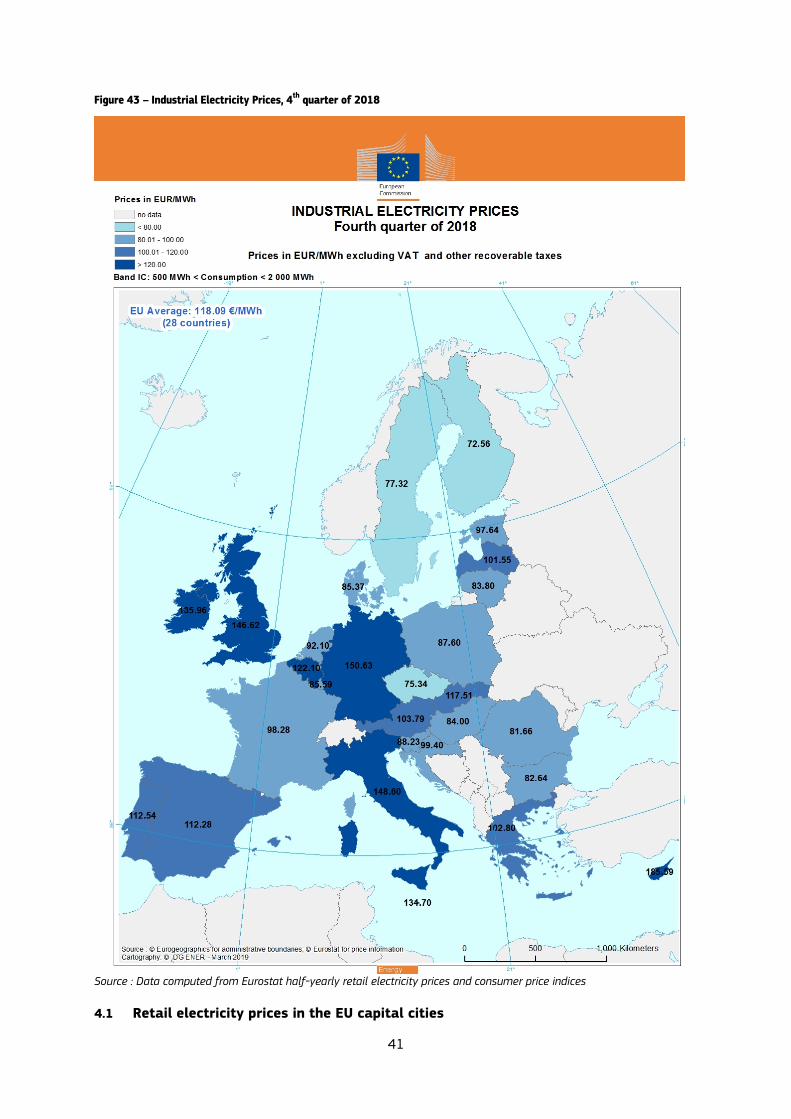
Median industrial consumers (band ID) paid the highest prices in the United Kingdom (139 €/MWh), followed by Germany, Italy and Ireland (111 to 124 €/MWh), apart from the non-interconnected island system of Cyprus and the recently interconnected system of Malta. The lowest prices were reported by Sweden (64 €/MWh), Czechia, (65 €/MWh) and Finland (68 €/MWh). The ratio of the largest to smallest reported price was above 2:1. Industrial consumers with large annual consumption (IF), including most energy intensive users, paid the highest prices in the United Kingdom (137 €/MWh) followed by Malta and Slovakia. The smallest prices were reported by Luxembourg (35 €/MWh) followed by Sweden and Finland. The ratio of the largest to smallest price for large industrial consumers was even bigger, around 3:1 for this consumer type.
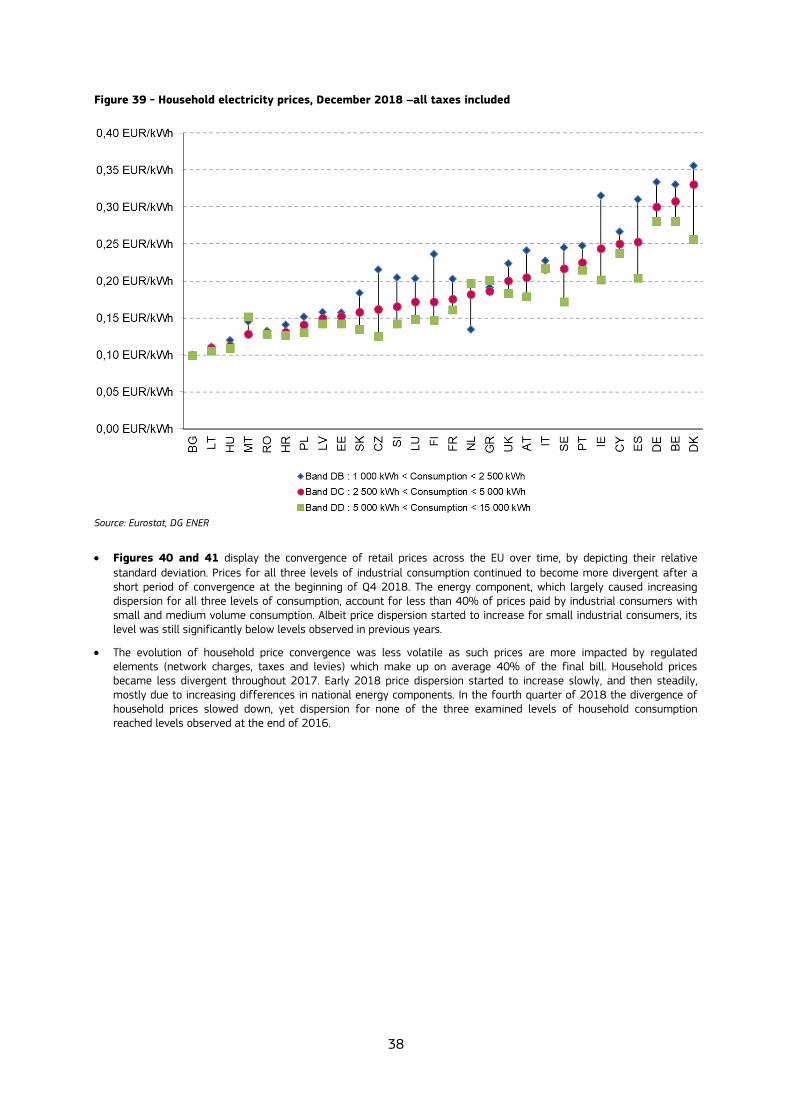
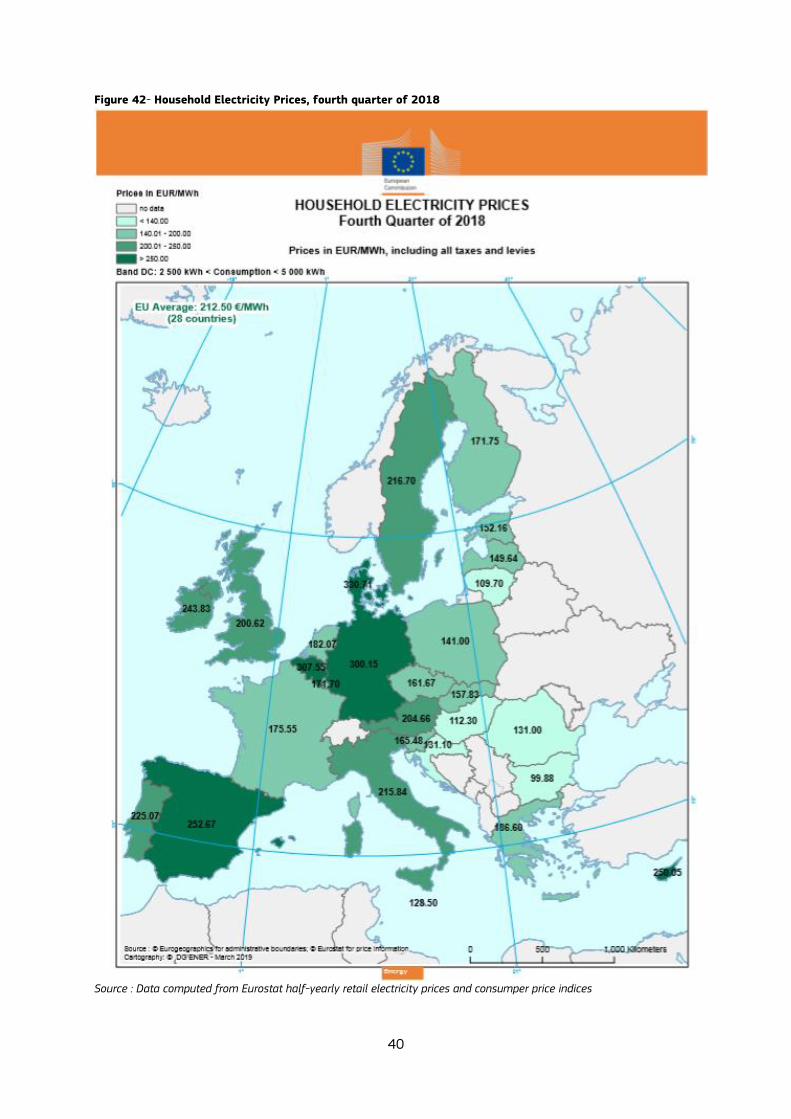
In December 2018 Denmark (330 €/MWh) reported the highest median household price for electricity consumers, followed by Belgium (303 €/MWh). Belgian prices overtook German prices (at 300 €/MWh). The lowest price were reported by Bulgaria (99 €/MWh). Household electricity prices are even more impacted by taxes and levies than their industrial counterparts. The variety and level of taxes and levies differs significantly from country to country, therefore the ratio of the largest to smallest price was the highest for this consumer type, exceeding 3:1.
Figure 38 –Industrial electricity prices, December 2018 –without VAT and recoverable taxes
Source: Eurostat, DG ENER
38
Figure 39 - Household electricity prices, December 2018 –all taxes included
Source: Eurostat, DG ENER
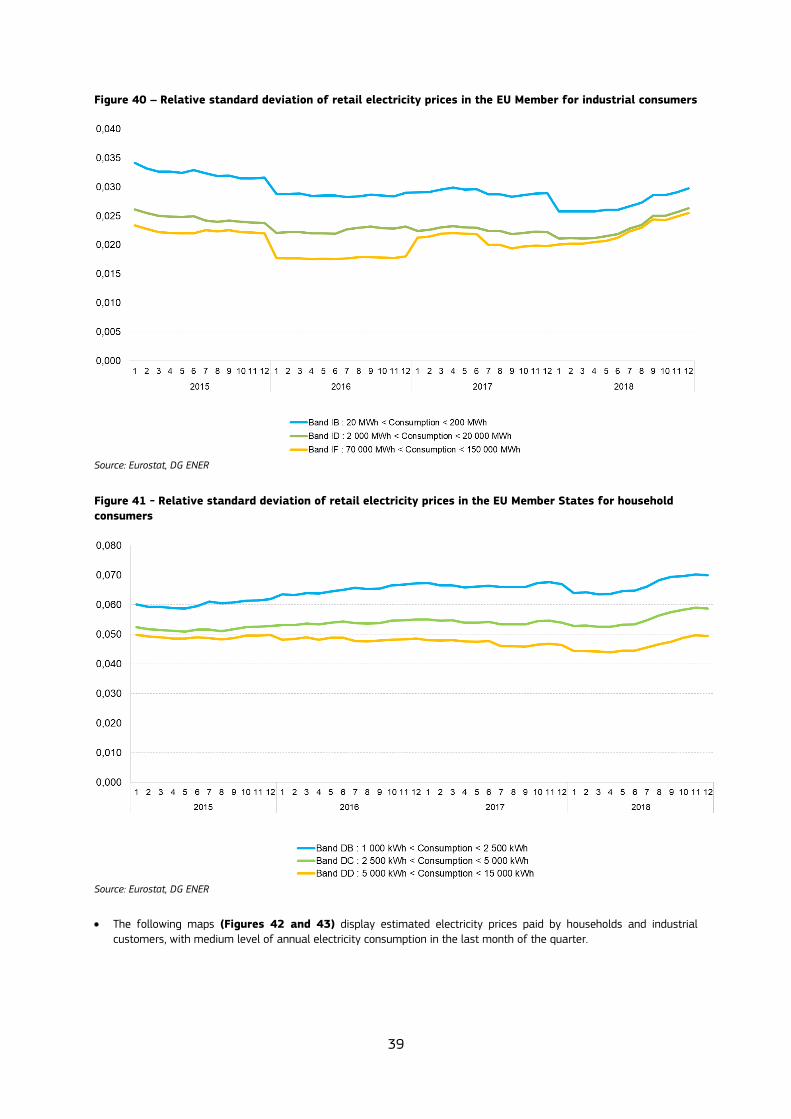
Figures 40 and 41 display the convergence of retail prices across the EU over time, by depicting their relative standard deviation. Prices for all three levels of industrial consumption continued to become more divergent after a short period of convergence at the beginning of Q4 2018. The energy component, which largely caused increasing dispersion for all three levels of consumption, account for less than 40% of prices paid by industrial consumers with small and medium volume consumption. Albeit price dispersion started to increase for small industrial consumers, its level was still significantly below levels observed in previous years.
The evolution of household price convergence was less volatile as such prices are more impacted by regulated elements (network charges, taxes and levies) which make up on average 40% of the final bill. Household prices became less divergent throughout 2017. Early 2018 price dispersion started to increase slowly, and then steadily, mostly due to increasing differences in national energy components. In the fourth quarter of 2018 the divergence of household prices slowed down, yet dispersion for none of the three examined levels of household consumption reached levels observed at the end of 2016.
39
Figure 40 – Relative standard deviation of retail electricity prices in the EU Member for industrial consumers
Source: Eurostat, DG ENER
Figure 41 - Relative standard deviation of retail electricity prices in the EU Member States for household
consumers
Source: Eurostat, DG ENER
The following maps (Figures 42 and 43) display estimated electricity prices paid by households and industrial
customers, with medium level of annual electricity consumption in the last month of the quarter.
40
Figure 42- Household Electricity Prices, fourth quarter of 2018
Source : Data computed from Eurostat half-yearly retail electricity prices and consumper price indices
41
Figure 43 – Industrial Electricity Prices, 4th quarter of 2018
Source : Data computed from Eurostat half-yearly retail electricity prices and consumer price indices
4.1 Retail electricity prices in the EU capital cities
42
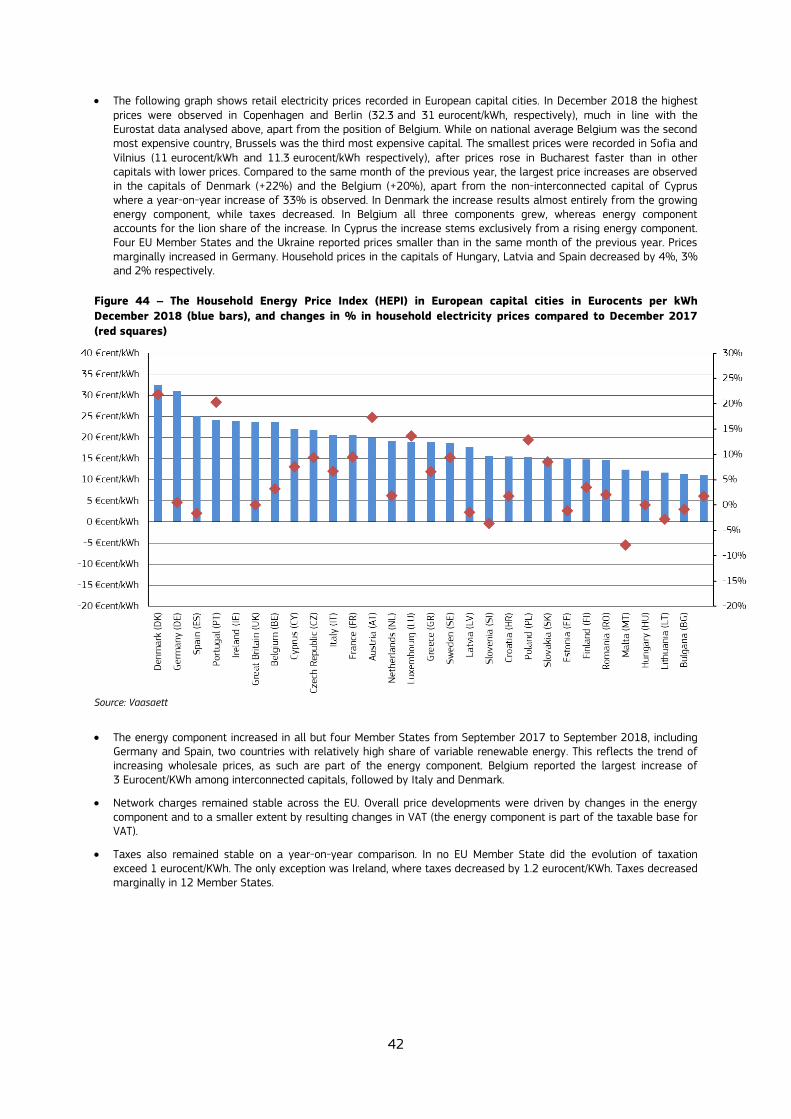
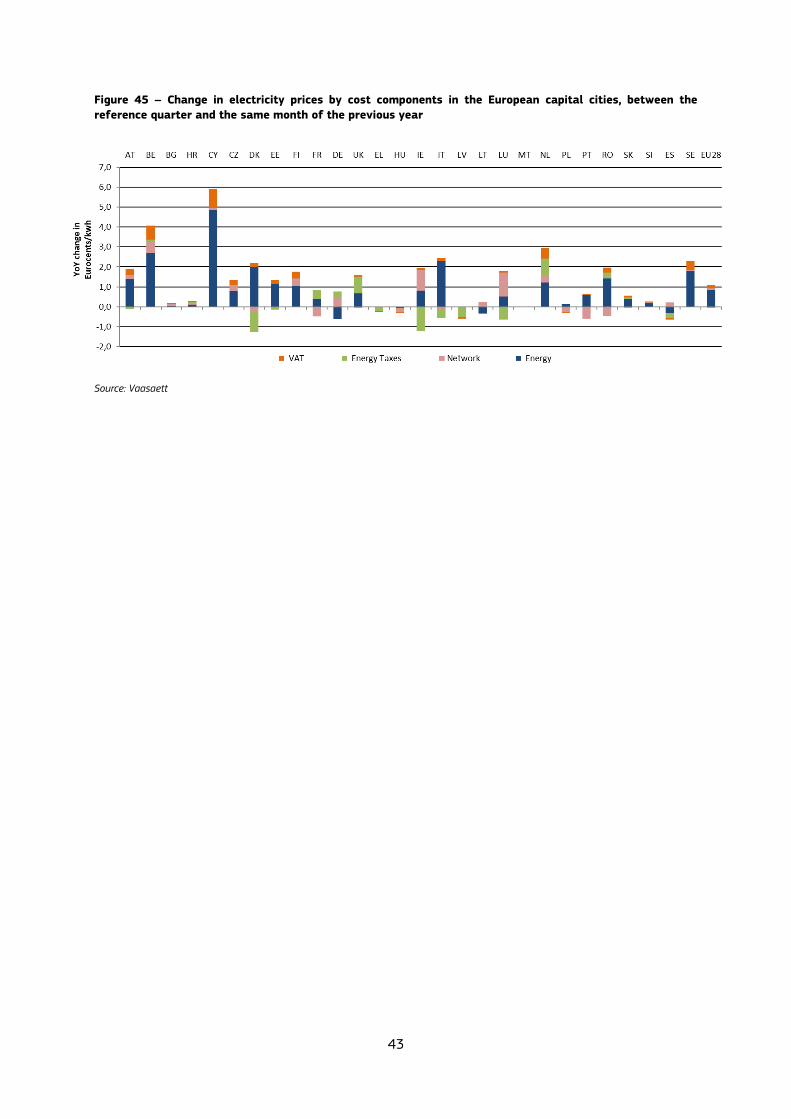
The following graph shows retail electricity prices recorded in European capital cities. In December 2018 the highest prices were observed in Copenhagen and Berlin (32.3 and 31 eurocent/kWh, respectively), much in line with the Eurostat data analysed above, apart from the position of Belgium. While on national average Belgium was the second most expensive country, Brussels was the third most expensive capital. The smallest prices were recorded in Sofia and Vilnius (11 eurocent/kWh and 11.3 eurocent/kWh respectively), after prices rose in Bucharest faster than in other capitals with lower prices. Compared to the same month of the previous year, the largest price increases are observed in the capitals of Denmark (+22%) and the Belgium (+20%), apart from the non-interconnected capital of Cyprus where a year-on-year increase of 33% is observed. In Denmark the increase results almost entirely from the growing energy component, while taxes decreased. In Belgium all three components grew, whereas energy component accounts for the lion share of the increase. In Cyprus the increase stems exclusively from a rising energy component. Four EU Member States and the Ukraine reported prices smaller than in the same month of the previous year. Prices marginally increased in Germany. Household prices in the capitals of Hungary, Latvia and Spain decreased by 4%, 3% and 2% respectively.
Figure 44 – The Household Energy Price Index (HEPI) in European capital cities in Eurocents per kWh
December 2018 (blue bars), and changes in % in household electricity prices compared to December 2017
(red squares)
Source: Vaasaett
The energy component increased in all but four Member States from September 2017 to September 2018, including Germany and Spain, two countries with relatively high share of variable renewable energy. This reflects the trend of increasing wholesale prices, as such are part of the energy component. Belgium reported the largest increase of 3 Eurocent/KWh among interconnected capitals, followed by Italy and Denmark.
Network charges remained stable across the EU. Overall price developments were driven by changes in the energy component and to a smaller extent by resulting changes in VAT (the energy component is part of the taxable base for VAT).
Taxes also remained stable on a year-on-year comparison. In no EU Member State did the evolution of taxation exceed 1 eurocent/KWh. The only exception was Ireland, where taxes decreased by 1.2 eurocent/KWh. Taxes decreased marginally in 12 Member States.
43
Figure 45 – Change in electricity prices by cost components in the European capital cities, between the
reference quarter and the same month of the previous year
Source: Vaasaett
44
4.2 International comparison of retail electricity prices
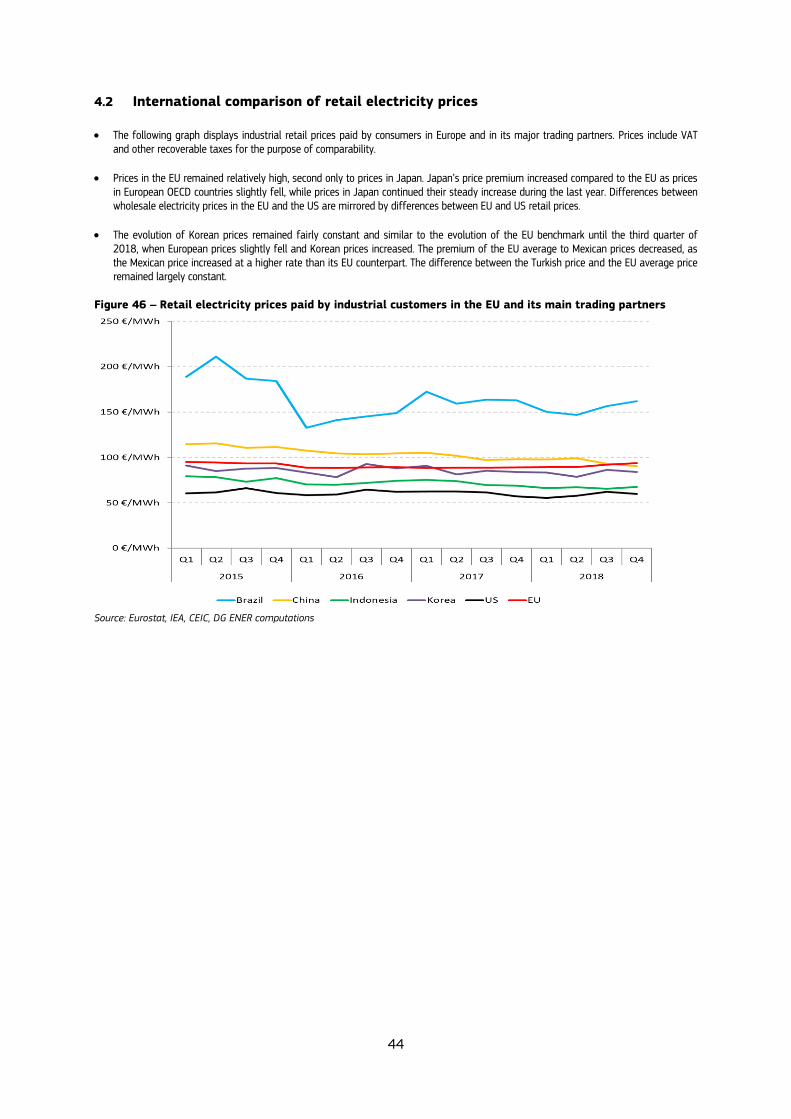
The following graph displays industrial retail prices paid by consumers in Europe and in its major trading partners. Prices include VAT and other recoverable taxes for the purpose of comparability.
Prices in the EU remained relatively high, second only to prices in Japan. Japan’s price premium increased compared to the EU as prices in European OECD countries slightly fell, while prices in Japan continued their steady increase during the last year. Differences between wholesale electricity prices in the EU and the US are mirrored by differences between EU and US retail prices.
The evolution of Korean prices remained fairly constant and similar to the evolution of the EU benchmark until the third quarter of 2018, when European prices slightly fell and Korean prices increased. The premium of the EU average to Mexican prices decreased, as the Mexican price increased at a higher rate than its EU counterpart. The difference between the Turkish price and the EU average price remained largely constant.
Figure 46 – Retail electricity prices paid by industrial customers in the EU and its main trading partners
Source: Eurostat, IEA, CEIC, DG ENER computations
45
5 Glossary
Backwardation occurs when the closer-to-maturity contract is priced higher than the contract which matures at a later
stage. Clean dark spreads are defined as the average difference between the price of coal and carbon emission, and the
equivalent price of electricity. If the level of dark spreads is above 0, coal power plant operators are competitive in the observed period. See dark spreads. Clean spark spreads are defined as the average difference between the cost of gas and emissions, and the equivalent
price of electricity. If the level of spark spreads is above 0, gas power plant operators are competitive in the observed period. See spark spreads. Contango: A situation of contango arises in the when the closer to maturity contract has a lower price than the contract which is longer to maturity on the forward curve. Cooling degree days (CDDs) are defined in a similar manner as Heating Degree Days (HDDs); the higher the outdoor temperature is, the higher is the number of CDDs. On those days, when the daily average outdoor temperature is higher than 21oC, CDD values are in the range of positive numbers, otherwise CDD equals zero. Dark spreads are reported as indicative prices giving the average difference between the cost of coal delivered ex-ship and the power price. As such, they do not include operation, maintenance or transport costs. Spreads are defined for a coal-fired plant with 35 % efficiency. Dark spreads are given in this publication for UK and Germany, with the coal and power reference price as reported by Platts. European Power Benchmark (EPB7) is a replacement of the former Platt's PEP index discontinued at the end of 2016, computed as weighted average of seven major European markets' (Belgium, France, Germany, Netherlands, Spain, Switzerland, United Kingdom) day-ahead contracts.
Flow against price differentials (FAPDs): By combining hourly price and flow data, FAPDs are designed to give a measure of the consistency of economic decisions of market participants in the context of close to real time operation of electrical systems. With the closure of the day-ahead markets (D-1), the prices for each hourly slot of day D are known by market participants. Based on the information from the power exchanges of two neighbouring areas, market participants can establish hourly price differentials. Later in D-1, market participants also nominate commercial schedules for day D. An event named 'flow against price differentials' (FAPD) occurs when commercial nominations for cross border capacities are such that power is set to flow from a higher price area to a lower price area. The FAPD chart in this quarterly report provides detailed information on adverse flows, presenting the ratio of the number of hours with adverse flows to the number of total trading hours in a quarter. Heating degree days (HDDs) express the severity of a meteorological condition for a given area and in a specific time period. HDDs are defined relative to the outdoor temperature and to what is considered as comfortable room temperature. The colder is the weather, the higher is the number of HDDs. These quantitative indices are designed to reflect the demand for energy needed to heat a building. Long-term average for HDD and CDD comparisons: In the case of both cooling and heating degree days, actual temperature conditions are expressed as the deviation from the long-term temperature values (average of 1975-2016) in a given period. Monthly estimated retail electricity prices: Twice-yearly Eurostat retail electricity price data and the electricity
component of the monthly Harmonised Index for Consumer Prices (HICP) for each EU Member States to estimate monthly electricity retail prices for each consumption band. The estimated quarterly average retail electricity prices on the maps for households and industrial customers are computed as the simple arithmetic mean of the three months in each quarter. Relative standard deviation is the ratio of standard deviation (measuring the dispersion within a statistical set of values from the mean) and the mean (statistical average) of the given set of values. It measures in percentage how the data points of the dataset are close to the mean (the higher is the standard deviation, the higher is the dispersion). Relative standard deviation enables to compare the dispersion of values of different magnitudes, as by dividing the standard deviation by the average the impact of absolute values is eliminated, making possible the comparison of different time series on a single chart.

46
Spark spreads are reported as indicative prices giving the average difference between the cost of natural gas delivered ex-ship and the power price. As such, they do not include operation, maintenance or transport costs. Spreads are defined for a gas-fired plant with 50 % efficiency. Spark spreads are given for UK and Germany in this publication, with the gas and power reference price as reported by Platts.
Tariff deficit expresses the difference between the price (called a tariff) that a regulated utility, such as an electricity producer is allowed to charge and its generation cost per unit.