Embed Size (px)
Citation preview
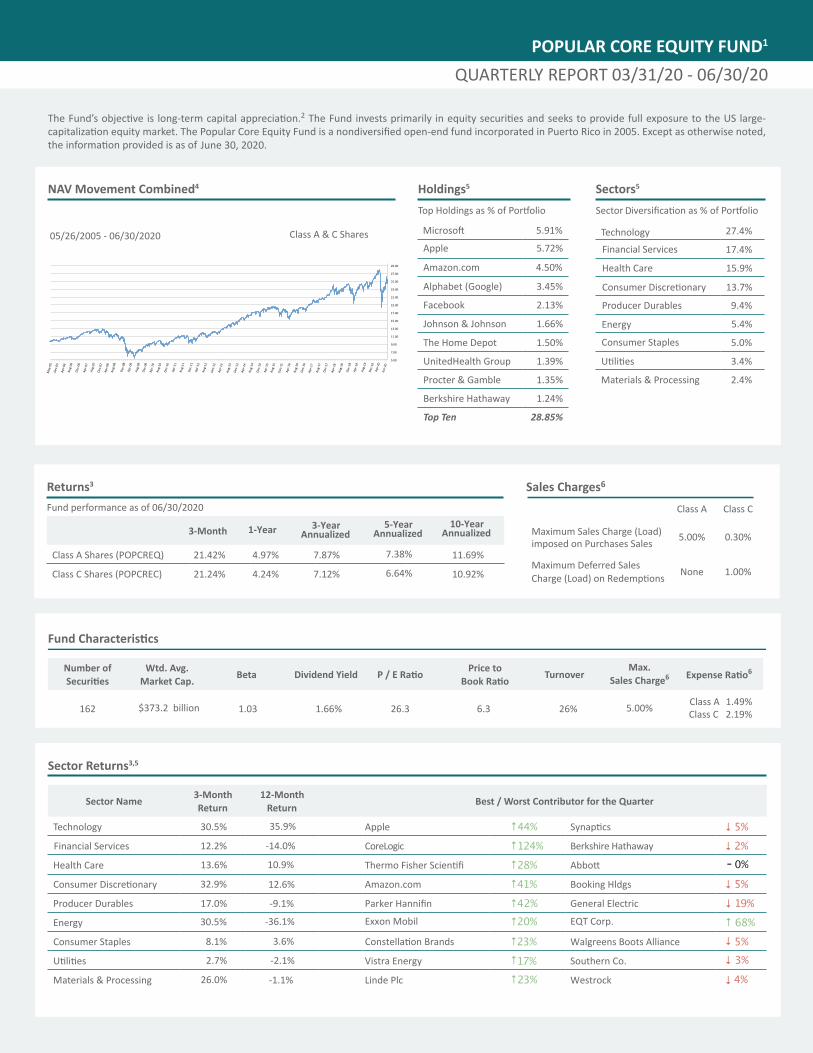
POPULAR CORE EQUITY FUND1
QUARTERLY REPORT 03/31/20 - 06/30/20
Number of Wtd. Avg.Market Cap. Beta Dividend Yield Price to Turnover
162 1.03 1.66% 26.3 6.3 26%
Sector Returns3,5
Sector Name 3-Month Return
12-Month Return Best / Worst Contributor for the Quarter
Financial Services
30.5% 35.9% Apple ↑44% Synaptics ↓ 5%Technology
12.2% -14.0% CoreLogic ↑124% Berkshire Hathaway ↓ 2%0%Health Care 13.6% 10.9% Thermo Fisher Scientifi ↑28% Abbott
32.9% 12.6% Amazon.com ↑41% Booking Hldgs ↓ 5%Producer Durables 17.0% -9.1% Parker Hannifin General Electric ↓ 19%Energy 30.5% -36.1% Exxon Mobil EQT Corp.
Consumer Staples 8.1% 3.6% ↑23% Walgreens Boots Alliance 5%U 2.7% -2.1% Vistra Energy 17% Southern Co.
Materials & Processing 26.0% -1.1% Linde Plc Westrock
Holdings5
Top Holdings as % of P
Apple 5.72%
Microsoft 5.91%
Johnson & Johnson 1.66%
4.50%
Alphabet (Google) 3.45%
Facebook 2.13%
The Home Depot 1.50%
UnitedHealth Group 1.39%
Procter & Gamble 1.35%
Berkshire Hathaway 1.24%
Top Ten 28.85%
Sectors5
P
Financial Services
27.4%Technology
17.4%
15.9%Health Care
Consumer Discretionary 13.7%
Energy
9.4%Producer Durables
5.4%
Utilities
5.0%Consumer Staples
3.4%
Materials & Processing 2.4%
NAV Movement Combined4
05/26/2005 - 06/30/2020 Class A & C Shares
T 2 T US large-The Popular Core E Puerto Rico in 2005. Except as otherwise noted,
Returns3
Fund performance as of 06/30/2020
3-Month 1-Year
Class A Shares (POPCREQ) 21.42% 4.97% 7.87% 11.69%
Class C Shares (POPCREC) 21.24% 4.24% 7.12% 10.92%
Constellation Brands
D
June 30, 2020.
Sales Charges6
Class A Class C
Maximum Sales Charge (Load) imposed on Purchases Sales 5.00% 0.30%
Maximum Deferred Sales Charge (Load) on Redemptions None 1.00%
Max.Sales Charge6
6
5.00% Class A 1.49%Class C 2.19%
↓3%↓
↓ 4%
P / E Ratio
Amazon.com
3-Year Annualized
7.38%
6.64%
5-Year Annualized
10-Year Annualized
↑23%↑
↑68%
42%↑ ↑20%
$373.2 billion
Aug-
06
Apr-0
6
Dec-
05
May
-05
Dec-
06Ap
r-07
Aug-
07De
c-07
Apr-0
8Au
g-08
Dec-
08Ap
r-09
Aug-
09De
c-09
Apr-1
0Au
g-10
Dec-
10Ap
r-11
Aug-
11
Dec-
11Ap
r-12
Aug-
12
Dec-
12Ap
r-13
Aug-
13De
c-13
Apr-1
4Au
g-14
Dec-
14Ap
r-15
Aug-
15De
c-15
Apr-1
6
Aug-
16De
c-16
Apr-1
7Au
g-17
Dec-
17
Apr-1
8Au
g-18
Dec-
18
Aug-
19De
c-19
Apr-2
0Ju
n-20
Apr-1
95.00
7.00
9.00
11.00
13.00
15.00
17.00
19.00
21.00
23.00
25.00
27.00
29.00
-

POPULAR CORE EQUITY FUND1
1. T Popular P .sutcepsorPuerto R
Puerto Rico. An investment in the Funds entails certain fees, charges and expenses.
ABanco Popular de Puerto R
for long-term investors and may not be suitable for all investors. The Fund should not be viewed as a vehicle for trading purposes. Tin the Investment Company Act of Puerto Rico and may invest up to 25% of its assets (or more in certain limited circumstances) in a single issuer. Trisk which is more fully described in the Fund’s prospectus. The Fund is not registered as an investment company with the U Exchange Commission, and the
U Exchange Commission. Please consult with your broker to determine whether an investment in the Funds is suitable for your investment goals and objectives. Each of the Funds is an affiliate of Banco Popular de Puerto Rico, Popular Securities, and Popular, Inc. The brokerage products and services are offered by Popular Securities, a registered broker/dealer and member of FINRA and SIPC. Popular Securities is a subsidiary of Popular, Inc. and an affiliate of Banco Popular de Puerto Rico. Popular, Inc. and Banco Popular de Puerto Rico are not registered broker-dealers. Investment products are not insured by the FDIC, are not obligations of, or guaranteed by Banco Popular de Puerto Rico and involve risks, including possible loss of principal invested.
2. T The Fund should not be viewed as a vehicle for trading purposes. Investment in the Fund is designed primarily for and is suitable for long-term investors.
3. Performance data quoted represents past performance. Tthe performance quoted. Pstated. TThis fund was created on 05/26/2005. The data provided has not been audited. T
4. The graph represents the overall NAV movement for all Fund Classes and does not necessarily correspond to the NAV movement of each individual Fund Class during the periods depicted in the graph. As of 06/30/2020, the NAV for Class A and C shares was U.S. $25.51, and $24.32, respectively.
5. T An investment in the Fund is
6. Certain fees, charges and expenses may apply to an investment in the fund. There is no guarantee that actual expenses will be the same as those included and that various fees payable to the fund’s service providers may be voluntarily waived. T
THIS REPORT IS EXCLUSIVELY FOR SHAREHOLDERS AND NOT FOR PUBLIC DISTRIBUTION.
. .
.