Embed Size (px)
Citation preview

THE
QUARTERLY JOURNALOF ECONOMICS
Vol. 127 February 2012 Issue 1
TESTING FOR ALTRUISM AND SOCIAL PRESSURE INCHARITABLE GIVING∗
STEFANO DELLAVIGNA
JOHN A. LIST
ULRIKE MALMENDIER
Every year, 90% of Americans give money to charities. Is such generositynecessarily welfare enhancing for the giver? We present a theoretical frameworkthat distinguishes two types of motivation: individuals like to give, for example,due to altruism or warm glow, and individuals would rather not give but dislikesayingno, forexample, duetosocial pressure. Wedesigna door-to-doorfund-raiserin which some households are informed about the exact time of solicitation with aflyer on their doorknobs. Thus, they can seek or avoid the fund-raiser. We findthat the flyer reduces the share of households opening the door by 9% to 25%and, if the flyer allows checking a Do Not Disturb box, reduces giving by 28%to 42%. The latter decrease is concentrated among donations smaller than $10.These findings suggest that social pressure is an important determinant of door-to-door giving. Combining data from this and a complementary field experiment,we structurally estimate the model. The estimated social pressure cost of sayingnotoa solicitor is $3.80 foranin-statecharityand$1.40 foranout-of-statecharity.Our welfare calculations suggest that our door-to-door fund-raising campaigns onaverage lower the utility of the potential donors. JEL Codes: C93, D03, H41.
∗We thank the editor, four referees, Saurabh Bhargava, David Card, GaryCharness, Constanca Esteves-Sorenson, Bryan Graham, Zachary Grossman,Lawrence Katz, Patrick Kline, Stephan Meier, Klaus Schmidt, Bruce Shearer,Joel Sobel, Daniel Sturm and the audiences at the Chicago Booth School of Busi-ness, Columbia University, Harvard University, HBS, University of Amsterdam,University of Arizona, Tucson, UC Berkeley, USC (Marshall School), UT Dallas,University of Rotterdam, University of Zurich, Washington University (St. Louis),Yale University, the NBER Summer Institute (Labor Studies), the San Francisco2009 Applied Micro Conference, the 2009 Berkeley Conference in BehavioralEconomics, the 2010 UCSB Conference on Experimental Economics, the MunichWorkshop on Natural Experiments and Controlled Field Studies, and the ASSA2009 Meetings for helpful comments. We alsothank Daniel Acland, Diane Alexan-der, JimCai, MatthewLevy, VerateVelde, XiaoyuXia, andespeciallyGautamRaofor excellent research assistance.
c© The Author(s) 2012. Published by Oxford University Press, on behalf of President andFellows of Harvard College. All rights reserved. For Permissions, please email: [email protected] Quarterly Journal of Economics (2012) 127, 1–56. doi:10.1093/qje/qjr050.Advance Access publication on January 18, 2012.
1
at University of C
hicago Library on M
arch 23, 2016http://qje.oxfordjournals.org/
Dow
nloaded from
2 QUARTERLY JOURNAL OF ECONOMICS
I. INTRODUCTION
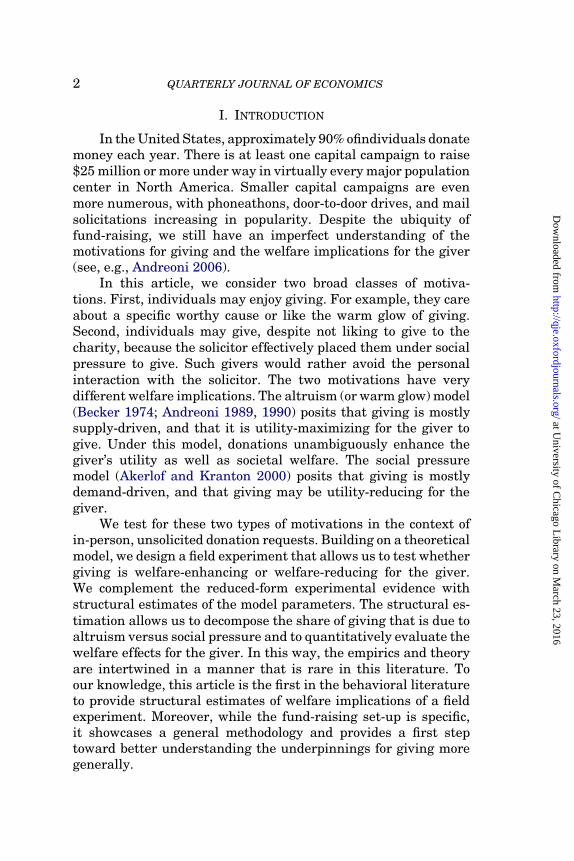
IntheUnitedStates, approximately90% ofindividuals donatemoney each year. There is at least one capital campaign to raise$25 millionormoreunderwayinvirtuallyeverymajorpopulationcenter in North America. Smaller capital campaigns are evenmore numerous, with phoneathons, door-to-door drives, and mailsolicitations increasing in popularity. Despite the ubiquity offund-raising, we still have an imperfect understanding of themotivations for giving and the welfare implications for the giver(see, e.g., Andreoni 2006).
In this article, we consider two broad classes of motiva-tions. First, individuals may enjoy giving. For example, they careabout a specific worthy cause or like the warm glow of giving.Second, individuals may give, despite not liking to give to thecharity, because the solicitor effectively placed them under socialpressure to give. Such givers would rather avoid the personalinteraction with the solicitor. The two motivations have verydifferent welfareimplications. Thealtruism(orwarmglow) model(Becker 1974; Andreoni 1989, 1990) posits that giving is mostlysupply-driven, and that it is utility-maximizing for the giver togive. Under this model, donations unambiguously enhance thegiver’s utility as well as societal welfare. The social pressuremodel (Akerlof and Kranton 2000) posits that giving is mostlydemand-driven, and that giving may be utility-reducing for thegiver.
We test for these two types of motivations in the context ofin-person, unsoliciteddonationrequests. Buildingona theoreticalmodel, we design a fieldexperiment that allows us totest whethergiving is welfare-enhancing or welfare-reducing for the giver.We complement the reduced-form experimental evidence withstructural estimates of the model parameters. The structural es-timation allows us to decompose the share of giving that is due toaltruismversus social pressureandtoquantitativelyevaluatethewelfare effects for the giver. In this way, the empirics and theoryare intertwined in a manner that is rare in this literature. Toour knowledge, this article is the first in the behavioral literatureto provide structural estimates of welfare implications of a fieldexperiment. Moreover, while the fund-raising set-up is specific,it showcases a general methodology and provides a first steptoward better understanding the underpinnings for giving moregenerally.
at University of C
hicago Library on M
arch 23, 2016http://qje.oxfordjournals.org/
Dow
nloaded from

TESTING FOR ALTRUISM AND SOCIAL PRESSURE 3
Our field experiment revolves around a door-to-door fund-raising drive for two charities, a local children’s hospital, whichhas a reputation as a premier hospital for children, and an out-of-state charity, unfamiliar to most solicitees. Between April andOctober 2008, we approached 7,668 households in the towns sur-rounding Chicago. The crucial aspect of the experimental designis to allow individuals to sort, that is, to either seek or avoid thesolicitor. In our first treatment, a flyer on the doorknob notifieshouseholds one day in advance about the one-hour time intervalin which a solicitor will arrive at their homes the next day. Inthe second treatment, opt-out, the flyer also includes a box tobe checked if the household does not want to be disturbed. Wecompare these two conditions to a baseline treatment, whereinsolicitors approach households in the usual manner without aflyer. We estimate the treatment effects on both the share ofhouseholds that open the door and the share that give.
This design allows for a simple test of (pure or impure) altru-ismversus social pressureindoor-to-doorgiving. If altruismis themain driver of giving, the flyer should increase both the presenceat home and giving. Because giving is utility-enhancing, giversshould sort into staying at home, provided that alternative waysof donating to these charities require more effort. In addition,givers who would like to give in response to the flyer but who findit too costly to be at home should give to the charity via othermeans, such as mailing a check. Conversely, if social pressure isthemaindriverofgiving, theflyershouldlowerboththefrequencyof opening the door andthe frequency of giving. Since being askedto give is welfare-diminishing, potential givers should sort out ofopeningthedoorandshouldnot givevia Internet orcheckbecausethese forms of donation are not subject to social pressure.
We report four main results, which are similar across the twocharities. First, the flyer lowers the frequency of opening the door.Relative to a baseline rate of 41 percentage points, the shareof households opening the door is 9% lower after receiving theflyer and 23% lower after receiving the flyer with an opt-out box(including the households that check the opt-out box). Second, thesimple flyer does not reduce giving. However, the flyer with anopt-out checkbox decreases giving significantly, by 28% relativeto a baseline of 7% for the local charity and 40% relative to a 5%baseline giving for the out-of-state charity. Third, the decreasein giving in the opt-out treatment is driven by small donationsup to $10; donations above $10, instead, increase slightly (not
at University of C
hicago Library on M
arch 23, 2016http://qje.oxfordjournals.org/
Dow
nloaded from

4 QUARTERLY JOURNAL OF ECONOMICS
significantly). Fourth, there is no effect on donations via mail orInternet. In contrast to the substantial donation rates in person,only one household out of 7,668 gave through these other means.
Overall, the reduced-form estimates indicate that both altru-ism and social pressure are important determinants of giving inthis setting, with stronger evidence for the role of social pressure.The lower frequency of households opening the door after receiv-ing a flyer indicates that households are, on average, trying toavoid solicitors, consistent with social pressure. The lack of aneffect of the baseline flyer on giving is consistent with opposingeffects of altruism and social pressure approximately cancelingeach other out. The decrease in giving after a flyer with opt-out box supports the role of social pressure. When the cost ofavoiding the solicitor is lowered (a simple check on a box suffices),giving due to social pressure decreases. This interpretation isconsistent with the reduction occurring almost exclusively amongsmall donations, which are more likely due to social pressurethan large donations. The social pressure interpretation is alsoconsistent with the lack of donations via mail or Internet.
We consider several alternative interpretations. First, flyerscould be taken as a signal of lower quality of the charity. Thisinterpretation can explain the reduction in answering the doorand in giving with a flyer, but does not immediately explainwhy only small donations decrease, not large donations. Second,individuals might donate to send (costly) signals to themselves orto others that they are generous (Bodner and Prelec 2003; Ben-abou and Tirole 2006; Grossman 2010). This interpretation canexplainourfindings totheextent that avoidinga solicitordoes notsend the same negative signal as saying no to the solicitor. Thisexplanation, however, is less consistent with the fact that 12% ofhouseholds in the opt-out treatment check the opt-out box, whichis a signal to the solicitor, as well as possibly to the neighbors.Third, people may dislike spending time with the solicitor, forexample, because of the time involved, despite wanting to donatein principle. These potential donors, however, when alerted of acampaign by a flyer, should seek alternative ways to give thatdo not involve personal interaction; instead, we observe no suchsubstitution.
To assess the welfare effects of giving, we structurally es-timate the model parameters. We combine data from the treat-ments withcomplementaryfieldexperiments onthevalueof time,run in the same geographical areas in 2008 and 2009. These
at University of C
hicago Library on M
arch 23, 2016http://qje.oxfordjournals.org/
Dow
nloaded from

TESTING FOR ALTRUISM AND SOCIAL PRESSURE 5
experiments aredesignedtoestimateakeyparameterinthefund-raising treatments, the sensitivity of home presence toincentives,which is otherwise identified only parametrically. We ask 11, 900households to complete a survey and vary the payment ($0, $5, or$10), the duration (5 or 10 minutes), and whether the surveys areannounced (with a flyer, with or without opt-out option). Higherpayments and shorter duration increase the presence at home upto 16% and increase survey completion by 17–82%.
We use a minimum-distance estimator on the combined datafrom the charity and the survey experiments. The estimatorminimizes the distance between the moments predicted by themodel and the observed moments. The moments are the probabil-ities of opening the door, giving different amounts, completing asurvey, and opting out. Key parameters are the share of altruists,the curvature of the altruism function, and the social pressurecost of saying no in person to a solicitor. We estimate that 75%of solicitees have no altruism toward the charities, but there issubstantial heterogeneity. Among the altruists, the utility fromgivingduetoaltruismis steeplyconcaveintheamount given, withalmost no predicted donation above $50, consistent with warm-glow rather than pure altruism. The estimated social pressurecost of giving zerois $3.75 (and significantly different from $0) forthe in-state charity and $1.44 (marginally significant) for the out-of-statecharity. As a result of social pressure, a majorityof donorsgive more than they would have liked to. Half of donors derivenegative utility from the fund-raising interaction and would havepreferred to sort out.
Given the large social pressure costs, our door-to-door cam-paigns lower the utility of the solicited households on average. Inthe benchmark specification, a visit is estimated to lower welfareby $1.10 per household contacted for the in-state charity andby $0.44 for the out-of-state charity. The more negative welfareimpact for the in-state charity is counterintuitive because morepeople are willing to donate to this better-liked charity. At thesame time, however, the social pressure cost of saying no is alsosignificantly higher for the local charity, and the second forcedominates.
If we take our fund-raising campaigns to be representativeof door-to-door solicitations, unsolicited campaigns lead to utilitylosses for the givers in the order of hundreds of millions of dollars.The campaigns may still increase overall welfare, though only ifthe charities spend the money very effectively; in our campaign,
at University of C
hicago Library on M
arch 23, 2016http://qje.oxfordjournals.org/
Dow
nloaded from

6 QUARTERLY JOURNAL OF ECONOMICS
we raised net donations of only $0.24 per household contactedfor the in-state charity, and no net donation for the out-of-statecharity.
An important qualification is that our design identifies rea-sons for marginal, as opposed to infra-marginal, giving. House-holds that do not give to our fund-raiser, or give only due tosocial pressure, likely contributed to other charities. The motivesfor giving identified in this article may not generalize to infra-marginal giving, which is more likely motivated by altruismand desire for status. By the same token, however, it would bea mistake to ignore the high-pressure giving requests studiedherein, or to assume that the motives for infra-marginal givingstudied in the literature apply. Small capital campaigns, like theonestudiedinthis article, arecommonandreveal a different facetof the motivations for giving.
Our findings can be used as an argument to introduce a do-not-solicit or do-not-call list for charities. However, they also sug-gest an alternative: providing households with the opportunity tosort or, even better, opt out. Introducing sorting opportunities infund-raising limits or eliminates altogether, the welfare losses forthe solicitees. Interestingly, introducing sorting can also increasecharitable fund-raising, and be a win-win solution: even a limitedamount of sorting in of altruisticgivers, whogive larger amounts,is likely to counterbalance the sorting out of givers motivated bysocial pressure, who give smaller amounts.
A methodological contribution of this article is the close tiebetween the behavioral model and the field experiment, allowingfor structural estimation of the underlying parameters, whichis surprisingly rare. Of all field experiments published in topfive journals from 1985 to 2010, only two have this feature(Card, DellaVigna, and Malmendier 2011). A small literature instructural behavioral economics estimates behavioral models onobservational data, including Laibson, Repetto, and Tobacman(2007) and Conlin, O’Donoghue, and Vogelsang (2007).
Our article adds to several other strands of literature. Itprovides field evidence about social preferences to complementthe laboratory evidence (Fehr and Gachter 2000; Charness andRabin 2002; and especially Dana, Cain, and Dawes 2006; Lazear,Malmendier, and Weber forthcoming). The study also relates tothe empirical and theoretical literature on optimal fund-raising(e.g., List and Lucking-Reiley 2002; Andreoni 2006; Landry et al.2006; Ariely, Bracha, and Meier 2009; Croson and Shang 2009;
at University of C
hicago Library on M
arch 23, 2016http://qje.oxfordjournals.org/
Dow
nloaded from

TESTING FOR ALTRUISM AND SOCIAL PRESSURE 7
FongandLuttmer2009). Finally, it adds totheliteratureonsocialpressure (Asch 1951; Milgram 1963; Garicano, Palacios-Huerta,andPrendergast 2005; Gerber, Green, andLarimer2008; Mas andMoretti 2009).
The rest of the article proceeds as follows. In Section IIwe present a simple model of giving with altruism and socialpressure. Weintroducetheexperimental designinSection III anddiscuss the reduced-form results in Section IV. In Section V, westructurally estimate the parameters. In Section VI, we discussalternative interpretations. Section VII concludes.
II. MODEL
We model the behavior of an individual whose home is visitedby a fund-raiser. We distinguish between the standard case of anunanticipated visit and that of an anticipated visit. In the lattercase, a flyer announces the visit and the individual can alter theprobability of being at home and opening the door. We discusshere the setting and predictions. The technical details, includingLemmas are in the Appendix, and the proofs are in the OnlineAppendix.
II.A. Setup
We consider a two-stage game between a potential giver anda solicitor. For convenience, we denote the potential giver, orsolicitee, simply as giver. In the first stage, the giver may receivea flyer of the upcoming visit and, if so, notices the flyer withprobability r ∈ (0, 1]. In the second stage, the solicitor visits thehome. The giver opens the door with probability h. If she did notnotice the flyer (or did not receive one), h is equal to a baselineprobability h0 ∈ (0, 1). If she noticed the flyer, she can adjust theprobability to h ∈ [0, 1] at a cost c (h), with c(h0)= 0, c′(h0)= 0, andc′′(∙)> 0. That is, the marginal cost of small adjustments is small,but larger adjustments have an increasingly large cost. We donotrequire symmetry around h0 and we allow for corner solutions ath = 0 or h = 1.
If the giver is present, she donates an amount g ≥ 0. If sheis absent, there is no in-person donation (g = 0). The giver candonate through other channels, such as via mail or online, afterlearning about the charity from the solicitor or the flyer. The giverhas utility
(1) U (g, gm) = u (W − g− gm) + av (g + θgm, G−i)− s (g) .
at University of C
hicago Library on M
arch 23, 2016http://qje.oxfordjournals.org/
Dow
nloaded from

8 QUARTERLY JOURNAL OF ECONOMICS
Theutilityofprivateconsumption, u, is derivedfromthepregivingwealth W minus the donations given to the solicitor (g) andthrough other channels such as mail (gm). Giving through otherchannels gm involves additional costs, such as finding an envelopeandstamp, equal to(1−θ)gm, with0 ≤ θ < 1. Thecharitythereforereceives θgm.1 The private utility satisfies standard properties:u′( ∙ ) > 0 and u′′( ∙ ) ≤ 0. Notice that the utility of privateconsumption can include the utility from infra-marginal giving toother charities.2
The utility of giving to the charity, v, allows for pure andimpure altruism (warm glow), or prestige (Harbaugh 1998). Sincethe experiment is not designed to separate pure altruism, im-pure altruism, or prestige but altruism from social pressure, weuse a specification that is general enough to encompass both. Wealso allow for negative social preferences, or spite (Levine 1998),towards the charity.
In the case of pure altruism, the agent cares about the totalcontributions to the charity, G−i + g + θgm, where G−i is thegiving of others. In this case, we can think of v (G−i + g + θgm)as the production function of the charity, which is increasing inthe donation g but has decreasing returns: v′g(∙, ∙) > 0, v′′g,g(∙, ∙)< 0, and limg→∞ v′ (g, ∙) = 0. The parameter a ≥ 0 denotes thelevel of altruism,3 and the overall utility from giving isav (G−i + g + θgm).
In the case of impure altruism, the agent cares about thewarm glowfrom giving g. Hence, v (∙) does not necessarily dependon the giving of others, G−i, and a ≥ 0 captures the intensity ofthe warm glow. We make the same assumptions v′g > 0, v′′g,g < 0,and limg→∞ v′ (g, ∙) = 0.4
Finally, in the case of spite towards the charity, the agentdislikes givingtothecharity. Theutilityis av (G−i + g + θgm), witha < 0 capturing the intensity of spite. It is natural toassume thatthe disutility of giving increases with the donation in a convex
1. The key results generalize to a fixed cost of giving by mail, but the algebrais more complex.
2. We allow for giving to exceed current wealth, that is, the case g + gm > W.In practice, this case is unlikely to matter.
3. The parameter a can also capture the belief of the donor about the qualityof the charity.
4. Under the warm-glow model, an alternative interpretation of θ is that thecharity receives the full amount gm (i.e., there are no costs of giving via mail), butthe impersonal mean lowers warm glow by a factor θ.
at University of C
hicago Library on M
arch 23, 2016http://qje.oxfordjournals.org/
Dow
nloaded from

TESTING FOR ALTRUISM AND SOCIAL PRESSURE 9
manner: v′g > 0 and v′′g,g > 0. Here, we are abusing notation sincethe function v differs for a ≥ 0 (altruism) and a < 0 (spite);it is concave in the first case and convex in the second. Whenthe distinction is important, we use v+ to denote the function fora ≥ 0, v− to denote the function for a < 0, and v to denote thefunction that equals v+ for a ≥ 0 and v− for a < 0. Notice thatit is important to consider the case of spite because, unlike in astandard model of giving, even spiteful individuals may give tothe charity if social pressure is high enough.
The third element in the utility function is social pressure.The giver pays a utility cost s(g) = S ∙ (gs − g) ∙ 1g<gs ≥ 0 fornot giving or only a giving small amount g while the solicitor ispresent. The cost is highest for the case of nodonation (s(0)=Sgs),then decreases linearly in g, and is 0 for donations of gs or higher.The giver does not incur a social pressure cost if she is awayfrom home during the visit. The special case of S = 0 (no socialpressure) and a = 0 (no altruism or warm glow) represents thestandard model. We further assume that the giver is aware of herown preferences and rationally anticipates her response to socialpressure.
Giving in Person. We solve the model working backward. Inthe second stage, conditional on being at home and answering thedoor, the giver chooses g to maximize (1). Notice that conditionalon answering the door, the giver always prefers to donate inperson because mail donations involve an additional cost (1− θ)and do not eliminate the social pressure cost.
We characterize optimal giving g∗ as a function of the param-eters a and S in Lemma 1A in the Appendix. (The thresholdsa(S), a(S), and a are also defined in the Appendix.) Figure Iillustrates the case of linear private utility u and v+′ (0) = v−′ (0),which are the assumptions used for the structural estimation.Giving g∗ increases in altruism. When altruism is sufficientlylow (a ≤ a (S)), the individual does not give. For a higher levelof altruism (a (S) < a < a (S)), the individual gives a positiveamount, but less thangs. Forevenhigheraltruism (a (S) ≤ a ≤ a),there is bunching at g∗ = gs, which is the lowest level of givingassociatedwith zerosocial pressure cost. Finally, for large enougha (a > a), the donor gives more than gs. Any giving above gs isdue to altruism (hence the threshold a > 0 does not depend onthe social pressure cost S), while donations smaller than gs maybe due to altruism or social pressure. Giving can occur also with
at University of C
hicago Library on M
arch 23, 2016http://qje.oxfordjournals.org/
Dow
nloaded from

10 QUARTERLY JOURNAL OF ECONOMICS
FIGURE I
Regions of Giving g and Probability of Home Presence h
Figure indicates the different regions for giving, no giving [g = 0], small giving[0< g < gs], giving equal to gs, and large giving [g > gs], and the different regionsfor the probability of being at home, avoiding the solicitor [h < h0], and seekingthe solicitor [h > h0]. The regions are a function of the altruism parameter a andof the social pressure parameter S.
spiteful agents (a < 0) if the social pressure cost S is large enough(S > u′ (W) and hence a < 0).
Giving via Mail. Conditional on not being at home, a giverwho was informed about the fund-raising via a flyer decideswhether to give via mail gm. Note that the only reason to givevia mail is altruism. Giving via mail is increasing in altruism,provided θ > 0. For given altruism a, the level of giving viamail received by the charity (θg∗m (a)) is always smaller than thelevel of giving in person conditional on being at home (g∗ (a, S))(Lemma 1B).
Presence at Home. In the first stage, the giver opens thedoor with probability h0 if the visit is unanticipated (no flyer or,with probability 1 − r, despite a flyer). If the visit is anticipated(flyer), she optimizes h given her utility from being at home,u (W − g∗) + av (g∗, G−i) − s (g∗), and her utility from not beingat home, u (W − g∗m) + av (θg∗m, G−i):
at University of C
hicago Library on M
arch 23, 2016http://qje.oxfordjournals.org/
Dow
nloaded from

TESTING FOR ALTRUISM AND SOCIAL PRESSURE 11
maxh∈[0,1]
h [u (W − g∗) + av (g∗, G−i)− s (g∗)] + (1− h) [u (W − g∗m)
+av (θg∗m, G−i)]− c (h) .
We characterize the optimal probability of being at home, h∗(a, S),in Lemma 2 (see Appendix). It is (weakly) increasing in altru-ism: the more the giver cares about the charity (or the warmglow), the more likely she is to be at home. The exact patterndepends on the degree of social pressure (Figure I). In the caseof no social pressure (S = 0), sufficiently altruistic agents, a >a (0), give if at home and actively seek to be at home (h∗ >h0). The probability of being at home is increasing in the al-truism up to the corner solution h = 1. Less altruistic agents,a ≤ a (0), instead, do not plan to give. They are indifferent asto being at home or not, and hence do not alter the baselineprobability h0.
In the case of social pressure (S > 0), agents with lowaltruism a ≤ a (S) do not give and avoid the fund-raiser in ordernot to pay the social pressure cost. More altruistic agents witha (S) < a ≤ a0 (S) give a small amount but prefer to avoid thefund-raiser. Their giving is either entirely or partly due to socialpressure. Agents with sufficiently high altruism, a > a0 (S), careenough about the charity that they seek the interaction with thefund-raiser, despite the fact that social pressure may distort theirgiving upward.
Opt-out. Sofarwehaveassumedthat it is costly toreducetheprobability of being at home. We now allow agents to costlesslyreduce the probability of being at home to 0, for example, via aDo-Not-Disturbcheck box on the flyer. Formally, c (0)=0 and c (h)as above for h > 0.5
Opting out does not affect giving g∗(a) (conditional on beingat home) or g∗m (a) (conditional on not being at home) but only theprobability of being at home h∗ (a). As characterized in Lemma 3,h∗ (a) remains thesameas without theopt-out optionif thereis nosocial pressure and, hence, noreason toopt out. In the presence ofsocial pressure, however, the agent opts out for low altruism, a <a0 (S), since the interaction with the fund-raiser lowers utility.For higher altruism levels, instead, the agent derives positive
5. This formalization allows a costless reduction of h to 0 but not to otherlevels. This is not a restriction because agents who prefer to lower h below h0 (ata positive cost) will strictly prefer to lower h to 0 at no cost.
at University of C
hicago Library on M
arch 23, 2016http://qje.oxfordjournals.org/
Dow
nloaded from

12 QUARTERLY JOURNAL OF ECONOMICS
utility from giving. Hence, she does not opt out and the solutionis the same as in Lemma 2.
Opting out also allows us to distinguish social pressure fromself- or other-signaling. In our model, checking the opt-out boxhas nocost tothe agent. Under self- andother-signalling, instead,opting out is costly since it signals avoidance of giving. If the costis high, the agent will never opt out, and the opt-out treatmentreduces to the simple flyer treatment.
Testable Predictions. To complete the model, we assume thatthe population of agents is heterogeneous in a with c.d.f. F. Weemphasize twospecial cases: (i) Altruism and No Social Pressure,that is, the standard assumption S = 0, but a positive probabilityof altruistic individuals with a > a (0); (ii) Social Pressure andLimited Altruism, that is, allowing for social pressure S > 0, butrequiring 0 probability of altruistic individuals with a > a0 (S).6
The following propositions outline testable predictions re-garding the key outcomes, home presence and giving. Our firstprediction compares the probabilities of being at home in thetreatments without flyer, P (H)NF, with flyer, P (H)F, and withopt-out flyer P(H)OO.
PROPOSITION 1. With Altruism and No Social Pressure, theprobability P (H) is higher with flyer than without: P (H)F =P(H)OO > P (H)NF. With Social Pressure and Limited Al-truism, P (H) is lower with flyer and lowest with opt-out:P (H)NF > P (H)F ≥ P (H)OO.
In the case of Altruism and No Social Pressure, the flyerincreases home presence relative to the control group since someagents seek to meet the solicitor. The opt-out option has nodifferential effect since no one avoids the solicitor. Under SocialPressure and Limited Altruism, the opposite is true: the flyerlowers home presence as agents seek toavoid the solicitor. In thiscase, the costless opt-out possibility lowers the presence at homefurther.7 In general, the probability of being at home is higher forthe flyer group if the altruism force dominates the social pressureforce, but the opt-out option always weakly lowers the presence athome.
6. In case (ii), we also require F(a0 (S) )− F(a (S) ) > 0 to eliminate a trivialcase.
7. A sufficient (not necessary) condition for the inequality P (H)F ≥ P (H)OOto be strict is a positive mass of households with a in the left neighbourhood of a0.
at University of C
hicago Library on M
arch 23, 2016http://qje.oxfordjournals.org/
Dow
nloaded from

TESTING FOR ALTRUISM AND SOCIAL PRESSURE 13
The next proposition illustrates the impact of the differenttreatments on the unconditional probability of in-person giving,P (G).
PROPOSITION 2. With Altruism and No Social Pressure, theprobability P (G) is higher with flyer than without: P (G)F =P (G)OO > P (G)NF . With Social Pressure and Limited Al-truism, P (G) is lower with flyer and lowest with opt-out:P (G)NF > P (G)F ≥ P (G)OO.
Under Altruism andNoSocial Pressure, the flyer andopt-outtreatments leadtothe same probability of giving, since there is noreason toopt out in the absence of social pressure. The probabilityof givinginthesetwoflyertreatments is higherthanwithout flyerbecause some agents seek to stay at home. Under Social Pressureand Limited Altruism, instead, the probability of giving is lowerwith flyer and lowest with an opt-out flyer. In general, the neteffect of a flyer depends on whether the giving is more due to realaltruism (which works to increase giving) or to social pressure(which has the opposite effect).
The third prediction regards the probability of giving condi-tional on being at home, P (G|H).
PROPOSITION 3. The probability of giving conditional on beingat home is higher with flyer than without: min (P(G|H)F,P(G|H)OO)≥ P (G|H)NF .
Altruism and social pressure both lead to increases in theconditional giving probability with flyer: altruistic people aremore likely to be at home, and nongivers sort away from home.Hence, conditionally on reaching an agent at home, giving ishigher with than without flyer.
The next proposition focuses on gift size. We distinguishbetween large donations, defined as g > gs, and small donations,g ≤ gs.
PROPOSITION 4. (i) The unconditional probability of a large do-nation, P(GHI), is higher with flyer than without: P(GHI)F =P(GHI)OO ≥ P(GHI)NF (with strict inequality if F(a) < 1 ). (ii)The unconditional probability of a small donation, P(GLO) , isidentical under the simple flyer treatment and the flyer withopt out (P(GLO)F = P(GLO)OO) if S = 0 , but higher under thesimple flyer (P(GLO)F > P(GLO)OO) if S > 0 (and F(a0 (S) )−F(a (S) )> 0).
at University of C
hicago Library on M
arch 23, 2016http://qje.oxfordjournals.org/
Dow
nloaded from

14 QUARTERLY JOURNAL OF ECONOMICS
A flyer (with or without opt-out option) increases largedonations given that altruistic donors increase their probabilityof being at home. The impact of a flyer on small donations is lessobvious since small donations can reflect moderate altruism orsocial pressure. A flyer with opt-out unambiguously lowers theprobability of small donations relative toa simple flyer, given thatit simplifies thesortingout of donors motivatedbysocial pressure.
The last proposition characterizes the probability of givingvia mail.
PROPOSITION 5. The unconditional probability of a donation whilenot at home P(Gm) satisfies 0 = P(Gm)NF ≤ P(Gm)F ≤P(Gm)OO.
Without a flyer, giving via mail is zero because the giver isonly informed about the fund-raiser if she is at home. A flyerinforms the giver about the fund-raiser and, hence, she may giveeven if not at home, solong as she is sufficiently altruistic. Givingvia mail is at least as high if the flyer offers opting out as with thesimple flyer because some of the individuals who opt out becausethey would have given more than they wish in person give asmaller amount via mail.
III. EXPERIMENTAL DESIGN
Charities. The two charities in the fund-raising treatmentsare La Rabida Children’s Hospital and the East Carolina HazardCenter(ECU). Althoughbothcharities arewell-respectedregionalcharities, we chose them so that most households in our samplewould prefer one (La Rabida) to the other (ECU). To documentthese preferences, in our 2008 survey treatments we asked re-spondents to rank five charities from 1 (least liked) to 5 (mostliked). Thecharitywiththehighest averagerankis theLa RabidaChildren’s Hospital (average rank 3.95) followed by Donate Life(rank 3.79), and the Seattle Children’s Hospital (rank 3.47). Atthe bottom of the rank, belowthe ChicagoHistorical Society (rank2.96), is the East Carolina HazardCenter (rank 2.54).8 La Rabidaappears to be highly liked both because it is an in-state charitywell known to residents in the area around Chicago, and also
8. We obtain similar results when we ask the respondents to allocate $1 thatan anonymous sponsor has pledged to give toone of the five charities. (We followedup and delivered the donations.) Out of 255 respondents, 147 pledge the donationto the La Rabida charity, and only 7 choose the ECU charity.
at University of C
hicago Library on M
arch 23, 2016http://qje.oxfordjournals.org/
Dow
nloaded from

TESTING FOR ALTRUISM AND SOCIAL PRESSURE 15
because it provides health benefits to children; neither conditionapplies to ECU.
Door-to-Door Fund-Raising. Our experiment uses a door-to-door campaign because it offers the easiest implementation of thedesign. While door-to-door campaigns are common andpreviouslystudied in economics (Landry et al. 2006), it is hard to quantifyhow much money they raise. To provide some evidence, oursurvey asked respondents to recall how many times in the past12 months people have come to your door to raise money for acharity. We asked similarly phrased questions about giving viaphone, via mail, and through other channels, such as employer orfriends. Of 144 respondents who answered all of these questions,76% statedthat they hadreceivedat least one such visit, and48%of respondents reported at least three such visits. This frequencyis smaller than but comparable in magnitude to other solicitationforms: phone (86% received at least one call), mail (95% with atleast onemailing), andotherforms (83% withat least onecontact).
We also asked how much the respondents gave to thesesolicitors in total over the last 12 months. Of the respondents,40% reported donating to a door-to-door campaign, comparedto 28% in response to phone solicitations, 53% in response tomail solicitations, and 76% in response to other solicitations.The average reported total door-to-door donation in the past12 months (including nondonors) is $26, compared to $101 byphone, $1, 012 by mail, and $2, 063 by other means. However,this estimate is very sensitive to a small number of individualsreporting large sums given (in two cases $50, 000 and $60, 000)which could be due to measurement error or self-aggrandizingclaims. If we cap the donations at $1, 000, the numbers are $26by door-to-door, $66 by phone, $115 by mail, and $295 by othermeans. Hence, door-to-door solicitations are quite common, atleast in the area where the survey took place, and they raise asmaller, but not negligible, amounts.
Logistics. We employed 92 solicitors and surveyors, mostlyundergraduate students at the University of Chicago, who werepaid $9.50 per hour. All solicitors elicited contributions withinat least two treatments, and most over multiple weekends, andsimilarly for surveyors. Each solicitor and surveyor’s participa-tion in the study typically followed four steps: (1) an invita-tion to work as a paid volunteer for the research center, (2)
at University of C
hicago Library on M
arch 23, 2016http://qje.oxfordjournals.org/
Dow
nloaded from

16 QUARTERLY JOURNAL OF ECONOMICS
an in-person interview, (3) a training session, and (4) partici-pation as a solicitor and/or surveyor in the door-to-door cam-paign. Details about the recruitment process are in OnlineAppendix B.
The field experiment took place on Saturdays and Sundaysbetween April 2008 and October 2008 (both charity and surveytreatments) and then again between April 2009 and November2009 (survey treatments only). The locations are wealthy townsaround Chicago.9 Each solicitor is assigned a list of typically 25households per hour on a street, for a daily workload of either4 hours (10 am–noon and 1–3 pm) or 6 hours (10 am–noon and1–5 pm). Every hour, the solicitor moves to a different street inthe neighborhood and typically enters a different treatment. So-licitors do not know whether a treatment involves a flyer, thoughthey can presumably learn that information from observing flyerson doors. Solicitors are trained to either do charity treatmentsor survey treatments (with a small number trained to do both).A solicitor assigned to La Rabida on a given day will only dotreatments for La Rabida, and similarly for ECU or survey.
Treatments. In the treatments without flyer, solicitors knockon the door or ring the bell and, if they reach a person, proceedthrough the script (see Online Appendix C). They inform thehousehold about the charity (La Rabida or ECU), ask if they arewilling to make a donation, and if they receive a gift leave a re-ceipt. In the survey treatment, the solicitor inquires whether thehouseholdmember is willing torespondtosurvey questions aboutcharitable giving. The solicitor informs the household memberabout the duration of the survey (5 or 10 minutes) and about thepayment for completing the survey, if any ($10, $5, or none).
In the flyer treatments, the solicitor’s script is identical, butin addition a different solicitor leaves a flyer on the doorknob onthe day before the solicitation. The professionally prepared flyerindicates the time of the upcoming fund-raising (or survey) visitwithin a one-hour time interval. Figure II provides examples oftwoflyers used for the fund-raising treatment and twoflyers usedfor the 2008 survey treatments.10 In the opt-out treatments, the
9. Burr Ridge, Countryside, Flossmoor, Kenilworth, Lemont, Libertyville,Oak Brook, Oak Forest, Oak Park, Orland Park, Park Ridge, Rolling Meadows,Roselle, Schaumburg, Skoke-Evanston, and Willowbrook.
10. For a small number of observations, the flyer does not indicate the exacttime of the visit, only that there will be a visit in the next two weeks. Results forthis subgrouparequalitativelysimilartotheresults fortheflyerwiththeone-hour
at University of C
hicago Library on M
arch 23, 2016http://qje.oxfordjournals.org/
Dow
nloaded from

TESTING FOR ALTRUISM AND SOCIAL PRESSURE 17
FIGURE II
Flyer Samples
Twoexamples offlyers forthe2008 fund-raisingtreatments (toprow)andflyersfor the 2008 survey treatments (bottom row). The top-left flyer is for the opt-outtreatment, while the top-right flyer is for a flyer treatment. The bottom-row flyersare both for a 10-minute survey with flyer, the left one without payment, the rightone for a $10 payment.
at University of C
hicago Library on M
arch 23, 2016http://qje.oxfordjournals.org/
Dow
nloaded from

18 QUARTERLY JOURNAL OF ECONOMICS
FIGURE III
Experimental Treatments (Top) 2008, (Bottom) 2009
Summary of the treatments run in the door-to-door field experiments in 2008(charity and survey) and run in 2009. La Rabida and ECU are the names of thetwo charities for which the funds were raised.
flyer has a box “Check this box if you donot want tobe disturbed.”If the solicitors find the box checked, they do not knock on thedoor. The charity treatments are summarized in the top part ofFigure III.
The survey treatments are aimed at estimating the elasticityof the presence at home and of the response rate to incentives. InSection V, we use these elasticities toestimate the social pressure
interval of visit. We therefore present the results combining these treatments.Excluding the observations with the two-week window does not change any of theresults.
at University of C
hicago Library on M
arch 23, 2016http://qje.oxfordjournals.org/
Dow
nloaded from

TESTING FOR ALTRUISM AND SOCIAL PRESSURE 19
and altruism parameters. The survey questions are mostly aboutpatterns of charitablegivingin2008 andabout voterparticipationin 2009.11 Figure III summarizes the survey treatments run in2008 (top) and 2009 (bottom).
Sample and Randomization. We reached a total of 8,906households in the charity treatments, 2,018 households in the2008 survey treatments, and 10,594 households in the 2009survey treatments. From this initial sample, we exclude 1,391observations in which the households displayed a no-solicitorsign (in which case the solicitor did not contact the household)or the solicitor was not able to contact the household for otherreasons (including, for example, a lack of access to the front dooror a dog blocking the entrance). We also exclude 559 solicitor-day observations for 5 solicitors with substantial inconsistenciesin the recorded data.12 The final sample includes 7,668 house-holds in the charity treatments, 1,865 households in the 2008survey treatments, and 10,035 households in the 2009 surveytreatments.
The charity field experiment took place in 2008 in threewaves. In the first wave (April 27 to June 1), we solicited forboth charities (with equal weights) and all three treatments(approximate weights of 40% for no-flyer, 35% flyer, 25% opt-out). In the second wave (July 13 to August 23), we solicited onlyfor La Rabida and ran only no-flyer and flyer treatments (withequal weights). In the third wave (September 6 to October 18) wesolicited for both charities (the ECU charity is over-sampled withweight 75%) and all treatments (approximate weights of 25% forno-flyer, 50% flyer, 25% opt-out). The script of the randomizationand the flyer design is the same throughout. Within each of thesewaves, the randomization of the treatments takes place for eachsolicitor-hour and is at the street level within a town.
IV. REDUCED-FORM ESTIMATES
We report the differences across the treatments in the shareof households answering the door, the empirical counterpart of
11. In the 2009 survey treatments, about half of the flyers specify that thesurvey will be about voter participation. The results are similar for the two typesof flyers and hence we pool them in the analysis.
12. These five solicitors indicate the presence of flyers on the door or on thefloor also for households in the no-flyer treatment.
at University of C
hicago Library on M
arch 23, 2016http://qje.oxfordjournals.org/
Dow
nloaded from

20 QUARTERLY JOURNAL OF ECONOMICS
P (H), and the share of households giving to the charity in per-son, corresponding to P (G). We also present results on givingconditional on being at home, corresponding to P (G|H), on thefrequency of small and large donations, P(GLO) and P(GHI), andon giving via mail and Internet, P (Gm).
Table I presents the summary statistics on the key treatmentoutcomes. The rate at which the respondents open the door variesbetween 41% and 42% in the baseline treatments for La Rabida,ECU, and in the 2008 survey treatment. Since households did notknow the task at hand, these averages ought, indeed, to be close.The share answering the door is smaller for the flyer treatmentand smaller yet for the opt-out treatment. The share of givers issubstantially smaller for the ECU charity than for the La Rabidacharity, consistent with our survey evidence that the La Rabidacharity is more liked than the ECU charity. For ECU, the shareof givers is substantially lower in the opt-out treatment than inthe other treatments. For La Rabida, instead, giving is somewhathigher in the opt-out treatment. In the survey treatments, theshare opening the door and the share completing the survey aregenerally larger for the treatments with higher pay and shorterduration both in 2008 and 2009.
While the summary statistics provide suggestive evidence onthe impact of the treatments, the raw statistics are potentiallyconfounded with randomization fixed effects. As discussed inSection III, treatments were randomized within a date-solicitortime block, but not all treatments were run in all time periods.Hence, estimates that do not control for the randomization fixedeffects may be confounded, for example, by time effects—we ranmore ECU treatments later in the sample when donation ratesalso happened to be lower. It turns out that all directional effectsindicated in the summary statistics, except for the higher givingto La Rabida under opt-out, are confirmed once we add therandomization fixed effects.
The benchmark empirical specifications (Table II) controlfor solicitor i and day-town t fixed effects.13 The identificationcomes from within-solicitor, within-day variation in treatment.The vector of control variables Xi,t,h includes dummies for thehourly time blocks h (10 am, 11 am, 1 pm, 2 pm, 3 pm, and 4 pm),and dummies for a subjective rating by the solicitor of the quality
13. On almost all days, we visited only one town, so that the day-town fixedeffects are essentially equivalent to day fixed effects.
at University of C
hicago Library on M
arch 23, 2016http://qje.oxfordjournals.org/
Dow
nloaded from

TESTING FOR ALTRUISM AND SOCIAL PRESSURE 21
TA
BL
EI
SU
MM
AR
YS
TA
TIS
TIC
S
Pan
elA
:Fu
nd
-rai
sin
gtr
eatm
ents
Var
iabl
e:S
har
eof
hou
seh
old
san
swer
ing
the
doo
rS
har
eof
hou
seh
old
sgi
vin
gIn
per
son
Nu
mbe
rof
hou
seh
old
sgi
vin
gvi
am
ail
orin
tern
et
Sam
ple
:P
oole
dE
CU
La
Rab
ida
Poo
led
EC
UL
aR
abid
aE
CU
La
Rab
ida
(1)
(2)
(3)
(4)
(5)
(6)
(7)
(8)
Bas
elin
e(n
o-fl
yer)
trea
tmen
t0.
4090
0.42
280.
4032
0.06
290.
0507
0.06
80Z
ero
don
atio
ns
acro
ssal
ltr
eatm
ents
On
e($
25)
don
atio
nac
ross
all
trea
tmen
ts(N
=31
66)
(N=
946)
(N=
2220
)F
lyer
trea
tmen
t0.
3753
0.39
930.
3628
0.05
850.
0460
0.06
50(N
=34
32)
(N=
1172
)(N
=22
60)
Fly
erw
ith
opt-
out
trea
tmen
t0.
3355
0.35
030.
3174
0.05
140.
0289
0.07
88(N
=10
70)
(N=
588)
(N=
482)
NN
=76
68N
=27
06N
=49
62N
=76
68N
=27
06N
=49
62N
=27
06N
=49
62
at University of C
hicago Library on M
arch 23, 2016http://qje.oxfordjournals.org/
Dow
nloaded from

22 QUARTERLY JOURNAL OF ECONOMICS
TA
BL
EI
(CO
NT
INU
ED
)
Pan
elB
:Su
rvey
trea
tmen
ts
Var
iabl
e:
Sh
are
ofh
ouse
hol
ds
answ
erin
gth
ed
oor
Sh
are
ofh
ouse
hol
ds
com
ple
tin
gth
esu
rvey
Sh
are
ofh
hs.
answ
erin
gth
ed
oor
Sh
are
ofh
hs.
com
ple
tin
gth
esu
rvey
2008
surv
eytr
eatm
ents
(1)
(2)
2009
surv
eytr
eatm
ents
(3)
(4)
Bas
elin
e($
0/10
min
)tr
eatm
ent
0.41
35(N
=60
7)0.
0972
Bas
elin
e($
0/5m
in)
0.39
15(N
=14
20)
0.14
72F
lyer
($0/
10m
in)
trea
tmen
t0.
3681
(N=
489)
0.11
86B
asel
ine
($5/
5min
)0.
3956
(N=
910)
0.12
31F
lyer
($0/
5min
)tr
eatm
ent
0.39
2(N
=44
9)0.
1714
Fly
er($
0/10
min
)0.
3771
(N=
769)
0.14
30F
lyer
($10
/10m
in)
trea
tmen
t0.
4156
(N=
320)
0.17
19F
lyer
($0/
5min
)0.
3852
(N=
1703
)0.
1679
NN
=18
65N
=18
65F
lyer
($5/
5min
)0.
4057
(N=
1856
)0.
2085
Fly
er($
10/5
min
)0.
4428
(N=
673)
0.26
00O
pt-
out
($0/
5min
)0.
3420
(N=
1374
)0.
1434
Op
t-ou
t($
5/5m
in)
0.36
39(N
=13
30)
0.17
97N
N=
1003
5N
=10
035
Not
es.
Su
mm
ary
stat
isti
csfo
rth
eva
riab
les
ofth
eex
per
imen
t.”E
CU
”an
d”L
aR
abid
a”in
dic
ate
the
two
char
itie
sin
the
exp
erim
ent,
”EC
U”
isan
out-
of-s
tate
rese
arch
cen
ter
onh
urr
ican
es,”
La
Rab
ida”
isan
in-s
tate
chil
dre
n’s
hos
pit
al.
at University of C
hicago Library on M
arch 23, 2016http://qje.oxfordjournals.org/
Dow
nloaded from

TESTING FOR ALTRUISM AND SOCIAL PRESSURE 23
TA
BL
EII
RE
SU
LT
SF
OR
FU
ND
-RA
ISIN
GT
RE
AT
ME
NT
S
Sp
ecifi
cati
on:
OL
Sre
gres
sion
s
Ind
icat
orfo
rIn
dic
ator
for
Ind
icat
orfo
rgi
vin
gA
mou
nt
give
nD
ep.v
ar.:
answ
erin
gth
ed
oor
givi
ng
Sm
all
amou
nt
(≤$1
0)L
arge
amou
nt
(>$1
0)(i
ncl
ud
ing
$0)
(1)
(2)
(3)
(4)
(5)
(6)
(7)
(8)
(9)
(10
)
Fly
ertr
eatm
ent
−0.
0387
−0.
0011
−0.
0033
0.00
22−
0.14
59(0
.013
7)∗∗∗
(0.0
062)
(0.0
052)
(0.0
035)
(0.1
357)
Fly
erw
ith
opt-
out
−0 .
0967
−0 .
0195
−0 .
0193
−0 .
0002
−0 .
3041
trea
tmen
t(0
.019
4)∗∗∗
(0.0
084)∗∗
(0.0
081)∗∗
(0.0
051)
(0.1
653)∗
Ind
icat
orE
CU
0.01
0.00
41−
0.02
49−
0.02
63−
0.01
27−
0.01
07−
0.01
23−
0.01
55−
0.76
11−
0.97
67ch
arit
y(0
.014
3)(0
.023
4)(0
.004
9)∗∗∗
(0.0
085)∗∗∗
(0.0
053)∗∗
(0.0
085)
(0.0
032)∗∗∗
(0.0
052)∗∗∗
(0.1
368)∗∗∗
(0.2
014)∗∗∗
Fly
ertr
eatm
ent
−0.
0365
0.00
06−
0.00
450.
0051
0.11
54*
EC
Uch
arit
y(0
.031
3)(0
.009
4)(0
.007
6)(0
.004
5)(0
.124
0)F
lyer
wit
hop
t-ou
t−
0.08
9−
0.01
83−
0.02
220.
0039
−0.
0907
*E
CU
char
ity
(0.0
271)∗∗∗
(0.0
100)∗
(0.0
098)∗∗
(0.0
058)
(0.1
268)
Fly
ertr
eatm
ent
−0.
0396
−0.
0019
−0.
0028
0.00
09−
0.25
45*
La
Rab
ida
char
ity
(0.0
144)∗∗∗
(0.0
078)
(0.0
066)
(0.0
046)
(0.1
841)
Fly
erw
ith
opt-
out
−0.
106
−0.
0202
−0.
0161
−0.
0042
−0.
4573
*L
aR
abid
ach
arit
y(0
.031
9)∗∗∗
(0.0
132)
(0.0
128)
(0.0
087)
(0.2
885)
Om
itte
dtr
eatm
ent
No-
flye
r,L
aR
abid
aN
o-fl
yer,
La
Rab
ida
No-
flye
r,L
aR
abid
aN
o-fl
yer,
La
Rab
ida
Mea
nof
dep
.var
.for
omit
ted
trea
tmen
t0.
413
0.07
170.
0414
0.04
140.
0215
0.02
151.
161
1.16
1F
ixed
effe
cts
for
XX
XX
XX
XX
XX
soli
cito
r,d
ate-
loca
tion
,hou
r,an
dar
eara
tin
gN
N=
7668
N=
7668
N=
7668
N=
7668
N=
7668
N=
7668
N=
7668
N=
7668
N=
7668
N=
766 8
Not
es.
Est
imat
esfo
ra
lin
ear
pro
babi
lity
mod
el,
wit
hst
and
ard
erro
rscl
ust
ered
byso
lici
tor-
dat
e,in
par
enth
eses
.T
he
omit
ted
trea
tmen
tis
the
base
lin
en
o-fl
yer
fun
d-r
aisi
ng
trea
tmen
tfo
rth
eL
aR
abid
ach
arit
y.T
he
regr
essi
ons
incl
ud
efi
xed
effe
cts
for
the
soli
cito
r,fo
rth
ed
ate-
tow
nco
mbi
nat
ion
,for
the
hou
rof
day
,an
dfo
ra
subj
ecti
vera
tin
gof
hom
eva
lues
inth
ebl
ock
.∗
s ign
ifica
nt
at10
%;∗∗
s ign
ifica
nt
at5%
;∗∗∗
s ign
ifica
nt
at1%
.
at University of C
hicago Library on M
arch 23, 2016http://qje.oxfordjournals.org/
Dow
nloaded from
24 QUARTERLY JOURNAL OF ECONOMICS
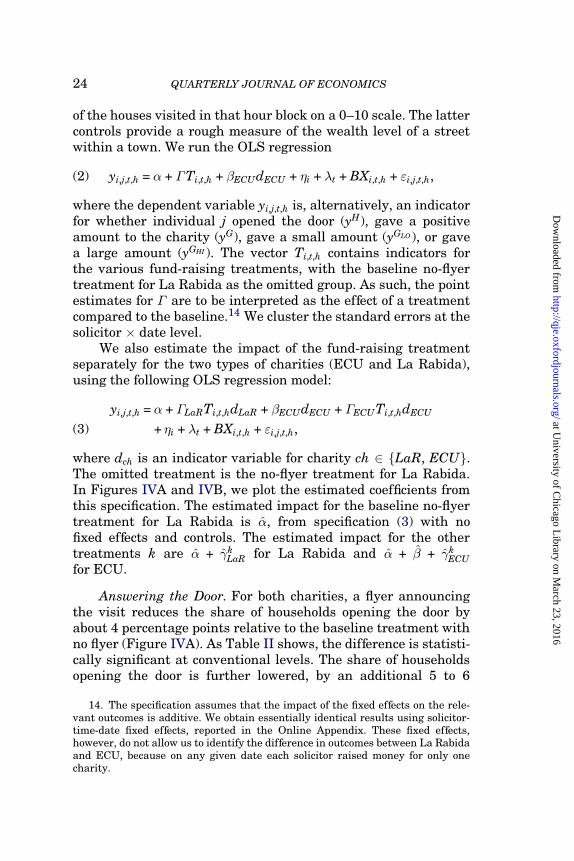
of the houses visited in that hour block on a 0–10 scale. The lattercontrols provide a rough measure of the wealth level of a streetwithin a town. We run the OLS regression
(2) yi,j,t,h = α + ΓTi,t,h + βECUdECU + ηi + λt + BXi,t,h + εi,j,t,h,
where the dependent variable yi,j,t,h is, alternatively, an indicatorfor whether individual j opened the door (yH), gave a positiveamount to the charity (yG), gave a small amount (yGLO), or gavea large amount (yGHI ). The vector Ti,t,h contains indicators forthe various fund-raising treatments, with the baseline no-flyertreatment for La Rabida as the omitted group. As such, the pointestimates for Γ are to be interpreted as the effect of a treatmentcompared tothe baseline.14 We cluster the standard errors at thesolicitor× date level.
We also estimate the impact of the fund-raising treatmentseparately for the two types of charities (ECU and La Rabida),using the following OLS regression model:
yi,j,t,h = α + ΓLaRTi,t,hdLaR + βECUdECU + ΓECUTi,t,hdECU
+ ηi + λt + BXi,t,h + εi,j,t,h,(3)
where dch is an indicator variable for charity ch ∈ {LaR, ECU}.The omitted treatment is the no-flyer treatment for La Rabida.In Figures IVA and IVB, we plot the estimated coefficients fromthis specification. The estimated impact for the baseline no-flyertreatment for La Rabida is α, from specification (3) with nofixed effects and controls. The estimated impact for the othertreatments k are α + γk
LaR for La Rabida and α + β + γkECU
for ECU.
Answering the Door. For both charities, a flyer announcingthe visit reduces the share of households opening the door byabout 4 percentage points relative to the baseline treatment withnoflyer (Figure IVA). As Table II shows, the difference is statisti-cally significant at conventional levels. The share of householdsopening the door is further lowered, by an additional 5 to 6
14. The specification assumes that the impact of the fixed effects on the rele-vant outcomes is additive. We obtain essentially identical results using solicitor-time-date fixed effects, reported in the Online Appendix. These fixed effects,however, donot allowus toidentify the difference in outcomes between La Rabidaand ECU, because on any given date each solicitor raised money for only onecharity.
at University of C
hicago Library on M
arch 23, 2016http://qje.oxfordjournals.org/
Dow
nloaded from
TESTING FOR ALTRUISM AND SOCIAL PRESSURE 25
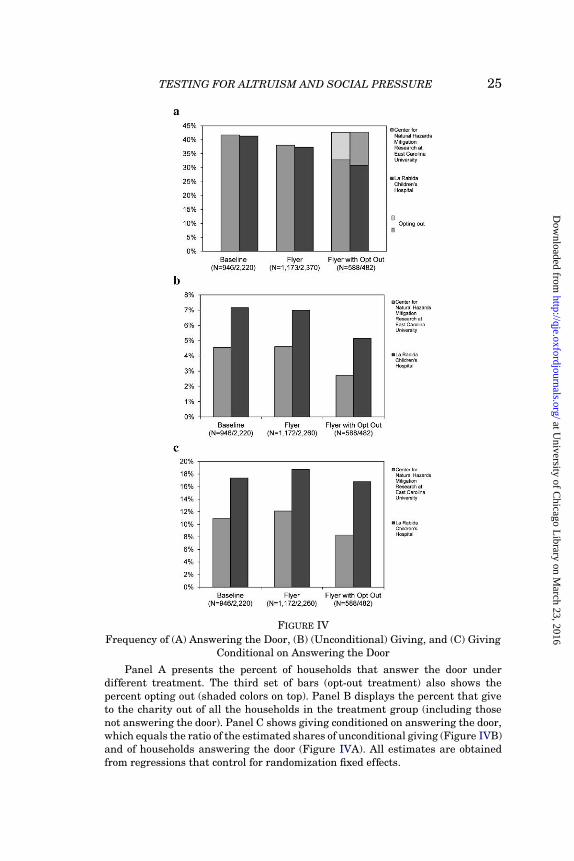
FIGURE IVFrequency of (A) Answering the Door, (B) (Unconditional) Giving, and (C) Giving
Conditional on Answering the Door
Panel A presents the percent of households that answer the door underdifferent treatment. The third set of bars (opt-out treatment) also shows thepercent opting out (shaded colors on top). Panel B displays the percent that giveto the charity out of all the households in the treatment group (including thosenot answering the door). Panel C shows giving conditioned on answering the door,whichequals theratioof theestimatedshares of unconditional giving(Figure IVB)and of households answering the door (Figure IVA). All estimates are obtainedfrom regressions that control for randomization fixed effects.
at University of C
hicago Library on M
arch 23, 2016http://qje.oxfordjournals.org/
Dow
nloaded from

26 QUARTERLY JOURNAL OF ECONOMICS
percentage points, by the presence of an opt-out condition (Checkthis box if you do not want to be disturbed) on the flyer. Hence, theflyer and the opt-out conditions lower the probability of openingthe door by, respectively, 10% and 25%, an economically largeeffect that is similar for both charities. We interpret this evidenceas suggestive of social pressure: when informed of a visit by asolicitor, households attempt to avoid the interaction, especiallywhen doing so has little cost, as in the opt-out treatment. Noticethat the reduction in the probability of opening the door in thepresence of a flyer can be due to two factors: a lower probabilityof being at home, or a lower probability of opening the doorconditional on being at home. The variable we measure capturesthe sum of these two effects.
Opting Out. FigureIVA alsopresents evidenceontheshareofsubjects in the opt-out treatment that check the opt-out box: 12%of all households for the La Rabida charity and 9.9% for the ECUcharity. Households that, in the flyer treatment, are explicitlyavoiding the solicitor by not answering the door, instead use theopt-out option when available. This result is consistent with theassumption that checking the opt-out box is a cheaper way toavoid a solicitor.
Unconditional Giving. Figure IVB presents theresults ontheunconditional giving probability, including households that donot answer the door. Not surprisingly, giving is higher for thepreferred charity, La Rabida, than for ECU in each treatment.The pattern of effects across treatments is similar for the twocharities. The baseline and the flyer treatments have essentiallythe same share of giving. The lack of a difference between thesetreatments is estimated quite precisely because we overweightedthebaselineandflyertreatments. Theopt-out treatment, instead,lowers giving by 2 percentage points for both charities. Thisdifference is statistically and economically significant (see TableII): the effect amounts to a reduction in giving of about a thirdrelative to the other treatments.
The first result—that the flyer per se does not affect giving—is consistent with both social pressure and altruism affectingcharitable giving. The advance notice increases the presence athome of the altruisticgivers and lowers the presence of those whogive due to social pressure. To the extent that these two forcesare of about the same size, we expect nooverall impact. Note that
at University of C
hicago Library on M
arch 23, 2016http://qje.oxfordjournals.org/
Dow
nloaded from

TESTING FOR ALTRUISM AND SOCIAL PRESSURE 27
this result does not contradict our previous finding that the flyersignificantly reduces the share of households opening the door. Inthe presence of social pressure costs, nongivers alsoavoidbeing athome when notified with a flyer. This avoidance does not impactthe probability of giving, but it lowers home presence.
The second result—that the opt-out option significantly low-ers giving—points to the importance of social pressure: in theopt-out treatment the cost of avoiding the fund-raiser is substan-tially lowered, and giving decreases proportionally. If giving wasprimarily due to altruism, the opt-out option should not affectgiving rates or levels.
Conditional Giving. For both charities, the share ofhouseholds that give among those who answer the door15 ishigher inthetreatments withflyerthaninthebaselinetreatment(Figure IVC). This increase is consistent with Proposition 3 sincethe flyer allows sorting in by donors who want to give andsorting out by those who do not want to give. In the opt-outtreatment, however, conditional giving is lower. This effectis inconsistent with Proposition 3, though not statisticallysignificant at conventional significance levels.
Amount of Giving. In our model, individuals who give due tosocial pressure give at most gS, whereas individuals whogive duetoaltruismmaycontributehigheramounts. Hence, relativetothecontrol treatment, the flyer treatment may both decrease smallerdonations (sorting out of social-pressure givers) and increaselarger donations (sorting in of altruists). The opt-out treatment,which further facilitates sorting out but not sorting in, shouldlower the share of small donations but not the share of largerdonations (Proposition 4).
To test these predictions, we split donations based on themedian amount given, $10, and label donations smaller than (orequal to) $10 as small and donations larger than $10 as large.Figure V presents the results. In the baseline treatment, 4% ofhouseholds give small donations, and 2% give large donations.The percentage giving a small donation decreases slightly in theflyer treatment and decreases by 2.1 percentage points in the opt-out treatment. Hence, the opt-out option more than halves the
15. The conditional giving for each treatment is the estimated unconditionalgiving, Figure IVB, divided by the estimated share of households answering thedoor, Figure IVA.
at University of C
hicago Library on M
arch 23, 2016http://qje.oxfordjournals.org/
Dow
nloaded from

28 QUARTERLY JOURNAL OF ECONOMICS
FIGURE V
Frequency of Giving: Small versus Large (Pooled)
Figure presents the results on (unconditional) giving of small (≤$10) andlarge(>$10) donations across treatment. The estimates are obtained from regressionsthat control for randomization fixed effects.
likelihood of a small donation, a significant difference as shownin Table II. The pattern is very different for large donations.The flyer somewhat increases the incidence of larger donations,though not significantly, andthe opt-out option has noeffect. Thispattern is consistent with Proposition 4.
Figure VI presents additional information on the distributionof the amount given across treatments. The opt-out treatment,compared to the baseline treatment, induces a decrease in thedonations up to $10, but no change in larger donations. Thehistogram also provides evidence of bunching at $5 and $10.In the structural model, we use this information and consider$10 as the amount that eliminates all social pressure from notgiving, gs.
Finally, in columns (9) and (10) of Table II we considerthe effect of the different treatments on the amount given.There is no significant effect of the flyer treatment, and amarginally significant reduction in giving with the opt-outtreatment.
Robustness. We examine the robustness of specification (2)in Table II to: (i) omitting the dummy for the ECU charity; and(ii) introducing fixed effects for solicitor-day-location fixed effects,
at University of C
hicago Library on M
arch 23, 2016http://qje.oxfordjournals.org/
Dow
nloaded from

TESTING FOR ALTRUISM AND SOCIAL PRESSURE 29
FIGURE VI
Distribution of Amounts Donated
Figure displays the distribution of donation amounts across different treat-ment groups. Each bar indicates the percentage giving the specified amount outof all households in the treatment. The figure does not display the share ofhouseholds donating $0. The estimates are obtained from regressions that controlfor randomization fixed effects.
which allows for different solicitor fixed effects on different daysor towns. Online Appendix Table 1 shows that the estimates areessentially identical.
In Online Appendix Table II, we estimate separately theresults for the three experimental waves in 2008: April to June(wave1), JulyandAugust (wave2), SeptemberandOctober(wave3). Theresults inthefirst andsecondwaves fortheflyertreatmentare consistent (in wave 2 we did not run an opt-out treatment): inboth waves the share answering the door significantly decreasesin response toa flyer, andthere is noeffect on the share giving. Inthe third wave, we obtain similar effects as in the previous wavesfor the share answering the door, but somewhat different effectson giving. In this time period, which coincides with the peakof the financial crisis, the level of giving is substantially lower.Given this lower level, a flyer (marginally) increases giving,mostly in the form of larger donations; a flyer with opt-out optionstill lowers giving, though less so than in previous waves. Theseresults are consistent with the crisis reducing giving due to lowersocial pressure cost of turning away a solicitor (“sorry, times aretough”), but thesamplesize inthis periodis toosmall todrawfirmconclusions.
at University of C
hicago Library on M
arch 23, 2016http://qje.oxfordjournals.org/
Dow
nloaded from

30 QUARTERLY JOURNAL OF ECONOMICS
Giving via Mail or Internet. We also obtained data on mailand Internet donations from the households in our sample overthe time period of the fund-raising campaign. The results arereported in columns (7) and (8) of Table I. There was not a singledonation toECU, and only one donation toLa Rabida—a strikingdifference comparedtothe 3–7% of households donating in personfor the same charities. The near absence of donations providesfurther evidence on the motivations of giving. If giving was due topurealtruism, individuals whoseetheflyerbut cannot beat homeduring the fund-raiser would donate via mail or Internet. Thecost of this form of giving (captured by θ in our model) attenuatesgiving, but not likely to be zero. A model of warm glow can betterfit the data if we assume that the warm glow arises only from in-person donations (i.e., θ is close to 0). The lack of mail or Internetdonations is also consistent with social pressure: giving arisesonly under high social pressure.
Survey. For the survey treatments, we estimate a specifi-cation parallel to equation (2), separately for the 2008 and the2009 field experiments. In the 2008 experiments (Figure VII (top)and column (1) of Table III), a flyer announcing a $0 10-minutesurvey reduces the share opening the door by 15% (though notsignificantly), compared to the same survey without flyer. Inaddition, flyers for more attractive surveys with either shorterduration (5 minutes) or higher payment ($10) lead to a 10–15%increase in the share of households opening the door, indicatingthat households sort intoshorter and better-paid surveys, thoughthe difference is again not significant.
The share completing the survey is comparable (about 10%)for the $0 10-minute conditions with andwithout flyer (Figure VII(top) and column (2) of Table III). Interestingly, the willingness tocomplete an unpaid 10-minute survey is higher than the willing-ness to give money even to an in-state charity. Also, compared tothe $0 10-minute survey with flyer, surveys with shorter durationor payment have a higher completion rate of 17–18%, a 70–80%increase. The increase is very similar for the two groups, indicat-ing a high value of time for survey completion, consonant with thesample population characteristics.
Figure VII (bottom) and columns (3) and (4) of Table IIIreport theresults forthe2009 survey. Withinthetreatments withflyer, the share answering the door is increasing in the amountpaid (from $0 to $5 to $10). In addition, the share answering is
at University of C
hicago Library on M
arch 23, 2016http://qje.oxfordjournals.org/
Dow
nloaded from

TESTING FOR ALTRUISM AND SOCIAL PRESSURE 31
FIGURE VII
Surveys: (Top) 2008 Experiment, (Bottom) 2009 Experiment
Figures present the percent of households answering the door and the percentcompleting the survey (out of all households) in the survey treatment run in 2008(top) and 2009 (bottom). The estimates are obtained from regressions that controlfor randomization fixed effects.
significantly lower for the treatments with opt-out, especially thetreatment with no payment. These findings are consistent withthe findings for 2008 and confirm a sizable responsiveness of thepresence at home to the attractiveness of the task.
at University of C
hicago Library on M
arch 23, 2016http://qje.oxfordjournals.org/
Dow
nloaded from

32 QUARTERLY JOURNAL OF ECONOMICS
TA
BL
EII
I
RE
SU
LT
SF
OR
SU
RV
EY
TR
EA
TM
EN
TS
Sp
ecifi
cati
on:
OL
Sre
gres
sion
s
Sam
ple
:20
08S
urv
ey20
09S
urv
ey
Ind
icat
orfo
rIn
dic
ator
for
Ind
icat
orfo
rIn
dic
ator
for
Dep
end
ent
vari
able
:an
swer
ing
the
doo
rco
mp
leti
ng
surv
eyan
swer
ing
the
doo
rco
mp
leti
ng
surv
ey(1
)(2
)(3
)(4
)
Fly
er($
0/10
min
)tr
eatm
ent
−0.
0563
0.00
00(0
.037
7)(0
.026
0)F
lyer
($0/
5min
)tr
eatm
ent
−0.
0021
0.07
94(0
.033
4)(0
.023
3)∗∗∗
Fly
er($
10/1
0min
)tr
eatm
ent
−0.
0105
0.06
95(0
.044
8)(0
.026
5)∗∗
Bas
elin
e($
5/5m
in)
trea
tmen
t−
0.00
96−
0.02
40(0
.021
7)(0
.017
6)F
lyer
($0/
10m
in)
trea
tmen
t−
0.01
98−
0.00
08(0
.024
7)(0
.018
0)F
lyer
($0/
5min
)tr
eatm
ent
−0.
0193
0.02
43(0
.018
9)(0
.013
2)∗
Fly
er($
5/5m
in)
trea
tmen
t0.
0028
0.05
49(0
.020
5)(0
.016
4)∗∗∗
Fly
er($
10/5
min
)tr
eatm
ent
0.03
680.
1072
(0.0
243)
(0.0
187)∗∗∗
at University of C
hicago Library on M
arch 23, 2016http://qje.oxfordjournals.org/
Dow
nloaded from

TESTING FOR ALTRUISM AND SOCIAL PRESSURE 33
TA
BL
EII
I
(CO
NT
INU
ED
)
Sp
ecifi
cati
on:
OL
Sre
gres
sion
s
Sam
ple
:20
08S
urv
ey20
09S
urv
ey
Ind
icat
orfo
rIn
dic
ator
for
Ind
icat
orfo
rIn
dic
ator
for
Dep
end
ent
vari
able
:an
swer
ing
the
doo
rco
mp
leti
ng
surv
eyan
swer
ing
the
doo
rco
mp
leti
ng
surv
ey(1
)(2
)(3
)(4
)
Op
t-ou
t($
0/5m
in)
trea
tmen
t−
0.05
83−
0.00
26(0
.022
7)∗∗
(0.0
160)
Op
t-ou
t($
5/5m
in)
trea
tmen
t−
0.03
730.
0259
(0.0
192)∗
(0.0
162)
Om
itte
dtr
eatm
ent
Bas
elin
e($
0/10
min
)B
asel
ine
($0/
5min
)M
ean
ofd
ep.v
ar.f
or0.
4138
0.10
250.
3915
0.14
98om
itte
dtr
eatm
ent
Fix
edef
fect
sfo
rso
lici
tor,
dat
e-lo
cati
on,h
our,
and
XX
XX
area
rati
ng
NN
=18
65N
=18
65N
=10
035
N=
1003
5
Not
es.
Est
imat
esfo
ra
lin
ear
pro
babi
lity
mod
elw
ith
stan
dar
der
rors
,cl
ust
ered
byso
lici
tor-
dat
e,in
par
enth
eses
.T
he
omit
ted
trea
tmen
tis
the
base
lin
en
o-fl
yer
$0–1
0m
inu
tes
surv
eyfo
rco
lum
ns
(1)a
nd
(2)a
nd
the
base
lin
en
o-fl
yer
$0–5
min
ute
ssu
rvey
for
colu
mn
s(3
)an
d(4
).T
he
regr
essi
ons
incl
ud
efi
xed
effe
cts
for
the
soli
cito
r,fo
rth
ed
ate-
tow
nco
mbi
nat
ion
,fo
rth
eh
our
ofd
ay,a
nd
for
asu
bjec
tive
rati
ng
ofh
ome
valu
esin
the
bloc
k.∗
sign
ifica
nt
at10
%;∗∗
sign
ifica
nt
at5%
;∗∗∗
sign
ifica
nt
at1%
at University of C
hicago Library on M
arch 23, 2016http://qje.oxfordjournals.org/
Dow
nloaded from

34 QUARTERLY JOURNAL OF ECONOMICS
The2009 treatments alsoindicatea strongresponseof surveycompletion with respect to duration and payment. The surveycompletion rate in treatments with flyer increases monotonicallyfrom 14.8% for a $0 10-minute survey to25.5% for a $10 5-minutesurvey. The latter completion rate is remarkably high: over 50%of the people opening the door took the survey. There is a similarincrease in survey completion with respect to payment in theopt-out treatments, though not in the treatments without flyer.
V. STRUCTURAL ESTIMATES
The reduced-form estimates provide qualitative evidence onthe importance of both altruism and social pressure, but theydo not allow for a quantitative estimate of the underlying so-cial preferences. We now estimate the model parameters struc-turally, combining the results of the fund-raising and the surveyexperiments.
Set-up. We estimate the model of Section II, imposing sevenadditional assumptions, several of which are relaxedbelow. First,the private utility of consumption is linear, u(W−g)= W−g. Thisassumption is not unduly restrictive since utility shouldbe locallylinearinastandardexpectedutilityframework. Second, thealtru-ism parameter a comes from a normal distribution with mean μand variance σ2 censored below at 0, with the remaining proba-bility mass assignedtoa=0. Third, the altruism function is v(gi)=log (Γ + gi); the parameter Γ governs the concavity of the altruismfunction for a > 0: a large Γ implies that the marginal utility ofgiving, givenby a
(Γ+gi), declines onlyslowly intheindividual giving
gi, consistent with pure altruism—the individual cares about theoverall donation and her individual giving is only a small part.A small Γ instead indicates that the marginal utility diminishessteeply with the individual giving, more consistent with warmglow. Fourth, the social pressure cost S is homogeneous. Fifth,the level of giving gS from which on there is no social pressurecost is $10, the median donation. Sixth, the cost of leaving homec(h) is symmetricaround h0 and quadratic: c(h)= (h−h0)2
2η . Seventh,to capture the lack of giving by mail, we set θ = 0.
To model behavior in the survey treatments, we assume abaseline utility s of completing a 10-minute survey for no mon-etary payment, with s ∼ Fs, a normal distribution with parame-ters μs and σs. Hence, we allow s to be negative for households
at University of C
hicago Library on M
arch 23, 2016http://qje.oxfordjournals.org/
Dow
nloaded from

TESTING FOR ALTRUISM AND SOCIAL PRESSURE 35
that dislike doing surveys without compensation. In addition,individuals receive utility from a payment m for completing thesurvey, and receive disutility from the time cost t of the survey,both of which are deterministic. Given the assumption above of(locally) linear utility, we add these terms to obtain the overallutility from completing a survey: s + m − t. The time cost tequals τvs, where τ is the duration of the survey in fraction ofhours, and vs is the value of one hour of time (see below). Wedenote by Ss the social pressure cost of saying no to a surveyrequest.
The agent undertakes the survey if s + m − t is larger than−Ss. The threshold sm,t =−Ss− (m− t) is the lowest level of s suchthat individuals will agree to complete the survey if asked. Anincrease in the social pressure Ss or in the pay m, or a decrease inthe cost of time t will lower the threshold and hence increase theprobability of survey completion. The decision problem of stayingat home conditional on receiving a notice is
maxh∈[0,1]
hmax (s + m− t,−Ss)−(h− h0)
2
2η.
Taking into account corner solutions for h∗, this leads to a so-lution for the probability of being at home: h∗ = max[min[h0 +ηmax (s + m− t,−Ss), 1], 0].
The vector of parameters ξ that we estimate are: (i) h20080
and h20090 —the probabilities of opening the door in the 2008
and 2009 no-flyer treatments; (ii) r—the probability of observing(and remembering) the flyer; (iii) η—the responsiveness of theprobability of opening the door to the desirability of being athome; (iv) μs and σs—the mean and standard deviation of thedistribution Fs of the utility of completing a 10-minute survey; (v)vs—the value of one hour of time spent completing a survey; (vi)Ss—the social pressure associated with saying no to the surveyrequest; (vii) μch
a and σcha (where ch = LaR, Ecu)—the mean and
standard deviation of the censored normal distribution F fromwhich the altruism parameter a is drawn; (viii) Γ—the curvatureof the altruism function, which is assumed to be the same for thetwo charities; (ix) Sch (ch = LaR, Ecu)—the social pressure costassociated with a donation request; the tables display the socialpressure cost associated with giving zero, SgS = 10S.
To estimate the model, we use a minimum-distance estima-tor. Denote by m (ξ) the vector of moments predictedby the theoryas a function of the parameters ξ, and by m the vector of observed
at University of C
hicago Library on M
arch 23, 2016http://qje.oxfordjournals.org/
Dow
nloaded from
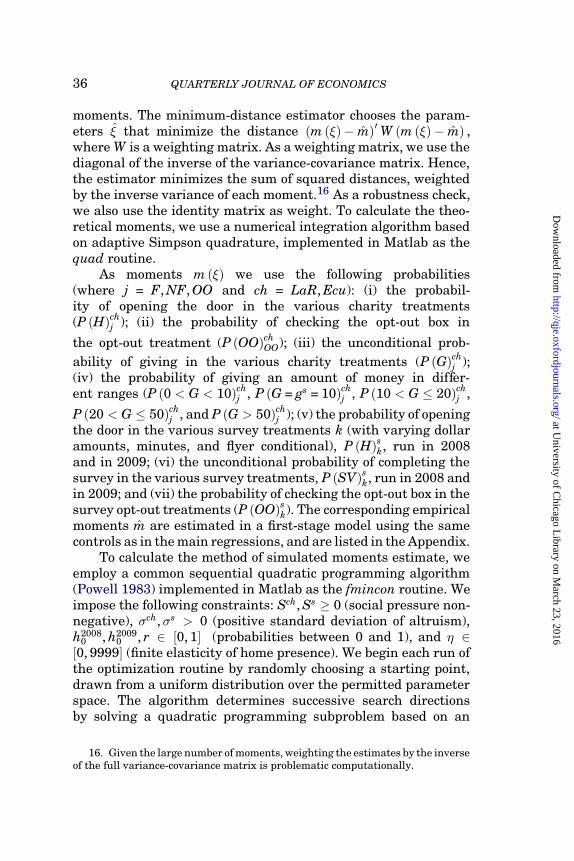
36 QUARTERLY JOURNAL OF ECONOMICS
moments. The minimum-distance estimator chooses the param-eters ξ that minimize the distance (m (ξ)− m)′W (m (ξ)− m) ,where W is a weighting matrix. As a weighting matrix, we use thediagonal of the inverse of the variance-covariance matrix. Hence,the estimator minimizes the sum of squared distances, weightedby the inverse variance of each moment.16 As a robustness check,we also use the identity matrix as weight. To calculate the theo-retical moments, we use a numerical integration algorithm basedon adaptive Simpson quadrature, implemented in Matlab as thequad routine.
As moments m (ξ) we use the following probabilities(where j = F, NF, OO and ch = LaR, Ecu): (i) the probabil-ity of opening the door in the various charity treatments(P (H)ch
j ); (ii) the probability of checking the opt-out box in
the opt-out treatment (P (OO)chOO); (iii) the unconditional prob-
ability of giving in the various charity treatments (P (G)chj );
(iv) the probability of giving an amount of money in differ-ent ranges (P (0 < G < 10)ch
j , P (G = gs = 10)chj , P (10 < G ≤ 20)ch
j ,
P (20 < G ≤ 50)chj , andP (G > 50)ch
j ); (v) theprobabilityof openingthe door in the various survey treatments k (with varying dollaramounts, minutes, and flyer conditional), P (H)sk, run in 2008and in 2009; (vi) the unconditional probability of completing thesurvey in the various survey treatments, P (SV)sk, run in 2008 andin 2009; and(vii) the probability of checking the opt-out box in thesurveyopt-out treatments (P (OO)sk). Thecorrespondingempiricalmoments m are estimated in a first-stage model using the samecontrols as inthemainregressions, andarelistedintheAppendix.
To calculate the method of simulated moments estimate, weemploy a common sequential quadratic programming algorithm(Powell 1983) implemented in Matlab as the fmincon routine. Weimpose the following constraints: Sch, Ss ≥ 0 (social pressure non-negative), σch,σs > 0 (positive standard deviation of altruism),h2008
0 , h20090 , r ∈ [0, 1] (probabilities between 0 and 1), and η ∈
[0, 9999] (finite elasticity of home presence). We begin each run ofthe optimization routine by randomly choosing a starting point,drawn from a uniform distribution over the permitted parameterspace. The algorithm determines successive search directionsby solving a quadratic programming subproblem based on an
16. Giventhelargenumberofmoments, weightingtheestimates bytheinverseof the full variance-covariance matrix is problematic computationally.
at University of C
hicago Library on M
arch 23, 2016http://qje.oxfordjournals.org/
Dow
nloaded from

TESTING FOR ALTRUISM AND SOCIAL PRESSURE 37
approximation of the Lagrangian of the optimization problem. Toavoidselectinglocal minima, wechoosetherunwiththeminimumsquared distance of 500 runs.17
Under standard conditions, the minimum-distance esti-mator using weighting matrix W achieves asymptotic nor-mality, with estimated variance (G′WG)−1(G′WΛWG)(G′WG)−1
N , where
G ≡ N−1∑Ni=1∇ξmi(ξ) andΛ ≡ Var[m(ξ)] (Wooldridge 2002). We
calculate ∇ξm(ξ) numerically in Matlab using an adaptive finitedifference algorithm.
Identification. Though the parameters are estimated jointly,it is possible to address the main sources of identification of in-dividual parameters. The baseline probabilities of answering thedoor, h2008
0 and h20090 , are identified by the observed probabilities
of opening the door in treatments without flyer. The probabilityof observing and remembering the flyer, r, is identified by twomoments in the opt-out treatment: the fraction of householdschecking the opt-out box (10−12%), which equals rh0F (a0), andthe fraction opening the door. The elasticity of opening the door ηwith respect to incentives is identified by the fraction opening thedoor in the survey treatments for different payments and surveydurations. In addition, η is identified by the amounts given in thedifferent charity treatments.
The survey parameters are identified using the survey mo-ments. The survey completion rates for varying amounts ofcompensation identify the heterogeneity in the willingness tocomplete the survey, and hence σs. For example, the completionrate of a 10-minute survey increases by 7 percentage point with a$10 increase in pay (Figure VII, top). This indicates that 7
h0= 17%
of the population assigns negative value to doing a survey for nopayment, but assigns positive value to completing a survey whenreceiving$10. Thesurveycompletionratealsoidentifies themeanwillingness to complete a 10-minute survey, μs. The value of timevs is identified from the comparison between pay increases for thesurvey (from $0 to$5 to$10) and duration decreases (from 10 to 5minutes). Finally, the social pressure Ss is identified by the shareof people answering the door in the survey treatments. To seethis, consider a respondent who dislikes answering a survey andhence will say noandincur the social pressure cost Ss. In the flyer
17. For the results presented here, the best estimate is achieved in about 40%of all runs.
at University of C
hicago Library on M
arch 23, 2016http://qje.oxfordjournals.org/
Dow
nloaded from

38 QUARTERLY JOURNAL OF ECONOMICS
treatment, she will choose tobe at home with probability h0−ηrSs
(barring corner solutions for h). Hence, knowing h0, η, and r, it ispossible to identify Ss.
Turning to the charity parameters, the information on theamounts given identify the standard deviation of altruism σch
a ,mean altruism μch
a , and the curvature parameter Γ . This is clear-est for donations of g > gS, where social pressure plays no role.Without social pressure, an individual with altruism a will giveexactly g dollars if the marginal utility of giving, av′ (g) = a
(Γ+g) ,equals the private marginal utility of consumption, 1, and hencea = Γ + g. Thus, in this example without social pressure, themass of households with altruism higher than Γ + g, that is,1 − F(g + Γ ), has to equal the observed share of households thatgive at least g. This pins down the empirical distribution of a fora given Γ . Figure VIIIA illustrates the identification mechanismfor the estimated value of Γ = 10.61 and giving levels g of $0 andof $10. The identification of Γ depends on two sets of moments:the sorting in of givers of larger amounts, and the giving ofsmaller amount. The more concave the altruism function is (thatis, smaller Γ ), the more altruistic individuals sort in because ofhigher infra-marginal utility of giving, and the more frequentare small donations. Finally, the social pressure Sch is identifiedfrom two main sources of variation: home presence in the flyertreatment (which, to a first approximation, equals h0 − ηrS) andthedistributionof small giving(thehigherthesocial pressure, themore likely is small giving and in particular bunching at gS).
Estimates. Column (1) in Table IV reports the benchmarkestimates of the parameters along with standard errors. Theprobability of being at home h0 is precisely estimated to be 41.4%in2008 andin2009. Theshare r of households that haveread(andremember) the flyer is precisely estimated at 34.1%. Althoughthis estimate may appear low, many households may have justdisregarded the flyer, or a household member may have seen it,but not informed the person opening the door. The elasticity ofhome presence η is estimated to be 0.040 (s.e. 0.011), implyingthat the cost of increasing the probability of being at home andanswering the door by 10 percentage points is 0.12
2η = $0.13.The average utility for survey completion is estimated to
equal −$26.89, implying that, on average, households dislikecompleting 10-minute surveys for no pay. There is, however,significant heterogeneity (σs = $29.59), implying that a sizable
at University of C
hicago Library on M
arch 23, 2016http://qje.oxfordjournals.org/
Dow
nloaded from

TESTING FOR ALTRUISM AND SOCIAL PRESSURE 39
FIGURE VIII(A) Distribution of Altruism and Cut-offs for Giving; (B) Overall Utility of
Fund-Raiser as Function of Altrusim
Figure VIIIA plots the estimateddistribution of the altruism parameter a > 0.The figure displays the threshold for giving $0 and for giving $10 in the absenceof social pressure, given by a v’ (Γ + g.) -1 � 0 or α � Γ + g. Figure VIIIBplots the implied utility in equilibrium of a standard door-to-door fund-raiser,as a function of the altruism parameter a. The parameter values are from thebenchmark minimum distance estimates (Table IV).
at University of C
hicago Library on M
arch 23, 2016http://qje.oxfordjournals.org/
Dow
nloaded from

40 QUARTERLY JOURNAL OF ECONOMICS
TABLE IV
MINIMUM-DISTANCE ESTIMATES: BENCHMARK RESULTS
Benchmark estimates No social pressureCommon parameters (1) (2)
Prob. of home presence 0.414 0.383(h) year 2008 (0.004) (0.003)
Prob. of home presence 0.414 0.392(h) year 2009 (0.007) (0.008)
Prob. of observing flyer (r) 0.341 0.426(0.012) (0.017)
Elasticity of home 0.040 0.008presence (eta) (0.011) (0.003)
Implied cost of altering 0.126 0.656prob. home by 10 pp.
Survey parametersMean utility (in $) of doing −26.863 −17.203
10-minute survey (4.204) (3.466)Std. dev. of utility of 29.591 28.347
doing survey (5.129) (5.374)Value of time of 80.656 83.039
one-hour survey (22.762) (24.898)Social pressure cost if saying 6.197 0.000
no to survey (1.492) (—)
Charity parameters La Rabida ECU La Rabida ECUShare with zero altruism a 0.753 0.763 0.723 0.747
(0.048) (0.071) (0.01) (0.024)Mean altruism a, 12.786 9.659 14.167 10.272
conditional on a>0 (1.444) (1.485) (0.452) (0.876)Std. dev. of altruism a, 10.545 7.994 11.569 8.455
conditional on a>0 (1.038) (1.103) (0.389) (0.773)Curvature of altruism 10.606 10.606
function (4.466) (—)Social pressure cost of 3.751 1.438 0 0
giving 0 in person (0.581) (0.784) (—) (—)
SSE 86.618 366.620
Notes. Estimates from minimum-distance estimator with moments listed in the Appendix and weightsgiven by inverse of diagonal of variance-covariance matrix. The estimation assumes a normal distributioncensored below at 0, with the censored mass assigned to zero altruism (a=0). Notice that the share with zeroaltruism is not a separate parameter, but it is the share implied by the censoring of a at a=0. In column(2) we estimate the model fixing the social pressure parameters to 0; in addition, since the curvature of thealtruism function is very poorly identifed, we fix it at the same value as in column (1). Standard errors are inparentheses. SSE reports the weighted sum of squared errors.
share of respondents like doing surveys even for no pay. Thevalue of time for one hour of survey completion is estimated tobe $80.66, which corresponds approximately to the value of time
at University of C
hicago Library on M
arch 23, 2016http://qje.oxfordjournals.org/
Dow
nloaded from

TESTING FOR ALTRUISM AND SOCIAL PRESSURE 41
for the households in the wealthy neighborhoods we reached.18
Finally, the social pressure cost of turning down a survey request,Ss, is estimated to be $6.20, a sizable magnitude.
Turning to the charity parameters, we estimate that about75% of households have no altruism for either charity and that,conditional on a positive altruism, the mean altruism is higherfor the La Rabida charity (12.79) than for the ECU charity(9.66). Figure VIIIA plots the implied distribution of the altruismparameter a for a > 0 for La Rabida and ECU. The estimated Γis small, implying a highly concave altruism function, consistentwith warm-glow rather than with pure altruism.
Thesocial pressureparameters arequitepreciselyestimated,and the data reject the null hypothesis of no social pressure cost.Turning down a door-to-door giving request is associated with asocial pressure cost of $3.75 (s.e. $0.58) for La Rabida and $1.44(s.e. $0.78) for ECU. That is, it is psychologically more costly tosay no to a well-liked local nonprofit than to a lesser-known out-of-state charity. The sizable social pressure cost suggests that thewelfare implications of door-to-doorcampaigns canbelarge, as weexplore below.
While the model with social pressure does a nice job of fittingthe observed moments (Appendix), the same cannot be said ofa model with no social pressure. In column (2) of Table IV weestimate the parameters forcing S = 0 (and setting Γ , which isessentially unidentified, to the value in column (1)). The fit isextremely poor, with the mean squared error 4.5 times larger.Missing social pressure, the model cannot explain opting outnor the decrease in the share answering the door in the flyertreatment.
In Table V we explore the robustness of the estimates toalternative model specifications with respect to the distributionof altruism, the cost function, and the heterogeneity of socialpressure. We report the weighted sum of squared errors to allowfor comparisons among the models. Allowing for negative valuesof altruism (spite) toward the charity with an untruncated nor-mal distribution (column (2)) yields nearly identical estimatesto the benchmark ones (column (1)).19 Given that social pres-sure is estimated to be substantially lower than $10, any level
18. At an average income of about $100,000 per year, the implied hourly wageis $50.
19. For a < 0, we assume v(a) = egi
G .
at University of C
hicago Library on M
arch 23, 2016http://qje.oxfordjournals.org/
Dow
nloaded from

42 QUARTERLY JOURNAL OF ECONOMICS
TA
BL
EV
MIN
IMU
MD
IST
AN
CE
ES
TIM
AT
ES:R
OB
US
TN
ES
S
Nor
mal
dis
tr.o
fE
xpon
enti
ald
istr
.L
ogn
orm
ald
istr
.B
ench
mar
kB
ench
mar
kB
ench
mar
kal
tru
ism
,no
altr
uis
m,a
llow
sof
altr
uis
m,
asym
met
ric
altr
uis
m,
altr
.,al
low
sfo
res
tim
ate
mas
sat
0of
mas
sat
0al
low
sm
ass
at0
sort
ing
cost
no
soci
alp
ref.
Com
mon
pa
ram
eter
s(1
)(2
)(3
)(4
)(5
)(6
)
Pro
b.ob
serv
ing
flye
r(r
)0.
341
0.34
20.
340
0.34
50.
340
0.41
2(0
.012
)(0
.012
)(0
.012
)(0
.012
)(0
.012
)(0
.079
)E
last
icit
yof
hom
e0.
040
0.04
00.
034
0.04
70.
340
dow
n0.
055
up
0.03
3p
rese
nce
(eta
)(0
.011
)(0
.011
)(0
.008
)(0
.013
)(0
.011
)(0
.051
)(0
.009
)P
roba
bili
tyof
typ
ew
ith
0.14
2n
oso
cial
pre
fere
nce
s(p
)(0
.13)
Su
rvey
pa
ram
eter
sM
ean
uti
lity
(in
$)of
−26
.863
−26
.924
−27
.771
−26
.163
−26
.947
−23
.049
doi
ng
10-m
inu
tesu
rvey
(4.2
04)
(4.2
27)
(4.3
32)
(4.0
72)
(4.1
52)
(5.0
72)
Std
.dev
.of
uti
lity
ofd
oin
g29
.591
29.6
6230
.166
29.3
6128
.947
27.1
0310
-min
ute
surv
ey(5
.129
)(5
.155
)(5
.296
)(5
.039
)(4
.927
)(5
.169
)S
ocia
lp
ress
ure
cost
6.19
76.
205
6.99
05.
344
6.55
07.
836
ofsa
yin
gn
oto
surv
ey(1
.492
)(1
.495
)(1
.416
)(1
.333
)(1
.725
)(2
.123
)
at University of C
hicago Library on M
arch 23, 2016http://qje.oxfordjournals.org/
Dow
nloaded from

TESTING FOR ALTRUISM AND SOCIAL PRESSURE 43
TA
BL
EV
(CO
NT
INU
ED
)
Nor
mal
dis
tr.o
fE
xpon
enti
ald
istr
.L
ogn
orm
ald
istr
.B
ench
mar
kal
tru
ism
,B
ench
mar
kal
tr.,
Ben
chm
ark
altr
uis
m,n
oal
tru
ism
,all
ows
ofal
tru
ism
,as
ymm
etri
cal
low
sfo
rn
oes
tim
ates
mas
sat
0of
mas
sat
0al
low
sm
ass
at0
sort
ing
cost
soci
alp
ref.
(1)
(2)
(3)
(4)
(5)
(6)
La
La
La
La
La
La
Ch
ari
typ
ara
met
ers
Rab
ida
EC
UR
abid
aE
CU
Rab
ida
EC
UR
abid
aE
CU
Rab
ida
EC
UR
abid
aE
CU
Sh
are
wit
hze
roal
tru
ism
0.75
30.
763
−−
0.80
70.
846
0.81
20.
880
0.74
50.
747
0.74
30.
744
(0.0
48)
(0.0
71)
(0.0
26)
(0.0
35)
(0.0
1)(0
.012
)(0
.06)
(0.1
04)
(0.0
52)
(0.0
8)M
ean
altr
uis
ma,
12.7
869.
659
12.9
319.
789
9.83
87.
103
26.4
8226
.601
13.0
569.
868
13.1
1810
.065
con
dit
ion
alon
a>
0(1
.444
)(1
.485
)(1
.503
)(1
.551
)(0
.541
)(0
.929
)(1
.314
)(1
.11)
(1.9
35)
(1.7
77)
(1.6
89)
(1.7
18)
Std
.dev
.of
altr
uis
ma,
10.5
457.
994
10.6
478.
080
9.83
87.
103
10.7
106.
913
10.7
418.
122
10.6
318.
163
con
dit
ion
alon
a>
0(1
.038
)(1
.103
)(1
.076
)(1
.141
)0.
541
0.92
9(0
.698
)(1
.183
)(1
.394
)(1
.251
)(1
.139
)(1
.177
)C
urv
atu
reof
altr
uis
m10
.606
11.0
664.
033
20.9
7611
.612
11.6
67fu
nct
ion
(4.4
66)
(4.6
75)
(2.1
16)
(0.8
69)
(6.0
43)
(4.9
56)
Soc
ial
pre
ssu
reco
st3.
751
1.43
83.
704
1.41
34.
996
2.35
82.
420
0.74
83.
688
1.37
63.
667
1.32
6of
givi
ng
0in
per
son
(0.5
81)
(0.7
84)
(0.5
96)
(0.7
72)
(0.4
53)
(1.0
32)
(0.1
9)(0
.391
)(0
.678
)(0
.803
)(0
.597
)(0
.762
)
SS
E86
.618
86.6
2390
.715
86.6
5386
.520
86.2
33
Wel
fare
an
dd
ecom
pos
itio
nof
givi
ng
Ave
rage
wel
fare
per
hou
se.−
1.10
2−
0.44
2−
1.09
3−
0.43
5−
1.33
0−
0.70
8−
0.70
0−
0.21
3−
1.10
1−
0.42
6−
0.87
4−
0.32
3of
fun
d-r
aise
r(i
n$)
(0.1
45)
(0.3
01)
(0.1
5)(0
.297
)(0
.128
)(0
.411
)(0
.082
)(0
.155
)(0
.164
)(0
.3)
(0.2
55)
(0.2
62)
Sh
are
ofgi
vers
wh
ose
ek0.
518
0.52
80.
514
0.52
60.
543
0.52
80.
524
0.62
80.
507
0.52
00.
507
0.52
9th
efu
nd
-rai
ser
(0.0
41)
(0.0
95)
(0.0
41)
(0.0
95)
(0.0
56)
(0.0
97)
(0.0
53)
(0.1
05)
(0.0
5)(0
.098
)(0
.04)
(0.0
96)
Not
es.
Est
imat
esfr
omm
inim
um
-dis
tan
cees
tim
ator
wit
hm
omen
tsli
sted
inth
eA
pp
end
ixan
dw
eigh
tsgi
ven
byin
vers
eof
dia
gon
alof
vari
ance
-cov
aria
nce
mat
rix.
Ben
chm
ark
esti
mat
esin
colu
mn
(1)
are
from
Tab
leIV
.Est
imat
esin
colu
mn
(2)
assu
me
a(n
ontr
un
cate
d)
nor
mal
dis
trib
uti
onfo
ral
tru
ism
aw
ith
no
mas
sat
a=
0.E
stim
ates
inco
lum
n(3
)an
d(4
)as
sum
e,re
spec
tive
ly,an
exp
onen
tial
dis
trib
uti
onan
da
log-
nor
mal
dis
trib
uti
onfo
ral
tru
ism
aas
wel
las
am
ass
ata
=0.
Est
imat
esin
colu
mn
(5)
allo
wfo
ra
dif
fere
nt
elas
tici
tyet
aof
the
cost
fun
ctio
nfo
rin
crea
ses
and
dec
reas
esin
hom
ep
rese
nce
.Est
imat
esin
colu
mn
(6)
allo
wfo
ra
shar
ep
ofth
ep
opu
lati
onth
ath
ave
no
altr
uis
m,n
orso
cial
pre
ssu
re.T
hes
eag
ents
do
not
give
toch
arit
yan
dd
on
otco
mp
lete
the
surv
ey.In
colu
mn
(6),
the
shar
ew
ith
zero
altr
uis
min
clu
des
the
shar
ew
ith
no
soci
alp
refe
ren
ces.
Sta
nd
ard
erro
rsar
ein
par
enth
eses
.S
SE
rep
orts
the
Wei
ghte
dS
um
ofS
quar
edE
rror
s.
at University of C
hicago Library on M
arch 23, 2016http://qje.oxfordjournals.org/
Dow
nloaded from

44 QUARTERLY JOURNAL OF ECONOMICS
of altruism that is sufficiently small, or negative, is associatedwithidentical behavior—turningdownthecharityandavoidance.Hence, the shape of the left tail of the altruism distribution is notidentified and, importantly, does not affect the estimates of theotherparameters. Next, wereestimatethemodel withalternativeassumptions for the distributions of altruism: in column (3) weassume a negative exponential distribution of a (with mean 1
λ)
with additional probability mass z at 0; the results are verysimilar to the ones in the benchmark model. In column (4) weassume a log-normal distribution (with parameters μ and σ) andan added probability mass z at 0. The results are qualitativelysimilar, but with some quantitative differences, such as lowersocial pressure estimates.20
In column (5) we remove the assumption of a symmetric costfunction and allow for the cost of avoidance to differ from the costof sorting in:
c (h) =
(h−h0)2
2η+for h ≥ h0
(h−h0)2
2η−for h < h0.
The estimates of η+ and η− are close, even though η+ is im-precisely estimated given that only the most favorable surveys($10 payment for 5 minutes) increase on average the presence athome. As a result, the estimates of the other parameters hardlychange.
In column (6) we remove the assumption of homogeneoussocial pressure and allow for a simple form of heterogeneity.We assume that a proportion p of households has no socialpreferences, that is, does not exhibit altruism (a = 0) and doesnot respond to social pressure (S = 0), and hence neither givesto charity nor completes surveys.21 The remaining portion 1 − pis described by the benchmark model. The data provide somesupport for this type of heterogeneity, estimating a share p of0.142 (s.e. 0.13). In turn, this raises somewhat the estimatedshare of households that observed the flyer r up to 0.41 andlowers the elasticity of the response η. Despite these changes, the
20. The convergence properties for the lognormal distribution are not asgood, presumably because of one additional parameter to be estimated in thedistribution of altruism (μ, σ, and z), relative to the censored normal (μ and σ)and the exponential (λ and z) distribution.
21. We assume a deterministicvalue for doing the survey equal totheμS of thesocial-preference types. Given the estimated values, these types will not completea 5-minute survey even for pay of $10.
at University of C
hicago Library on M
arch 23, 2016http://qje.oxfordjournals.org/
Dow
nloaded from

TESTING FOR ALTRUISM AND SOCIAL PRESSURE 45
social pressure parameters for the charity hardly move, while theestimated social pressure for survey completion increases. Theadded degree of freedom improves toa limited extent the fit of themodel, in particular regarding the giving moments in the opt-outtreatments.
We present further robustness checks for the benchmark dis-tribution of altruism (censored normal, Online Appendix Table 3)and for the exponential distribution (Online Appendix Table 4).Using more detailed information on the quantity given (thatis, the moments for giving (0, 3], (3, 7], (7, 10], (10, 20], (20, 50],50+, column (2)) has a limited impact on the results. Using arougherset of giving moments, that does not account forbunchingat $10, ((0, 10], (10, 20], (20, 50], 50+, column (3)) also producessimilar point estimates, but larger standard errors, including onthe social pressure parameters. Not surprisingly, the informationcontained in the exact amount given, and especially the bunchingat $10, helps provide identification. In columns (4) and (5) weuse, respectively, only the charity moments and only the surveymoments. The survey moments suffice to identify both the surveyparameters and the common parameters. The charity momentsidentify the charity parameters, with estimates similar to thebenchmark ones in column (1). This indicates that the surveymoments are useful, but not necessary to identify η.22 Impor-tantly, the two sets of estimates—using the charity momentsand using the survey moments—yield very similar values forthe common parameters such as η and r, an important valida-tion of the model. Finally, in column (6) we show that the esti-mates are not sensitive to using the identity matrix as weightingmatrix.
Welfare. We evaluate the welfare associated with a standardno-flyer door-to-door drive. Figure VIIIB plots the utility for ahousehold that opens the door (utility is 0 for the other house-holds) as a function of the altruism a. The utility is negativefor households with sufficiently low altruism a: these householdsrefuse the solicitation and pay the cost 10S. Households withpositive but small altruism give small amounts, but still expe-rience negative utility because they give more than they prefer
22. With coarser giving moments (as in column (3)), however, the charitymoments cannot reliably identify η, indicating that the identification comes fromthe amount given for small magnitudes and the bunching at $10.
at University of C
hicago Library on M
arch 23, 2016http://qje.oxfordjournals.org/
Dow
nloaded from

46 QUARTERLY JOURNAL OF ECONOMICS
and because they still incur some social pressure cost. For higheraltruism, the utility of giving becomes positive.23
On net, a fund-raising campaign can either increaseor decrease welfare of the solicitees, depending on whichforce dominates. Given the estimated distribution of altruism(Figure VIIIA), our fund-raiser lowers the utility for a largemajority (the nondonors and the unhappy donors) while raisingthe welfare of only a small minority (the happy donors). Hence,the welfare effect is substantially negative once we average overall households contacted, including the ones not at home (whosewelfare effect is 0): −$1.10 for La Rabida and smaller but stillnegative (−$0.44) for ECU (Panel A of Table VI).24 The welfareeffect is more negative for the more liked charity, because thischarity induces higher social pressure to give. The finding ofnegative welfare effects is robust toall the different specifications(bottom rowof Table V and Online Appendix Tables 3 and 4), andis smallerwhen allowing fortypes without social preferences. Ourfund-raising drives are on average welfare-diminishing for thesolicitees.
These welfare estimates do not account for the welfare ofthe recipient. For La Rabida, the estimated money raised perhousehold contacted is $0.72, which amounts to$0.24 on net aftertaking into account a solicitor wage of $9.50 per hour (visiting 20households per hour).25 Hence, the money raisedneeds tobe usedvery efficiently togenerate positive societal welfare. For ECU, thenet money raisedis negative, implying a negative societal welfareeffect.
The introduction of flyers changes the welfare implications.Flyers give the opportunity tosort and hence temper the negativewelfare implications for the solicitees. Counterintuitively, flyerscan also increase the amount of money raised. Even though sort-ing out is more frequent than sorting in, the households sortingin contribute substantially higher amounts. This generates, inour estimates, a small but positive effect on the amount given.After taking into account the added cost of hanging the flyers
23. For largervalues of altruism, theutility level forLa Rabida andECU is thesame, sincetheonlydifferencebetweenthetwocharities is thesocial pressure, andsocial pressure does not affect larger donations.
24. The effect exclusively on the households at home is larger by a factor of1
0.414 .25. Notice that these are the estimatedamounts raisedaccording tothe model,
and differ somewhat from the observed ones (Table II, column (9)).
at University of C
hicago Library on M
arch 23, 2016http://qje.oxfordjournals.org/
Dow
nloaded from

TESTING FOR ALTRUISM AND SOCIAL PRESSURE 47
TABLE VI
WELFARE AND DECOMPOSITION OF GIVING
Specification: Minimum-distance Benchmark estimatesCharity: La Rabida charity ECU charity
(1) (2)
Panel A. WelfareWelfare in standard (no-flyer) fund-raiser
Welfare per household contacted (in $) −1.102 (0.145) −0.442 (0.301)Money raised per household contacted 0.719 (0.035) 0.333 (0.046)Money raised per household, net of salary 0.244 (0.035) −0.142 (0.046)
Welfare in fund-raiser with flyerWelfare per household contacted (in $) −0.952 (0.122) −0.410 (0.288)Money raised per household contacted 0.860 (0.044) 0.389 (0.057)Money raised per household, net of salary 0.249 (0.044) −0.221 (0.057)
Welfare in fund-raiser with opt-outWelfare per household contacted (in $) −0.564 (0.077) −0.234 (0.201)Money raised per household contacted 0.808 (0.045) 0.370 (0.055)Money raised per household, net of salary 0.292 (0.045) −0.145 (0.055)
Panel B. Decomposition of giving in standard (no-flyer) fund-raiserShare of givers who would give 0.745 0.848
without social pressure (S = 0) (0.056) (0.079)Share of amount that would be given 0.726 0.816
without social pressure (S = 0) (0.03) (0.093)Share of givers who seek 0.518 0.528
the fund-raiser (happy givers) (0.041) (0.095)
Panel C. Sorting in fund-raiser with flyerIncrease in answering the door due to 0.007 0.003
altruism (sorting in) (0.001) (0.001)Decrease in answering the door due to −0.045 −0.018
social pressure (sorting out) (0.01) (0.01)
Note. Welfare, decomposition, and sorting are computed using estimates from minimum-distanceestimator with weights given by inverse of diagonal of variance-covariance matrix (column (1) in Table IV).The amount of money raised refers to the predicted amount given the estimated parameters. To computethe salary cost of the solicitor we assume an hourly wage of $9.5 and 20 households reached in one hourof fund-raising (25 in the opt-out treatment). We also assume that a solicitor flyers 70 households in onehour.
(70 households per hour), the net amount raised is about thesame as in the baseline treatment in our estimates. A flyer withopt-out is even more beneficial for the welfare of the householdsvisited, since the opt-out option eliminates the cost of sortingout (conditional on seeing the flyer), and still makes it possibleto sort in. In addition, the opt-out option can increase net fund-raising because it increases the number of households the solic-itor can approach per hour. Hence, providing information aboutan upcoming fund-raiser and allowing solicitees to sort out canbe a win-win solution for both the charity and the householdsvisited.
at University of C
hicago Library on M
arch 23, 2016http://qje.oxfordjournals.org/
Dow
nloaded from

48 QUARTERLY JOURNAL OF ECONOMICS
Decomposition of Giving and Sorting. We decompose theobservedgivingintogivingduetoaltruismandgivingduetosocialpressure, an exercise that is not possible using only the reduced-formresults. Fortheno-flyertreatment, whichis representativeofa standarddoor-to-door campaign, we compute the counterfactualgiving with social pressure set to 0, holding the other parametersat theirbenchmarkestimates (Panel B of Table VI). Interestingly,74.5% oftheLaRabidadonors and84.8% oftheECU donors wouldgive even without social pressure. These measures, however,neglect a second effect of social pressure: a respondent whowouldhappily give, say, $2 in the absence of social pressure may feelcompelled by social pressure to instead give $5. To avoid this, shemay sort out.
Taking intoaccount these distortions, the share of givers whoassign positive overall utility to the fund-raiser is 51.8% for LaRabida and 52.8% for ECU. This result—that about half of theobserveddonors arenot happygivers—is veryrobust (bottomrowsin Table V and Online Appendix Tables 3 and 4).
Next, we use the model to estimate the amount of sortinginto, and out of, answering the door in the flyer treatment (PanelB of Table VI). Notice that the reduced-form estimates onlyidentify the sum of the two forces. Sorting in due to altruism islimited, contributing on average to an increase in the probabilityof answering the door of only 0.7% for La Rabida and 0.3% forECU. Sorting out, instead, is substantial, equal to 4.5% for LaRabida and 1.8% for ECU. (There is less sorting out for the less-liked charity because the estimated social pressure cost is lower).
VI. ALTERNATIVE INTERPRETATIONS
We discuss four alternative interpretations of our empiricalresults.
Signaling of Quality of the Charity. Door-hangers are un-usual in fund-raising campaigns. It is possible that they weretaken as a signal of the quality of the charity, even though wemadesurethat theydidnot conveyanydifferent informationthanpresentedinperson. Toexplainourresults, thedoor-hangers witha Do-Not-Disturbbox must have sent a more negative signal thanthestandarddoor-hangers. Perhaps, theopt-out boxsignaledthatit was acceptable to avoid the fund-raiser. This explanation, how-ever, does not obviously explain why the opt-out box is associated
at University of C
hicago Library on M
arch 23, 2016http://qje.oxfordjournals.org/
Dow
nloaded from

TESTING FOR ALTRUISM AND SOCIAL PRESSURE 49
with a reduction in small donations, but not of large donations.A change in perceived quality would presumably affect the wholedistribution of giving.
Self- and Other-Signaling. Our model of social pressure as-sumes that individuals incur disutility when being ungenerous inperson, but not when avoiding a solicitor. A related explanationis that individuals give to (costly) signal to themselves or toothers (the solicitor) that they are generous types (Bodner andPrelec 2003; Benabou and Tirole 2006; Grossman 2010). To theextent that avoidingafund-raiserdoes not sendthesamenegativesignal as an outright no, this explanation is very similar to theone we propose. However, this explanation does not explain aseasily why so many households made use of the opt-out box,which is a clear signal to the solicitor, as well as possibly to theneighbors.
Dislike of Interaction with the Solicitor. A fund-raising visitmay lower the welfare of the solicitees even in the absence ofsocial pressure. Consider individuals who are altruistic towarda charity but dislike interacting with solicitors, perhaps becauseof the time involved. In a standard fund-raising campaign, theseindividuals, faced with a surprise home visit, give to the solicitor.In a campaign with a flyer, though, the individuals may avoidthe solicitor, or check the opt-out box, if the disutility from thepersonal interaction is larger than the utility from giving. Hence,this interpretation can explain the observed patterns of dooropening and giving. It even predicts that the opt-out effect isconcentrated among small giving, since a distaste for interactionis more likely to outweigh the utility from giving a small amount.This explanation shares several features with social pressure,including the negative welfare implications of door-to-door cam-paigns. A keydifference, however, separates thetwoexplanations:An altruistic donor who dislikes solicitors, when alerted of acampaign by a flyer, should seek alternative ways to give thatdo not involve personal interaction, such as via mail or Internet.Instead, we observe no such substitution, as predicted by socialpressure.
Time Inconsistency. Our estimates use the sorting decision toanswerthedoortoestimatethepreferences forgiving. If theagentis time-inconsistent—for example, likes giving when in a warmstate (e.g., when in a person-to-person interaction), but not in a
at University of C
hicago Library on M
arch 23, 2016http://qje.oxfordjournals.org/
Dow
nloaded from
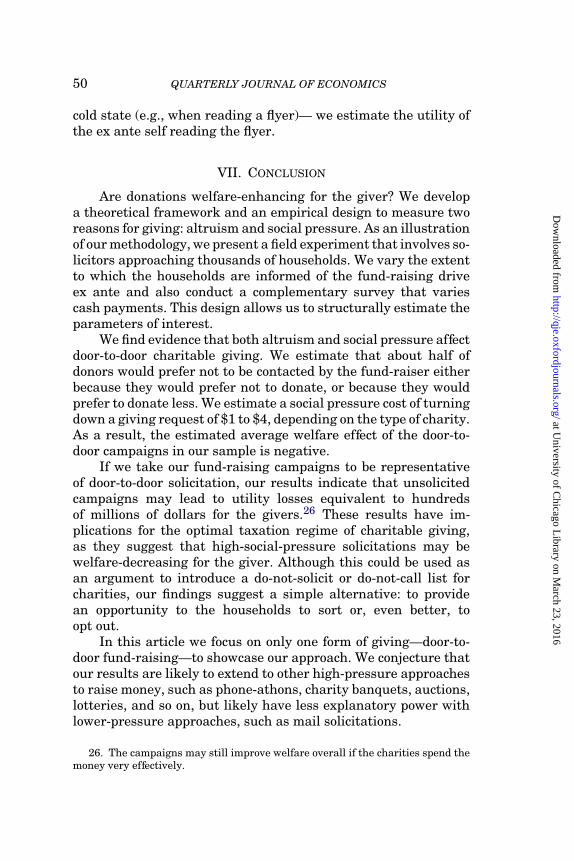
50 QUARTERLY JOURNAL OF ECONOMICS
cold state (e.g., when reading a flyer)— we estimate the utility ofthe ex ante self reading the flyer.
VII. CONCLUSION
Are donations welfare-enhancing for the giver? We developa theoretical framework and an empirical design to measure tworeasons forgiving: altruismandsocial pressure. As anillustrationofourmethodology, wepresent afieldexperiment that involves so-licitors approaching thousands of households. We vary the extentto which the households are informed of the fund-raising driveex ante and also conduct a complementary survey that variescash payments. This design allows us tostructurally estimate theparameters of interest.
Wefindevidencethat bothaltruismandsocial pressureaffectdoor-to-door charitable giving. We estimate that about half ofdonors would prefer not to be contacted by the fund-raiser eitherbecause they would prefer not to donate, or because they wouldprefertodonate less. Weestimatea social pressurecost of turningdowna givingrequest of $1 to$4, dependingonthetypeof charity.As a result, the estimated average welfare effect of the door-to-door campaigns in our sample is negative.
If we take our fund-raising campaigns to be representativeof door-to-door solicitation, our results indicate that unsolicitedcampaigns may lead to utility losses equivalent to hundredsof millions of dollars for the givers.26 These results have im-plications for the optimal taxation regime of charitable giving,as they suggest that high-social-pressure solicitations may bewelfare-decreasing for the giver. Although this could be used asan argument to introduce a do-not-solicit or do-not-call list forcharities, our findings suggest a simple alternative: to providean opportunity to the households to sort or, even better, toopt out.
In this article we focus on only one form of giving—door-to-door fund-raising—to showcase our approach. We conjecture thatour results are likely toextend toother high-pressure approachestoraise money, such as phone-athons, charity banquets, auctions,lotteries, and so on, but likely have less explanatory power withlower-pressure approaches, such as mail solicitations.
26. The campaigns may still improve welfare overall if the charities spend themoney very effectively.
at University of C
hicago Library on M
arch 23, 2016http://qje.oxfordjournals.org/
Dow
nloaded from

TESTING FOR ALTRUISM AND SOCIAL PRESSURE 51
In addition topresenting novel empirical findings, this articlealsodistinguishes itself becauseof its methodological contributionof linking tightly a behavioral model with a field experimentdesigned to test its predictions. We first developed the theoreti-cal model, which then informed the nature of the experimentaltreatments, andtheexperiments inturninformedtheparametersof the model. Most of the extant literature, instead, overlays thestructural model on experimental data already gathered. Ourapproach enables parameter estimates and welfare evaluationsthat complement the reduced-form evidence. We hope that futureresearch builds on this strategy to provide more evidence onbehavioral phenomena.
VIII. MATHEMATICAL APPENDIX
We define the three thresholds a ≡ u′(W−gs)v′(gs,G−i)
,
a (S)≡
u′(W−gs)−Sv+′(gs,G−i)
if u′(W − gs)≥ S
u′(W−gs)−Sv−′(gs,G−i)
if u′(W − gs)< S,
a (S)≡
u′(W)−Sv+′(0,G−i)
if u′(W)≥ S
u′(W)−Sv−′(0,G−i)
if u′(W)< S,
with a ≥ a (S) ≥ a (S) for a given S and a = a (0). The thresholda is always positive, while a (S) and a (S) can be negative forhigh S.
LEMMA 1A (Giving in Person) For any a,there is a unique optimaldonation g∗ (a, S), conditional on being at home, which isweakly increasing in a and takes the form: (i) g∗ (a, S) = 0 fora ≤ a (S) ; (ii) 0 < g∗ (a, S) < gs for a (S) < a < a (S) ; (iii)g∗ (a, S) = gs for a (S) ≤ a ≤ a; (iv) g∗ (a, S) > gs for a > a.
Define am ≡ u′(W)/θv+′(0; G−i), with am ≥ a (S) for all S.
LEMMA 1B (Giving via Mail) For any a and provided 0 < θ < 1,there is a unique optimal donation via mail g∗m (a) (condi-tional on not being at home), which is weakly increasing ina and takes the form: (i) g∗m(a) = 0 for a ≤ am; (ii) g∗m (a) > 0for a > am; (iii) for a ≤ a (S) , g∗(a; S) = g∗m (a) = 0 and fora > a (S) , g∗(a; S)> θg∗m (a). If θ = 0, g∗m (a) = 0 for all a.
at University of C
hicago Library on M
arch 23, 2016http://qje.oxfordjournals.org/
Dow
nloaded from

52 QUARTERLY JOURNAL OF ECONOMICS
Lemma 2 characterizes the solution for h∗ as a function of theparameters a and S.
LEMMA 2 (Presence at Home) For any a, there is a unique optimalprobability of being at home h∗(a, S) that is weakly increasingin a. For S = 0, h∗ (a, 0) = h0 for a ≤ a (0) and h∗ (a, 0) > h0
for a > a (0). For S > 0, there is a unique a0 (S) ∈ (a (S) , a)such that h∗ (a, S) < h0 for a < a0 (S) , h∗ (a0 (S) , S) = h0, andh∗ (a, S) > h0 for a > a0 (S).
The next lemma refers toa0 (S) from Lemma 2. We break tiesbyassumingthat if theagent is indifferent between h=h0 andh = 0, she does not opt out, that is, h = h0.
LEMMA 3 (Opting Out). If S=0, the agent never opts out. If S > 0,the agent opts out for sufficiently low altruism, a < a0 (S).
Probabilities of Presence at Home and of Giving. Lemmas 2and 3 implies that the probabilities of presence at home are
P(H)NF = h0,
P(H)F = (1− r)h0 + r∫ ∞
−∞h∗(a, S)dF,
P(H)OO = (1− r)h0 + r∫ ∞
aOO
h∗(a, S)dF,
where aOO =−∞ for S = 0 and aOO = a0 (S) for S > 0.Lemma 1Aa implies that the probabilities of giving in person are
P(G)NF = [1− F(a (S) )]h0
P(G)F = (1− r)[1− F(a (S) )]h0 + r∫ ∞
a(S)h∗(a, S)dF
P(G)OO = (1− r)[1− F(a (S) )]h0 + r∫ ∞
a0(S)h∗(a, S)dF.
at University of C
hicago Library on M
arch 23, 2016http://qje.oxfordjournals.org/
Dow
nloaded from
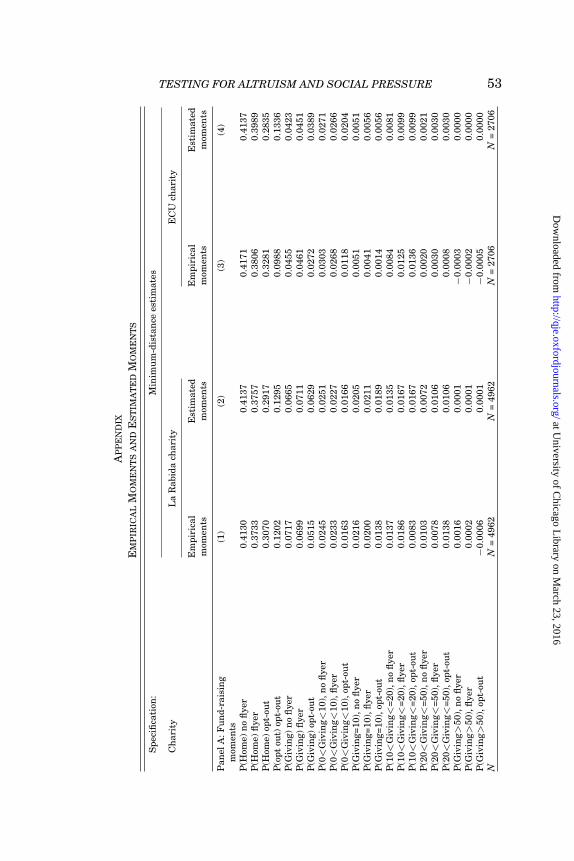
TESTING FOR ALTRUISM AND SOCIAL PRESSURE 53
AP
PE
ND
IX
EM
PIR
ICA
LM
OM
EN
TS
AN
DE
ST
IMA
TE
DM
OM
EN
TS
Sp
ecifi
cati
on:
Min
imu
m-d
ista
nce
esti
mat
e s
Ch
arit
yL
aR
abid
ach
arit
yE
CU
char
ity
Em
pir
ical
Est
imat
edE
mp
iric
alE
stim
ated
mom
ents
mom
ents
mom
ents
mom
ent s
Pan
elA
:Fu
nd
-rai
sin
g(1
)(2
)(3
)(4
)m
omen
tsP
(Hom
e)n
ofl
yer
0.41
300.
4137
0.41
710.
4137
P(H
ome)
flye
r0.
3733
0.37
570.
3806
0.39
89P
(Hom
e)op
t-ou
t0.
3070
0.29
170.
3281
0.28
35P
(op
tou
t)op
t-ou
t0.
1202
0.12
950.
0988
0.13
36P
(Giv
ing)
no
flye
r0.
0717
0.06
650.
0455
0.04
23P
(Giv
ing)
flye
r0.
0699
0.07
110.
0461
0.04
51P
(Giv
ing)
opt-
out
0.05
150.
0629
0.02
720.
0389
P(0<
Giv
ing<
10),
no
flye
r0.
0245
0.02
510.
0303
0.02
71P
(0<
Giv
ing<
10),
flye
r0.
0233
0.02
270.
0268
0.02
66P
(0<
Giv
ing<
10),
opt-
out
0.01
630.
0166
0.01
180.
0204
P(G
ivin
g=10
),n
ofl
yer
0.02
160.
0205
0.00
510.
0051
P(G
ivin
g=10
),fl
yer
0.02
000.
0211
0.00
410.
0056
P(G
ivin
g=10
),op
t-ou
t0.
0138
0.01
890.
0014
0.00
56P
(10<
Giv
ing<
=20
),n
ofl
yer
0.01
370.
0135
0.00
840.
0081
P(1
0<G
ivin
g<=
20),
flye
r0.
0186
0.01
670.
0125
0.00
99P
(10<
Giv
ing<
=20
),op
t-ou
t0.
0083
0.01
670.
0136
0.00
99P
(20<
Giv
ing<
=50
),n
ofl
yer
0.01
030.
0072
0.00
200.
0021
P(2
0<G
ivin
g<=
50),
flye
r0.
0078
0.01
060.
0030
0.00
30P
(20<
Giv
ing<
=50
),op
t-ou
t0.
0138
0.01
060.
0008
0.00
30P
(Giv
ing>
50),
no
flye
r0.
0016
0.00
01−
0.00
030.
0000
P(G
ivin
g>50
),fl
yer
0.00
020.
0001
−0.
0002
0.00
00P
(Giv
ing>
50),
opt-
out
−0.
0006
0.00
01−
0.00
050.
0000
NN
=49
62N
=49
62N
=27
06N
=27
06
at University of C
hicago Library on M
arch 23, 2016http://qje.oxfordjournals.org/
Dow
nloaded from

54 QUARTERLY JOURNAL OF ECONOMICS
AP
PE
ND
IX
(CO
NT
INU
ED
)
P(H
ome)
P(D
osu
rvey
)P
(Op
t-ou
t)
Em
pir
ical
Est
imat
edE
mp
iric
alE
stim
ated
Em
pir
ical
Est
imat
edm
omen
tsm
omen
tsm
omen
tsm
omen
tsm
omen
tsm
omen
t s
Pan
elB
:Su
rvey
mom
ents
(1)
(2)
(3)
(4)
(5)
(6)
Mom
ents
2008
No
flye
r$0
,10m
in0.
4138
0.41
370.
1025
0.10
03—
—F
lyer
$0,1
0min
0.35
760.
3725
0.10
250.
1230
——
Fly
er$0
,5m
in0.
4118
0.38
910.
1819
0.16
46—
—F
lyer
$10,
10m
in0.
4033
0.39
840.
1720
0.18
73—
—N
N=
1865
N=
1865
N=
1865
N=
1865
——
Mom
ents
2009
No
flye
r$0
,5m
in0.
4009
0.41
350.
1486
0.13
18—
—N
ofl
yer
$5,5
min
0.39
130.
4135
0.12
460.
1576
——
Fly
er$0
,10m
in0.
3812
0.37
230.
1478
0.12
29—
—F
lyer
$0,5
min
0.38
160.
3889
0.17
290.
1646
——
Fly
er$5
,5m
in0.
4038
0.40
330.
2035
0.19
96—
—F
lyer
$10,
5min
0.43
770.
4193
0.25
580.
2373
——
Op
t-ou
t$0
,5m
in0.
3427
0.34
320.
1460
0.15
760.
1336
0.10
61O
pt-
out
$5,5
min
0.36
370.
3605
0.17
450.
1920
0.08
460.
0982
NN
=10
035
N=
1003
5N
=10
035
N=
1003
5N
=27
04N
=27
04
Not
es.T
he
tabl
ep
rese
nts
the
emp
iric
alm
omen
tsan
dth
ees
tim
ated
mom
ents
from
am
inim
um
-dis
tan
cees
tim
ator
.Th
eem
pir
ical
mom
ents
are
obta
ined
asre
gres
sion
esti
mat
esaf
ter
con
trol
lin
gfo
rth
era
nd
omiz
atio
nfi
xed
effe
cts
and
assu
chca
noc
casi
onal
lybe
neg
ativ
e.T
he
min
imu
m-d
ista
nce
esti
mat
esar
ein
Tab
leIV
,col
um
n(1
).
at University of C
hicago Library on M
arch 23, 2016http://qje.oxfordjournals.org/
Dow
nloaded from

TESTING FOR ALTRUISM AND SOCIAL PRESSURE 55
UNIVERSITY OF CALIFORNIA, BERKELEY, AND NATIONAL BUREAU
OF ECONOMIC RESEARCH
UNIVERSITY OF CHICAGO AND NATIONAL BUREAU OF ECONOMIC
RESEARCH
UNIVERSITY OF CALIFORNIA, BERKELEY, AND NATIONAL BUREAU
OF ECONOMIC RESEARCH
SUPPLEMENTARY MATERIAL
An Online Appendix for this article can be found at QJEonline (qje.oxfordjournals.org).
REFERENCES
Akerlof, George A., and Rachel E. Kranton, “Economics and Identity,” QuarterlyJournal of Economics, 115 (2000), 715–753.
Andreoni, James. “Giving with Impure Altruism: Applications to Charity andRicardian Equivalence.” Journal of Political Economy, 97(1989), 1447–1458.
———, “Impure Altruism andDonations toPublicGoods: A Theory of Warm-GlowGiving.” The Economic Journal, 100(1990), 464–477.
———, “Philanthropy.” In Handbook of Giving, Altruism, and Reciprocity, Serge-Christophe Kolm and Jean Mercier Ythier, eds., 1201–1265. (Amsterdam:Elsevier/North-Holland, 2006).
Ariely, Dan, Anat Bracha, and Stephan Meier, “Doing Good or Doing Well? ImageMotivation and Monetary Incentives in Behaving Prosocially.” AmericanEconomic Review, 99(2009), 544–555.
Asch, SolomonE., “Effects of GroupPressureUpontheModificationandDistortionof Judgment.” in Groups, leadership, and men. H. Guetzkow, ed. (Pittsburgh:Carnegie Press, 1951).
Becker, Gary S., “A Theory of Social Interactions” Journal of Political Economy,82(1974), 1063–1093.
Benabou, Roland, and Jean Tirole, “Incentives and Prosocial Behavior,” AmericanEconomic Review, 96(2006), 1652–1678.
Bodner, R. andDrazenPrelec, “TheDiagnosticValueof Actions ina Self-SignalingModel,” in The Psychology of Economic Decisions, Vol.1, I. Brocas andJ.D. Carrillo, eds., (Oxford: Oxford University Press, 2003).
Card, David, Stefano DellaVigna, and Ulrike Malmendier, “The Role of Theory inField Experiments”. Journal of Economic Perspectives, 25(2011), 39-62.
Charness, Gary, and Matthew Rabin, “Understanding Social Preferences withSimple Tests,” Quarterly Journal of Economics 117(2002), 817–869.
Conlin, Michael, Ted O’Donoghue, and Timothy J. Vogelsang, “Projection Bias inCatalog Orders,” American Economic Review, 97(2007), 1217–1249.
Croson, Rachel, and Jen Shang, “A Field Experiment in Charitable Contribution:The Impact of Social Information on the Voluntary Provision of PublicGoods,”Economic Journal, 119(2009), 1422-1439.
Dana, Jason D., Daylian M. Cain, and Robyn M. Dawes, “What you don’t knowwon’t hurt me: Costly (but quiet) exit in dictator games,” OrganizationalBehavior and Human Decision Processes, 100(2006): 193–201.
Fehr, Ernst, and Simon Gachter, “Fairness and Retaliation—The Economics ofReciprocity,”Journal of Economic Perspectives, 14(2000), 159–181.
Fong, Christina, and Erzo Luttmer, “What Determines Giving to HurricaneKatrina Victims? Experimental EvidenceonRacial GroupLoyalty,” AmericanEconomic Journal: Applied Economics, 1(2009), 64–87.
Garicano, Luis, Ignacio Palacios-Huerta, and Canice Prendergast, “FavoritismUnder Social Pressure,” The Review of Economics and Statistics, 87(2005):208–216.
at University of C
hicago Library on M
arch 23, 2016http://qje.oxfordjournals.org/
Dow
nloaded from
56 QUARTERLY JOURNAL OF ECONOMICS
Gerber, Alan S., Donald P. Green, and Christopher W. Larimer, “Social PressureandVoterTurnout: TheResults ofa LargeScaleFieldExperiment.” AmericanPolitical Science Review, 102(2008), 33–48.
Grossman, Zack, “Self-Signaling versus Social Signaling in Giving,”UCSB Work-ing paper, 2010.
Harbaugh, William T., “What do donations buy?: A model of philanthropy basedon prestige andwarm glow,” Journal of Public Economics, 67(1998), 269–284.
Laibson, David, Andrea Repetto, and Jeremy Tobacman, “Estimating DiscountFunctions with Consumption Choices over the Lifecycle,” Working paper,2007.
Landry, Craig, Andreas Lange, John A. List, Michael K. Price, andNicholas Rupp,“Towards an understanding of the economics of charity: Evidence from a fieldexperiment,” Quarterly Journal of Economics, 121(2006), 747–782.
Lazear, Edward, Ulrike Malmendier, and RobertoWeber,“Sorting in Experimentswith Application toSocial Preferences,” American Economic Journal: AppliedEconomics, Forthcoming.
Levine, David K., “Modeling Altruism and Spitefulness in Experiment,” Review ofEconomic Dynamics, 1(1998), 593–622.
List, John A., and David Lucking-Reiley, “The Effects of Seed Money and Refundson Charitable Giving: Experimental Evidence from a University CapitalCampaign,” Journal of Political Economy, 110(2002), 215–233.
Mas, Alexander, andEnricoMoretti, “Peers At Work,”American Economic Review,99(2009), 112–145.
Milgram, Stanley., “Behavioral study of obedience,” Journal of Abnormal andSocial Psychology, 67(1963), 371–378.
Powell, M. J. D., “Variable Metric Methods for Constrained Optimization,” inMathematical Programming: The State of the Art, A. Bachem, M. Grotscheland B. Korte, eds., 288–311 (New York: Springer Verlag, 1983).
Wooldridge, Jeffrey M., Econometric Analysis of Cross Section and Panel Data(Cambridge, MA: MIT Press, 2002).
at University of C
hicago Library on M
arch 23, 2016http://qje.oxfordjournals.org/
Dow
nloaded from