Embed Size (px)
Citation preview
QUARTERLY
ECONOMIC
REVIEW
SEPTEMBER 2017
RESERVE BANK OF ZIMBABWE
2
CONTENTS
OVERVIEW ............................................................................................................. 5
INTERNATIONAL ECONOMIC DEVELOPMENTS ....................................... 6
INTERNATIONAL COMMODITY PRICE DEVELOPMENTS ..................... 7
MERCHANDISE TRADE DEVELOPMENTS ................................................... 9
DOMESTIC ECONOMIC DEVELOPMENTS .................................................12
REAL SECTOR DEVELOPMENTS ..................................................................12
AGRICULTURE ....................................................................................................12
MINING ..................................................................................................................15
INFLATION DEVELOPMENTS ........................................................................22
MONETARY DEVELOPMENTS, AND FINANCIAL MARKETS ..............24
STOCK MARKET DEVELOPMENTS ..............................................................25
PAYMENT, CLEARING AND SETTLEMENT ACTIVITIES .......................26
3
List of Figures
Figure 1: Brent Crude Oil Prices US$/Barrel: January to September 2017 ................................... 8
Figure 2: Base Metal Prices (US$/ tonne): January 2016 to September 2017 ................................ 8
Figure 3: Precious Minerals Prices: January to September 2017 ................................................... 9
Figure 4: Third Quarter Total Merchandise Exports (July to September 2016 &2017) ................. 9
Figure 5: Merchandise Imports (US$ m) ...................................................................................... 11
Figure 6: Trade Balance for 2017 Q2 and Q3 (US$ m) ................................................................ 11
Figure 7: Real GDP Growth (%): 2009-2016 and 2017 Projection .............................................. 12
Figure 8: Quarterly Cattle Slaughters ........................................................................................... 14
Figure 9: Quarterly Pig Slaughters ............................................................................................... 14
Figure 10: Quarterly Fresh Milk Output ....................................................................................... 15
Figure 11: Gold deliveries to FPR: Q2 2016 vs Q2 2017 ............................................................. 16
Figure 12: Trends in chrome ore exports & average ore prices .................................................... 17
Figure 13: Contribution of mining entities to total coal output: Jan-Sept 2017 ....................... 18
Figure 14: Trends in platinum output and international prices: Jan-Sept 2016 & 2017 ...... 18
Figure 15: Trends in palladium output and international prices: Jan-Sept 2016 & 2017 ............. 19
Figure 16: Trends in nickel production and international prices .................................................. 19
Figure 17: Quarterly diamond output (carats) .............................................................................. 19
Figure 18: Manufacturing Sector Capacity Utilization (%) .......................................................... 21
Figure 19: Electricity energy sent out (GWh): 2016 - 2017 ......................................................... 22
Figure 20: Annual Inflation Profile (%)........................................................................................ 23
Figure 21: Annual Broad Money Supply Growth Rates and Levels ............................................ 24
Figure 22: Sectoral Distribution of Credit .................................................................................... 25
Figure 23: Market Capitalization .................................................................................................. 25
Figure 24: Zimbabwe Stock Exchange Indices ............................................................................ 26
Figure 25: Market Turnover Value ............................................................................................... 26
Figure 26 : RTGS Values and Volumes ....................................................................................... 28
Figure 27: SWIFT Cross Border Transactions ............................................................................. 28
Figure 28: Over the Counter Cash Withdrawals ........................................................................... 29
Figure 29: Values of Retail Transactions...................................................................................... 29
Figure 30 : Volumes of Retail Transactions ................................................................................. 29
Figure 31: Total Collateral ............................................................................................................ 30
Figure 32: Revenue head performance: actual vs target ............................................................... 31
Figure 33: Composition of Tax Revenue: Jan-Sept 2017 ............................................................. 31
Figure 34: Expenditure head performance: 2017 vs 2016 ............................................................ 32
Figure 35: Composition of Government expenditure: Jan-Sep 2017 ........................................... 32
4
List of Tables
Table 1: Global Economic Growth & Outlook (%) ........................................................................ 6
Table 2: International Commodity Prices ....................................................................................... 7
Table 3: Exports Classified by HS Code (US$ millions) ............................................................ 10
Table 4: Major Export Destinations 2017 - 2nd & 3rd quarter 2017 (%). .................................... 10
Table 5: Output of selected key food and cash crops (ton) ........................................................... 12
Table 6: Comparison of tobacco sales in 2016 and 2017 ............................................................. 13
Table 7: Cumulative livestock slaughters as at 30 September 2017 ............................................. 14
Table 8: Quarterly Mining Production Statistics .......................................................................... 16
Table 9: Sub Sector Capacity Utilisation and Investments ........................................................... 20
Table 10: Oil Expressers Statistics ............................................................................................... 21
Table 11: Electricity output (GWh) - 2017 Q3 ............................................................................. 22
Table 12: Regional Annual Inflation Trends ................................................................................ 23
Table 13: Consolidated Transactional Activities .......................................................................... 27
Table 14: Payment Systems Access Points and Devices .............................................................. 30
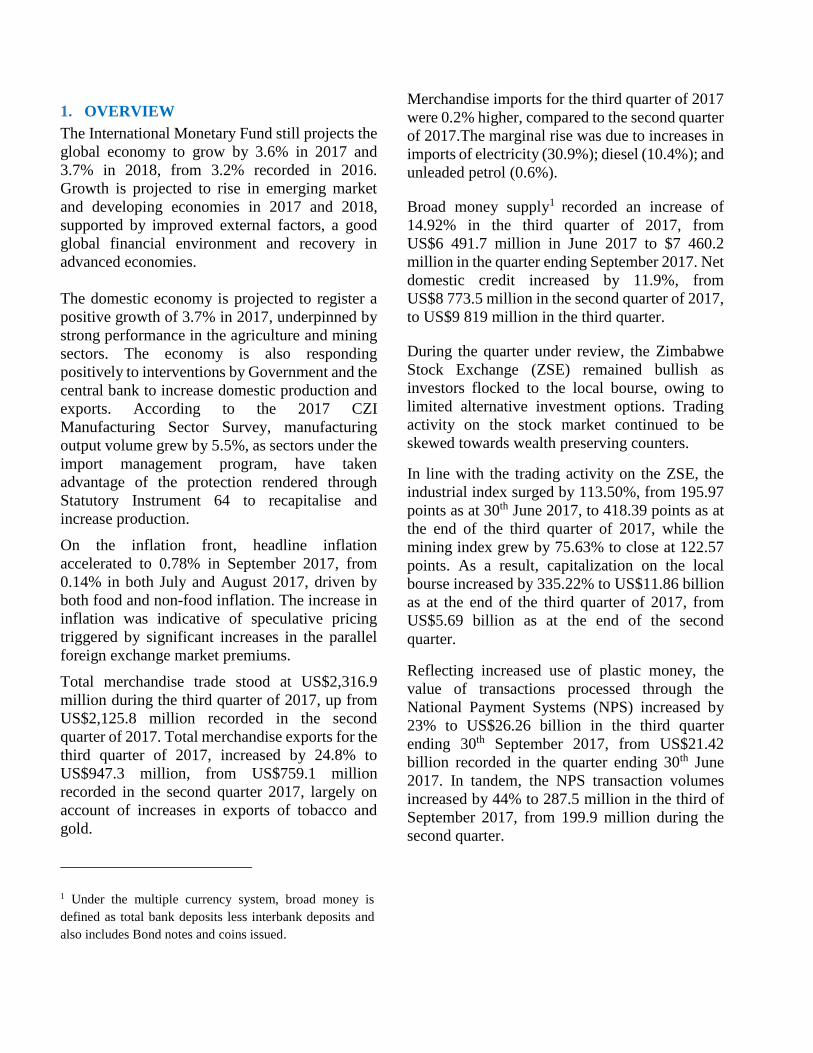
1. OVERVIEW
The International Monetary Fund still projects the
global economy to grow by 3.6% in 2017 and
3.7% in 2018, from 3.2% recorded in 2016.
Growth is projected to rise in emerging market
and developing economies in 2017 and 2018,
supported by improved external factors, a good
global financial environment and recovery in
advanced economies.
The domestic economy is projected to register a
positive growth of 3.7% in 2017, underpinned by
strong performance in the agriculture and mining
sectors. The economy is also responding
positively to interventions by Government and the
central bank to increase domestic production and
exports. According to the 2017 CZI
Manufacturing Sector Survey, manufacturing
output volume grew by 5.5%, as sectors under the
import management program, have taken
advantage of the protection rendered through
Statutory Instrument 64 to recapitalise and
increase production.
On the inflation front, headline inflation
accelerated to 0.78% in September 2017, from
0.14% in both July and August 2017, driven by
both food and non-food inflation. The increase in
inflation was indicative of speculative pricing
triggered by significant increases in the parallel
foreign exchange market premiums.
Total merchandise trade stood at US$2,316.9
million during the third quarter of 2017, up from
US$2,125.8 million recorded in the second
quarter of 2017. Total merchandise exports for the
third quarter of 2017, increased by 24.8% to
US$947.3 million, from US$759.1 million
recorded in the second quarter 2017, largely on
account of increases in exports of tobacco and
gold.
1 Under the multiple currency system, broad money is
defined as total bank deposits less interbank deposits and
also includes Bond notes and coins issued.
Merchandise imports for the third quarter of 2017
were 0.2% higher, compared to the second quarter
of 2017.The marginal rise was due to increases in
imports of electricity (30.9%); diesel (10.4%); and
unleaded petrol (0.6%).
Broad money supply1 recorded an increase of
14.92% in the third quarter of 2017, from
US$6 491.7 million in June 2017 to $7 460.2
million in the quarter ending September 2017. Net
domestic credit increased by 11.9%, from
US$8 773.5 million in the second quarter of 2017,
to US$9 819 million in the third quarter.
During the quarter under review, the Zimbabwe
Stock Exchange (ZSE) remained bullish as
investors flocked to the local bourse, owing to
limited alternative investment options. Trading
activity on the stock market continued to be
skewed towards wealth preserving counters.
In line with the trading activity on the ZSE, the
industrial index surged by 113.50%, from 195.97
points as at 30th June 2017, to 418.39 points as at
the end of the third quarter of 2017, while the
mining index grew by 75.63% to close at 122.57
points. As a result, capitalization on the local
bourse increased by 335.22% to US$11.86 billion
as at the end of the third quarter of 2017, from
US$5.69 billion as at the end of the second
quarter.
Reflecting increased use of plastic money, the
value of transactions processed through the
National Payment Systems (NPS) increased by
23% to US$26.26 billion in the third quarter
ending 30th September 2017, from US$21.42
billion recorded in the quarter ending 30th June
2017. In tandem, the NPS transaction volumes
increased by 44% to 287.5 million in the third of
September 2017, from 199.9 million during the
second quarter.
6
2. INTERNATIONAL ECONOMIC
DEVELOPMENTS
The IMF projects global growth to rise to 3.6% in
2017 and 3.7% in 2018, in its September 2017
World Economic Outlook (WEO) report. The
growth forecasts for both 2017 and 2018 are 0.1
percentage points higher, compared to the initial
projections in the April 2017 WEO report.
Broad-based upward revisions from the initial
projections in the April 2017 WEO report, were
made for the Euro area, Japan, emerging Asia,
emerging Europe, and Russia, where growth
outcomes in the first half of 2017 were better than
expected. The strong growth in these economies
more than offset downward revisions for the
United States and the United Kingdom. Economic
growth, however, remains weak in many
countries, with inflation below target in most
advanced economies.
Growth is projected to rise in 2017 and 2018 in
emerging market and developing economies,
supported by improved external factors, a good
global financial environment and recovery in
advanced economies. Growth in China and other
parts of emerging Asia remains strong, while the
still-difficult conditions faced by several
commodity exporters in Latin America, the
Commonwealth of Independent States, and sub-
Saharan Africa show some signs of improvement.
The growth prospects for emerging and
developing economies are up by 0.1 percentage
points for both 2017 and 2018, primarily owing to
a stronger growth projection for China. China’s
2017 forecast of 6.8 percent, reflects stronger
growth outturn in the first half of 2017 as well as
more buoyant external demand.
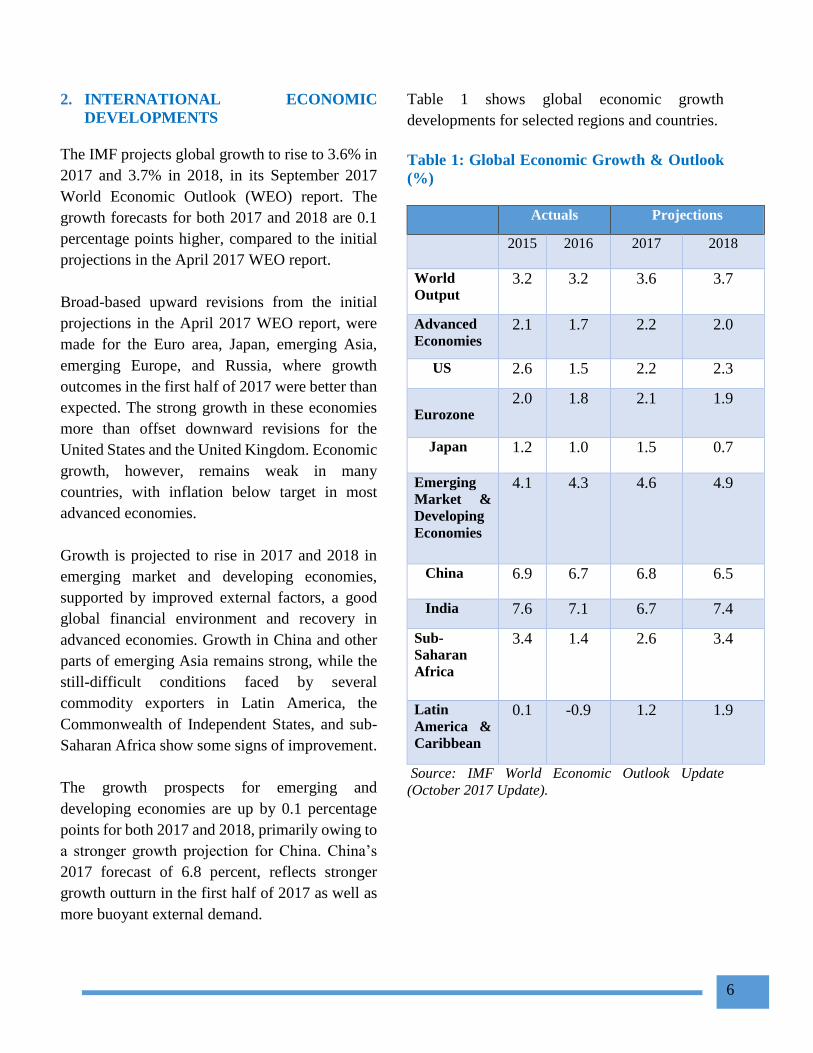
Table 1 shows global economic growth
developments for selected regions and countries.
Table 1: Global Economic Growth & Outlook
(%)
Actuals Projections
2015 2016 2017 2018
World
Output 3.2 3.2 3.6 3.7
Advanced
Economies 2.1 1.7 2.2 2.0
US 2.6 1.5 2.2 2.3
Eurozone 2.0 1.8 2.1 1.9
Japan 1.2 1.0 1.5 0.7
Emerging
Market &
Developing
Economies
4.1 4.3 4.6 4.9
China 6.9 6.7 6.8 6.5
India 7.6 7.1 6.7 7.4
Sub-
Saharan
Africa
3.4 1.4 2.6 3.4
Latin
America &
Caribbean
0.1 -0.9 1.2 1.9
Source: IMF World Economic Outlook Update
(October 2017 Update).
7
Economic Outlook in Sub-Saharan Africa
Economic growth in Sub-Saharan Africa is
projected at 2.6% in 2017 and 3.4% in 2018, with
sizable differences across countries.
Downside risks have risen because of idiosyncratic
factors in the region’s largest economies and
delays in implementing policy adjustments.
Beyond the near term, growth is expected to rise
gradually, but barely above population growth, as
large consolidation needs weigh in on public
spending.
Nigeria is expected to emerge from the 2016
recession caused by low oil prices and the
disruption of oil production. Growth in 2017 is
projected at 0.8%, owing to recovering oil
production and ongoing strength in the agricultural
sector. However, concerns about policy
implementation, market segmentation in a foreign
exchange market that remains dependent on central
bank interventions, despite initial steps to liberalize
the foreign exchange market, and banking-system
fragilities are expected to weigh down activity in
the medium term.
In South Africa, growth is projected to remain
subdued, at 0.7% in 2017 and 1.1% in 2018,
despite more favorable commodity export prices
and strong agricultural production. Heightened
political uncertainty continues to sap consumer and
business confidence.
The regional economies continued to face a
number of similar challenges in the most recent
past, which include rising debt levels and crowding
out of the private sector, since most of the countries
are reliant on public sector spending to support
growth. The increase in debt has been driven by
widening fiscal deficits, slow growth, declining
commodity prices and exchange rate depreciations
in other countries.
INTERNATIONAL COMMODITY PRICE
DEVELOPMENTS
During the third quarter of 2017, international
prices for most commodities generally firmed
from their average second quarter levels, with
notable increases recorded in base metals, on the
back of brighter demand prospects in China, the
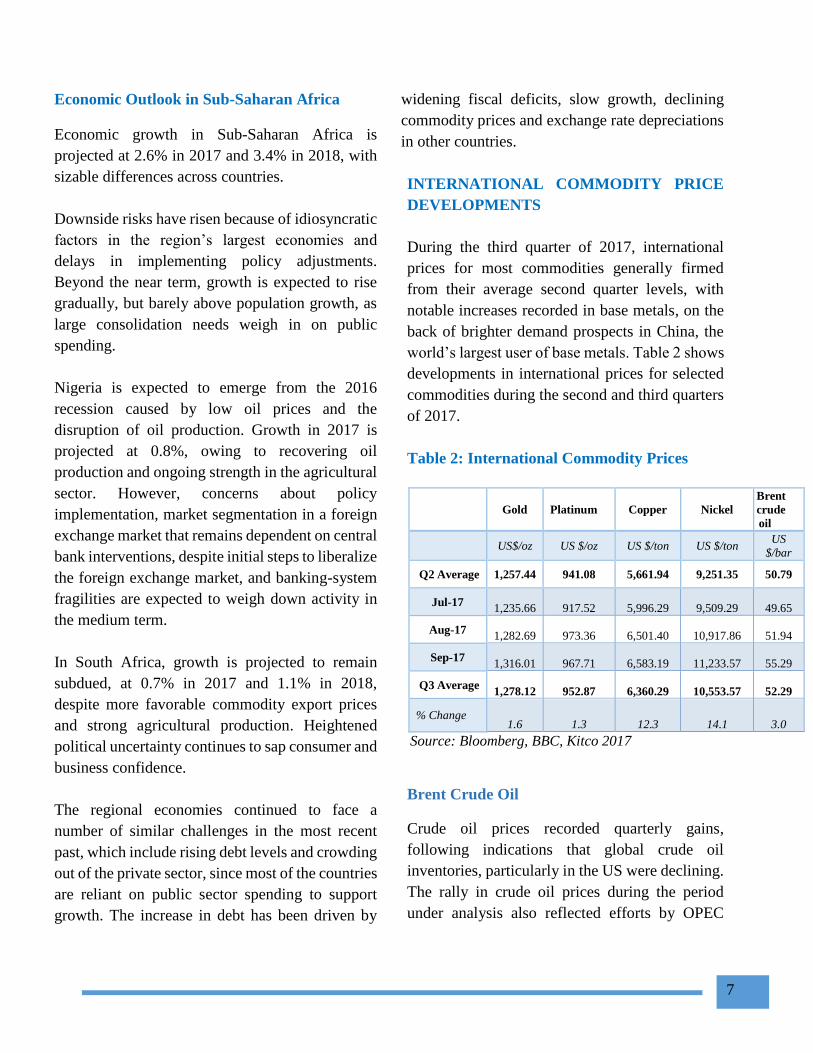
world’s largest user of base metals. Table 2 shows
developments in international prices for selected
commodities during the second and third quarters
of 2017.
Table 2: International Commodity Prices
Gold Platinum Copper Nickel
Brent
crude
oil
US$/oz US $/oz US $/ton US $/ton US
$/bar
Q2 Average 1,257.44 941.08 5,661.94 9,251.35 50.79
Jul-17 1,235.66 917.52 5,996.29 9,509.29 49.65
Aug-17 1,282.69 973.36 6,501.40 10,917.86 51.94
Sep-17 1,316.01 967.71 6,583.19 11,233.57 55.29
Q3 Average 1,278.12 952.87 6,360.29 10,553.57 52.29
% Change 1.6 1.3 12.3 14.1 3.0
Source: Bloomberg, BBC, Kitco 2017
Brent Crude Oil
Crude oil prices recorded quarterly gains,
following indications that global crude oil
inventories, particularly in the US were declining.
The rally in crude oil prices during the period
under analysis also reflected efforts by OPEC
8
member States to curb production as Saudi
Arabia, the organisation’s biggest producer,
announced further cuts in shipments as part of its
pledge to curb output, to reduce a global glut.
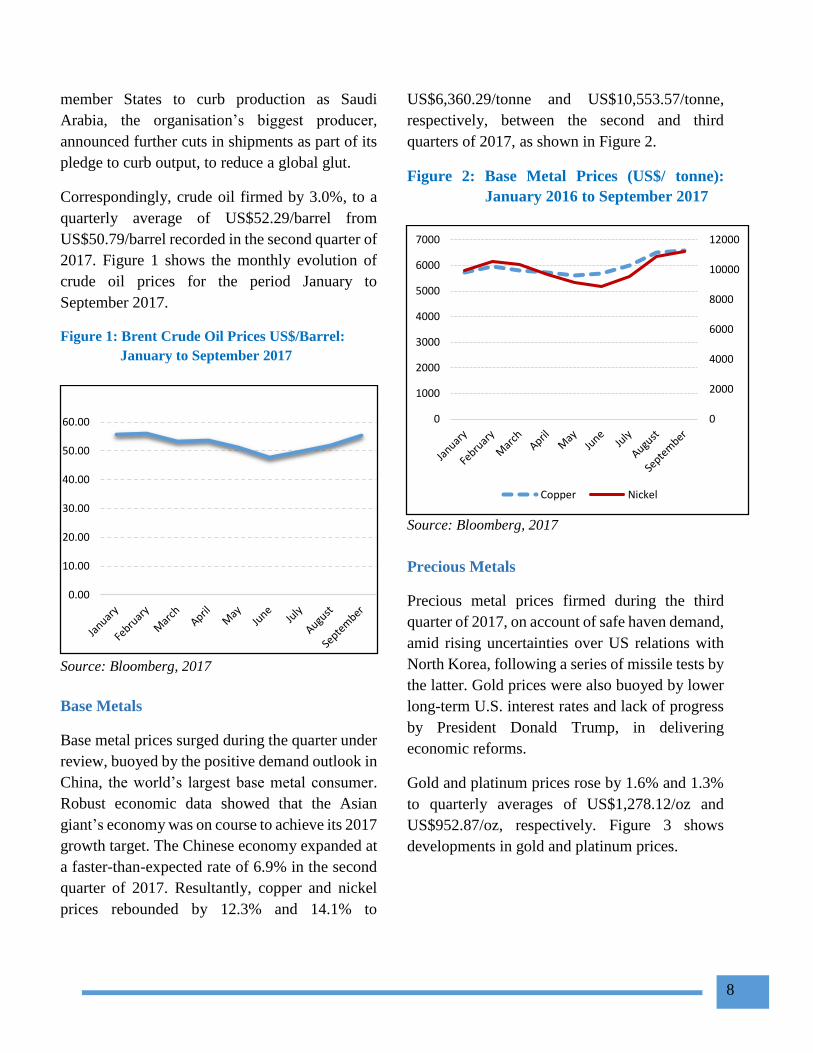
Correspondingly, crude oil firmed by 3.0%, to a
quarterly average of US$52.29/barrel from
US$50.79/barrel recorded in the second quarter of
2017. Figure 1 shows the monthly evolution of
crude oil prices for the period January to
September 2017.
Figure 1: Brent Crude Oil Prices US$/Barrel:
January to September 2017
Source: Bloomberg, 2017
Base Metals
Base metal prices surged during the quarter under
review, buoyed by the positive demand outlook in
China, the world’s largest base metal consumer.
Robust economic data showed that the Asian
giant’s economy was on course to achieve its 2017
growth target. The Chinese economy expanded at
a faster-than-expected rate of 6.9% in the second
quarter of 2017. Resultantly, copper and nickel
prices rebounded by 12.3% and 14.1% to
US$6,360.29/tonne and US$10,553.57/tonne,
respectively, between the second and third
quarters of 2017, as shown in Figure 2.
Figure 2: Base Metal Prices (US$/ tonne):
January 2016 to September 2017
Source: Bloomberg, 2017
Precious Metals
Precious metal prices firmed during the third
quarter of 2017, on account of safe haven demand,
amid rising uncertainties over US relations with
North Korea, following a series of missile tests by
the latter. Gold prices were also buoyed by lower
long-term U.S. interest rates and lack of progress
by President Donald Trump, in delivering
economic reforms.
Gold and platinum prices rose by 1.6% and 1.3%
to quarterly averages of US$1,278.12/oz and
US$952.87/oz, respectively. Figure 3 shows
developments in gold and platinum prices.
0.00
10.00
20.00
30.00
40.00
50.00
60.00 0
2000
4000
6000
8000
10000
12000
0
1000
2000
3000
4000
5000
6000
7000
Copper Nickel
9
Figure 3: Precious Minerals Prices: January to
September 2017
Source: Bloomberg, 2017
MERCHANDISE TRADE
DEVELOPMENTS
Total merchandise trade stood at US$2,316.9
million during the third quarter of 2017,
representing 20.7% increase from the US$1,919.9
million recorded in the corresponding quarter in
2016. On a quarter on quarter basis, total
merchandise trade, also rose by 9.0%, from
US$2,125.8 million in the second quarter to
US$2,316.9 million in the third quarter of 2017.
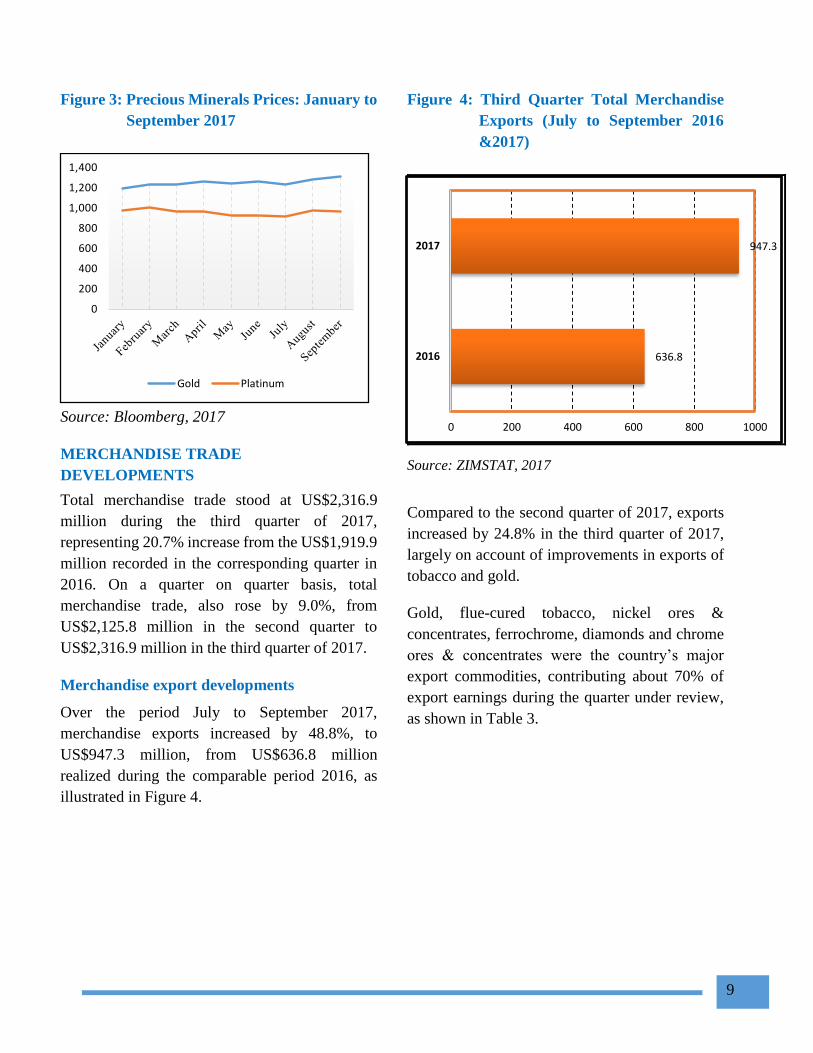
Merchandise export developments
Over the period July to September 2017,
merchandise exports increased by 48.8%, to
US$947.3 million, from US$636.8 million
realized during the comparable period 2016, as
illustrated in Figure 4.
Figure 4: Third Quarter Total Merchandise
Exports (July to September 2016
&2017)
Source: ZIMSTAT, 2017
Compared to the second quarter of 2017, exports
increased by 24.8% in the third quarter of 2017,
largely on account of improvements in exports of
tobacco and gold.
Gold, flue-cured tobacco, nickel ores &
concentrates, ferrochrome, diamonds and chrome
ores & concentrates were the country’s major
export commodities, contributing about 70% of
export earnings during the quarter under review,
as shown in Table 3.
0
200
400
600
800
1,000
1,200
1,400
Gold Platinum
636.8
947.3
0 200 400 600 800 1000
2016
2017
10
Table 3: Exports Classified by HS Code (US$
millions) & Share of Total
exports for 2017 Q2 & Q3 2017
(%)
Commodity
2017
Q2
2017
Q3
2017
Q2-Q3
2017
Q3
US$ m US$ m Change
(%)
Share
(%)
Gold 211.6 286.5 35.4 30.2
Flue-cured
tobacco
(Virginia
type)
46.1 156.2 238.9 16.5
Nickel ores
and
concentrates
85.8 110.7 29.0 11.7
Ferrochrome 79.3 72.8 (8.2) 7.7
Industrial
diamonds
16.5 22.2 34.4 2.3
Chromium
ores and
concentrates
23.0 17.3 (24.9) 1.8
Ginned
cotton
0.8 17.5 2,096.3 1.8
Unwrought
Platinum
11.7 13.5 15.6 1.4
Cane sugar 20.2 16.5 (18.2) 1.7
Other 264.0 234.0 (11.4) 24.7
Total 759.1 947.3 24.8 100
Source: Zimstat, 2016 & RBZ calculations, 2017
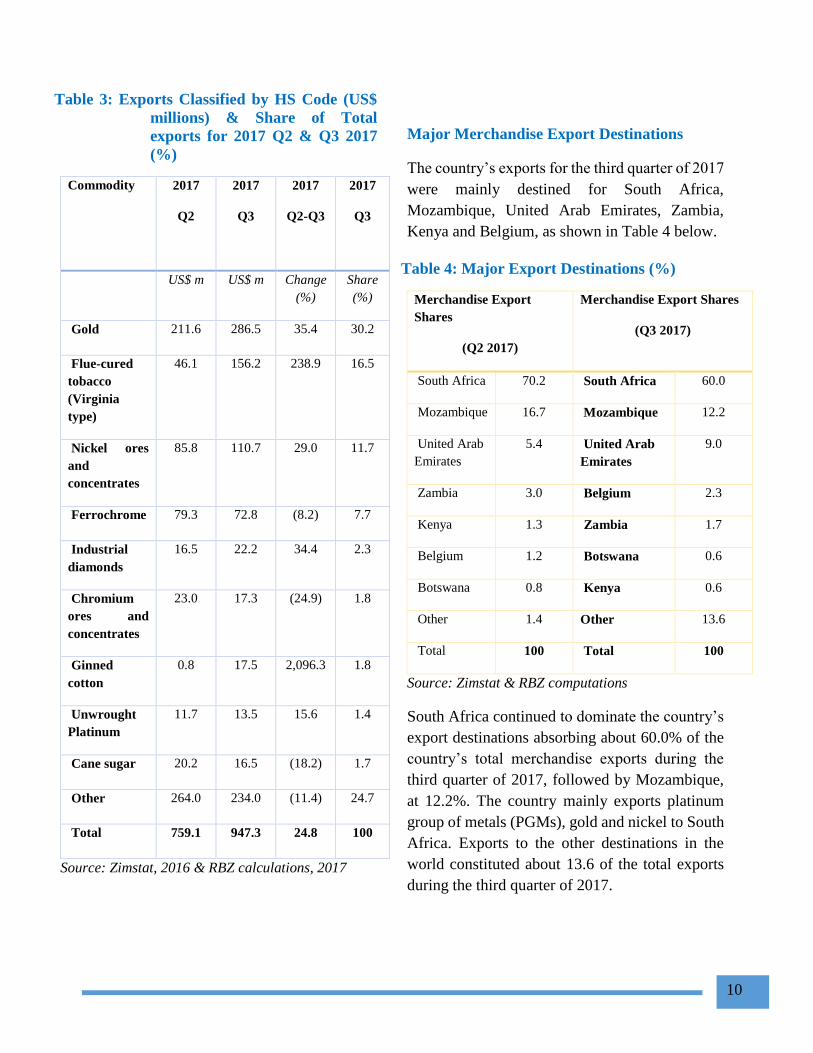
Major Merchandise Export Destinations
The country’s exports for the third quarter of 2017
were mainly destined for South Africa,
Mozambique, United Arab Emirates, Zambia,
Kenya and Belgium, as shown in Table 4 below.
Table 4: Major Export Destinations (%)
Merchandise Export
Shares
(Q2 2017)
Merchandise Export Shares
(Q3 2017)
South Africa 70.2 South Africa 60.0
Mozambique 16.7 Mozambique 12.2
United Arab
Emirates
5.4 United Arab
Emirates
9.0
Zambia 3.0 Belgium 2.3
Kenya 1.3 Zambia 1.7
Belgium 1.2 Botswana 0.6
Botswana 0.8 Kenya 0.6
Other 1.4 Other 13.6
Total 100 Total 100
Source: Zimstat & RBZ computations
South Africa continued to dominate the country’s
export destinations absorbing about 60.0% of the
country’s total merchandise exports during the
third quarter of 2017, followed by Mozambique,
at 12.2%. The country mainly exports platinum
group of metals (PGMs), gold and nickel to South
Africa. Exports to the other destinations in the
world constituted about 13.6 of the total exports
during the third quarter of 2017.
11
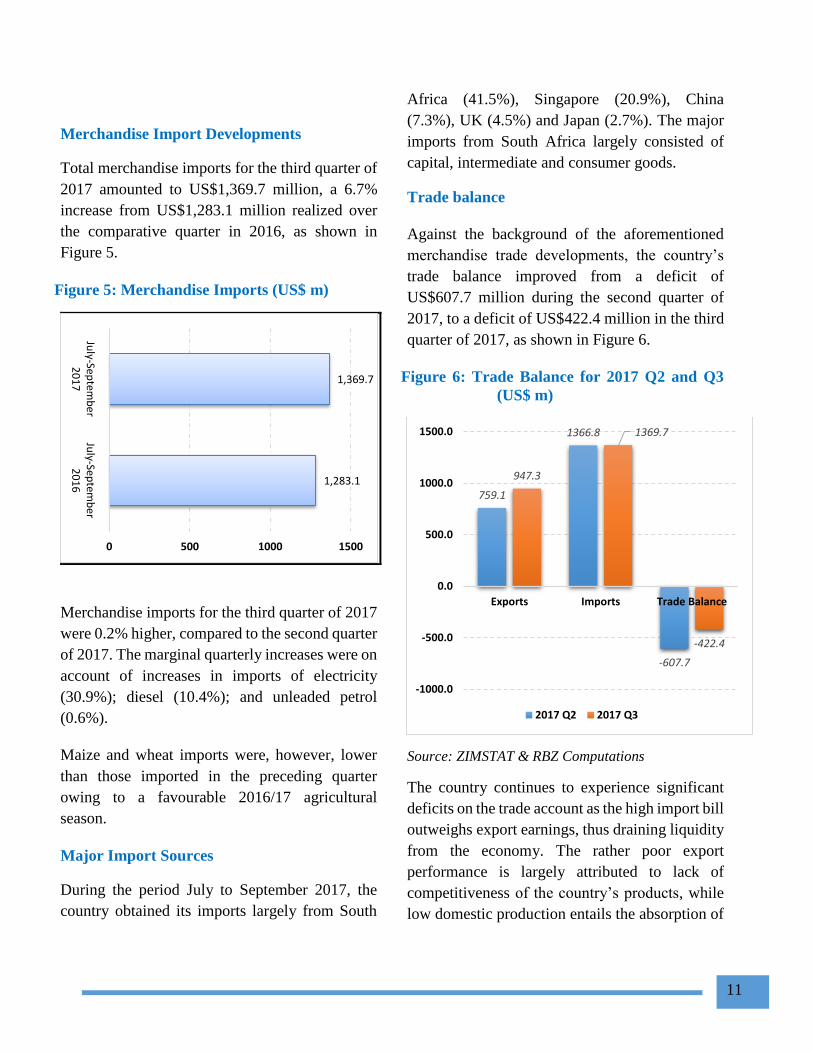
Merchandise Import Developments
Total merchandise imports for the third quarter of
2017 amounted to US$1,369.7 million, a 6.7%
increase from US$1,283.1 million realized over
the comparative quarter in 2016, as shown in
Figure 5.
Figure 5: Merchandise Imports (US$ m)
Merchandise imports for the third quarter of 2017
were 0.2% higher, compared to the second quarter
of 2017. The marginal quarterly increases were on
account of increases in imports of electricity
(30.9%); diesel (10.4%); and unleaded petrol
(0.6%).
Maize and wheat imports were, however, lower
than those imported in the preceding quarter
owing to a favourable 2016/17 agricultural
season.
Major Import Sources
During the period July to September 2017, the
country obtained its imports largely from South
Africa (41.5%), Singapore (20.9%), China
(7.3%), UK (4.5%) and Japan (2.7%). The major
imports from South Africa largely consisted of
capital, intermediate and consumer goods.
Trade balance
Against the background of the aforementioned
merchandise trade developments, the country’s
trade balance improved from a deficit of
US$607.7 million during the second quarter of
2017, to a deficit of US$422.4 million in the third
quarter of 2017, as shown in Figure 6.
Figure 6: Trade Balance for 2017 Q2 and Q3
(US$ m)
Source: ZIMSTAT & RBZ Computations
The country continues to experience significant
deficits on the trade account as the high import bill
outweighs export earnings, thus draining liquidity
from the economy. The rather poor export
performance is largely attributed to lack of
competitiveness of the country’s products, while
low domestic production entails the absorption of
1,283.1
1,369.7
0 500 1000 1500
July-Sep
temb
er
20
16
July-Sep
temb
er
20
17
759.1
1366.8
-607.7
947.3
1369.7
-422.4
-1000.0
-500.0
0.0
500.0
1000.0
1500.0
Exports Imports Trade Balance
2017 Q2 2017 Q3
12
a huge amount of imports. In this regard, there is
need to attract both domestic and foreign
investment to rejuvenate industry, make
significant competitiveness gains and generate
adequate foreign exchange buffers to cushion the
economy from external shocks.
3. DOMESTIC ECONOMIC
DEVELOPMENTS
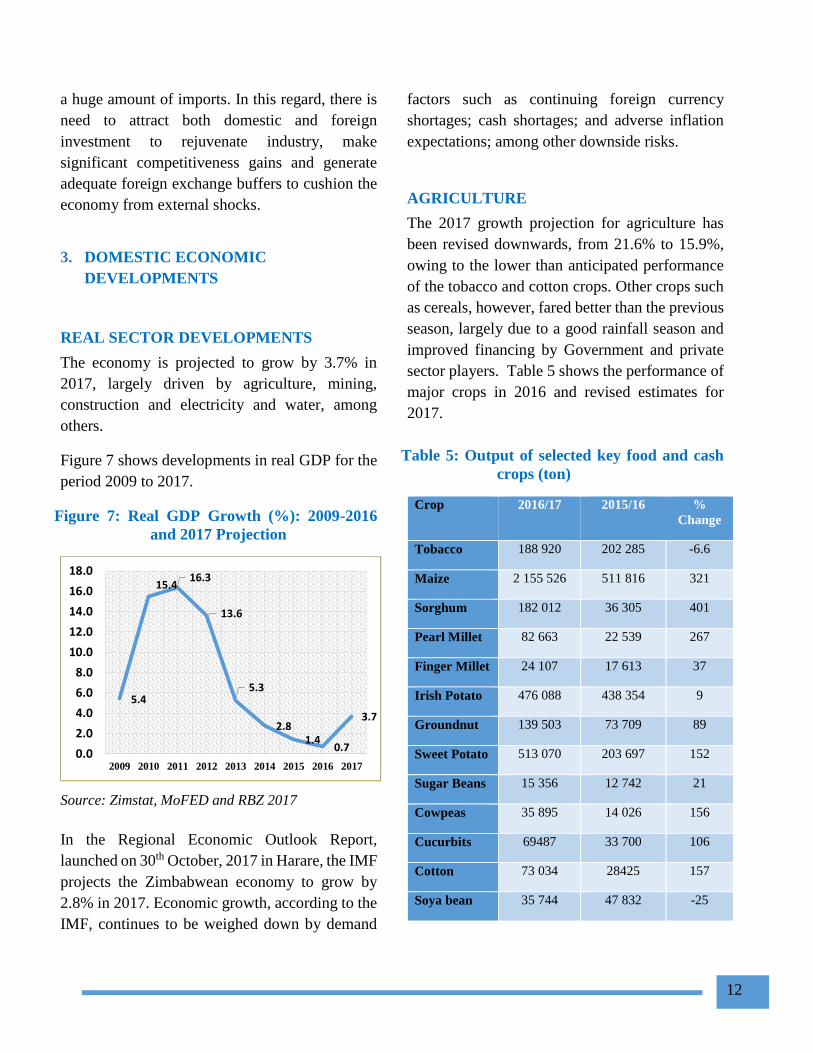
REAL SECTOR DEVELOPMENTS
The economy is projected to grow by 3.7% in
2017, largely driven by agriculture, mining,
construction and electricity and water, among
others.
Figure 7 shows developments in real GDP for the
period 2009 to 2017.
Figure 7: Real GDP Growth (%): 2009-2016
and 2017 Projection
Source: Zimstat, MoFED and RBZ 2017
In the Regional Economic Outlook Report,
launched on 30th October, 2017 in Harare, the IMF
projects the Zimbabwean economy to grow by
2.8% in 2017. Economic growth, according to the
IMF, continues to be weighed down by demand
factors such as continuing foreign currency
shortages; cash shortages; and adverse inflation
expectations; among other downside risks.
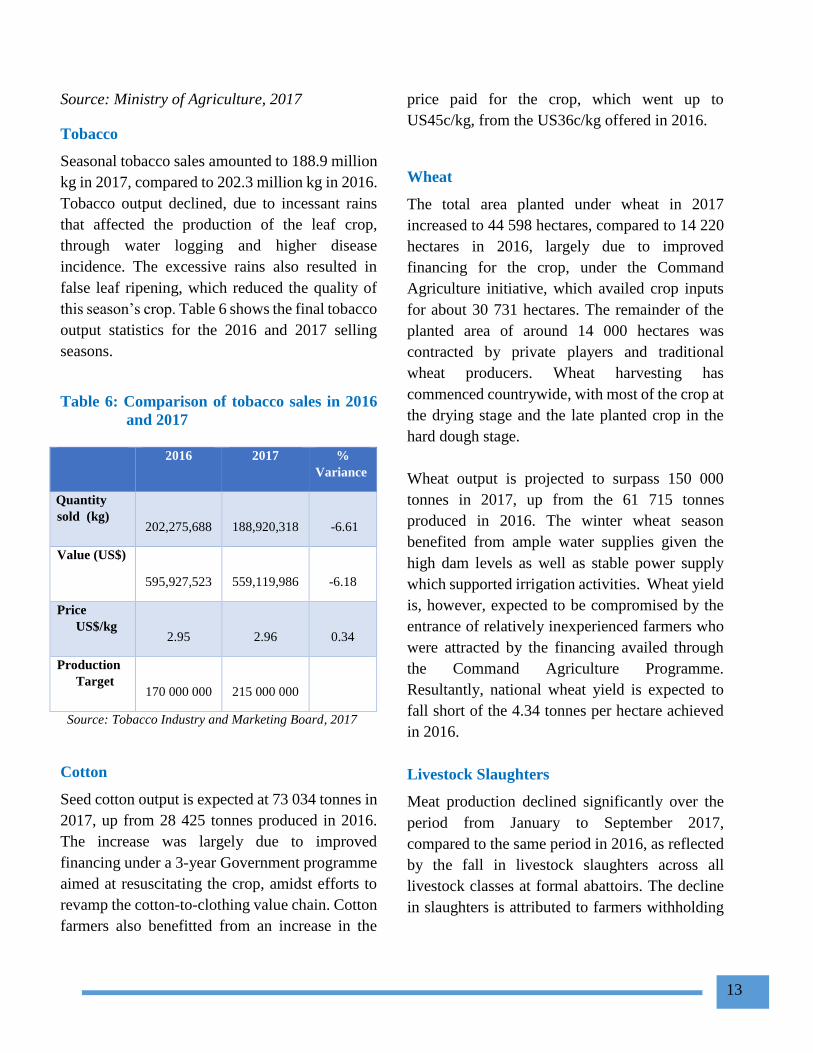
AGRICULTURE
The 2017 growth projection for agriculture has
been revised downwards, from 21.6% to 15.9%,
owing to the lower than anticipated performance
of the tobacco and cotton crops. Other crops such
as cereals, however, fared better than the previous
season, largely due to a good rainfall season and
improved financing by Government and private
sector players. Table 5 shows the performance of
major crops in 2016 and revised estimates for
2017.
Table 5: Output of selected key food and cash
crops (ton)
Crop 2016/17 2015/16 %
Change
Tobacco 188 920 202 285 -6.6
Maize 2 155 526 511 816 321
Sorghum 182 012 36 305 401
Pearl Millet 82 663 22 539 267
Finger Millet 24 107 17 613 37
Irish Potato 476 088 438 354 9
Groundnut 139 503 73 709 89
Sweet Potato 513 070 203 697 152
Sugar Beans 15 356 12 742 21
Cowpeas 35 895 14 026 156
Cucurbits 69487 33 700 106
Cotton 73 034 28425 157
Soya bean 35 744 47 832 -25
5.4
15.416.3
13.6
5.3
2.81.4
0.7
3.7
0.0
2.0
4.0
6.0
8.0
10.0
12.0
14.0
16.0
18.0
2009 2010 2011 2012 2013 2014 2015 2016 2017
13
Source: Ministry of Agriculture, 2017
Tobacco
Seasonal tobacco sales amounted to 188.9 million
kg in 2017, compared to 202.3 million kg in 2016.
Tobacco output declined, due to incessant rains
that affected the production of the leaf crop,
through water logging and higher disease
incidence. The excessive rains also resulted in
false leaf ripening, which reduced the quality of
this season’s crop. Table 6 shows the final tobacco
output statistics for the 2016 and 2017 selling
seasons.
Table 6: Comparison of tobacco sales in 2016
and 2017
2016 2017 %
Variance
Quantity
sold (kg)
202,275,688
188,920,318
-6.61
Value (US$)
595,927,523
559,119,986
-6.18
Price
US$/kg 2.95 2.96
0.34
Production
Target
170 000 000
215 000 000
Source: Tobacco Industry and Marketing Board, 2017
Cotton
Seed cotton output is expected at 73 034 tonnes in
2017, up from 28 425 tonnes produced in 2016.
The increase was largely due to improved
financing under a 3-year Government programme
aimed at resuscitating the crop, amidst efforts to
revamp the cotton-to-clothing value chain. Cotton
farmers also benefitted from an increase in the
price paid for the crop, which went up to
US45c/kg, from the US36c/kg offered in 2016.
Wheat
The total area planted under wheat in 2017
increased to 44 598 hectares, compared to 14 220
hectares in 2016, largely due to improved
financing for the crop, under the Command
Agriculture initiative, which availed crop inputs
for about 30 731 hectares. The remainder of the
planted area of around 14 000 hectares was
contracted by private players and traditional
wheat producers. Wheat harvesting has
commenced countrywide, with most of the crop at
the drying stage and the late planted crop in the
hard dough stage.
Wheat output is projected to surpass 150 000
tonnes in 2017, up from the 61 715 tonnes
produced in 2016. The winter wheat season
benefited from ample water supplies given the
high dam levels as well as stable power supply
which supported irrigation activities. Wheat yield
is, however, expected to be compromised by the
entrance of relatively inexperienced farmers who
were attracted by the financing availed through
the Command Agriculture Programme.
Resultantly, national wheat yield is expected to
fall short of the 4.34 tonnes per hectare achieved
in 2016.
Livestock Slaughters
Meat production declined significantly over the
period from January to September 2017,
compared to the same period in 2016, as reflected
by the fall in livestock slaughters across all
livestock classes at formal abattoirs. The decline
in slaughters is attributed to farmers withholding
14
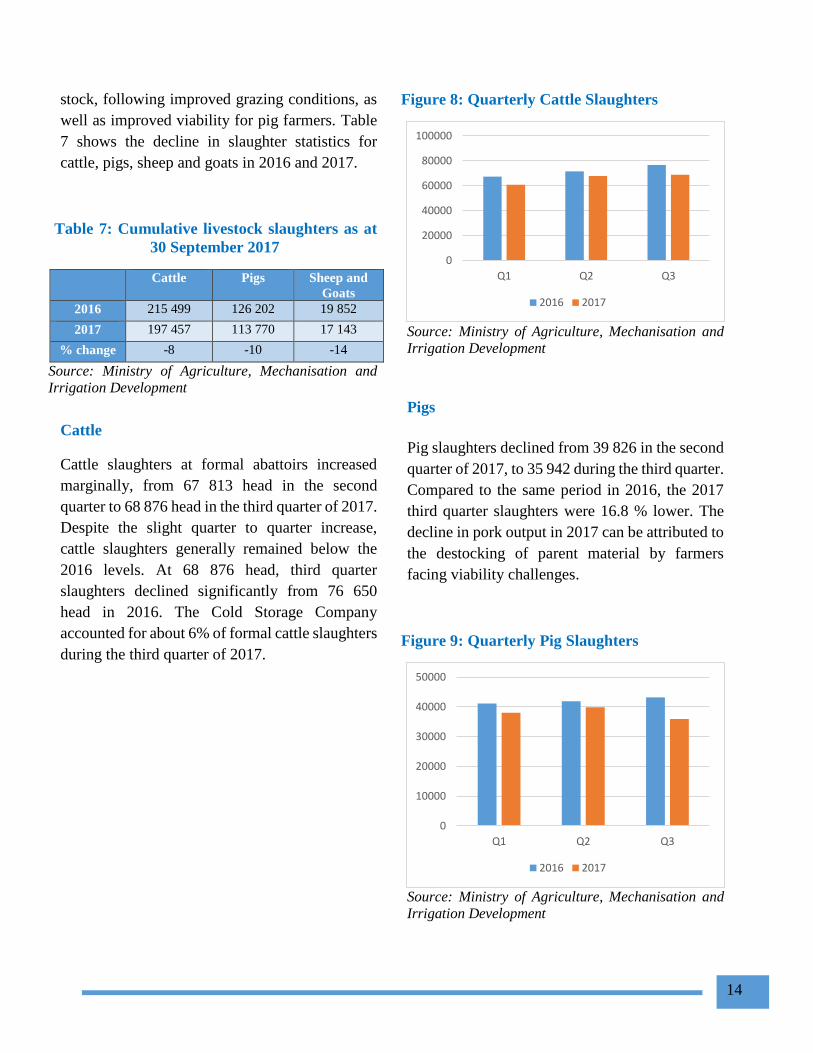
stock, following improved grazing conditions, as
well as improved viability for pig farmers. Table
7 shows the decline in slaughter statistics for
cattle, pigs, sheep and goats in 2016 and 2017.
Table 7: Cumulative livestock slaughters as at
30 September 2017
Cattle Pigs Sheep and
Goats
2016 215 499 126 202 19 852
2017 197 457 113 770 17 143
% change -8 -10 -14
Source: Ministry of Agriculture, Mechanisation and
Irrigation Development
Cattle
Cattle slaughters at formal abattoirs increased
marginally, from 67 813 head in the second
quarter to 68 876 head in the third quarter of 2017.
Despite the slight quarter to quarter increase,
cattle slaughters generally remained below the
2016 levels. At 68 876 head, third quarter
slaughters declined significantly from 76 650
head in 2016. The Cold Storage Company
accounted for about 6% of formal cattle slaughters
during the third quarter of 2017.
Figure 8: Quarterly Cattle Slaughters
Source: Ministry of Agriculture, Mechanisation and
Irrigation Development
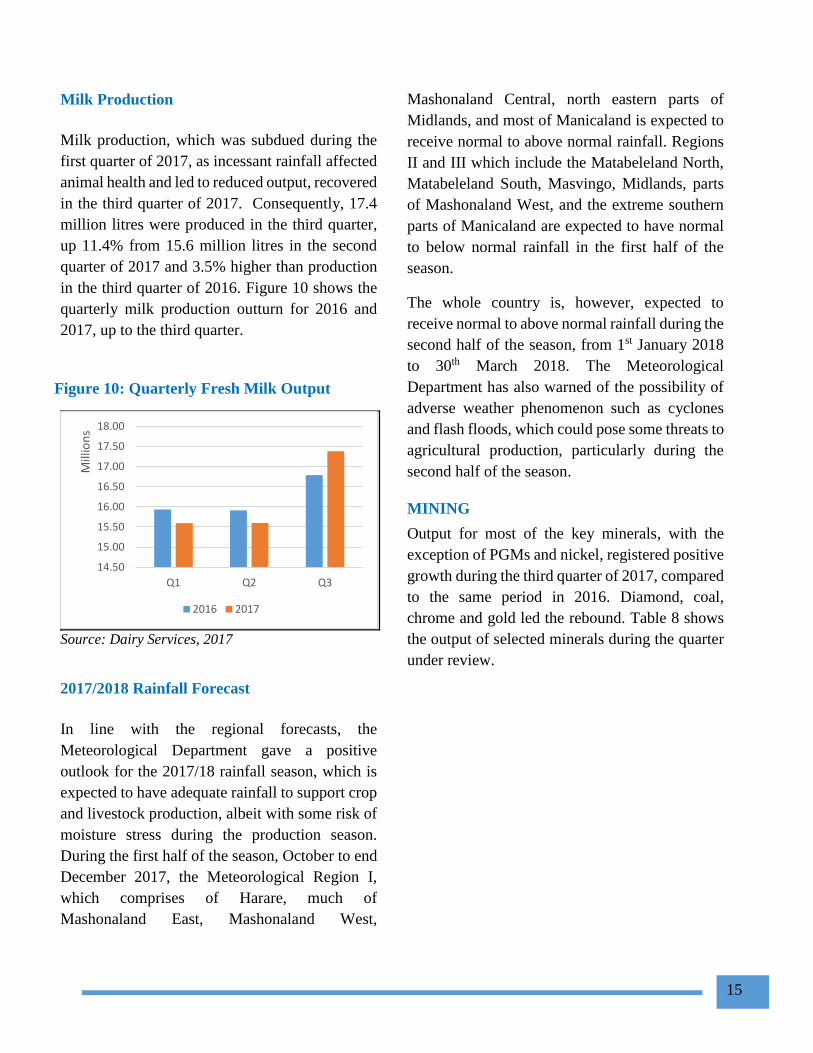
Pigs
Pig slaughters declined from 39 826 in the second
quarter of 2017, to 35 942 during the third quarter.
Compared to the same period in 2016, the 2017
third quarter slaughters were 16.8 % lower. The
decline in pork output in 2017 can be attributed to
the destocking of parent material by farmers
facing viability challenges.
Figure 9: Quarterly Pig Slaughters
Source: Ministry of Agriculture, Mechanisation and
Irrigation Development
0
20000
40000
60000
80000
100000
Q1 Q2 Q3
2016 2017
0
10000
20000
30000
40000
50000
Q1 Q2 Q3
2016 2017
15
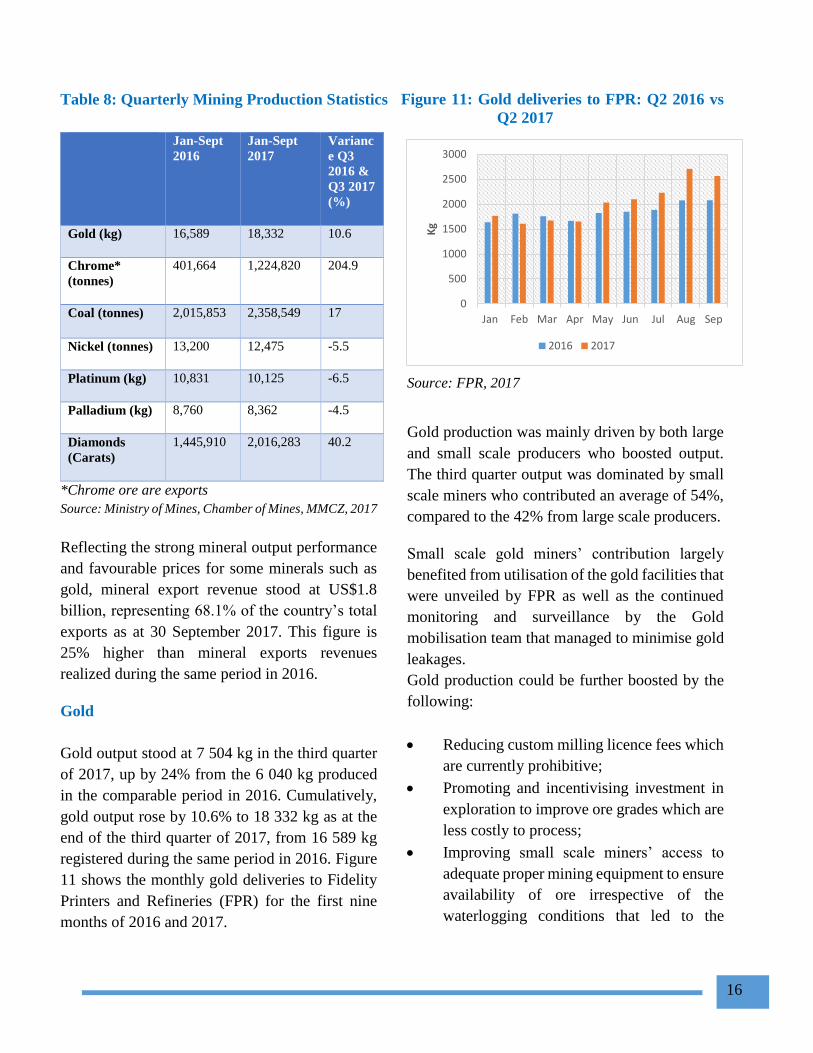
Milk Production
Milk production, which was subdued during the
first quarter of 2017, as incessant rainfall affected
animal health and led to reduced output, recovered
in the third quarter of 2017. Consequently, 17.4
million litres were produced in the third quarter,
up 11.4% from 15.6 million litres in the second
quarter of 2017 and 3.5% higher than production
in the third quarter of 2016. Figure 10 shows the
quarterly milk production outturn for 2016 and
2017, up to the third quarter.
Figure 10: Quarterly Fresh Milk Output
Source: Dairy Services, 2017
2017/2018 Rainfall Forecast
In line with the regional forecasts, the
Meteorological Department gave a positive
outlook for the 2017/18 rainfall season, which is
expected to have adequate rainfall to support crop
and livestock production, albeit with some risk of
moisture stress during the production season.
During the first half of the season, October to end
December 2017, the Meteorological Region I,
which comprises of Harare, much of
Mashonaland East, Mashonaland West,
Mashonaland Central, north eastern parts of
Midlands, and most of Manicaland is expected to
receive normal to above normal rainfall. Regions
II and III which include the Matabeleland North,
Matabeleland South, Masvingo, Midlands, parts
of Mashonaland West, and the extreme southern
parts of Manicaland are expected to have normal
to below normal rainfall in the first half of the
season.
The whole country is, however, expected to
receive normal to above normal rainfall during the
second half of the season, from 1st January 2018
to 30th March 2018. The Meteorological
Department has also warned of the possibility of
adverse weather phenomenon such as cyclones
and flash floods, which could pose some threats to
agricultural production, particularly during the
second half of the season.
MINING
Output for most of the key minerals, with the
exception of PGMs and nickel, registered positive
growth during the third quarter of 2017, compared
to the same period in 2016. Diamond, coal,
chrome and gold led the rebound. Table 8 shows
the output of selected minerals during the quarter
under review.
14.50
15.00
15.50
16.00
16.50
17.00
17.50
18.00
Q1 Q2 Q3
Mill
ion
s
2016 2017
16
Table 8: Quarterly Mining Production Statistics
Jan-Sept
2016
Jan-Sept
2017
Varianc
e Q3
2016 &
Q3 2017
(%)
Gold (kg) 16,589 18,332 10.6
Chrome*
(tonnes)
401,664 1,224,820 204.9
Coal (tonnes) 2,015,853 2,358,549 17
Nickel (tonnes) 13,200 12,475 -5.5
Platinum (kg) 10,831 10,125 -6.5
Palladium (kg) 8,760 8,362 -4.5
Diamonds
(Carats)
1,445,910 2,016,283 40.2
*Chrome ore are exports
Source: Ministry of Mines, Chamber of Mines, MMCZ, 2017
Reflecting the strong mineral output performance
and favourable prices for some minerals such as
gold, mineral export revenue stood at US$1.8
billion, representing 68.1% of the country’s total
exports as at 30 September 2017. This figure is
25% higher than mineral exports revenues
realized during the same period in 2016.
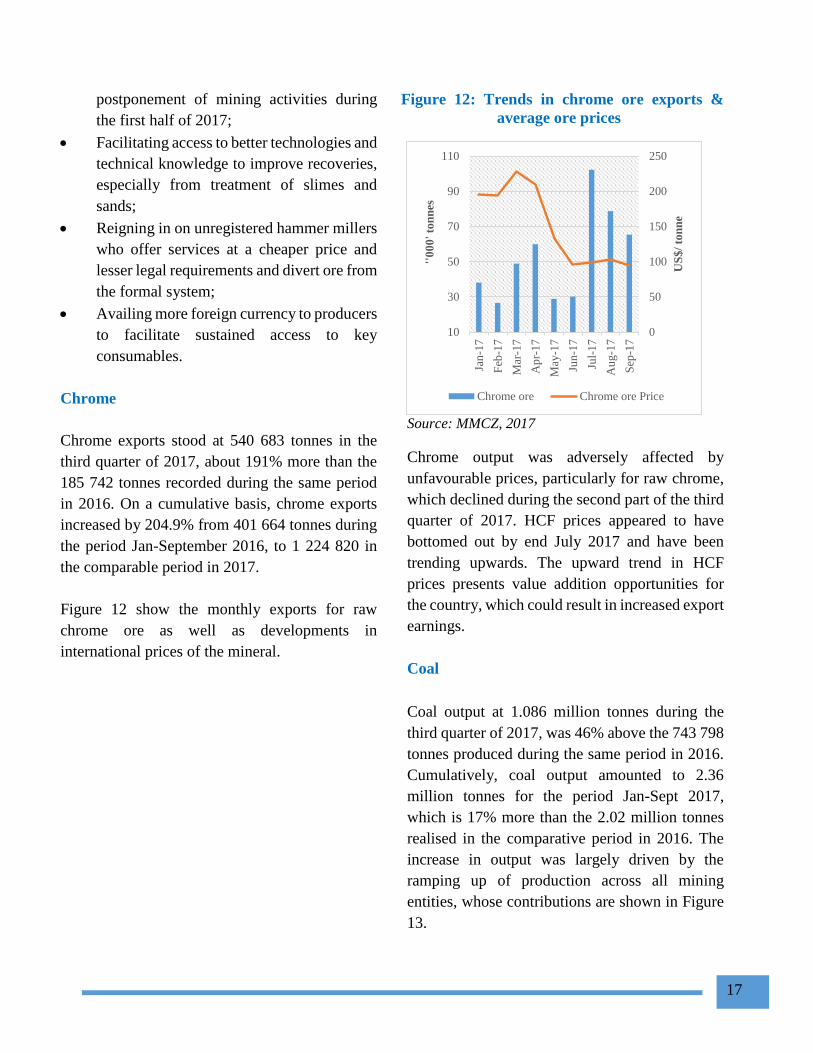
Gold
Gold output stood at 7 504 kg in the third quarter
of 2017, up by 24% from the 6 040 kg produced
in the comparable period in 2016. Cumulatively,
gold output rose by 10.6% to 18 332 kg as at the
end of the third quarter of 2017, from 16 589 kg
registered during the same period in 2016. Figure
11 shows the monthly gold deliveries to Fidelity
Printers and Refineries (FPR) for the first nine
months of 2016 and 2017.
Figure 11: Gold deliveries to FPR: Q2 2016 vs
Q2 2017
Source: FPR, 2017
Gold production was mainly driven by both large
and small scale producers who boosted output.
The third quarter output was dominated by small
scale miners who contributed an average of 54%,
compared to the 42% from large scale producers.
Small scale gold miners’ contribution largely
benefited from utilisation of the gold facilities that
were unveiled by FPR as well as the continued
monitoring and surveillance by the Gold
mobilisation team that managed to minimise gold
leakages.
Gold production could be further boosted by the
following:
Reducing custom milling licence fees which
are currently prohibitive;
Promoting and incentivising investment in
exploration to improve ore grades which are
less costly to process;
Improving small scale miners’ access to
adequate proper mining equipment to ensure
availability of ore irrespective of the
waterlogging conditions that led to the
0
500
1000
1500
2000
2500
3000
Jan Feb Mar Apr May Jun Jul Aug Sep
Kg
2016 2017
17
postponement of mining activities during
the first half of 2017;
Facilitating access to better technologies and
technical knowledge to improve recoveries,
especially from treatment of slimes and
sands;
Reigning in on unregistered hammer millers
who offer services at a cheaper price and
lesser legal requirements and divert ore from
the formal system;
Availing more foreign currency to producers
to facilitate sustained access to key
consumables.
Chrome
Chrome exports stood at 540 683 tonnes in the
third quarter of 2017, about 191% more than the
185 742 tonnes recorded during the same period
in 2016. On a cumulative basis, chrome exports
increased by 204.9% from 401 664 tonnes during
the period Jan-September 2016, to 1 224 820 in
the comparable period in 2017.
Figure 12 show the monthly exports for raw
chrome ore as well as developments in
international prices of the mineral.
Figure 12: Trends in chrome ore exports &
average ore prices
Source: MMCZ, 2017
Chrome output was adversely affected by
unfavourable prices, particularly for raw chrome,
which declined during the second part of the third
quarter of 2017. HCF prices appeared to have
bottomed out by end July 2017 and have been
trending upwards. The upward trend in HCF
prices presents value addition opportunities for
the country, which could result in increased export
earnings.
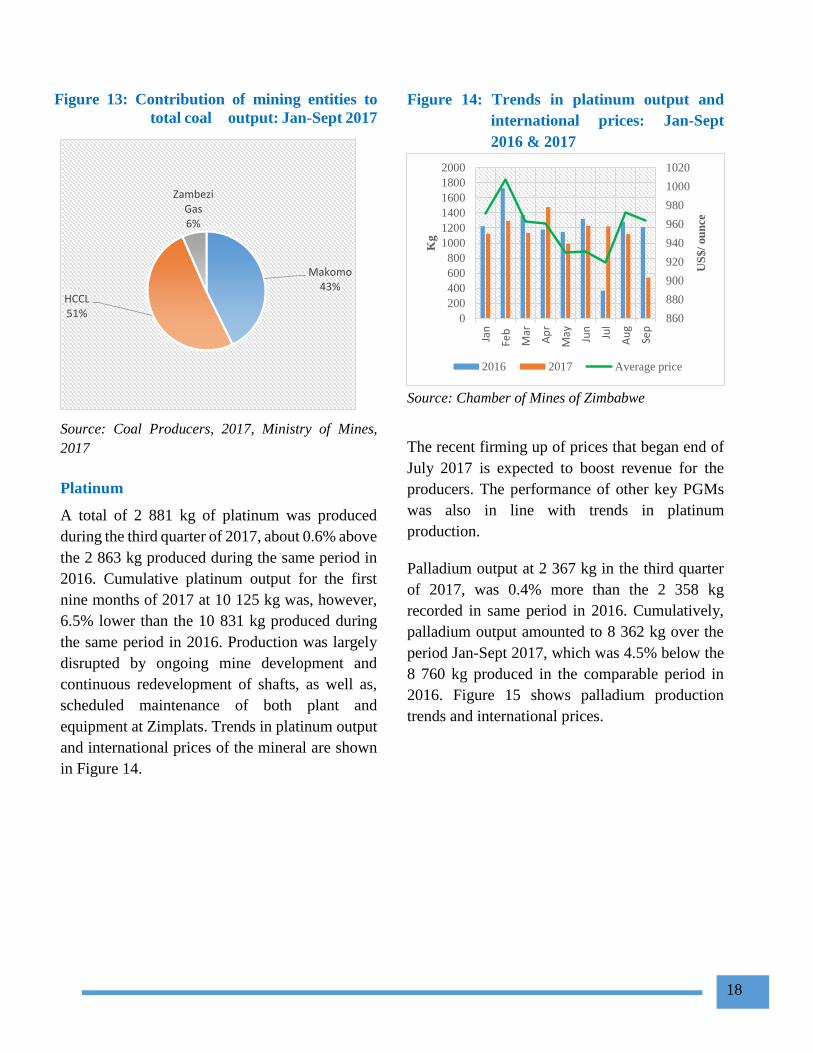
Coal
Coal output at 1.086 million tonnes during the
third quarter of 2017, was 46% above the 743 798
tonnes produced during the same period in 2016.
Cumulatively, coal output amounted to 2.36
million tonnes for the period Jan-Sept 2017,
which is 17% more than the 2.02 million tonnes
realised in the comparative period in 2016. The
increase in output was largely driven by the
ramping up of production across all mining
entities, whose contributions are shown in Figure
13.
0
50
100
150
200
250
10
30
50
70
90
110
Jan
-17
Feb
-17
Mar
-17
Ap
r-17
May
-17
Jun-1
7
Jul-
17
Au
g-1
7
Sep
-17
US
$/
ton
ne
''0
00
' to
nn
es
Chrome ore Chrome ore Price
18
Figure 13: Contribution of mining entities to
total coal output: Jan-Sept 2017
Source: Coal Producers, 2017, Ministry of Mines,
2017
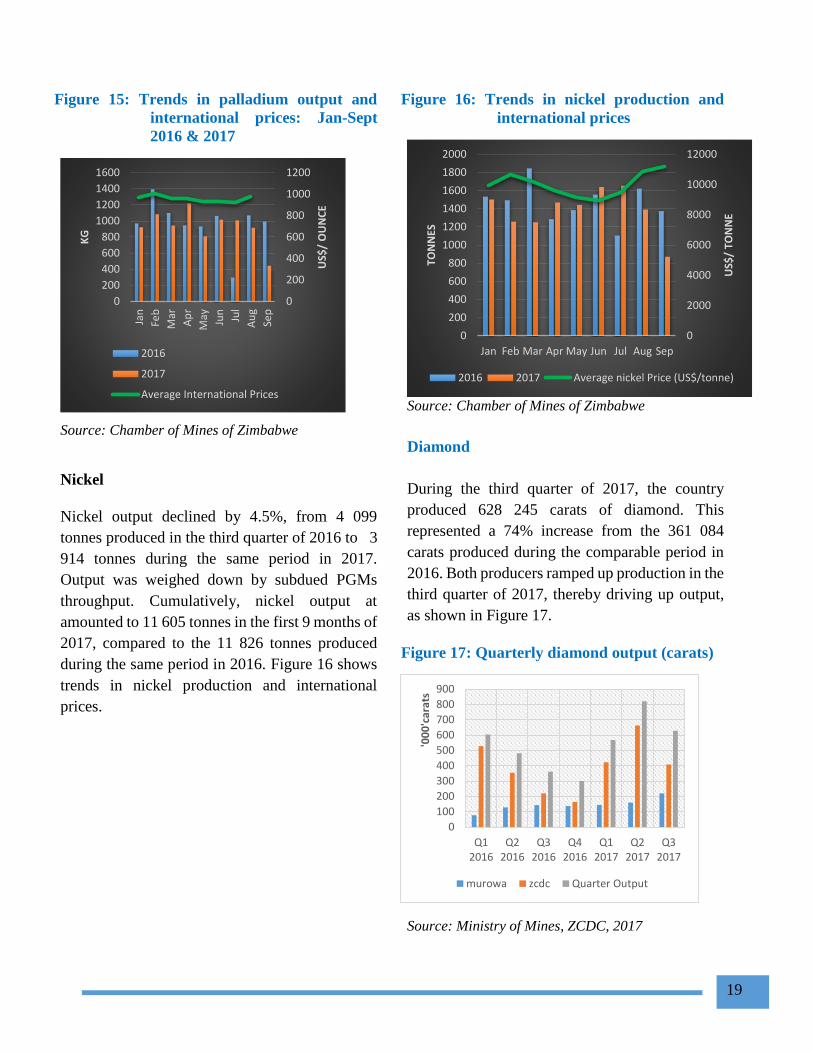
Platinum
A total of 2 881 kg of platinum was produced
during the third quarter of 2017, about 0.6% above
the 2 863 kg produced during the same period in
2016. Cumulative platinum output for the first
nine months of 2017 at 10 125 kg was, however,
6.5% lower than the 10 831 kg produced during
the same period in 2016. Production was largely
disrupted by ongoing mine development and
continuous redevelopment of shafts, as well as,
scheduled maintenance of both plant and
equipment at Zimplats. Trends in platinum output
and international prices of the mineral are shown
in Figure 14.
Figure 14: Trends in platinum output and
international prices: Jan-Sept
2016 & 2017
Source: Chamber of Mines of Zimbabwe
The recent firming up of prices that began end of
July 2017 is expected to boost revenue for the
producers. The performance of other key PGMs
was also in line with trends in platinum
production.
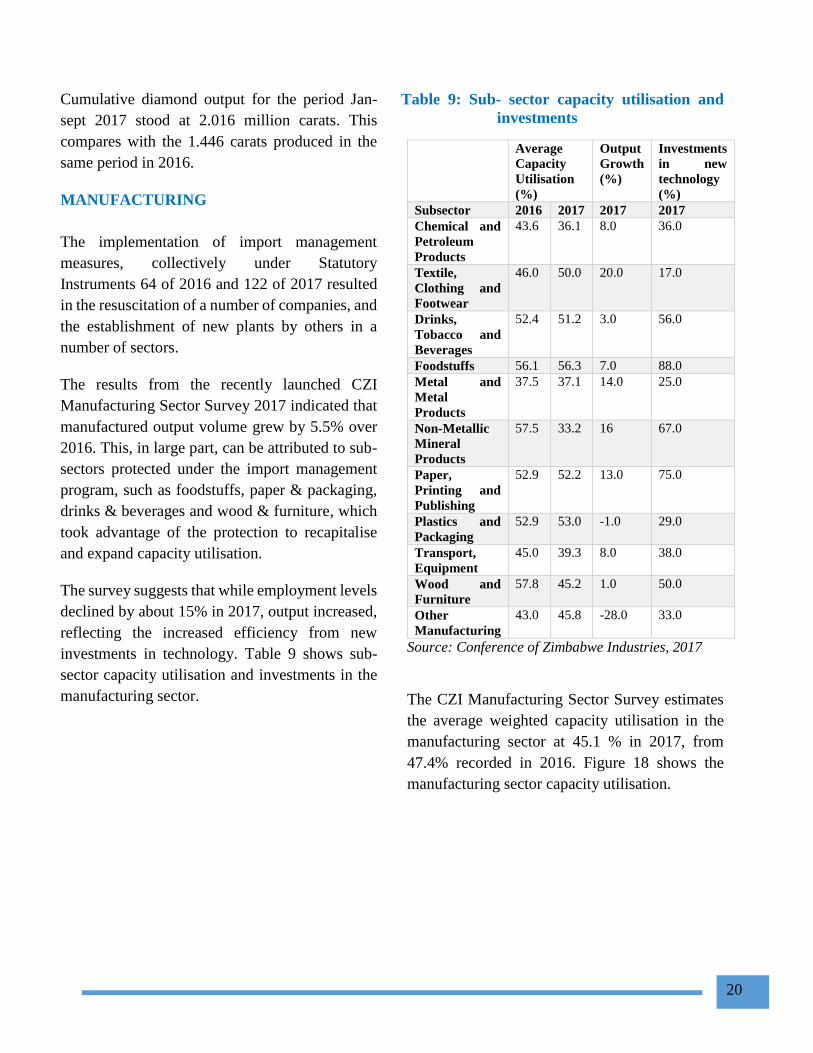
Palladium output at 2 367 kg in the third quarter
of 2017, was 0.4% more than the 2 358 kg
recorded in same period in 2016. Cumulatively,
palladium output amounted to 8 362 kg over the
period Jan-Sept 2017, which was 4.5% below the
8 760 kg produced in the comparable period in
2016. Figure 15 shows palladium production
trends and international prices.
Makomo43%
HCCL51%
Zambezi Gas6%
860
880
900
920
940
960
980
1000
1020
0
200
400
600
800
1000
1200
1400
1600
1800
2000
Jan
Feb
Mar
Ap
r
May Jun
Jul
Au
g
Sep
US
$/
ou
nce
Kg
2016 2017 Average price
19
Figure 15: Trends in palladium output and
international prices: Jan-Sept
2016 & 2017
Source: Chamber of Mines of Zimbabwe
Nickel
Nickel output declined by 4.5%, from 4 099
tonnes produced in the third quarter of 2016 to 3
914 tonnes during the same period in 2017.
Output was weighed down by subdued PGMs
throughput. Cumulatively, nickel output at
amounted to 11 605 tonnes in the first 9 months of
2017, compared to the 11 826 tonnes produced
during the same period in 2016. Figure 16 shows
trends in nickel production and international
prices.
Figure 16: Trends in nickel production and
international prices
Source: Chamber of Mines of Zimbabwe
Diamond
During the third quarter of 2017, the country
produced 628 245 carats of diamond. This
represented a 74% increase from the 361 084
carats produced during the comparable period in
2016. Both producers ramped up production in the
third quarter of 2017, thereby driving up output,
as shown in Figure 17.
Figure 17: Quarterly diamond output (carats)
Source: Ministry of Mines, ZCDC, 2017
0
200
400
600
800
1000
1200
0
200
400
600
800
1000
1200
1400
1600
Jan
Feb
Mar
Ap
r
May Jun
Jul
Au
g
Sep
US$
/ O
UN
CE
KG
2016
2017
Average International Prices
0
2000
4000
6000
8000
10000
12000
0
200
400
600
800
1000
1200
1400
1600
1800
2000
Jan Feb Mar Apr May Jun Jul Aug Sep
US$
/ TO
NN
E
TON
NES
2016 2017 Average nickel Price (US$/tonne)
0
100
200
300
400
500
600
700
800
900
Q12016
Q22016
Q32016
Q42016
Q12017
Q22017
Q32017
'00
0'c
arat
s
murowa zcdc Quarter Output
20
Cumulative diamond output for the period Jan-
sept 2017 stood at 2.016 million carats. This
compares with the 1.446 carats produced in the
same period in 2016.
MANUFACTURING
The implementation of import management
measures, collectively under Statutory
Instruments 64 of 2016 and 122 of 2017 resulted
in the resuscitation of a number of companies, and
the establishment of new plants by others in a
number of sectors.
The results from the recently launched CZI
Manufacturing Sector Survey 2017 indicated that
manufactured output volume grew by 5.5% over
2016. This, in large part, can be attributed to sub-
sectors protected under the import management
program, such as foodstuffs, paper & packaging,
drinks & beverages and wood & furniture, which
took advantage of the protection to recapitalise
and expand capacity utilisation.
The survey suggests that while employment levels
declined by about 15% in 2017, output increased,
reflecting the increased efficiency from new
investments in technology. Table 9 shows sub-
sector capacity utilisation and investments in the
manufacturing sector.
Table 9: Sub- sector capacity utilisation and
investments
Average
Capacity
Utilisation
(%)
Output
Growth
(%)
Investments
in new
technology
(%)
Subsector 2016 2017 2017 2017
Chemical and
Petroleum
Products
43.6 36.1 8.0 36.0
Textile,
Clothing and
Footwear
46.0 50.0 20.0 17.0
Drinks,
Tobacco and
Beverages
52.4 51.2 3.0 56.0
Foodstuffs 56.1 56.3 7.0 88.0
Metal and
Metal
Products
37.5 37.1 14.0 25.0
Non-Metallic
Mineral
Products
57.5 33.2 16 67.0
Paper,
Printing and
Publishing
52.9 52.2 13.0 75.0
Plastics and
Packaging
52.9 53.0 -1.0 29.0
Transport,
Equipment
45.0 39.3 8.0 38.0
Wood and
Furniture
57.8 45.2 1.0 50.0
Other
Manufacturing
43.0 45.8 -28.0 33.0
Source: Conference of Zimbabwe Industries, 2017
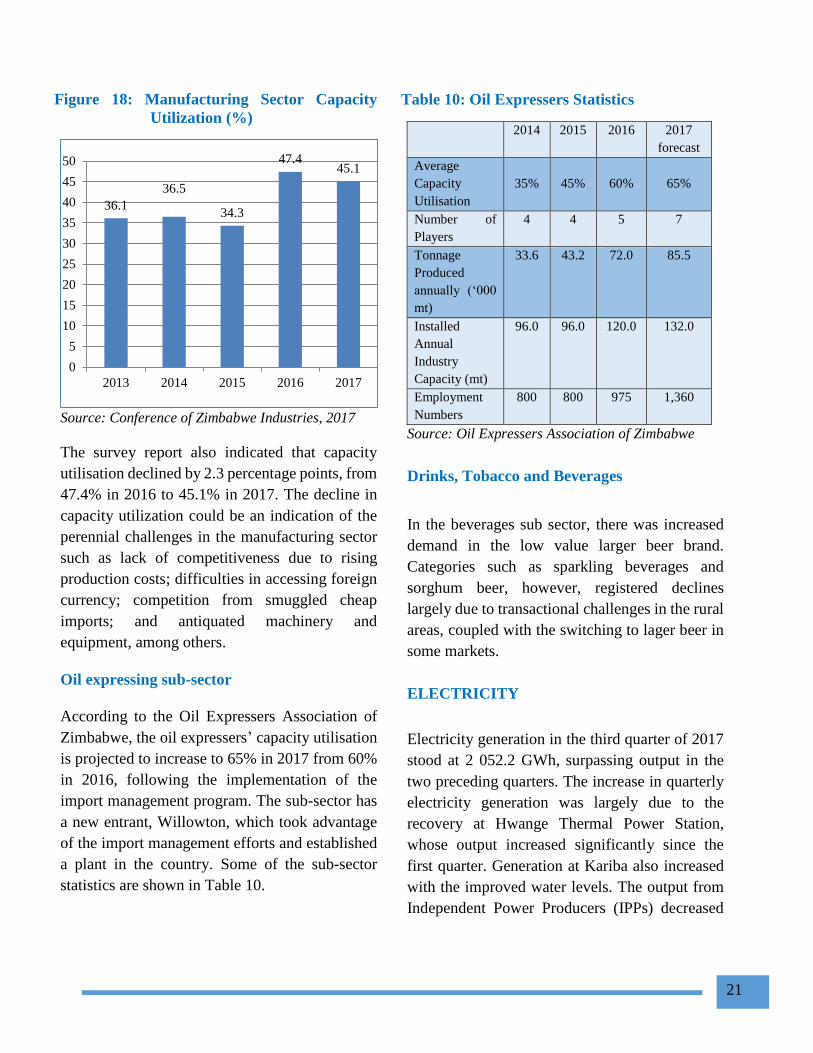
The CZI Manufacturing Sector Survey estimates
the average weighted capacity utilisation in the
manufacturing sector at 45.1 % in 2017, from
47.4% recorded in 2016. Figure 18 shows the
manufacturing sector capacity utilisation.
21
Figure 18: Manufacturing Sector Capacity
Utilization (%)
Source: Conference of Zimbabwe Industries, 2017
The survey report also indicated that capacity
utilisation declined by 2.3 percentage points, from
47.4% in 2016 to 45.1% in 2017. The decline in
capacity utilization could be an indication of the
perennial challenges in the manufacturing sector
such as lack of competitiveness due to rising
production costs; difficulties in accessing foreign
currency; competition from smuggled cheap
imports; and antiquated machinery and
equipment, among others.
Oil expressing sub-sector
According to the Oil Expressers Association of
Zimbabwe, the oil expressers’ capacity utilisation
is projected to increase to 65% in 2017 from 60%
in 2016, following the implementation of the
import management program. The sub-sector has
a new entrant, Willowton, which took advantage
of the import management efforts and established
a plant in the country. Some of the sub-sector
statistics are shown in Table 10.
Table 10: Oil Expressers Statistics
2014 2015 2016 2017
forecast
Average
Capacity
Utilisation
35%
45%
60%
65%
Number of
Players
4 4 5 7
Tonnage
Produced
annually (‘000
mt)
33.6 43.2 72.0 85.5
Installed
Annual
Industry
Capacity (mt)
96.0 96.0 120.0 132.0
Employment
Numbers
800 800 975 1,360
Source: Oil Expressers Association of Zimbabwe
Drinks, Tobacco and Beverages
In the beverages sub sector, there was increased
demand in the low value larger beer brand.
Categories such as sparkling beverages and
sorghum beer, however, registered declines
largely due to transactional challenges in the rural
areas, coupled with the switching to lager beer in
some markets.
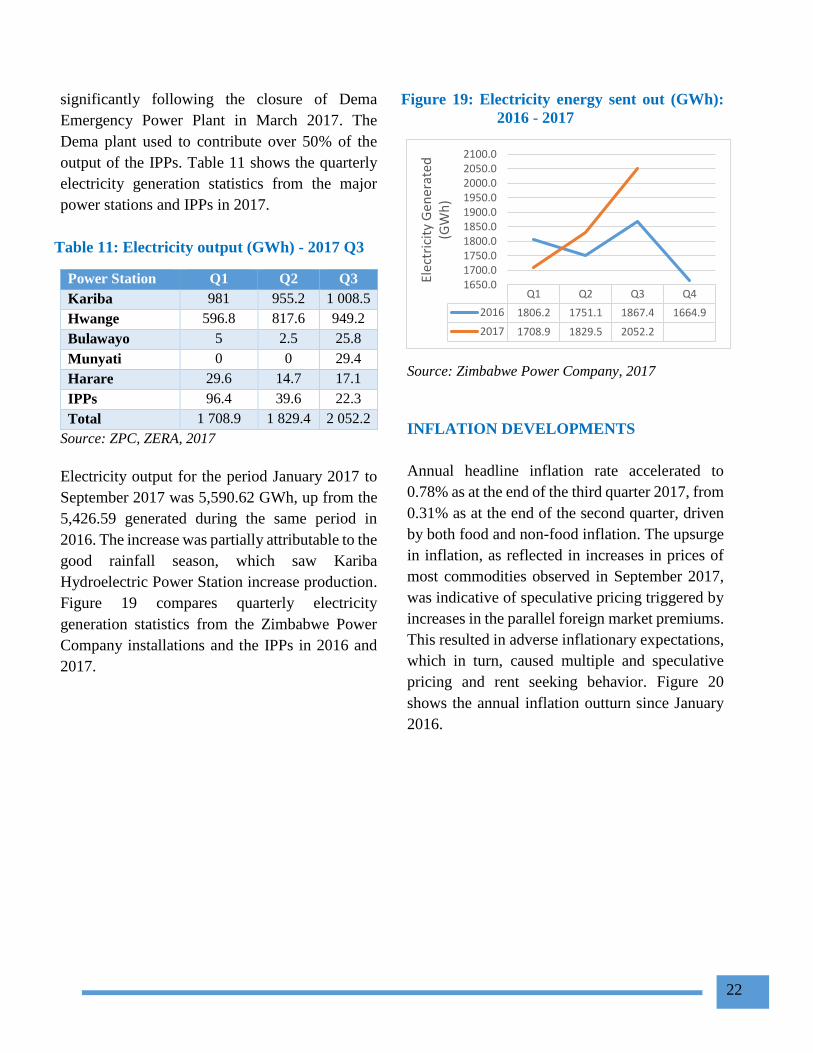
ELECTRICITY
Electricity generation in the third quarter of 2017
stood at 2 052.2 GWh, surpassing output in the
two preceding quarters. The increase in quarterly
electricity generation was largely due to the
recovery at Hwange Thermal Power Station,
whose output increased significantly since the
first quarter. Generation at Kariba also increased
with the improved water levels. The output from
Independent Power Producers (IPPs) decreased
36.1
36.5
34.3
47.445.1
0
5
10
15
20
25
30
35
40
45
50
2013 2014 2015 2016 2017
22
significantly following the closure of Dema
Emergency Power Plant in March 2017. The
Dema plant used to contribute over 50% of the
output of the IPPs. Table 11 shows the quarterly
electricity generation statistics from the major
power stations and IPPs in 2017.
Table 11: Electricity output (GWh) - 2017 Q3
Power Station Q1 Q2 Q3
Kariba 981 955.2 1 008.5
Hwange 596.8 817.6 949.2
Bulawayo 5 2.5 25.8
Munyati 0 0 29.4
Harare 29.6 14.7 17.1
IPPs 96.4 39.6 22.3
Total 1 708.9 1 829.4 2 052.2
Source: ZPC, ZERA, 2017
Electricity output for the period January 2017 to
September 2017 was 5,590.62 GWh, up from the
5,426.59 generated during the same period in
2016. The increase was partially attributable to the
good rainfall season, which saw Kariba
Hydroelectric Power Station increase production.
Figure 19 compares quarterly electricity
generation statistics from the Zimbabwe Power
Company installations and the IPPs in 2016 and
2017.
Figure 19: Electricity energy sent out (GWh):
2016 - 2017
Source: Zimbabwe Power Company, 2017
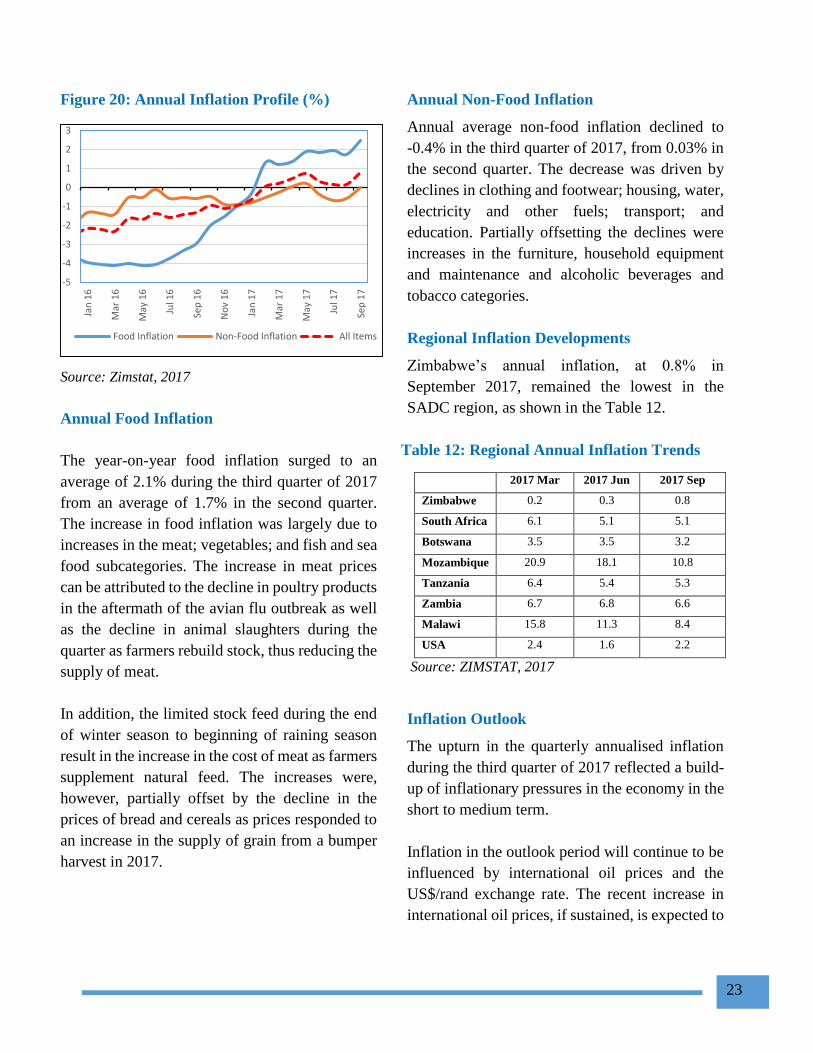
INFLATION DEVELOPMENTS
Annual headline inflation rate accelerated to
0.78% as at the end of the third quarter 2017, from
0.31% as at the end of the second quarter, driven
by both food and non-food inflation. The upsurge
in inflation, as reflected in increases in prices of
most commodities observed in September 2017,
was indicative of speculative pricing triggered by
increases in the parallel foreign market premiums.
This resulted in adverse inflationary expectations,
which in turn, caused multiple and speculative
pricing and rent seeking behavior. Figure 20
shows the annual inflation outturn since January
2016.
Q1 Q2 Q3 Q4
2016 1806.2 1751.1 1867.4 1664.9
2017 1708.9 1829.5 2052.2
1650.01700.01750.01800.01850.01900.01950.02000.02050.02100.0
Elec
tric
ity
Gen
erat
ed
(GW
h)
23
Figure 20: Annual Inflation Profile (%)
Source: Zimstat, 2017
Annual Food Inflation
The year-on-year food inflation surged to an
average of 2.1% during the third quarter of 2017
from an average of 1.7% in the second quarter.
The increase in food inflation was largely due to
increases in the meat; vegetables; and fish and sea
food subcategories. The increase in meat prices
can be attributed to the decline in poultry products
in the aftermath of the avian flu outbreak as well
as the decline in animal slaughters during the
quarter as farmers rebuild stock, thus reducing the
supply of meat.
In addition, the limited stock feed during the end
of winter season to beginning of raining season
result in the increase in the cost of meat as farmers
supplement natural feed. The increases were,
however, partially offset by the decline in the
prices of bread and cereals as prices responded to
an increase in the supply of grain from a bumper
harvest in 2017.
Annual Non-Food Inflation
Annual average non-food inflation declined to
-0.4% in the third quarter of 2017, from 0.03% in
the second quarter. The decrease was driven by
declines in clothing and footwear; housing, water,
electricity and other fuels; transport; and
education. Partially offsetting the declines were
increases in the furniture, household equipment
and maintenance and alcoholic beverages and
tobacco categories.
Regional Inflation Developments
Zimbabwe’s annual inflation, at 0.8% in
September 2017, remained the lowest in the
SADC region, as shown in the Table 12.
Table 12: Regional Annual Inflation Trends
2017 Mar 2017 Jun 2017 Sep
Zimbabwe 0.2 0.3 0.8
South Africa 6.1 5.1 5.1
Botswana 3.5 3.5 3.2
Mozambique 20.9 18.1 10.8
Tanzania 6.4 5.4 5.3
Zambia 6.7 6.8 6.6
Malawi 15.8 11.3 8.4
USA 2.4 1.6 2.2
Source: ZIMSTAT, 2017
Inflation Outlook
The upturn in the quarterly annualised inflation
during the third quarter of 2017 reflected a build-
up of inflationary pressures in the economy in the
short to medium term.
Inflation in the outlook period will continue to be
influenced by international oil prices and the
US$/rand exchange rate. The recent increase in
international oil prices, if sustained, is expected to
-5
-4
-3
-2
-1
0
1
2
3
Jan
16
Mar
16
May
16
Jul 1
6
Sep
16
No
v 1
6
Jan
17
Mar
17
May
17
Jul 1
7
Sep
17
Food Inflation Non-Food Inflation All Items
24
stoke inflationary pressures going forward. A
sustained weakening of the South African rand
could, however, dampen inflationary pressures in
Zimbabwe through trade and economic linkages
between the two countries.
The increase in foreign exchange rate premiums
on the parallel market, against the backdrop of
foreign currency shortages, may also spur
inflationary pressures.
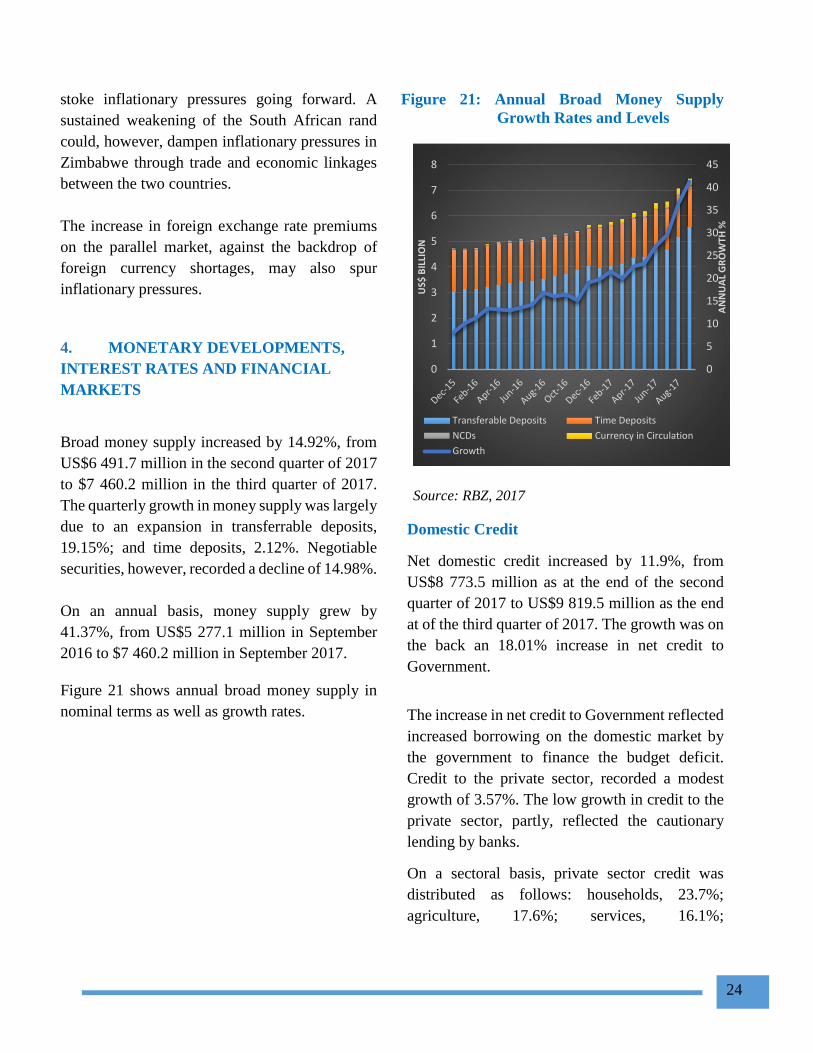
4. MONETARY DEVELOPMENTS,
INTEREST RATES AND FINANCIAL
MARKETS
Broad money supply increased by 14.92%, from
US$6 491.7 million in the second quarter of 2017
to $7 460.2 million in the third quarter of 2017.
The quarterly growth in money supply was largely
due to an expansion in transferrable deposits,
19.15%; and time deposits, 2.12%. Negotiable
securities, however, recorded a decline of 14.98%.
On an annual basis, money supply grew by
41.37%, from US$5 277.1 million in September
2016 to $7 460.2 million in September 2017.
Figure 21 shows annual broad money supply in
nominal terms as well as growth rates.
Figure 21: Annual Broad Money Supply
Growth Rates and Levels
Source: RBZ, 2017
Domestic Credit
Net domestic credit increased by 11.9%, from
US$8 773.5 million as at the end of the second
quarter of 2017 to US$9 819.5 million as the end
at of the third quarter of 2017. The growth was on
the back an 18.01% increase in net credit to
Government.
The increase in net credit to Government reflected
increased borrowing on the domestic market by
the government to finance the budget deficit.
Credit to the private sector, recorded a modest
growth of 3.57%. The low growth in credit to the
private sector, partly, reflected the cautionary
lending by banks.
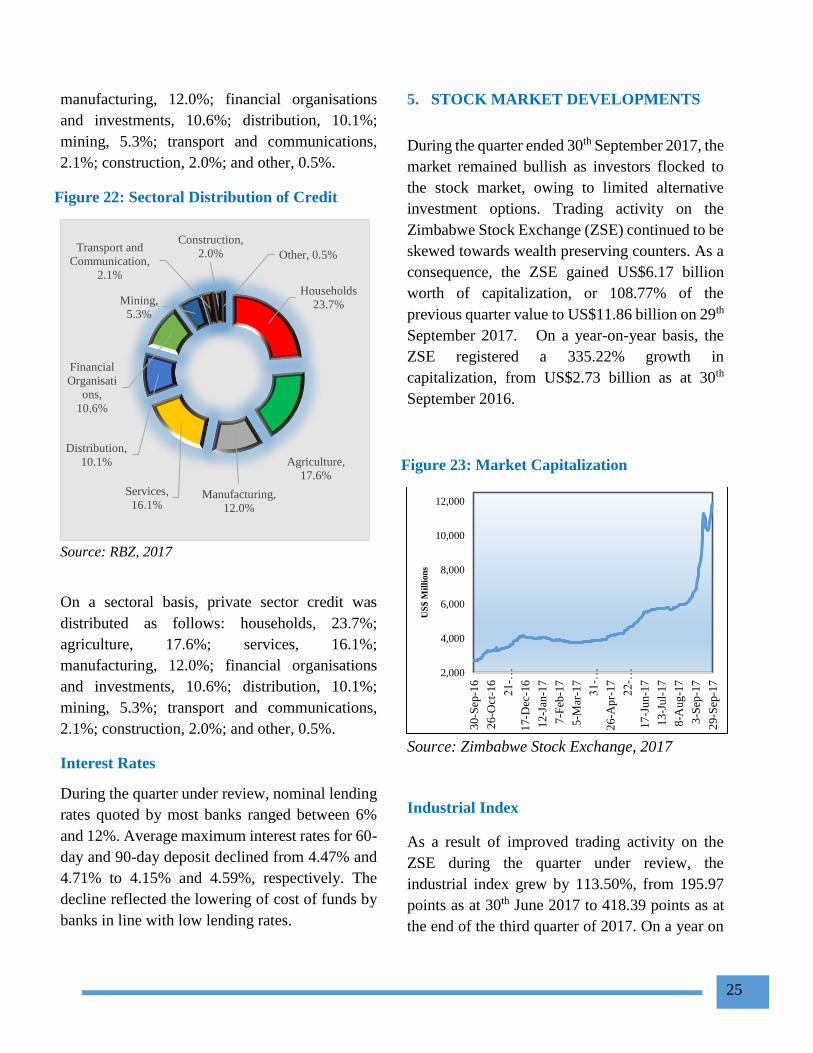
On a sectoral basis, private sector credit was
distributed as follows: households, 23.7%;
agriculture, 17.6%; services, 16.1%;
0
5
10
15
20
25
30
35
40
45
0
1
2
3
4
5
6
7
8
AN
NU
AL
GR
OW
TH %
US$
BIL
LIO
NTransferable Deposits Time Deposits
NCDs Currency in Circulation
Growth
25
manufacturing, 12.0%; financial organisations
and investments, 10.6%; distribution, 10.1%;
mining, 5.3%; transport and communications,
2.1%; construction, 2.0%; and other, 0.5%.
Figure 22: Sectoral Distribution of Credit
Source: RBZ, 2017
On a sectoral basis, private sector credit was
distributed as follows: households, 23.7%;
agriculture, 17.6%; services, 16.1%;
manufacturing, 12.0%; financial organisations
and investments, 10.6%; distribution, 10.1%;
mining, 5.3%; transport and communications,
2.1%; construction, 2.0%; and other, 0.5%.
Interest Rates
During the quarter under review, nominal lending
rates quoted by most banks ranged between 6%
and 12%. Average maximum interest rates for 60-
day and 90-day deposit declined from 4.47% and
4.71% to 4.15% and 4.59%, respectively. The
decline reflected the lowering of cost of funds by
banks in line with low lending rates.
5. STOCK MARKET DEVELOPMENTS
During the quarter ended 30th September 2017, the
market remained bullish as investors flocked to
the stock market, owing to limited alternative
investment options. Trading activity on the
Zimbabwe Stock Exchange (ZSE) continued to be
skewed towards wealth preserving counters. As a
consequence, the ZSE gained US$6.17 billion
worth of capitalization, or 108.77% of the
previous quarter value to US$11.86 billion on 29th
September 2017. On a year-on-year basis, the
ZSE registered a 335.22% growth in
capitalization, from US$2.73 billion as at 30th
September 2016.
Figure 23: Market Capitalization
Source: Zimbabwe Stock Exchange, 2017
Industrial Index
As a result of improved trading activity on the
ZSE during the quarter under review, the
industrial index grew by 113.50%, from 195.97
points as at 30th June 2017 to 418.39 points as at
the end of the third quarter of 2017. On a year on
Households
23.7%
Agriculture,
17.6%
Manufacturing,
12.0%
Services,
16.1%
Distribution,
10.1%
Financial
Organisati
ons,
10.6%
Mining,
5.3%
Transport and
Communication,
2.1%
Construction,
2.0% Other, 0.5%
2,000
4,000
6,000
8,000
10,000
12,000
30-S
ep-1
6
26-O
ct-1
6
21-…
17-D
ec-1
6
12-J
an-1
7
7-F
eb-1
7
5-M
ar-1
7
31-…
26-A
pr-
17
22-…
17-J
un-1
7
13-J
ul-
17
8-A
ug
-17
3-S
ep-1
7
29-S
ep-1
7
US
$ M
illi
on
s
26
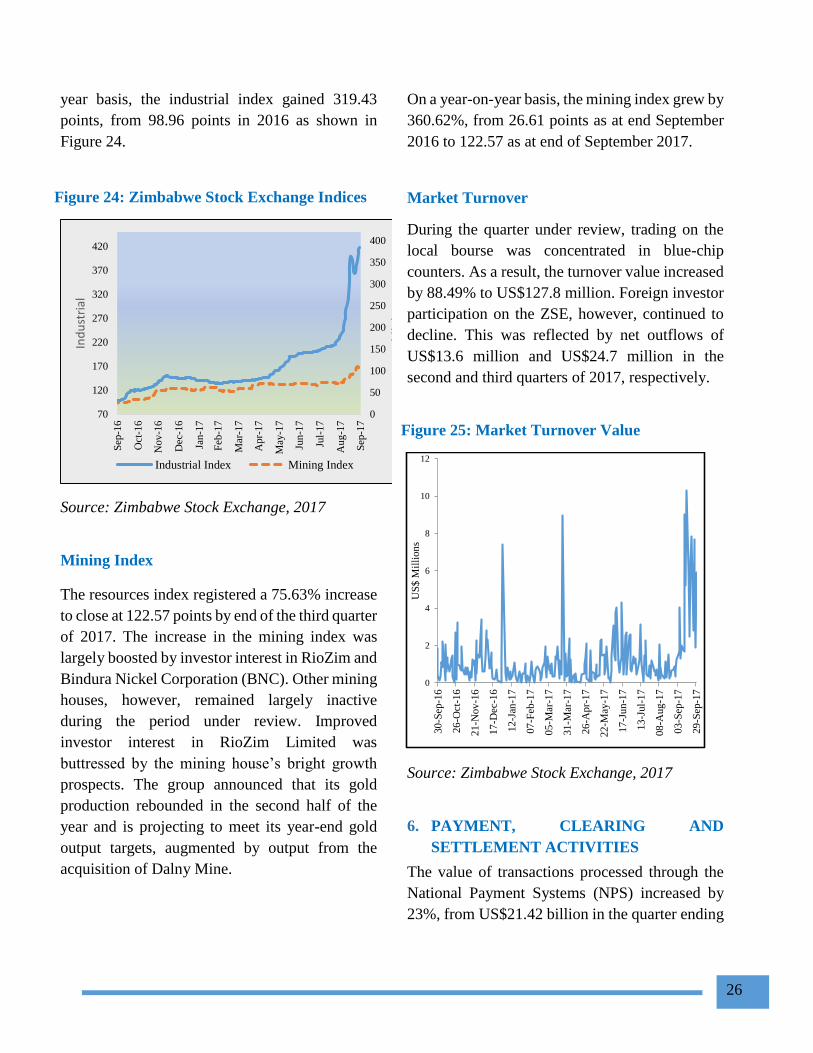
year basis, the industrial index gained 319.43
points, from 98.96 points in 2016 as shown in
Figure 24.
Figure 24: Zimbabwe Stock Exchange Indices
Source: Zimbabwe Stock Exchange, 2017
Mining Index
The resources index registered a 75.63% increase
to close at 122.57 points by end of the third quarter
of 2017. The increase in the mining index was
largely boosted by investor interest in RioZim and
Bindura Nickel Corporation (BNC). Other mining
houses, however, remained largely inactive
during the period under review. Improved
investor interest in RioZim Limited was
buttressed by the mining house’s bright growth
prospects. The group announced that its gold
production rebounded in the second half of the
year and is projecting to meet its year-end gold
output targets, augmented by output from the
acquisition of Dalny Mine.
On a year-on-year basis, the mining index grew by
360.62%, from 26.61 points as at end September
2016 to 122.57 as at end of September 2017.
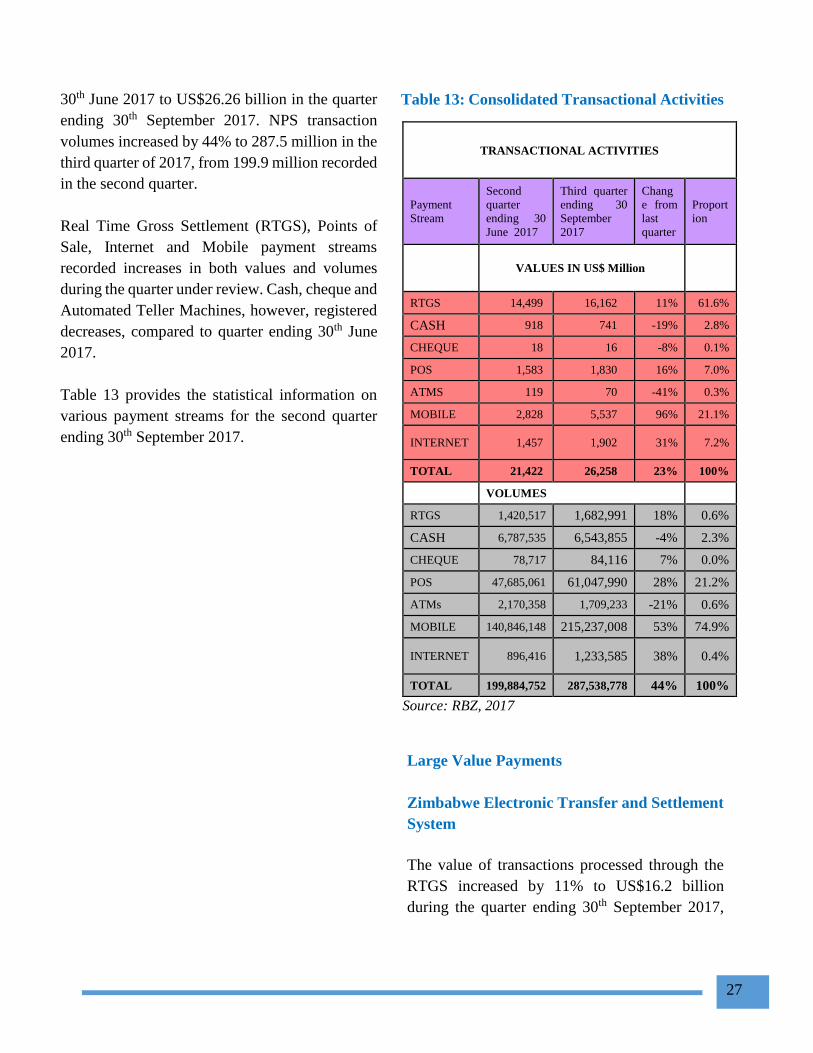
Market Turnover
During the quarter under review, trading on the
local bourse was concentrated in blue-chip
counters. As a result, the turnover value increased
by 88.49% to US$127.8 million. Foreign investor
participation on the ZSE, however, continued to
decline. This was reflected by net outflows of
US$13.6 million and US$24.7 million in the
second and third quarters of 2017, respectively.
Figure 25: Market Turnover Value
Source: Zimbabwe Stock Exchange, 2017
6. PAYMENT, CLEARING AND
SETTLEMENT ACTIVITIES
The value of transactions processed through the
National Payment Systems (NPS) increased by
23%, from US$21.42 billion in the quarter ending
0
50
100
150
200
250
300
350
400
70
120
170
220
270
320
370
420
Sep
-16
Oct
-16
Nov
-16
Dec
-16
Jan-1
7
Feb
-17
Mar
-17
Apr-
17
May
-17
Jun
-17
Jul-
17
Aug
-17
Sep
-17
Min
ing
Ind
ust
rial
Industrial Index Mining Index
0
2
4
6
8
10
12
30
-Sep
-16
26
-Oct
-16
21
-Nov
-16
17
-Dec
-16
12
-Jan
-17
07
-Feb
-17
05
-Mar
-17
31
-Mar
-17
26
-Apr-
17
22
-May
-17
17
-Jun
-17
13
-Jul-
17
08
-Aug
-17
03
-Sep
-17
29
-Sep
-17
US
$ M
illi
on
s
27
30th June 2017 to US$26.26 billion in the quarter
ending 30th September 2017. NPS transaction
volumes increased by 44% to 287.5 million in the
third quarter of 2017, from 199.9 million recorded
in the second quarter.
Real Time Gross Settlement (RTGS), Points of
Sale, Internet and Mobile payment streams
recorded increases in both values and volumes
during the quarter under review. Cash, cheque and
Automated Teller Machines, however, registered
decreases, compared to quarter ending 30th June
2017.
Table 13 provides the statistical information on
various payment streams for the second quarter
ending 30th September 2017.
Table 13: Consolidated Transactional Activities
TRANSACTIONAL ACTIVITIES
Payment
Stream
Second
quarter
ending 30
June 2017
Third quarter
ending 30
September
2017
Chang
e from
last
quarter
Proport
ion
VALUES IN US$ Million
RTGS 14,499 16,162 11% 61.6%
CASH 918 741 -19% 2.8%
CHEQUE 18 16 -8% 0.1%
POS 1,583 1,830 16% 7.0%
ATMS 119 70 -41% 0.3%
MOBILE 2,828 5,537 96% 21.1%
INTERNET 1,457 1,902 31% 7.2%
TOTAL 21,422 26,258 23% 100%
VOLUMES
RTGS 1,420,517 1,682,991 18% 0.6%
CASH 6,787,535 6,543,855 -4% 2.3%
CHEQUE 78,717 84,116 7% 0.0%
POS 47,685,061 61,047,990 28% 21.2%
ATMs 2,170,358 1,709,233 -21% 0.6%
MOBILE 140,846,148 215,237,008 53% 74.9%
INTERNET 896,416 1,233,585 38% 0.4%
TOTAL 199,884,752 287,538,778 44% 100%
Source: RBZ, 2017
Large Value Payments
Zimbabwe Electronic Transfer and Settlement
System
The value of transactions processed through the
RTGS increased by 11% to US$16.2 billion
during the quarter ending 30th September 2017,
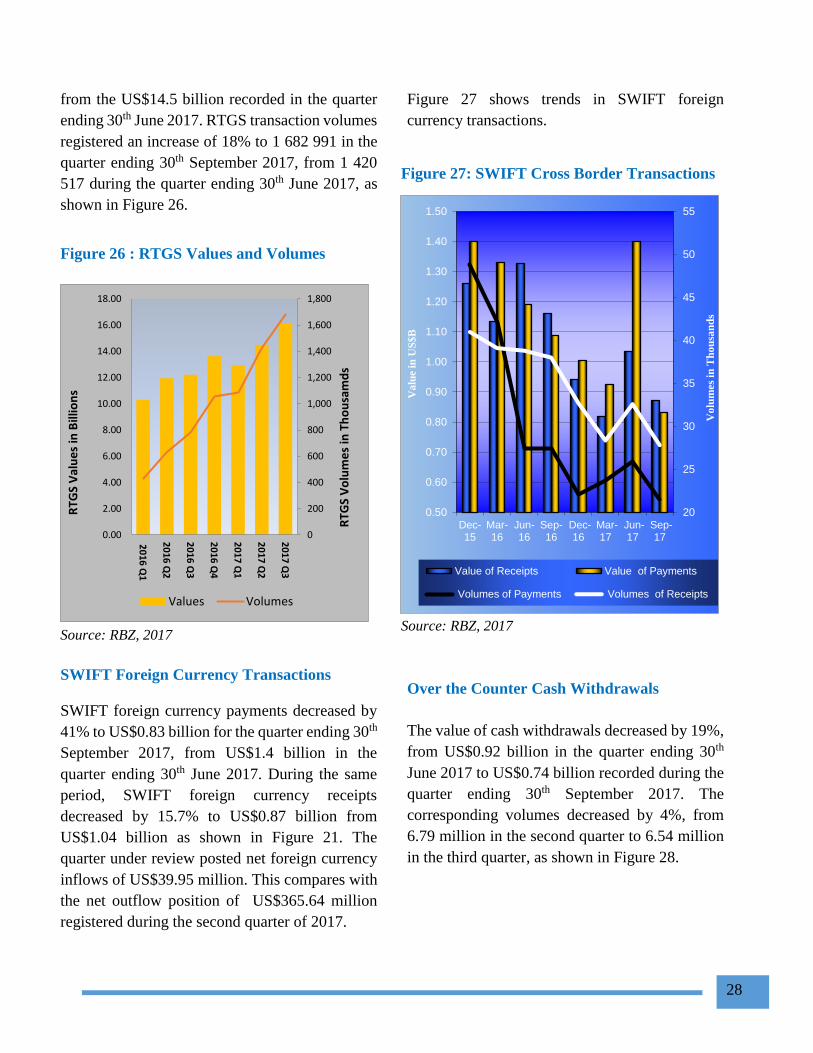
28
from the US$14.5 billion recorded in the quarter
ending 30th June 2017. RTGS transaction volumes
registered an increase of 18% to 1 682 991 in the
quarter ending 30th September 2017, from 1 420
517 during the quarter ending 30th June 2017, as
shown in Figure 26.
Figure 26 : RTGS Values and Volumes
Source: RBZ, 2017
SWIFT Foreign Currency Transactions
SWIFT foreign currency payments decreased by
41% to US$0.83 billion for the quarter ending 30th
September 2017, from US$1.4 billion in the
quarter ending 30th June 2017. During the same
period, SWIFT foreign currency receipts
decreased by 15.7% to US$0.87 billion from
US$1.04 billion as shown in Figure 21. The
quarter under review posted net foreign currency
inflows of US$39.95 million. This compares with
the net outflow position of US$365.64 million
registered during the second quarter of 2017.
Figure 27 shows trends in SWIFT foreign
currency transactions.
Figure 27: SWIFT Cross Border Transactions
Source: RBZ, 2017
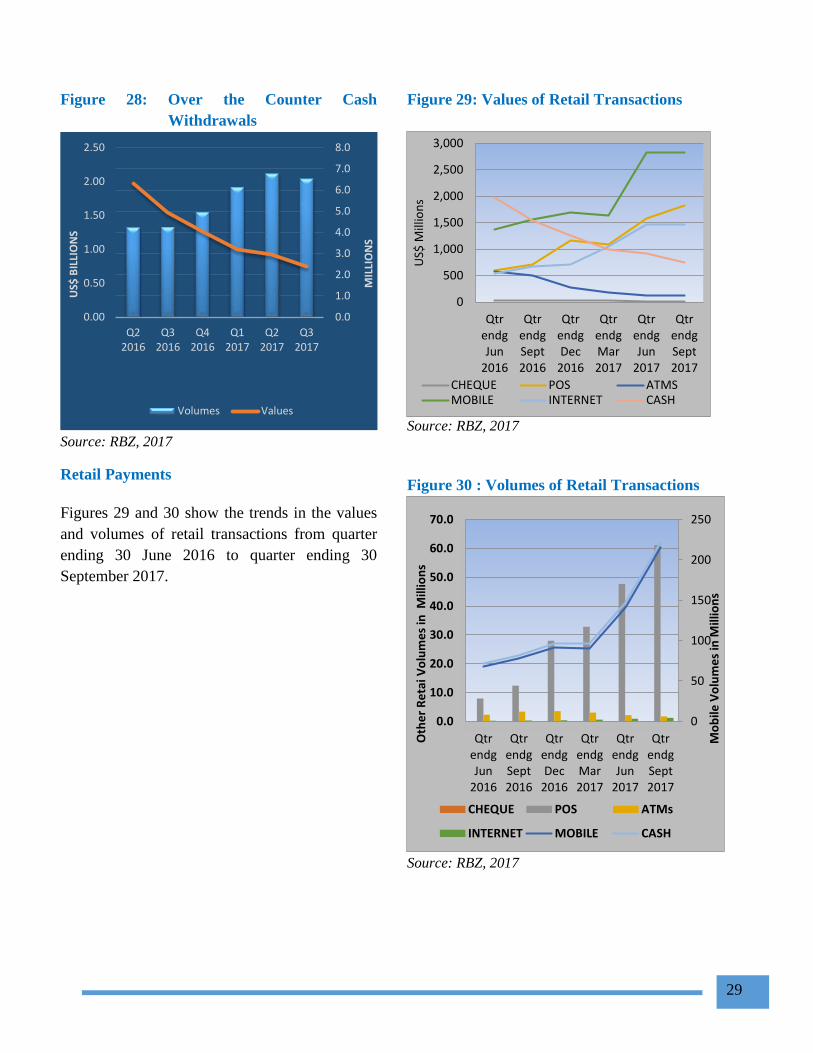
Over the Counter Cash Withdrawals
The value of cash withdrawals decreased by 19%,
from US$0.92 billion in the quarter ending 30th
June 2017 to US$0.74 billion recorded during the
quarter ending 30th September 2017. The
corresponding volumes decreased by 4%, from
6.79 million in the second quarter to 6.54 million
in the third quarter, as shown in Figure 28.
0
200
400
600
800
1,000
1,200
1,400
1,600
1,800
0.00
2.00
4.00
6.00
8.00
10.00
12.00
14.00
16.00
18.00
20
16 Q
1
20
16 Q
2
20
16 Q
3
20
16 Q
4
20
17 Q
1
20
17 Q
2
20
17 Q
3
RTG
S V
alu
es
in B
illio
ns
RTG
S V
olu
me
s in
Th
ou
sam
ds
Values Volumes
20
25
30
35
40
45
50
55
0.50
0.60
0.70
0.80
0.90
1.00
1.10
1.20
1.30
1.40
1.50
Dec-15
Mar-16
Jun-16
Sep-16
Dec-16
Mar-17
Jun-17
Sep-17
Vo
lum
es
in T
ho
usa
nd
s
Va
lue i
n U
S$
B
Value of Receipts Value of Payments
Volumes of Payments Volumes of Receipts
29
Figure 28: Over the Counter Cash
Withdrawals
Source: RBZ, 2017
Retail Payments
Figures 29 and 30 show the trends in the values
and volumes of retail transactions from quarter
ending 30 June 2016 to quarter ending 30
September 2017.
Figure 29: Values of Retail Transactions
Source: RBZ, 2017
Figure 30 : Volumes of Retail Transactions
Source: RBZ, 2017
0.00
0.50
1.00
1.50
2.00
2.50
Q22016
Q32016
Q42016
Q12017
Q22017
Q32017
0.0
1.0
2.0
3.0
4.0
5.0
6.0
7.0
8.0
US$
BIL
LIO
NS
MIL
LIO
NS
Volumes Values
0
500
1,000
1,500
2,000
2,500
3,000
QtrendgJun
2016
QtrendgSept2016
QtrendgDec
2016
QtrendgMar2017
QtrendgJun
2017
QtrendgSept2017
US$
Mill
ion
s
CHEQUE POS ATMSMOBILE INTERNET CASH
0
50
100
150
200
250
0.0
10.0
20.0
30.0
40.0
50.0
60.0
70.0
QtrendgJun
2016
QtrendgSept2016
QtrendgDec
2016
QtrendgMar2017
QtrendgJun
2017
QtrendgSept2017
Mo
bile
Vo
lum
es
in M
illio
ns
Oth
er
Re
tai V
olu
me
s in
Mill
ion
s
CHEQUE POS ATMs
INTERNET MOBILE CASH
30
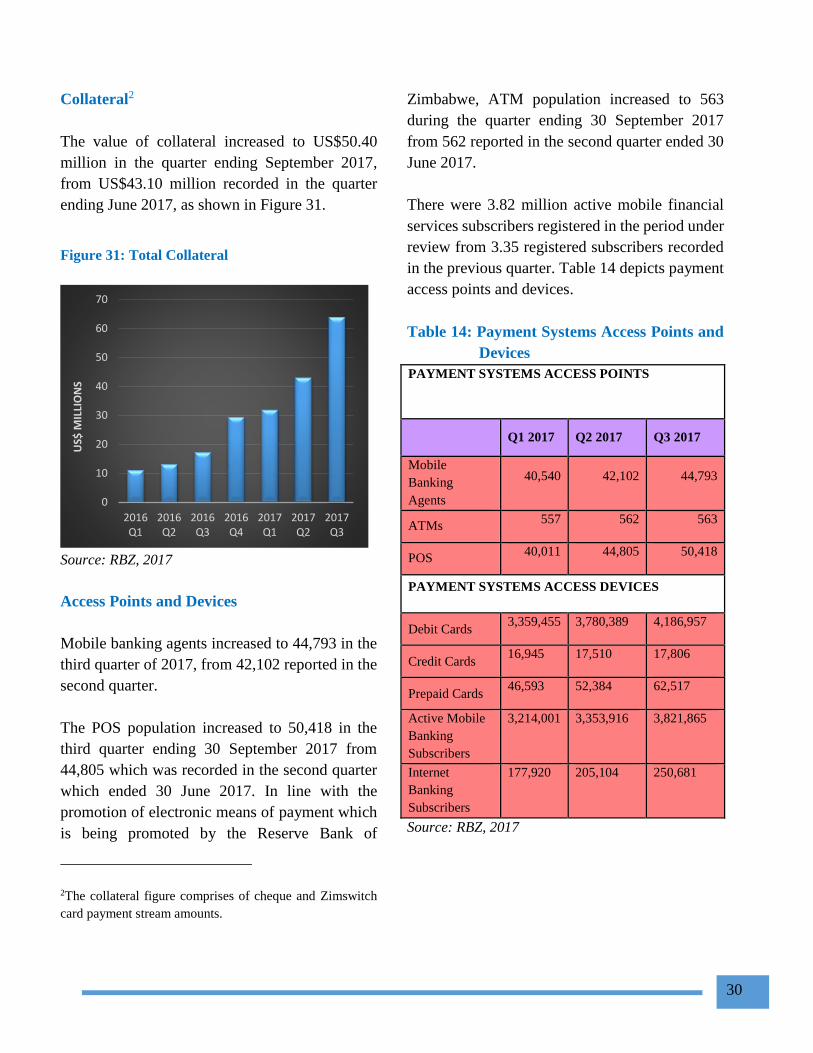
Collateral2
The value of collateral increased to US$50.40
million in the quarter ending September 2017,
from US$43.10 million recorded in the quarter
ending June 2017, as shown in Figure 31.
Figure 31: Total Collateral
Source: RBZ, 2017
Access Points and Devices
Mobile banking agents increased to 44,793 in the
third quarter of 2017, from 42,102 reported in the
second quarter.
The POS population increased to 50,418 in the
third quarter ending 30 September 2017 from
44,805 which was recorded in the second quarter
which ended 30 June 2017. In line with the
promotion of electronic means of payment which
is being promoted by the Reserve Bank of
2The collateral figure comprises of cheque and Zimswitch
card payment stream amounts.
Zimbabwe, ATM population increased to 563
during the quarter ending 30 September 2017
from 562 reported in the second quarter ended 30
June 2017.
There were 3.82 million active mobile financial
services subscribers registered in the period under
review from 3.35 registered subscribers recorded
in the previous quarter. Table 14 depicts payment
access points and devices.
Table 14: Payment Systems Access Points and
Devices
PAYMENT SYSTEMS ACCESS POINTS
Q1 2017 Q2 2017 Q3 2017
Mobile
Banking
Agents
40,540 42,102 44,793
ATMs 557 562 563
POS 40,011 44,805 50,418
PAYMENT SYSTEMS ACCESS DEVICES
Debit Cards 3,359,455 3,780,389 4,186,957
Credit Cards 16,945 17,510 17,806
Prepaid Cards 46,593 52,384 62,517
Active Mobile
Banking
Subscribers
3,214,001 3,353,916 3,821,865
Internet
Banking
Subscribers
177,920 205,104 250,681
Source: RBZ, 2017
0
10
20
30
40
50
60
70
2016Q1
2016Q2
2016Q3
2016Q4
2017Q1
2017Q2
2017Q3
US$
MIL
LIO
NS
31
FISCAL DEVELOPMENTS
Government revenue
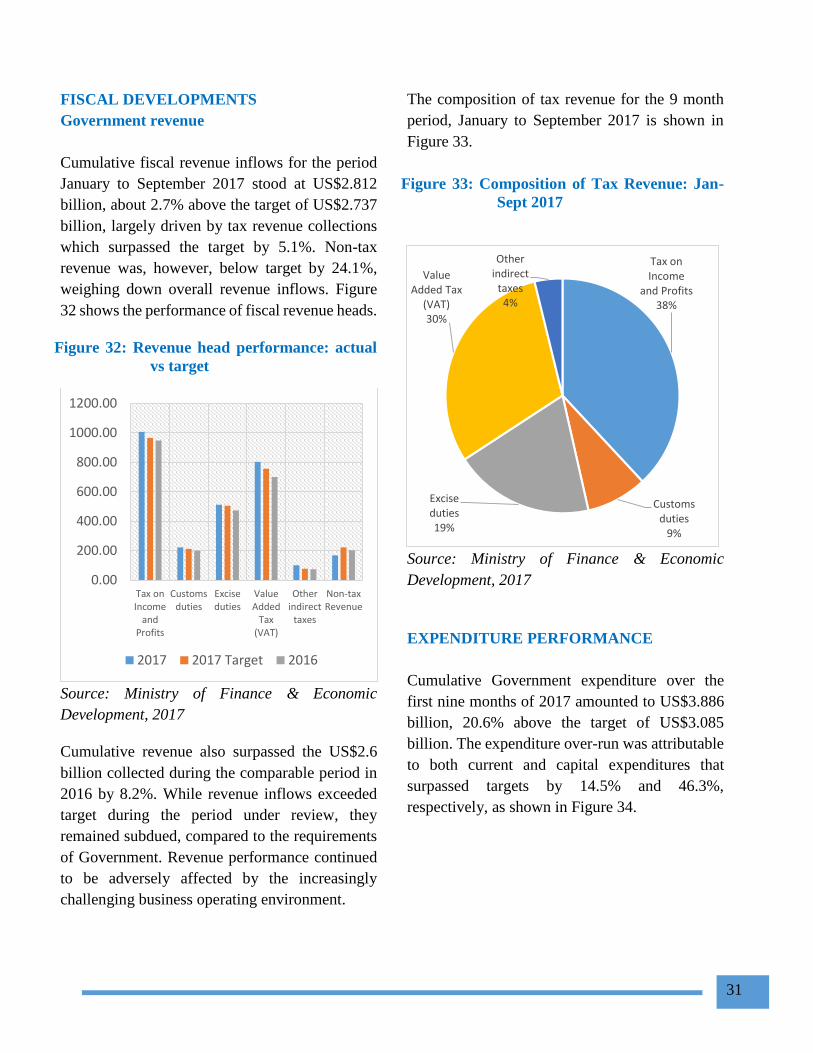
Cumulative fiscal revenue inflows for the period
January to September 2017 stood at US$2.812
billion, about 2.7% above the target of US$2.737
billion, largely driven by tax revenue collections
which surpassed the target by 5.1%. Non-tax
revenue was, however, below target by 24.1%,
weighing down overall revenue inflows. Figure
32 shows the performance of fiscal revenue heads.
Figure 32: Revenue head performance: actual
vs target
Source: Ministry of Finance & Economic
Development, 2017
Cumulative revenue also surpassed the US$2.6
billion collected during the comparable period in
2016 by 8.2%. While revenue inflows exceeded
target during the period under review, they
remained subdued, compared to the requirements
of Government. Revenue performance continued
to be adversely affected by the increasingly
challenging business operating environment.
The composition of tax revenue for the 9 month
period, January to September 2017 is shown in
Figure 33.
Figure 33: Composition of Tax Revenue: Jan-
Sept 2017
Source: Ministry of Finance & Economic
Development, 2017
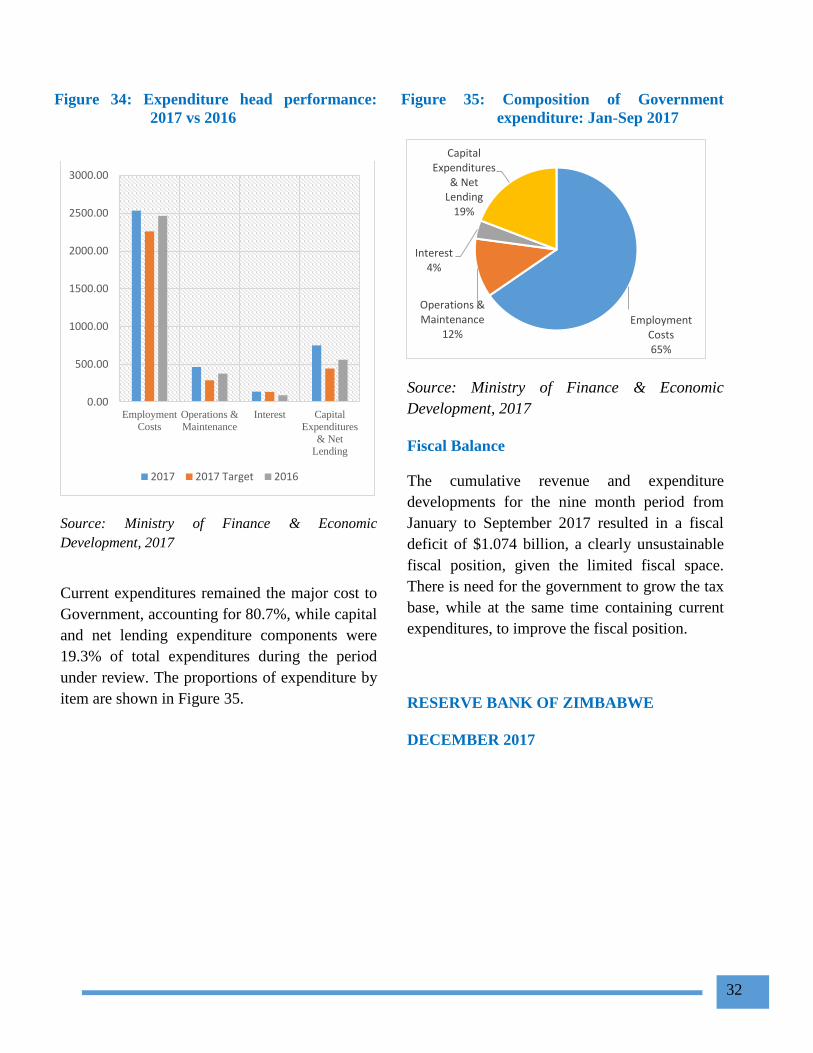
EXPENDITURE PERFORMANCE
Cumulative Government expenditure over the
first nine months of 2017 amounted to US$3.886
billion, 20.6% above the target of US$3.085
billion. The expenditure over-run was attributable
to both current and capital expenditures that
surpassed targets by 14.5% and 46.3%,
respectively, as shown in Figure 34.
0.00
200.00
400.00
600.00
800.00
1000.00
1200.00
Tax onIncome
andProfits
Customsduties
Exciseduties
ValueAdded
Tax(VAT)
Otherindirect
taxes
Non-taxRevenue
2017 2017 Target 2016
Tax on Income
and Profits38%
Customs duties
9%
Excise duties19%
Value Added Tax
(VAT)30%
Other indirect
taxes4%
32
Figure 34: Expenditure head performance:
2017 vs 2016
Source: Ministry of Finance & Economic
Development, 2017
Current expenditures remained the major cost to
Government, accounting for 80.7%, while capital
and net lending expenditure components were
19.3% of total expenditures during the period
under review. The proportions of expenditure by
item are shown in Figure 35.
Figure 35: Composition of Government
expenditure: Jan-Sep 2017
Source: Ministry of Finance & Economic
Development, 2017
Fiscal Balance
The cumulative revenue and expenditure
developments for the nine month period from
January to September 2017 resulted in a fiscal
deficit of $1.074 billion, a clearly unsustainable
fiscal position, given the limited fiscal space.
There is need for the government to grow the tax
base, while at the same time containing current
expenditures, to improve the fiscal position.
RESERVE BANK OF ZIMBABWE
DECEMBER 2017
0.00
500.00
1000.00
1500.00
2000.00
2500.00
3000.00
Employment
Costs
Operations &
Maintenance
Interest Capital
Expenditures
& Net
Lending
2017 2017 Target 2016
Employment Costs65%
Operations & Maintenance
12%
Interest4%
Capital Expenditures
& Net Lending
19%
STATISTICAL TABLES
1. Depository Corporation Survey S1
2. Central Bank Survey S2
3. Other Depository Corporation Survey S3
4. Liabilities and Assets of the Central Bank
4.1.Reserve Bank: Assets S4
4.2.Reserve Bank: liabilities S5
5. Other Depository Corporation
5.1.Other Depository Asset S6
5.2.Other Depository Liabilities S7
6. Commercial Banks
6.1.Commercial Banks: Assets S8
6.2.Commercial Banks: Liabilities S9
7. Building Societies
7.1.Building Societies: Assets S10
7.2.Building Societies: Liabilities S11
8. Sectoral Analysis of Commercial Banks
8.1.Sectoral Analysis of Commercial Banks’ Loans and Advances S12
8.2.Sectoral Analysis of Commercial Bank’s Deposits S13
9. National Payment Systems
9.1.Values of Transactions S14
9.2.Volumes of Transactions S14
10. Interest Rates, Security Yields and Prices
10.1. Lending Rates S15
10.2. Deposit Rates S15
11. Stock Exchange Indices S16
12. Inflation
12.1. Monthly Inflation S17
12.2. Quarterly Inflation S18
12.3. Annual Inflation S19
34
13. Balance of Payments
13.1. Cross Border Payments S20
13.2. Cross Border Receipts S21
14. External Sector
14.1. External Debt Outstanding By Debtor S22
14.2. External Debt Outstanding by Source S23
15. National Accounts
15.1. Real Gross Domestic and National Product per Capita at Market Prices S24
15.2. Gross Domestic Product at Factor Cost by Industry S25
15.3. Expenditure on Gross Domestic Product S26
15.4. Mineral Production S27
15.5. Electricity Produced and Distributed S28
15.6. Volume of Manufacturing Index S29
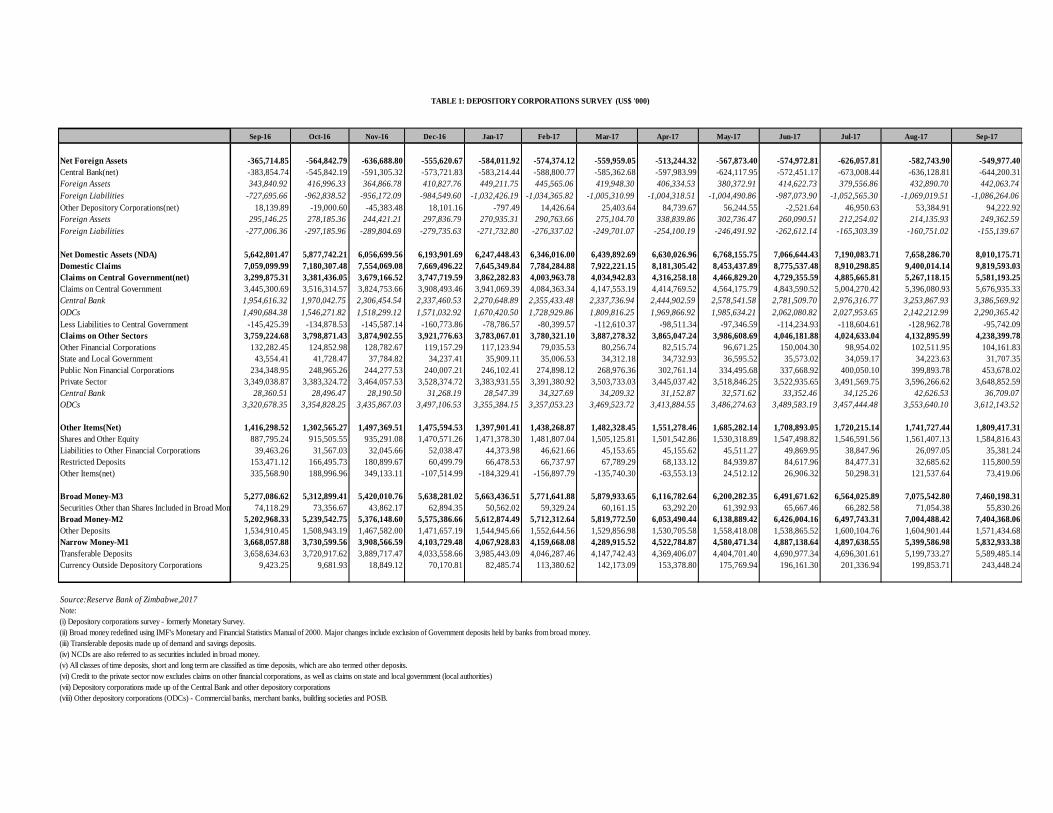
Sep-16 Oct-16 Nov-16 Dec-16 Jan-17 Feb-17 Mar-17 Apr-17 May-17 Jun-17 Jul-17 Aug-17 Sep-17
Net Foreign Assets -365,714.85 -564,842.79 -636,688.80 -555,620.67 -584,011.92 -574,374.12 -559,959.05 -513,244.32 -567,873.40 -574,972.81 -626,057.81 -582,743.90 -549,977.40
Central Bank(net) -383,854.74 -545,842.19 -591,305.32 -573,721.83 -583,214.44 -588,800.77 -585,362.68 -597,983.99 -624,117.95 -572,451.17 -673,008.44 -636,128.81 -644,200.31
Foreign Assets 343,840.92 416,996.33 364,866.78 410,827.76 449,211.75 445,565.06 419,948.30 406,334.53 380,372.91 414,622.73 379,556.86 432,890.70 442,063.74
Foreign Liabilities -727,695.66 -962,838.52 -956,172.09 -984,549.60 -1,032,426.19 -1,034,365.82 -1,005,310.99 -1,004,318.51 -1,004,490.86 -987,073.90 -1,052,565.30 -1,069,019.51 -1,086,264.06
Other Depository Corporations(net) 18,139.89 -19,000.60 -45,383.48 18,101.16 -797.49 14,426.64 25,403.64 84,739.67 56,244.55 -2,521.64 46,950.63 53,384.91 94,222.92
Foreign Assets 295,146.25 278,185.36 244,421.21 297,836.79 270,935.31 290,763.66 275,104.70 338,839.86 302,736.47 260,090.51 212,254.02 214,135.93 249,362.59
Foreign Liabilities -277,006.36 -297,185.96 -289,804.69 -279,735.63 -271,732.80 -276,337.02 -249,701.07 -254,100.19 -246,491.92 -262,612.14 -165,303.39 -160,751.02 -155,139.67
Net Domestic Assets (NDA) 5,642,801.47 5,877,742.21 6,056,699.56 6,193,901.69 6,247,448.43 6,346,016.00 6,439,892.69 6,630,026.96 6,768,155.75 7,066,644.43 7,190,083.71 7,658,286.70 8,010,175.71
Domestic Claims 7,059,099.99 7,180,307.48 7,554,069.08 7,669,496.22 7,645,349.84 7,784,284.88 7,922,221.15 8,181,305.42 8,453,437.89 8,775,537.48 8,910,298.85 9,400,014.14 9,819,593.03
Claims on Central Government(net) 3,299,875.31 3,381,436.05 3,679,166.52 3,747,719.59 3,862,282.83 4,003,963.78 4,034,942.83 4,316,258.18 4,466,829.20 4,729,355.59 4,885,665.81 5,267,118.15 5,581,193.25
Claims on Central Government 3,445,300.69 3,516,314.57 3,824,753.66 3,908,493.46 3,941,069.39 4,084,363.34 4,147,553.19 4,414,769.52 4,564,175.79 4,843,590.52 5,004,270.42 5,396,080.93 5,676,935.33
Central Bank 1,954,616.32 1,970,042.75 2,306,454.54 2,337,460.53 2,270,648.89 2,355,433.48 2,337,736.94 2,444,902.59 2,578,541.58 2,781,509.70 2,976,316.77 3,253,867.93 3,386,569.92
ODCs 1,490,684.38 1,546,271.82 1,518,299.12 1,571,032.92 1,670,420.50 1,728,929.86 1,809,816.25 1,969,866.92 1,985,634.21 2,062,080.82 2,027,953.65 2,142,212.99 2,290,365.42
Less Liabilities to Central Government -145,425.39 -134,878.53 -145,587.14 -160,773.86 -78,786.57 -80,399.57 -112,610.37 -98,511.34 -97,346.59 -114,234.93 -118,604.61 -128,962.78 -95,742.09
Claims on Other Sectors 3,759,224.68 3,798,871.43 3,874,902.55 3,921,776.63 3,783,067.01 3,780,321.10 3,887,278.32 3,865,047.24 3,986,608.69 4,046,181.88 4,024,633.04 4,132,895.99 4,238,399.78
Other Financial Corporations 132,282.45 124,852.98 128,782.67 119,157.29 117,123.94 79,035.53 80,256.74 82,515.74 96,671.25 150,004.30 98,954.02 102,511.95 104,161.83
State and Local Government 43,554.41 41,728.47 37,784.82 34,237.41 35,909.11 35,006.53 34,312.18 34,732.93 36,595.52 35,573.02 34,059.17 34,223.63 31,707.35
Public Non Financial Corporations 234,348.95 248,965.26 244,277.53 240,007.21 246,102.41 274,898.12 268,976.36 302,761.14 334,495.68 337,668.92 400,050.10 399,893.78 453,678.02
Private Sector 3,349,038.87 3,383,324.72 3,464,057.53 3,528,374.72 3,383,931.55 3,391,380.92 3,503,733.03 3,445,037.42 3,518,846.25 3,522,935.65 3,491,569.75 3,596,266.62 3,648,852.59
Central Bank 28,360.51 28,496.47 28,190.50 31,268.19 28,547.39 34,327.69 34,209.32 31,152.87 32,571.62 33,352.46 34,125.26 42,626.53 36,709.07
ODCs 3,320,678.35 3,354,828.25 3,435,867.03 3,497,106.53 3,355,384.15 3,357,053.23 3,469,523.72 3,413,884.55 3,486,274.63 3,489,583.19 3,457,444.48 3,553,640.10 3,612,143.52
Other Items(Net) 1,416,298.52 1,302,565.27 1,497,369.51 1,475,594.53 1,397,901.41 1,438,268.87 1,482,328.45 1,551,278.46 1,685,282.14 1,708,893.05 1,720,215.14 1,741,727.44 1,809,417.31
Shares and Other Equity 887,795.24 915,505.55 935,291.08 1,470,571.26 1,471,378.30 1,481,807.04 1,505,125.81 1,501,542.86 1,530,318.89 1,547,498.82 1,546,591.56 1,561,407.13 1,584,816.43
Liabilities to Other Financial Corporations 39,463.26 31,567.03 32,045.66 52,038.47 44,373.98 46,621.66 45,153.65 45,155.62 45,511.27 49,869.95 38,847.96 26,097.05 35,381.24
Restricted Deposits 153,471.12 166,495.73 180,899.67 60,499.79 66,478.53 66,737.97 67,789.29 68,133.12 84,939.87 84,617.96 84,477.31 32,685.62 115,800.59
Other Items(net) 335,568.90 188,996.96 349,133.11 -107,514.99 -184,329.41 -156,897.79 -135,740.30 -63,553.13 24,512.12 26,906.32 50,298.31 121,537.64 73,419.06
Broad Money-M3 5,277,086.62 5,312,899.41 5,420,010.76 5,638,281.02 5,663,436.51 5,771,641.88 5,879,933.65 6,116,782.64 6,200,282.35 6,491,671.62 6,564,025.89 7,075,542.80 7,460,198.31
Securities Other than Shares Included in Broad Money 74,118.29 73,356.67 43,862.17 62,894.35 50,562.02 59,329.24 60,161.15 63,292.20 61,392.93 65,667.46 66,282.58 71,054.38 55,830.26
Broad Money-M2 5,202,968.33 5,239,542.75 5,376,148.60 5,575,386.66 5,612,874.49 5,712,312.64 5,819,772.50 6,053,490.44 6,138,889.42 6,426,004.16 6,497,743.31 7,004,488.42 7,404,368.06
Other Deposits 1,534,910.45 1,508,943.19 1,467,582.00 1,471,657.19 1,544,945.66 1,552,644.56 1,529,856.98 1,530,705.58 1,558,418.08 1,538,865.52 1,600,104.76 1,604,901.44 1,571,434.68
Narrow Money-M1 3,668,057.88 3,730,599.56 3,908,566.59 4,103,729.48 4,067,928.83 4,159,668.08 4,289,915.52 4,522,784.87 4,580,471.34 4,887,138.64 4,897,638.55 5,399,586.98 5,832,933.38
Transferable Deposits 3,658,634.63 3,720,917.62 3,889,717.47 4,033,558.66 3,985,443.09 4,046,287.46 4,147,742.43 4,369,406.07 4,404,701.40 4,690,977.34 4,696,301.61 5,199,733.27 5,589,485.14
Currency Outside Depository Corporations 9,423.25 9,681.93 18,849.12 70,170.81 82,485.74 113,380.62 142,173.09 153,378.80 175,769.94 196,161.30 201,336.94 199,853.71 243,448.24
Source:Reserve Bank of Zimbabwe,2017
Note:
(i) Depository corporations survey - formerly Monetary Survey.
(ii) Broad money redefined using IMF's Monetary and Financial Statistics Manual of 2000. Major changes include exclusion of Government deposits held by banks from broad money.
(iii) Transferable deposits made up of demand and savings deposits.
(iv) NCDs are also referred to as securities included in broad money.
(v) All classes of time deposits, short and long term are classified as time deposits, which are also termed other deposits.
(vi) Credit to the private sector now excludes claims on other financial corporations, as well as claims on state and local government (local authorities)
(vii) Depository corporations made up of the Central Bank and other depository corporations
(viii) Other depository corporations (ODCs) - Commercial banks, merchant banks, building societies and POSB.
TABLE 1: DEPOSITORY CORPORATIONS SURVEY (US$ '000)
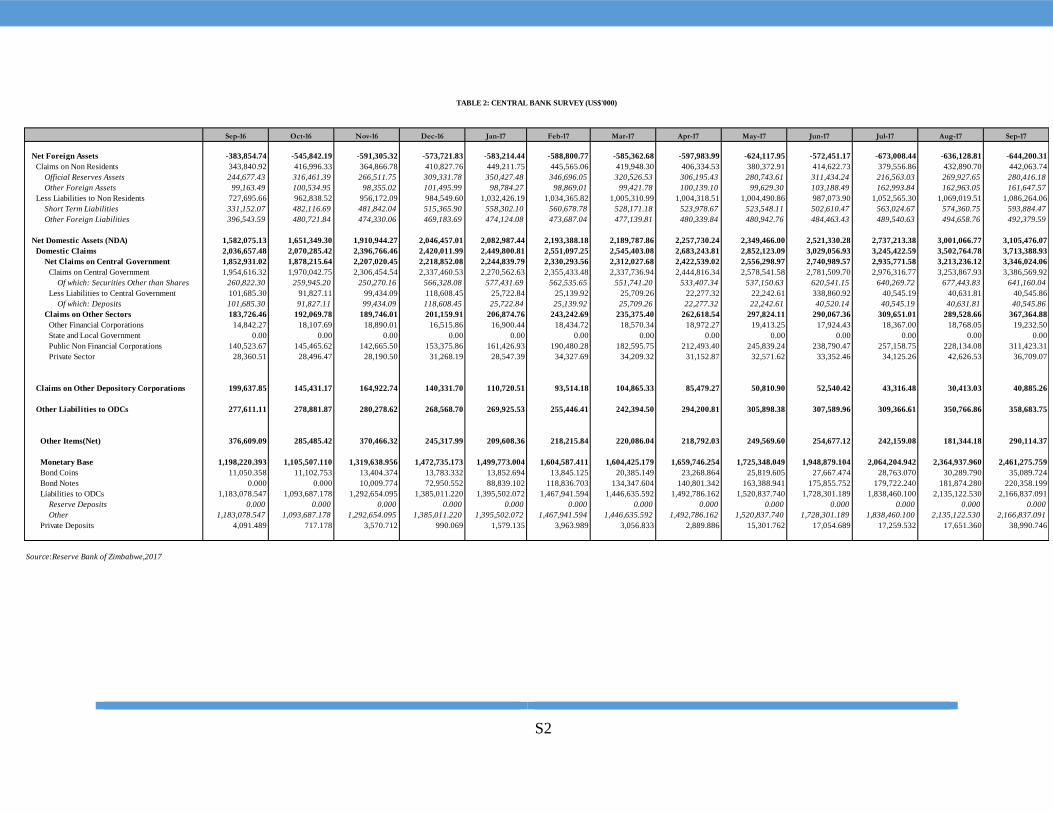
S2
Sep-16 Oct-16 Nov-16 Dec-16 Jan-17 Feb-17 Mar-17 Apr-17 May-17 Jun-17 Jul-17 Aug-17 Sep-17
Net Foreign Assets -383,854.74 -545,842.19 -591,305.32 -573,721.83 -583,214.44 -588,800.77 -585,362.68 -597,983.99 -624,117.95 -572,451.17 -673,008.44 -636,128.81 -644,200.31
Claims on Non Residents 343,840.92 416,996.33 364,866.78 410,827.76 449,211.75 445,565.06 419,948.30 406,334.53 380,372.91 414,622.73 379,556.86 432,890.70 442,063.74
Official Reserves Assets 244,677.43 316,461.39 266,511.75 309,331.78 350,427.48 346,696.05 320,526.53 306,195.43 280,743.61 311,434.24 216,563.03 269,927.65 280,416.18
Other Foreign Assets 99,163.49 100,534.95 98,355.02 101,495.99 98,784.27 98,869.01 99,421.78 100,139.10 99,629.30 103,188.49 162,993.84 162,963.05 161,647.57
Less Liabilities to Non Residents 727,695.66 962,838.52 956,172.09 984,549.60 1,032,426.19 1,034,365.82 1,005,310.99 1,004,318.51 1,004,490.86 987,073.90 1,052,565.30 1,069,019.51 1,086,264.06
Short Term Liabilities 331,152.07 482,116.69 481,842.04 515,365.90 558,302.10 560,678.78 528,171.18 523,978.67 523,548.11 502,610.47 563,024.67 574,360.75 593,884.47
Other Foreign Liabilities 396,543.59 480,721.84 474,330.06 469,183.69 474,124.08 473,687.04 477,139.81 480,339.84 480,942.76 484,463.43 489,540.63 494,658.76 492,379.59
Net Domestic Assets (NDA) 1,582,075.13 1,651,349.30 1,910,944.27 2,046,457.01 2,082,987.44 2,193,388.18 2,189,787.86 2,257,730.24 2,349,466.00 2,521,330.28 2,737,213.38 3,001,066.77 3,105,476.07
Domestic Claims 2,036,657.48 2,070,285.42 2,396,766.46 2,420,011.99 2,449,800.81 2,551,097.25 2,545,403.08 2,683,243.81 2,852,123.09 3,029,056.93 3,245,422.59 3,502,764.78 3,713,388.93
Net Claims on Central Government 1,852,931.02 1,878,215.64 2,207,020.45 2,218,852.08 2,244,839.79 2,330,293.56 2,312,027.68 2,422,539.02 2,556,298.97 2,740,989.57 2,935,771.58 3,213,236.12 3,346,024.06
Claims on Central Government 1,954,616.32 1,970,042.75 2,306,454.54 2,337,460.53 2,270,562.63 2,355,433.48 2,337,736.94 2,444,816.34 2,578,541.58 2,781,509.70 2,976,316.77 3,253,867.93 3,386,569.92
Of which: Securities Other than Shares 260,822.30 259,945.20 250,270.16 566,328.08 577,431.69 562,535.65 551,741.20 533,407.34 537,150.63 620,541.15 640,269.72 677,443.83 641,160.04
Less Liabilities to Central Government 101,685.30 91,827.11 99,434.09 118,608.45 25,722.84 25,139.92 25,709.26 22,277.32 22,242.61 338,860.92 40,545.19 40,631.81 40,545.86
Of which: Deposits 101,685.30 91,827.11 99,434.09 118,608.45 25,722.84 25,139.92 25,709.26 22,277.32 22,242.61 40,520.14 40,545.19 40,631.81 40,545.86
Claims on Other Sectors 183,726.46 192,069.78 189,746.01 201,159.91 206,874.76 243,242.69 235,375.40 262,618.54 297,824.11 290,067.36 309,651.01 289,528.66 367,364.88
Other Financial Corporations 14,842.27 18,107.69 18,890.01 16,515.86 16,900.44 18,434.72 18,570.34 18,972.27 19,413.25 17,924.43 18,367.00 18,768.05 19,232.50
State and Local Government 0.00 0.00 0.00 0.00 0.00 0.00 0.00 0.00 0.00 0.00 0.00 0.00 0.00
Public Non Financial Corporations 140,523.67 145,465.62 142,665.50 153,375.86 161,426.93 190,480.28 182,595.75 212,493.40 245,839.24 238,790.47 257,158.75 228,134.08 311,423.31
Private Sector 28,360.51 28,496.47 28,190.50 31,268.19 28,547.39 34,327.69 34,209.32 31,152.87 32,571.62 33,352.46 34,125.26 42,626.53 36,709.07
Claims on Other Depository Corporations 199,637.85 145,431.17 164,922.74 140,331.70 110,720.51 93,514.18 104,865.33 85,479.27 50,810.90 52,540.42 43,316.48 30,413.03 40,885.26
Other Liabilities to ODCs 277,611.11 278,881.87 280,278.62 268,568.70 269,925.53 255,446.41 242,394.50 294,200.81 305,898.38 307,589.96 309,366.61 350,766.86 358,683.75
Other Items(Net) 376,609.09 285,485.42 370,466.32 245,317.99 209,608.36 218,215.84 220,086.04 218,792.03 249,569.60 254,677.12 242,159.08 181,344.18 290,114.37
Monetary Base 1,198,220.393 1,105,507.110 1,319,638.956 1,472,735.173 1,499,773.004 1,604,587.411 1,604,425.179 1,659,746.254 1,725,348.049 1,948,879.104 2,064,204.942 2,364,937.960 2,461,275.759
Bond Coins 11,050.358 11,102.753 13,404.374 13,783.332 13,852.694 13,845.125 20,385.149 23,268.864 25,819.605 27,667.474 28,763.070 30,289.790 35,089.724
Bond Notes 0.000 0.000 10,009.774 72,950.552 88,839.102 118,836.703 134,347.604 140,801.342 163,388.941 175,855.752 179,722.240 181,874.280 220,358.199
Liabilities to ODCs 1,183,078.547 1,093,687.178 1,292,654.095 1,385,011.220 1,395,502.072 1,467,941.594 1,446,635.592 1,492,786.162 1,520,837.740 1,728,301.189 1,838,460.100 2,135,122.530 2,166,837.091
Reserve Deposits 0.000 0.000 0.000 0.000 0.000 0.000 0.000 0.000 0.000 0.000 0.000 0.000 0.000
Other 1,183,078.547 1,093,687.178 1,292,654.095 1,385,011.220 1,395,502.072 1,467,941.594 1,446,635.592 1,492,786.162 1,520,837.740 1,728,301.189 1,838,460.100 2,135,122.530 2,166,837.091
Private Deposits 4,091.489 717.178 3,570.712 990.069 1,579.135 3,963.989 3,056.833 2,889.886 15,301.762 17,054.689 17,259.532 17,651.360 38,990.746
Source:Reserve Bank of Zimbabwe,2017
TABLE 2: CENTRAL BANK SURVEY (US$'000)
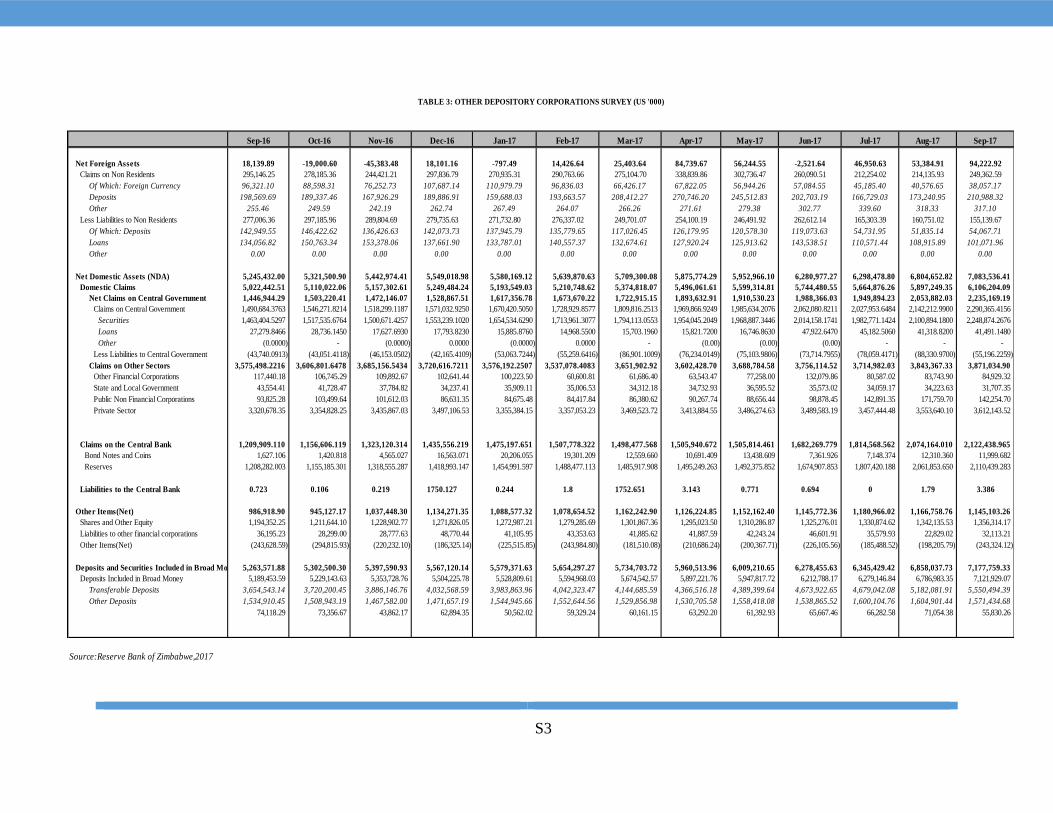
S3
Sep-16 Oct-16 Nov-16 Dec-16 Jan-17 Feb-17 Mar-17 Apr-17 May-17 Jun-17 Jul-17 Aug-17 Sep-17
Net Foreign Assets 18,139.89 -19,000.60 -45,383.48 18,101.16 -797.49 14,426.64 25,403.64 84,739.67 56,244.55 -2,521.64 46,950.63 53,384.91 94,222.92
Claims on Non Residents 295,146.25 278,185.36 244,421.21 297,836.79 270,935.31 290,763.66 275,104.70 338,839.86 302,736.47 260,090.51 212,254.02 214,135.93 249,362.59
Of Which: Foreign Currency 96,321.10 88,598.31 76,252.73 107,687.14 110,979.79 96,836.03 66,426.17 67,822.05 56,944.26 57,084.55 45,185.40 40,576.65 38,057.17
Deposits 198,569.69 189,337.46 167,926.29 189,886.91 159,688.03 193,663.57 208,412.27 270,746.20 245,512.83 202,703.19 166,729.03 173,240.95 210,988.32
Other 255.46 249.59 242.19 262.74 267.49 264.07 266.26 271.61 279.38 302.77 339.60 318.33 317.10
Less Liabilities to Non Residents 277,006.36 297,185.96 289,804.69 279,735.63 271,732.80 276,337.02 249,701.07 254,100.19 246,491.92 262,612.14 165,303.39 160,751.02 155,139.67
Of Which: Deposits 142,949.55 146,422.62 136,426.63 142,073.73 137,945.79 135,779.65 117,026.45 126,179.95 120,578.30 119,073.63 54,731.95 51,835.14 54,067.71
Loans 134,056.82 150,763.34 153,378.06 137,661.90 133,787.01 140,557.37 132,674.61 127,920.24 125,913.62 143,538.51 110,571.44 108,915.89 101,071.96
Other 0.00 0.00 0.00 0.00 0.00 0.00 0.00 0.00 0.00 0.00 0.00 0.00 0.00
Net Domestic Assets (NDA) 5,245,432.00 5,321,500.90 5,442,974.41 5,549,018.98 5,580,169.12 5,639,870.63 5,709,300.08 5,875,774.29 5,952,966.10 6,280,977.27 6,298,478.80 6,804,652.82 7,083,536.41
Domestic Claims 5,022,442.51 5,110,022.06 5,157,302.61 5,249,484.24 5,193,549.03 5,210,748.62 5,374,818.07 5,496,061.61 5,599,314.81 5,744,480.55 5,664,876.26 5,897,249.35 6,106,204.09
Net Claims on Central Government 1,446,944.29 1,503,220.41 1,472,146.07 1,528,867.51 1,617,356.78 1,673,670.22 1,722,915.15 1,893,632.91 1,910,530.23 1,988,366.03 1,949,894.23 2,053,882.03 2,235,169.19
Claims on Central Government 1,490,684.3763 1,546,271.8214 1,518,299.1187 1,571,032.9250 1,670,420.5050 1,728,929.8577 1,809,816.2513 1,969,866.9249 1,985,634.2076 2,062,080.8211 2,027,953.6484 2,142,212.9900 2,290,365.4156
Securities 1,463,404.5297 1,517,535.6764 1,500,671.4257 1,553,239.1020 1,654,534.6290 1,713,961.3077 1,794,113.0553 1,954,045.2049 1,968,887.3446 2,014,158.1741 1,982,771.1424 2,100,894.1800 2,248,874.2676
Loans 27,279.8466 28,736.1450 17,627.6930 17,793.8230 15,885.8760 14,968.5500 15,703.1960 15,821.7200 16,746.8630 47,922.6470 45,182.5060 41,318.8200 41,491.1480
Other (0.0000) - (0.0000) 0.0000 (0.0000) 0.0000 - (0.00) (0.00) (0.00) - - -
Less Liabilities to Central Government (43,740.0913) (43,051.4118) (46,153.0502) (42,165.4109) (53,063.7244) (55,259.6416) (86,901.1009) (76,234.0149) (75,103.9806) (73,714.7955) (78,059.4171) (88,330.9700) (55,196.2259)
Claims on Other Sectors 3,575,498.2216 3,606,801.6478 3,685,156.5434 3,720,616.7211 3,576,192.2507 3,537,078.4083 3,651,902.92 3,602,428.70 3,688,784.58 3,756,114.52 3,714,982.03 3,843,367.33 3,871,034.90
Other Financial Corporations 117,440.18 106,745.29 109,892.67 102,641.44 100,223.50 60,600.81 61,686.40 63,543.47 77,258.00 132,079.86 80,587.02 83,743.90 84,929.32
State and Local Government 43,554.41 41,728.47 37,784.82 34,237.41 35,909.11 35,006.53 34,312.18 34,732.93 36,595.52 35,573.02 34,059.17 34,223.63 31,707.35
Public Non Financial Corporations 93,825.28 103,499.64 101,612.03 86,631.35 84,675.48 84,417.84 86,380.62 90,267.74 88,656.44 98,878.45 142,891.35 171,759.70 142,254.70
Private Sector 3,320,678.35 3,354,828.25 3,435,867.03 3,497,106.53 3,355,384.15 3,357,053.23 3,469,523.72 3,413,884.55 3,486,274.63 3,489,583.19 3,457,444.48 3,553,640.10 3,612,143.52
Claims on the Central Bank 1,209,909.110 1,156,606.119 1,323,120.314 1,435,556.219 1,475,197.651 1,507,778.322 1,498,477.568 1,505,940.672 1,505,814.461 1,682,269.779 1,814,568.562 2,074,164.010 2,122,438.965
Bond Notes and Coins 1,627.106 1,420.818 4,565.027 16,563.071 20,206.055 19,301.209 12,559.660 10,691.409 13,438.609 7,361.926 7,148.374 12,310.360 11,999.682
Reserves 1,208,282.003 1,155,185.301 1,318,555.287 1,418,993.147 1,454,991.597 1,488,477.113 1,485,917.908 1,495,249.263 1,492,375.852 1,674,907.853 1,807,420.188 2,061,853.650 2,110,439.283
Liabilities to the Central Bank 0.723 0.106 0.219 1750.127 0.244 1.8 1752.651 3.143 0.771 0.694 0 1.79 3.386
Other Items(Net) 986,918.90 945,127.17 1,037,448.30 1,134,271.35 1,088,577.32 1,078,654.52 1,162,242.90 1,126,224.85 1,152,162.40 1,145,772.36 1,180,966.02 1,166,758.76 1,145,103.26
Shares and Other Equity 1,194,352.25 1,211,644.10 1,228,902.77 1,271,826.05 1,272,987.21 1,279,285.69 1,301,867.36 1,295,023.50 1,310,286.87 1,325,276.01 1,330,874.62 1,342,135.53 1,356,314.17
Liabilities to other financial corporations 36,195.23 28,299.00 28,777.63 48,770.44 41,105.95 43,353.63 41,885.62 41,887.59 42,243.24 46,601.91 35,579.93 22,829.02 32,113.21
Other Items(Net) (243,628.59) (294,815.93) (220,232.10) (186,325.14) (225,515.85) (243,984.80) (181,510.08) (210,686.24) (200,367.71) (226,105.56) (185,488.52) (198,205.79) (243,324.12)
Deposits and Securities Included in Broad Money 5,263,571.88 5,302,500.30 5,397,590.93 5,567,120.14 5,579,371.63 5,654,297.27 5,734,703.72 5,960,513.96 6,009,210.65 6,278,455.63 6,345,429.42 6,858,037.73 7,177,759.33
Deposits Included in Broad Money 5,189,453.59 5,229,143.63 5,353,728.76 5,504,225.78 5,528,809.61 5,594,968.03 5,674,542.57 5,897,221.76 5,947,817.72 6,212,788.17 6,279,146.84 6,786,983.35 7,121,929.07
Transferable Deposits 3,654,543.14 3,720,200.45 3,886,146.76 4,032,568.59 3,983,863.96 4,042,323.47 4,144,685.59 4,366,516.18 4,389,399.64 4,673,922.65 4,679,042.08 5,182,081.91 5,550,494.39
Other Deposits 1,534,910.45 1,508,943.19 1,467,582.00 1,471,657.19 1,544,945.66 1,552,644.56 1,529,856.98 1,530,705.58 1,558,418.08 1,538,865.52 1,600,104.76 1,604,901.44 1,571,434.68
74,118.29 73,356.67 43,862.17 62,894.35 50,562.02 59,329.24 60,161.15 63,292.20 61,392.93 65,667.46 66,282.58 71,054.38 55,830.26
Source:Reserve Bank of Zimbabwe,2017
TABLE 3: OTHER DEPOSITORY CORPORATIONS SURVEY (US '000)
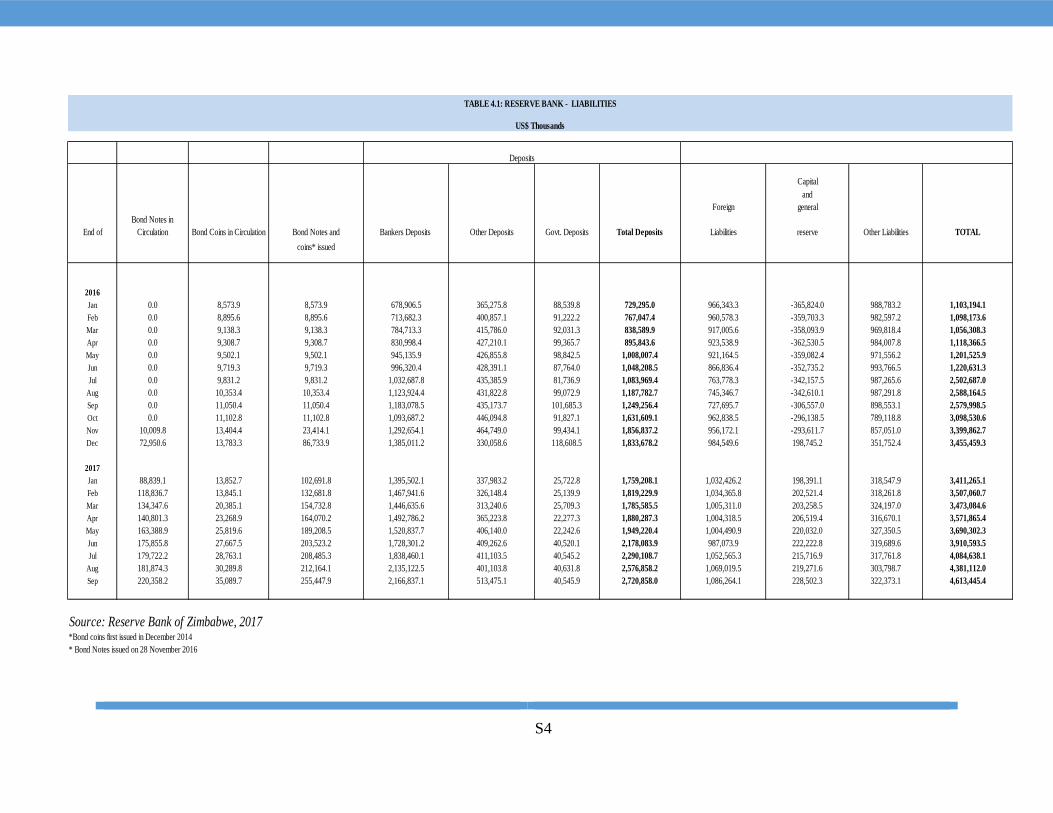
S4
Capital
and
Foreign general
End of
Bond Notes in
Circulation Bond Coins in Circulation Bond Notes and Bankers Deposits Other Deposits Govt. Deposits Total Deposits Liabilities reserve Other Liabilities TOTAL
coins* issued
2016
Jan 0.0 8,573.9 8,573.9 678,906.5 365,275.8 88,539.8 729,295.0 966,343.3 -365,824.0 988,783.2 1,103,194.1
Feb 0.0 8,895.6 8,895.6 713,682.3 400,857.1 91,222.2 767,047.4 960,578.3 -359,703.3 982,597.2 1,098,173.6
Mar 0.0 9,138.3 9,138.3 784,713.3 415,786.0 92,031.3 838,589.9 917,005.6 -358,093.9 969,818.4 1,056,308.3
Apr 0.0 9,308.7 9,308.7 830,998.4 427,210.1 99,365.7 895,843.6 923,538.9 -362,530.5 984,007.8 1,118,366.5
May 0.0 9,502.1 9,502.1 945,135.9 426,855.8 98,842.5 1,008,007.4 921,164.5 -359,082.4 971,556.2 1,201,525.9
Jun 0.0 9,719.3 9,719.3 996,320.4 428,391.1 87,764.0 1,048,208.5 866,836.4 -352,735.2 993,766.5 1,220,631.3
Jul 0.0 9,831.2 9,831.2 1,032,687.8 435,385.9 81,736.9 1,083,969.4 763,778.3 -342,157.5 987,265.6 2,502,687.0
Aug 0.0 10,353.4 10,353.4 1,123,924.4 431,822.8 99,072.9 1,187,782.7 745,346.7 -342,610.1 987,291.8 2,588,164.5
Sep 0.0 11,050.4 11,050.4 1,183,078.5 435,173.7 101,685.3 1,249,256.4 727,695.7 -306,557.0 898,553.1 2,579,998.5
Oct 0.0 11,102.8 11,102.8 1,093,687.2 446,094.8 91,827.1 1,631,609.1 962,838.5 -296,138.5 789,118.8 3,098,530.6
Nov 10,009.8 13,404.4 23,414.1 1,292,654.1 464,749.0 99,434.1 1,856,837.2 956,172.1 -293,611.7 857,051.0 3,399,862.7
Dec 72,950.6 13,783.3 86,733.9 1,385,011.2 330,058.6 118,608.5 1,833,678.2 984,549.6 198,745.2 351,752.4 3,455,459.3
2017
Jan 88,839.1 13,852.7 102,691.8 1,395,502.1 337,983.2 25,722.8 1,759,208.1 1,032,426.2 198,391.1 318,547.9 3,411,265.1
Feb 118,836.7 13,845.1 132,681.8 1,467,941.6 326,148.4 25,139.9 1,819,229.9 1,034,365.8 202,521.4 318,261.8 3,507,060.7
Mar 134,347.6 20,385.1 154,732.8 1,446,635.6 313,240.6 25,709.3 1,785,585.5 1,005,311.0 203,258.5 324,197.0 3,473,084.6
Apr 140,801.3 23,268.9 164,070.2 1,492,786.2 365,223.8 22,277.3 1,880,287.3 1,004,318.5 206,519.4 316,670.1 3,571,865.4
May 163,388.9 25,819.6 189,208.5 1,520,837.7 406,140.0 22,242.6 1,949,220.4 1,004,490.9 220,032.0 327,350.5 3,690,302.3
Jun 175,855.8 27,667.5 203,523.2 1,728,301.2 409,262.6 40,520.1 2,178,083.9 987,073.9 222,222.8 319,689.6 3,910,593.5
Jul 179,722.2 28,763.1 208,485.3 1,838,460.1 411,103.5 40,545.2 2,290,108.7 1,052,565.3 215,716.9 317,761.8 4,084,638.1
Aug 181,874.3 30,289.8 212,164.1 2,135,122.5 401,103.8 40,631.8 2,576,858.2 1,069,019.5 219,271.6 303,798.7 4,381,112.0
Sep 220,358.2 35,089.7 255,447.9 2,166,837.1 513,475.1 40,545.9 2,720,858.0 1,086,264.1 228,502.3 322,373.1 4,613,445.4
Source: Reserve Bank of Zimbabwe, 2017*Bond coins first issued in December 2014
* Bond Notes issued on 28 November 2016
US$ Thousands
Deposits
TABLE 4.1: RESERVE BANK - LIABILITIES
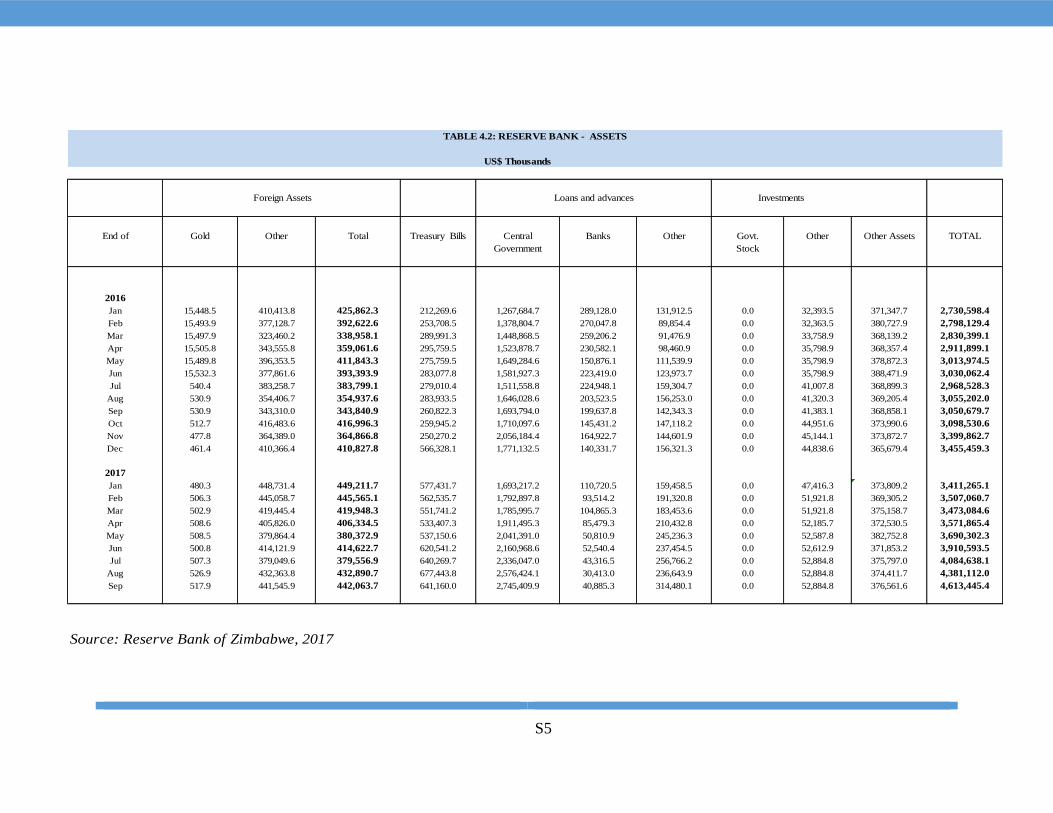
S5
US$ Thousands
End of Gold Other Total Treasury Bills Central Banks Other Govt. Other Other Assets TOTAL
Government Stock
2016
Jan 15,448.5 410,413.8 425,862.3 212,269.6 1,267,684.7 289,128.0 131,912.5 0.0 32,393.5 371,347.7 2,730,598.4
Feb 15,493.9 377,128.7 392,622.6 253,708.5 1,378,804.7 270,047.8 89,854.4 0.0 32,363.5 380,727.9 2,798,129.4
Mar 15,497.9 323,460.2 338,958.1 289,991.3 1,448,868.5 259,206.2 91,476.9 0.0 33,758.9 368,139.2 2,830,399.1
Apr 15,505.8 343,555.8 359,061.6 295,759.5 1,523,878.7 230,582.1 98,460.9 0.0 35,798.9 368,357.4 2,911,899.1
May 15,489.8 396,353.5 411,843.3 275,759.5 1,649,284.6 150,876.1 111,539.9 0.0 35,798.9 378,872.3 3,013,974.5
Jun 15,532.3 377,861.6 393,393.9 283,077.8 1,581,927.3 223,419.0 123,973.7 0.0 35,798.9 388,471.9 3,030,062.4
Jul 540.4 383,258.7 383,799.1 279,010.4 1,511,558.8 224,948.1 159,304.7 0.0 41,007.8 368,899.3 2,968,528.3
Aug 530.9 354,406.7 354,937.6 283,933.5 1,646,028.6 203,523.5 156,253.0 0.0 41,320.3 369,205.4 3,055,202.0
Sep 530.9 343,310.0 343,840.9 260,822.3 1,693,794.0 199,637.8 142,343.3 0.0 41,383.1 368,858.1 3,050,679.7
Oct 512.7 416,483.6 416,996.3 259,945.2 1,710,097.6 145,431.2 147,118.2 0.0 44,951.6 373,990.6 3,098,530.6
Nov 477.8 364,389.0 364,866.8 250,270.2 2,056,184.4 164,922.7 144,601.9 0.0 45,144.1 373,872.7 3,399,862.7
Dec 461.4 410,366.4 410,827.8 566,328.1 1,771,132.5 140,331.7 156,321.3 0.0 44,838.6 365,679.4 3,455,459.3
2017
Jan 480.3 448,731.4 449,211.7 577,431.7 1,693,217.2 110,720.5 159,458.5 0.0 47,416.3 373,809.2 3,411,265.1
Feb 506.3 445,058.7 445,565.1 562,535.7 1,792,897.8 93,514.2 191,320.8 0.0 51,921.8 369,305.2 3,507,060.7
Mar 502.9 419,445.4 419,948.3 551,741.2 1,785,995.7 104,865.3 183,453.6 0.0 51,921.8 375,158.7 3,473,084.6
Apr 508.6 405,826.0 406,334.5 533,407.3 1,911,495.3 85,479.3 210,432.8 0.0 52,185.7 372,530.5 3,571,865.4
May 508.5 379,864.4 380,372.9 537,150.6 2,041,391.0 50,810.9 245,236.3 0.0 52,587.8 382,752.8 3,690,302.3
Jun 500.8 414,121.9 414,622.7 620,541.2 2,160,968.6 52,540.4 237,454.5 0.0 52,612.9 371,853.2 3,910,593.5
Jul 507.3 379,049.6 379,556.9 640,269.7 2,336,047.0 43,316.5 256,766.2 0.0 52,884.8 375,797.0 4,084,638.1
Aug 526.9 432,363.8 432,890.7 677,443.8 2,576,424.1 30,413.0 236,643.9 0.0 52,884.8 374,411.7 4,381,112.0
Sep 517.9 441,545.9 442,063.7 641,160.0 2,745,409.9 40,885.3 314,480.1 0.0 52,884.8 376,561.6 4,613,445.4
Source: Reserve Bank of Zimbabwe, 2017
TABLE 4.2: RESERVE BANK - ASSETS
Foreign Assets Loans and advances Investments
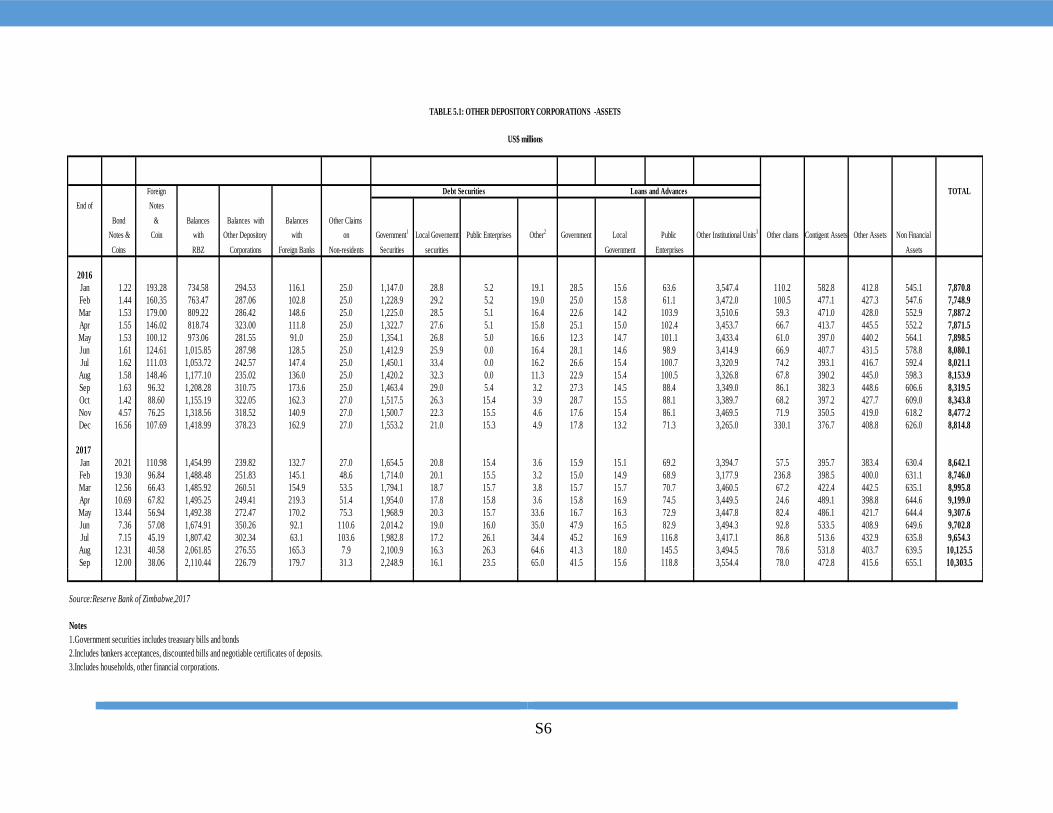
S6
Foreign TOTAL
End of Notes
Bond & Balances Balances with Balances Other Claims
Notes & Coin with Other Depository with on Government1
Local Governemt Public Enterprises Other2
Government Local Public Other Institutional Units3
Other cliams Contigent Assets Other Assets Non Financial
Coins RBZ Corporations Foreign Banks Non-residents Securities securities Government Enterprises Assets
2016
Jan 1.22 193.28 734.58 294.53 116.1 25.0 1,147.0 28.8 5.2 19.1 28.5 15.6 63.6 3,547.4 110.2 582.8 412.8 545.1 7,870.8
Feb 1.44 160.35 763.47 287.06 102.8 25.0 1,228.9 29.2 5.2 19.0 25.0 15.8 61.1 3,472.0 100.5 477.1 427.3 547.6 7,748.9
Mar 1.53 179.00 809.22 286.42 148.6 25.0 1,225.0 28.5 5.1 16.4 22.6 14.2 103.9 3,510.6 59.3 471.0 428.0 552.9 7,887.2
Apr 1.55 146.02 818.74 323.00 111.8 25.0 1,322.7 27.6 5.1 15.8 25.1 15.0 102.4 3,453.7 66.7 413.7 445.5 552.2 7,871.5
May 1.53 100.12 973.06 281.55 91.0 25.0 1,354.1 26.8 5.0 16.6 12.3 14.7 101.1 3,433.4 61.0 397.0 440.2 564.1 7,898.5
Jun 1.61 124.61 1,015.85 287.98 128.5 25.0 1,412.9 25.9 0.0 16.4 28.1 14.6 98.9 3,414.9 66.9 407.7 431.5 578.8 8,080.1
Jul 1.62 111.03 1,053.72 242.57 147.4 25.0 1,450.1 33.4 0.0 16.2 26.6 15.4 100.7 3,320.9 74.2 393.1 416.7 592.4 8,021.1
Aug 1.58 148.46 1,177.10 235.02 136.0 25.0 1,420.2 32.3 0.0 11.3 22.9 15.4 100.5 3,326.8 67.8 390.2 445.0 598.3 8,153.9
Sep 1.63 96.32 1,208.28 310.75 173.6 25.0 1,463.4 29.0 5.4 3.2 27.3 14.5 88.4 3,349.0 86.1 382.3 448.6 606.6 8,319.5
Oct 1.42 88.60 1,155.19 322.05 162.3 27.0 1,517.5 26.3 15.4 3.9 28.7 15.5 88.1 3,389.7 68.2 397.2 427.7 609.0 8,343.8
Nov 4.57 76.25 1,318.56 318.52 140.9 27.0 1,500.7 22.3 15.5 4.6 17.6 15.4 86.1 3,469.5 71.9 350.5 419.0 618.2 8,477.2
Dec 16.56 107.69 1,418.99 378.23 162.9 27.0 1,553.2 21.0 15.3 4.9 17.8 13.2 71.3 3,265.0 330.1 376.7 408.8 626.0 8,814.8
2017
Jan 20.21 110.98 1,454.99 239.82 132.7 27.0 1,654.5 20.8 15.4 3.6 15.9 15.1 69.2 3,394.7 57.5 395.7 383.4 630.4 8,642.1
Feb 19.30 96.84 1,488.48 251.83 145.1 48.6 1,714.0 20.1 15.5 3.2 15.0 14.9 68.9 3,177.9 236.8 398.5 400.0 631.1 8,746.0
Mar 12.56 66.43 1,485.92 260.51 154.9 53.5 1,794.1 18.7 15.7 3.8 15.7 15.7 70.7 3,460.5 67.2 422.4 442.5 635.1 8,995.8
Apr 10.69 67.82 1,495.25 249.41 219.3 51.4 1,954.0 17.8 15.8 3.6 15.8 16.9 74.5 3,449.5 24.6 489.1 398.8 644.6 9,199.0
May 13.44 56.94 1,492.38 272.47 170.2 75.3 1,968.9 20.3 15.7 33.6 16.7 16.3 72.9 3,447.8 82.4 486.1 421.7 644.4 9,307.6
Jun 7.36 57.08 1,674.91 350.26 92.1 110.6 2,014.2 19.0 16.0 35.0 47.9 16.5 82.9 3,494.3 92.8 533.5 408.9 649.6 9,702.8
Jul 7.15 45.19 1,807.42 302.34 63.1 103.6 1,982.8 17.2 26.1 34.4 45.2 16.9 116.8 3,417.1 86.8 513.6 432.9 635.8 9,654.3
Aug 12.31 40.58 2,061.85 276.55 165.3 7.9 2,100.9 16.3 26.3 64.6 41.3 18.0 145.5 3,494.5 78.6 531.8 403.7 639.5 10,125.5
Sep 12.00 38.06 2,110.44 226.79 179.7 31.3 2,248.9 16.1 23.5 65.0 41.5 15.6 118.8 3,554.4 78.0 472.8 415.6 655.1 10,303.5
Source:Reserve Bank of Zimbabwe,2017
Notes
1.Government securities includes treasuary bills and bonds
2.Includes bankers acceptances, discounted bills and negotiable certificates of deposits.
3.Includes households, other financial corporations.
TABLE 5.1: OTHER DEPOSITORY CORPORATIONS -ASSETS
US$ millions
Debt Securities Loans and Advances
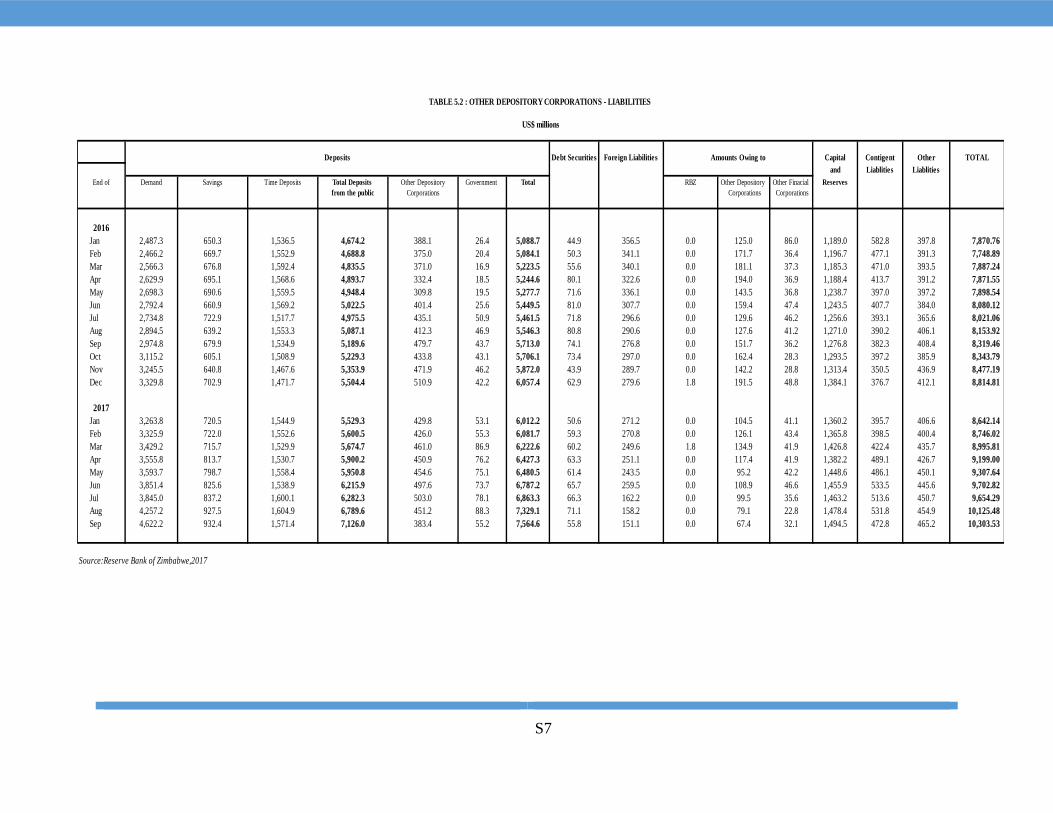
S7
Debt Securities Foreign Liabilities Capital Contigent Other TOTAL
and Liablities Liablities
End of Demand Savings Time Deposits Total Deposits Other Depository Government Total RBZ Other Depository Other Finacial Reserves
from the public Corporations Corporations Corporations
2016
Jan 2,487.3 650.3 1,536.5 4,674.2 388.1 26.4 5,088.7 44.9 356.5 0.0 125.0 86.0 1,189.0 582.8 397.8 7,870.76
Feb 2,466.2 669.7 1,552.9 4,688.8 375.0 20.4 5,084.1 50.3 341.1 0.0 171.7 36.4 1,196.7 477.1 391.3 7,748.89
Mar 2,566.3 676.8 1,592.4 4,835.5 371.0 16.9 5,223.5 55.6 340.1 0.0 181.1 37.3 1,185.3 471.0 393.5 7,887.24
Apr 2,629.9 695.1 1,568.6 4,893.7 332.4 18.5 5,244.6 80.1 322.6 0.0 194.0 36.9 1,188.4 413.7 391.2 7,871.55
May 2,698.3 690.6 1,559.5 4,948.4 309.8 19.5 5,277.7 71.6 336.1 0.0 143.5 36.8 1,238.7 397.0 397.2 7,898.54
Jun 2,792.4 660.9 1,569.2 5,022.5 401.4 25.6 5,449.5 81.0 307.7 0.0 159.4 47.4 1,243.5 407.7 384.0 8,080.12
Jul 2,734.8 722.9 1,517.7 4,975.5 435.1 50.9 5,461.5 71.8 296.6 0.0 129.6 46.2 1,256.6 393.1 365.6 8,021.06
Aug 2,894.5 639.2 1,553.3 5,087.1 412.3 46.9 5,546.3 80.8 290.6 0.0 127.6 41.2 1,271.0 390.2 406.1 8,153.92
Sep 2,974.8 679.9 1,534.9 5,189.6 479.7 43.7 5,713.0 74.1 276.8 0.0 151.7 36.2 1,276.8 382.3 408.4 8,319.46
Oct 3,115.2 605.1 1,508.9 5,229.3 433.8 43.1 5,706.1 73.4 297.0 0.0 162.4 28.3 1,293.5 397.2 385.9 8,343.79
Nov 3,245.5 640.8 1,467.6 5,353.9 471.9 46.2 5,872.0 43.9 289.7 0.0 142.2 28.8 1,313.4 350.5 436.9 8,477.19
Dec 3,329.8 702.9 1,471.7 5,504.4 510.9 42.2 6,057.4 62.9 279.6 1.8 191.5 48.8 1,384.1 376.7 412.1 8,814.81
2017
Jan 3,263.8 720.5 1,544.9 5,529.3 429.8 53.1 6,012.2 50.6 271.2 0.0 104.5 41.1 1,360.2 395.7 406.6 8,642.14
Feb 3,325.9 722.0 1,552.6 5,600.5 426.0 55.3 6,081.7 59.3 270.8 0.0 126.1 43.4 1,365.8 398.5 400.4 8,746.02
Mar 3,429.2 715.7 1,529.9 5,674.7 461.0 86.9 6,222.6 60.2 249.6 1.8 134.9 41.9 1,426.8 422.4 435.7 8,995.81
Apr 3,555.8 813.7 1,530.7 5,900.2 450.9 76.2 6,427.3 63.3 251.1 0.0 117.4 41.9 1,382.2 489.1 426.7 9,199.00
May 3,593.7 798.7 1,558.4 5,950.8 454.6 75.1 6,480.5 61.4 243.5 0.0 95.2 42.2 1,448.6 486.1 450.1 9,307.64
Jun 3,851.4 825.6 1,538.9 6,215.9 497.6 73.7 6,787.2 65.7 259.5 0.0 108.9 46.6 1,455.9 533.5 445.6 9,702.82
Jul 3,845.0 837.2 1,600.1 6,282.3 503.0 78.1 6,863.3 66.3 162.2 0.0 99.5 35.6 1,463.2 513.6 450.7 9,654.29
Aug 4,257.2 927.5 1,604.9 6,789.6 451.2 88.3 7,329.1 71.1 158.2 0.0 79.1 22.8 1,478.4 531.8 454.9 10,125.48
Sep 4,622.2 932.4 1,571.4 7,126.0 383.4 55.2 7,564.6 55.8 151.1 0.0 67.4 32.1 1,494.5 472.8 465.2 10,303.53
Source:Reserve Bank of Zimbabwe,2017
TABLE 5.2 : OTHER DEPOSITORY CORPORATIONS - LIABILITIES
US$ millions
Deposits Amounts Owing to
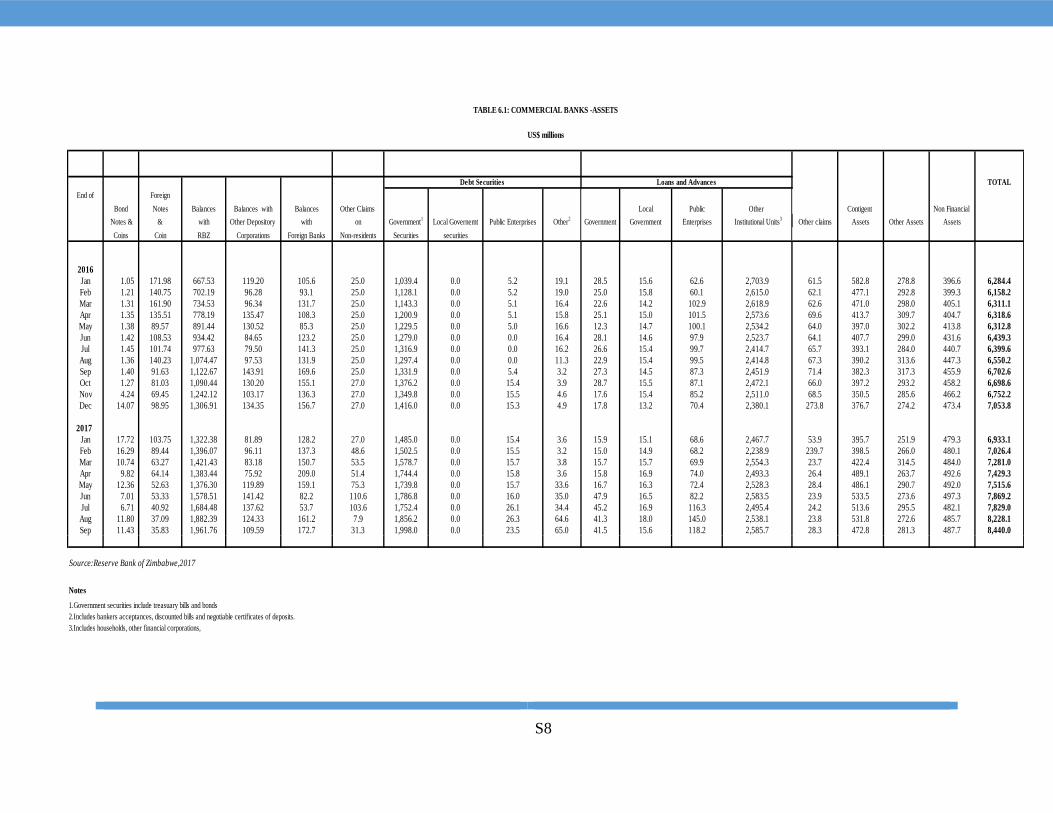
S8
TOTAL
End of Foreign
Bond Notes Balances Balances with Balances Other Claims Local Public Other Contigent Non Financial
Notes & & with Other Depository with on Government1
Local Governemt Public Enterprises Other2
Government Government Enterprises Institutional Units3
Other claims Assets Other Assets Assets
Coins Coin RBZ Corporations Foreign Banks Non-residents Securities securities
2016
Jan 1.05 171.98 667.53 119.20 105.6 25.0 1,039.4 0.0 5.2 19.1 28.5 15.6 62.6 2,703.9 61.5 582.8 278.8 396.6 6,284.4
Feb 1.21 140.75 702.19 96.28 93.1 25.0 1,128.1 0.0 5.2 19.0 25.0 15.8 60.1 2,615.0 62.1 477.1 292.8 399.3 6,158.2
Mar 1.31 161.90 734.53 96.34 131.7 25.0 1,143.3 0.0 5.1 16.4 22.6 14.2 102.9 2,618.9 62.6 471.0 298.0 405.1 6,311.1
Apr 1.35 135.51 778.19 135.47 108.3 25.0 1,200.9 0.0 5.1 15.8 25.1 15.0 101.5 2,573.6 69.6 413.7 309.7 404.7 6,318.6
May 1.38 89.57 891.44 130.52 85.3 25.0 1,229.5 0.0 5.0 16.6 12.3 14.7 100.1 2,534.2 64.0 397.0 302.2 413.8 6,312.8
Jun 1.42 108.53 934.42 84.65 123.2 25.0 1,279.0 0.0 0.0 16.4 28.1 14.6 97.9 2,523.7 64.1 407.7 299.0 431.6 6,439.3
Jul 1.45 101.74 977.63 79.50 141.3 25.0 1,316.9 0.0 0.0 16.2 26.6 15.4 99.7 2,414.7 65.7 393.1 284.0 440.7 6,399.6
Aug 1.36 140.23 1,074.47 97.53 131.9 25.0 1,297.4 0.0 0.0 11.3 22.9 15.4 99.5 2,414.8 67.3 390.2 313.6 447.3 6,550.2
Sep 1.40 91.63 1,122.67 143.91 169.6 25.0 1,331.9 0.0 5.4 3.2 27.3 14.5 87.3 2,451.9 71.4 382.3 317.3 455.9 6,702.6
Oct 1.27 81.03 1,090.44 130.20 155.1 27.0 1,376.2 0.0 15.4 3.9 28.7 15.5 87.1 2,472.1 66.0 397.2 293.2 458.2 6,698.6
Nov 4.24 69.45 1,242.12 103.17 136.3 27.0 1,349.8 0.0 15.5 4.6 17.6 15.4 85.2 2,511.0 68.5 350.5 285.6 466.2 6,752.2
Dec 14.07 98.95 1,306.91 134.35 156.7 27.0 1,416.0 0.0 15.3 4.9 17.8 13.2 70.4 2,380.1 273.8 376.7 274.2 473.4 7,053.8
2017
Jan 17.72 103.75 1,322.38 81.89 128.2 27.0 1,485.0 0.0 15.4 3.6 15.9 15.1 68.6 2,467.7 53.9 395.7 251.9 479.3 6,933.1
Feb 16.29 89.44 1,396.07 96.11 137.3 48.6 1,502.5 0.0 15.5 3.2 15.0 14.9 68.2 2,238.9 239.7 398.5 266.0 480.1 7,026.4
Mar 10.74 63.27 1,421.43 83.18 150.7 53.5 1,578.7 0.0 15.7 3.8 15.7 15.7 69.9 2,554.3 23.7 422.4 314.5 484.0 7,281.0
Apr 9.82 64.14 1,383.44 75.92 209.0 51.4 1,744.4 0.0 15.8 3.6 15.8 16.9 74.0 2,493.3 26.4 489.1 263.7 492.6 7,429.3
May 12.36 52.63 1,376.30 119.89 159.1 75.3 1,739.8 0.0 15.7 33.6 16.7 16.3 72.4 2,528.3 28.4 486.1 290.7 492.0 7,515.6
Jun 7.01 53.33 1,578.51 141.42 82.2 110.6 1,786.8 0.0 16.0 35.0 47.9 16.5 82.2 2,583.5 23.9 533.5 273.6 497.3 7,869.2
Jul 6.71 40.92 1,684.48 137.62 53.7 103.6 1,752.4 0.0 26.1 34.4 45.2 16.9 116.3 2,495.4 24.2 513.6 295.5 482.1 7,829.0
Aug 11.80 37.09 1,882.39 124.33 161.2 7.9 1,856.2 0.0 26.3 64.6 41.3 18.0 145.0 2,538.1 23.8 531.8 272.6 485.7 8,228.1
Sep 11.43 35.83 1,961.76 109.59 172.7 31.3 1,998.0 0.0 23.5 65.0 41.5 15.6 118.2 2,585.7 28.3 472.8 281.3 487.7 8,440.0
Source:Reserve Bank of Zimbabwe,2017
Notes
1.Government securities include treasuary bills and bonds
2.Includes bankers acceptances, discounted bills and negotiable certificates of deposits.
3.Includes households, other financial corporations,
Debt Securities Loans and Advances
TABLE 6.1: COMMERCIAL BANKS -ASSETS
US$ millions
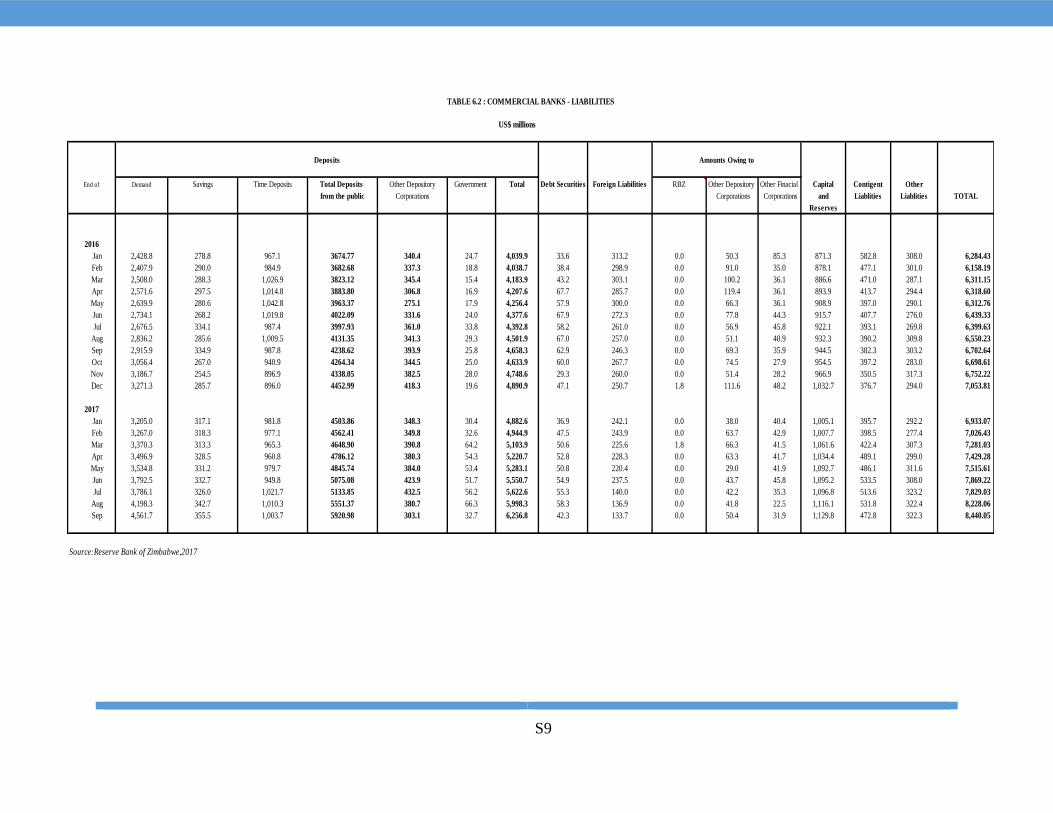
S9
US$ millions
End of Demand Savings Time Deposits Total Deposits Other Depository Government Total Debt Securities Foreign Liabilities RBZ Other Depository Other Finacial Capital Contigent Other
from the public Corporations Corporations Corporations and Liablities Liablities TOTAL
Reserves
2016
Jan 2,428.8 278.8 967.1 3674.77 340.4 24.7 4,039.9 33.6 313.2 0.0 50.3 85.3 871.3 582.8 308.0 6,284.43
Feb 2,407.9 290.0 984.9 3682.68 337.3 18.8 4,038.7 38.4 298.9 0.0 91.0 35.0 878.1 477.1 301.0 6,158.19
Mar 2,508.0 288.3 1,026.9 3823.12 345.4 15.4 4,183.9 43.2 303.1 0.0 100.2 36.1 886.6 471.0 287.1 6,311.15
Apr 2,571.6 297.5 1,014.8 3883.80 306.8 16.9 4,207.6 67.7 285.7 0.0 119.4 36.1 893.9 413.7 294.4 6,318.60
May 2,639.9 280.6 1,042.8 3963.37 275.1 17.9 4,256.4 57.9 300.0 0.0 66.3 36.1 908.9 397.0 290.1 6,312.76
Jun 2,734.1 268.2 1,019.8 4022.09 331.6 24.0 4,377.6 67.9 272.3 0.0 77.8 44.3 915.7 407.7 276.0 6,439.33
Jul 2,676.5 334.1 987.4 3997.93 361.0 33.8 4,392.8 58.2 261.0 0.0 56.9 45.8 922.1 393.1 269.8 6,399.63
Aug 2,836.2 285.6 1,009.5 4131.35 341.3 29.3 4,501.9 67.0 257.0 0.0 51.1 40.9 932.3 390.2 309.8 6,550.23
Sep 2,915.9 334.9 987.8 4238.62 393.9 25.8 4,658.3 62.9 246.3 0.0 69.3 35.9 944.5 382.3 303.2 6,702.64
Oct 3,056.4 267.0 940.9 4264.34 344.5 25.0 4,633.9 60.0 267.7 0.0 74.5 27.9 954.5 397.2 283.0 6,698.61
Nov 3,186.7 254.5 896.9 4338.05 382.5 28.0 4,748.6 29.3 260.0 0.0 51.4 28.2 966.9 350.5 317.3 6,752.22
Dec 3,271.3 285.7 896.0 4452.99 418.3 19.6 4,890.9 47.1 250.7 1.8 111.6 48.2 1,032.7 376.7 294.0 7,053.81
2017
Jan 3,205.0 317.1 981.8 4503.86 348.3 30.4 4,882.6 36.9 242.1 0.0 38.0 40.4 1,005.1 395.7 292.2 6,933.07
Feb 3,267.0 318.3 977.1 4562.41 349.8 32.6 4,944.9 47.5 243.9 0.0 63.7 42.9 1,007.7 398.5 277.4 7,026.43
Mar 3,370.3 313.3 965.3 4648.90 390.8 64.2 5,103.9 50.6 225.6 1.8 66.3 41.5 1,061.6 422.4 307.3 7,281.03
Apr 3,496.9 328.5 960.8 4786.12 380.3 54.3 5,220.7 52.8 228.3 0.0 63.3 41.7 1,034.4 489.1 299.0 7,429.28
May 3,534.8 331.2 979.7 4845.74 384.0 53.4 5,283.1 50.8 220.4 0.0 29.0 41.9 1,092.7 486.1 311.6 7,515.61
Jun 3,792.5 332.7 949.8 5075.08 423.9 51.7 5,550.7 54.9 237.5 0.0 43.7 45.8 1,095.2 533.5 308.0 7,869.22
Jul 3,786.1 326.0 1,021.7 5133.85 432.5 56.2 5,622.6 55.3 140.0 0.0 42.2 35.3 1,096.8 513.6 323.2 7,829.03
Aug 4,198.3 342.7 1,010.3 5551.37 380.7 66.3 5,998.3 58.3 136.9 0.0 41.8 22.5 1,116.1 531.8 322.4 8,228.06
Sep 4,561.7 355.5 1,003.7 5920.98 303.1 32.7 6,256.8 42.3 133.7 0.0 50.4 31.9 1,129.8 472.8 322.3 8,440.05
Source:Reserve Bank of Zimbabwe,2017
TABLE 6.2 : COMMERCIAL BANKS - LIABILITIES
Deposits Amounts Owing to
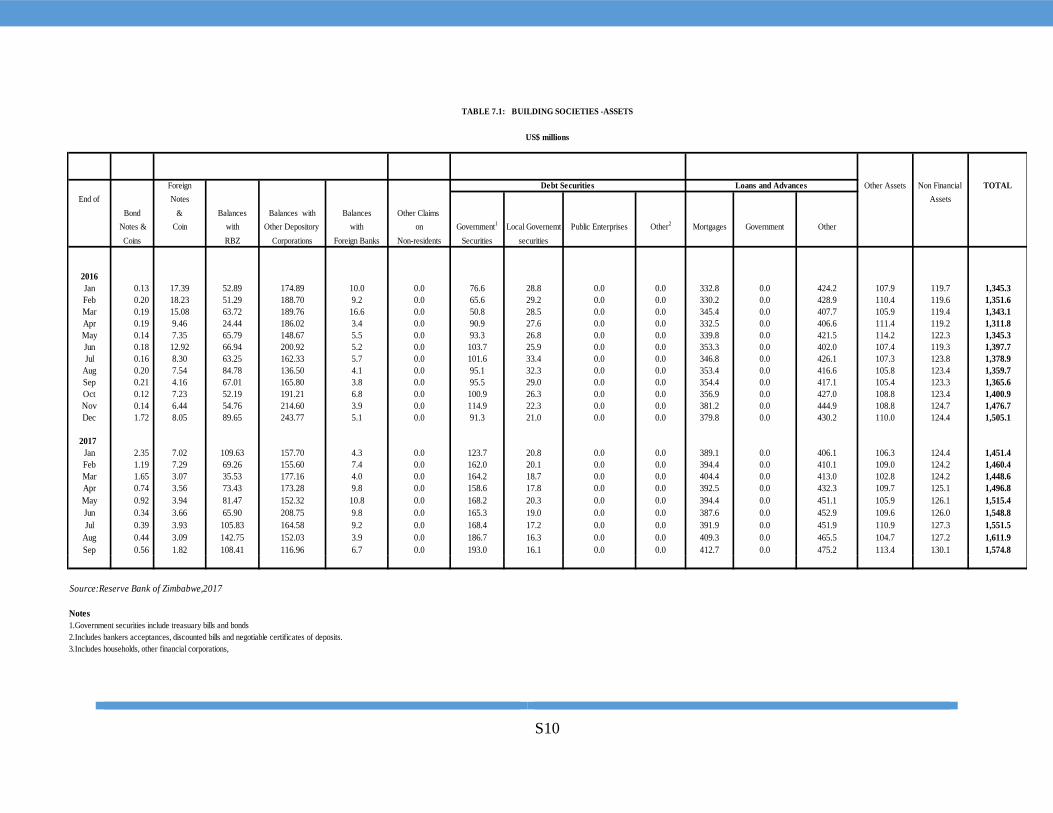
S10
Foreign Other Assets Non Financial TOTAL
End of Notes Assets
Bond & Balances Balances with Balances Other Claims
Notes & Coin with Other Depository with on Government1
Local Governemt Public Enterprises Other2
Mortgages Government Other
Coins RBZ Corporations Foreign Banks Non-residents Securities securities
2016
Jan 0.13 17.39 52.89 174.89 10.0 0.0 76.6 28.8 0.0 0.0 332.8 0.0 424.2 107.9 119.7 1,345.3
Feb 0.20 18.23 51.29 188.70 9.2 0.0 65.6 29.2 0.0 0.0 330.2 0.0 428.9 110.4 119.6 1,351.6
Mar 0.19 15.08 63.72 189.76 16.6 0.0 50.8 28.5 0.0 0.0 345.4 0.0 407.7 105.9 119.4 1,343.1
Apr 0.19 9.46 24.44 186.02 3.4 0.0 90.9 27.6 0.0 0.0 332.5 0.0 406.6 111.4 119.2 1,311.8
May 0.14 7.35 65.79 148.67 5.5 0.0 93.3 26.8 0.0 0.0 339.8 0.0 421.5 114.2 122.3 1,345.3
Jun 0.18 12.92 66.94 200.92 5.2 0.0 103.7 25.9 0.0 0.0 353.3 0.0 402.0 107.4 119.3 1,397.7
Jul 0.16 8.30 63.25 162.33 5.7 0.0 101.6 33.4 0.0 0.0 346.8 0.0 426.1 107.3 123.8 1,378.9
Aug 0.20 7.54 84.78 136.50 4.1 0.0 95.1 32.3 0.0 0.0 353.4 0.0 416.6 105.8 123.4 1,359.7
Sep 0.21 4.16 67.01 165.80 3.8 0.0 95.5 29.0 0.0 0.0 354.4 0.0 417.1 105.4 123.3 1,365.6
Oct 0.12 7.23 52.19 191.21 6.8 0.0 100.9 26.3 0.0 0.0 356.9 0.0 427.0 108.8 123.4 1,400.9
Nov 0.14 6.44 54.76 214.60 3.9 0.0 114.9 22.3 0.0 0.0 381.2 0.0 444.9 108.8 124.7 1,476.7
Dec 1.72 8.05 89.65 243.77 5.1 0.0 91.3 21.0 0.0 0.0 379.8 0.0 430.2 110.0 124.4 1,505.1
2017
Jan 2.35 7.02 109.63 157.70 4.3 0.0 123.7 20.8 0.0 0.0 389.1 0.0 406.1 106.3 124.4 1,451.4
Feb 1.19 7.29 69.26 155.60 7.4 0.0 162.0 20.1 0.0 0.0 394.4 0.0 410.1 109.0 124.2 1,460.4
Mar 1.65 3.07 35.53 177.16 4.0 0.0 164.2 18.7 0.0 0.0 404.4 0.0 413.0 102.8 124.2 1,448.6
Apr 0.74 3.56 73.43 173.28 9.8 0.0 158.6 17.8 0.0 0.0 392.5 0.0 432.3 109.7 125.1 1,496.8
May 0.92 3.94 81.47 152.32 10.8 0.0 168.2 20.3 0.0 0.0 394.4 0.0 451.1 105.9 126.1 1,515.4
Jun 0.34 3.66 65.90 208.75 9.8 0.0 165.3 19.0 0.0 0.0 387.6 0.0 452.9 109.6 126.0 1,548.8
Jul 0.39 3.93 105.83 164.58 9.2 0.0 168.4 17.2 0.0 0.0 391.9 0.0 451.9 110.9 127.3 1,551.5
Aug 0.44 3.09 142.75 152.03 3.9 0.0 186.7 16.3 0.0 0.0 409.3 0.0 465.5 104.7 127.2 1,611.9
Sep 0.56 1.82 108.41 116.96 6.7 0.0 193.0 16.1 0.0 0.0 412.7 0.0 475.2 113.4 130.1 1,574.8
Source:Reserve Bank of Zimbabwe,2017
Notes
1.Government securities include treasuary bills and bonds
2.Includes bankers acceptances, discounted bills and negotiable certificates of deposits.
3.Includes households, other financial corporations,
TABLE 7.1: BUILDING SOCIETIES -ASSETS
US$ millions
Debt Securities Loans and Advances
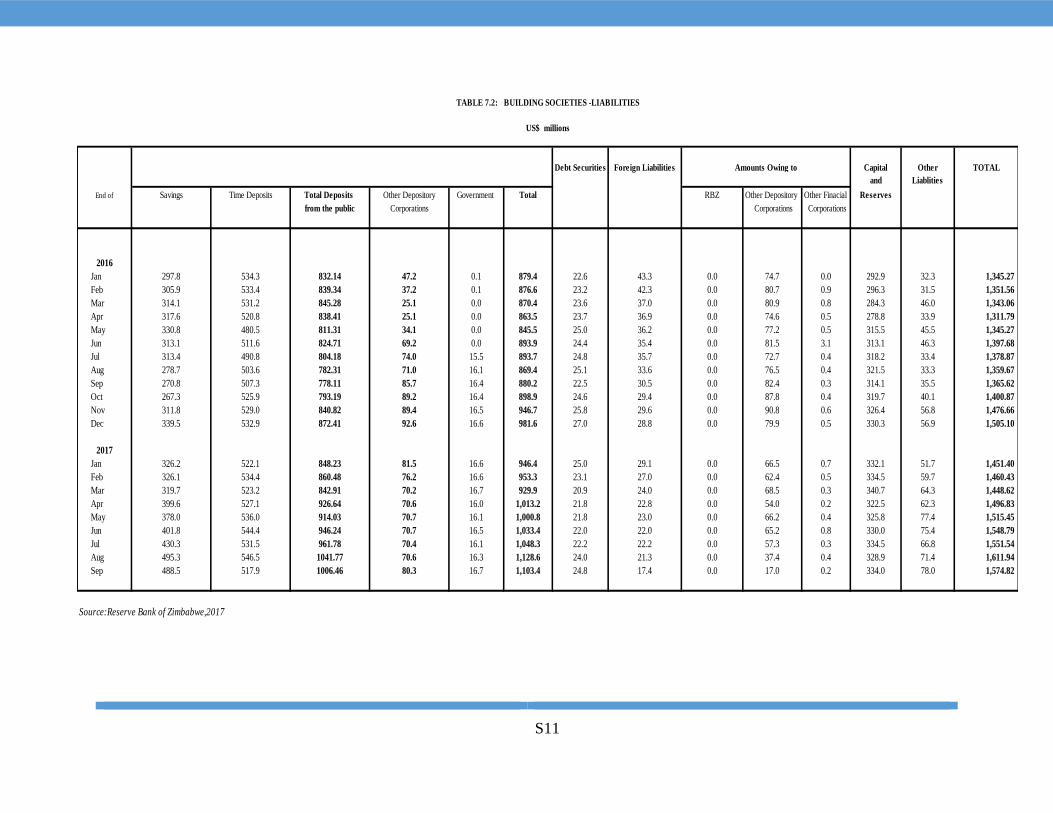
S11
Debt Securities Foreign Liabilities Capital Other TOTAL
and Liablities
End of Savings Time Deposits Total Deposits Other Depository Government Total RBZ Other Depository Other Finacial Reserves
from the public Corporations Corporations Corporations
2016
Jan 297.8 534.3 832.14 47.2 0.1 879.4 22.6 43.3 0.0 74.7 0.0 292.9 32.3 1,345.27
Feb 305.9 533.4 839.34 37.2 0.1 876.6 23.2 42.3 0.0 80.7 0.9 296.3 31.5 1,351.56
Mar 314.1 531.2 845.28 25.1 0.0 870.4 23.6 37.0 0.0 80.9 0.8 284.3 46.0 1,343.06
Apr 317.6 520.8 838.41 25.1 0.0 863.5 23.7 36.9 0.0 74.6 0.5 278.8 33.9 1,311.79
May 330.8 480.5 811.31 34.1 0.0 845.5 25.0 36.2 0.0 77.2 0.5 315.5 45.5 1,345.27
Jun 313.1 511.6 824.71 69.2 0.0 893.9 24.4 35.4 0.0 81.5 3.1 313.1 46.3 1,397.68
Jul 313.4 490.8 804.18 74.0 15.5 893.7 24.8 35.7 0.0 72.7 0.4 318.2 33.4 1,378.87
Aug 278.7 503.6 782.31 71.0 16.1 869.4 25.1 33.6 0.0 76.5 0.4 321.5 33.3 1,359.67
Sep 270.8 507.3 778.11 85.7 16.4 880.2 22.5 30.5 0.0 82.4 0.3 314.1 35.5 1,365.62
Oct 267.3 525.9 793.19 89.2 16.4 898.9 24.6 29.4 0.0 87.8 0.4 319.7 40.1 1,400.87
Nov 311.8 529.0 840.82 89.4 16.5 946.7 25.8 29.6 0.0 90.8 0.6 326.4 56.8 1,476.66
Dec 339.5 532.9 872.41 92.6 16.6 981.6 27.0 28.8 0.0 79.9 0.5 330.3 56.9 1,505.10
2017
Jan 326.2 522.1 848.23 81.5 16.6 946.4 25.0 29.1 0.0 66.5 0.7 332.1 51.7 1,451.40
Feb 326.1 534.4 860.48 76.2 16.6 953.3 23.1 27.0 0.0 62.4 0.5 334.5 59.7 1,460.43
Mar 319.7 523.2 842.91 70.2 16.7 929.9 20.9 24.0 0.0 68.5 0.3 340.7 64.3 1,448.62
Apr 399.6 527.1 926.64 70.6 16.0 1,013.2 21.8 22.8 0.0 54.0 0.2 322.5 62.3 1,496.83
May 378.0 536.0 914.03 70.7 16.1 1,000.8 21.8 23.0 0.0 66.2 0.4 325.8 77.4 1,515.45
Jun 401.8 544.4 946.24 70.7 16.5 1,033.4 22.0 22.0 0.0 65.2 0.8 330.0 75.4 1,548.79
Jul 430.3 531.5 961.78 70.4 16.1 1,048.3 22.2 22.2 0.0 57.3 0.3 334.5 66.8 1,551.54
Aug 495.3 546.5 1041.77 70.6 16.3 1,128.6 24.0 21.3 0.0 37.4 0.4 328.9 71.4 1,611.94
Sep 488.5 517.9 1006.46 80.3 16.7 1,103.4 24.8 17.4 0.0 17.0 0.2 334.0 78.0 1,574.82
Source:Reserve Bank of Zimbabwe,2017
Amounts Owing to
TABLE 7.2: BUILDING SOCIETIES -LIABILITIES
US$ millions
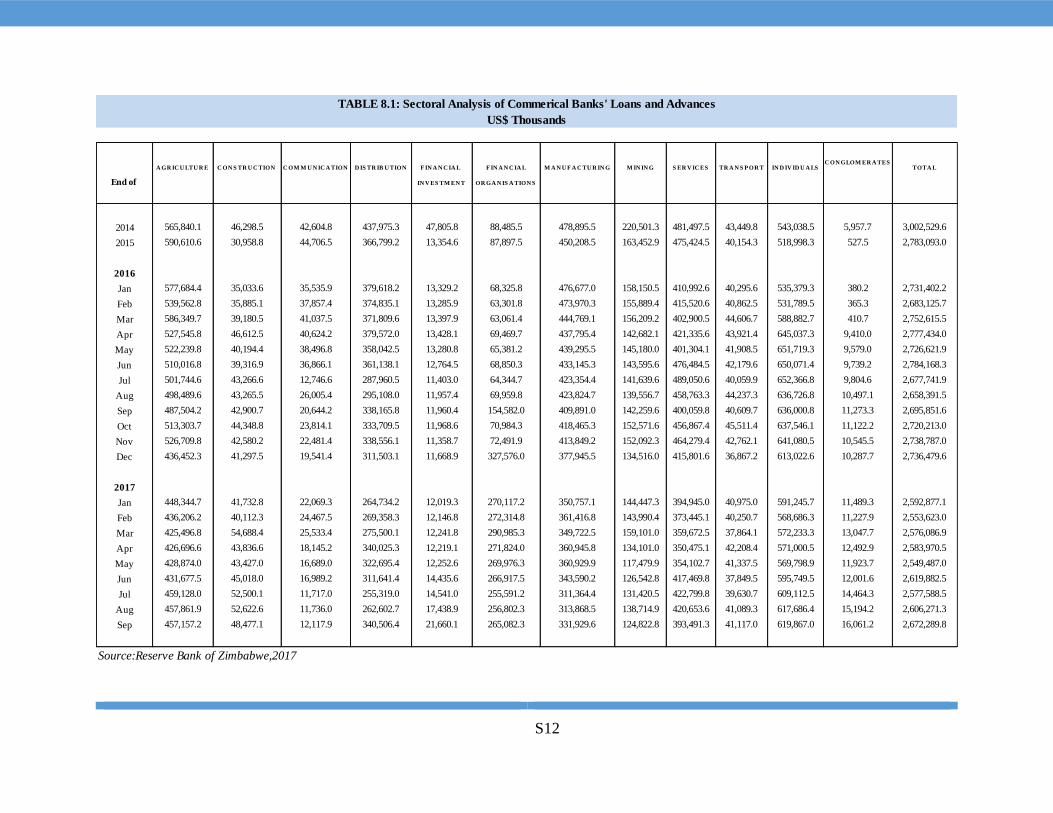
S12
A GR IC U LTU R E C ON S TR U C TION C OM M U N IC A TION D IS TR IB U TION F IN A N C IA L F IN A N C IA L M A N U F A C TU R IN G M IN IN G S ER V IC ES TR A N S P OR T IN D IV ID U A LSC ON GLOM ER A TES
TOTA L
End of IN V ES TM EN T OR GA N IS A TION S
2014 565,840.1 46,298.5 42,604.8 437,975.3 47,805.8 88,485.5 478,895.5 220,501.3 481,497.5 43,449.8 543,038.5 5,957.7 3,002,529.6
2015 590,610.6 30,958.8 44,706.5 366,799.2 13,354.6 87,897.5 450,208.5 163,452.9 475,424.5 40,154.3 518,998.3 527.5 2,783,093.0
2016
Jan 577,684.4 35,033.6 35,535.9 379,618.2 13,329.2 68,325.8 476,677.0 158,150.5 410,992.6 40,295.6 535,379.3 380.2 2,731,402.2
Feb 539,562.8 35,885.1 37,857.4 374,835.1 13,285.9 63,301.8 473,970.3 155,889.4 415,520.6 40,862.5 531,789.5 365.3 2,683,125.7
Mar 586,349.7 39,180.5 41,037.5 371,809.6 13,397.9 63,061.4 444,769.1 156,209.2 402,900.5 44,606.7 588,882.7 410.7 2,752,615.5
Apr 527,545.8 46,612.5 40,624.2 379,572.0 13,428.1 69,469.7 437,795.4 142,682.1 421,335.6 43,921.4 645,037.3 9,410.0 2,777,434.0
May 522,239.8 40,194.4 38,496.8 358,042.5 13,280.8 65,381.2 439,295.5 145,180.0 401,304.1 41,908.5 651,719.3 9,579.0 2,726,621.9
Jun 510,016.8 39,316.9 36,866.1 361,138.1 12,764.5 68,850.3 433,145.3 143,595.6 476,484.5 42,179.6 650,071.4 9,739.2 2,784,168.3
Jul 501,744.6 43,266.6 12,746.6 287,960.5 11,403.0 64,344.7 423,354.4 141,639.6 489,050.6 40,059.9 652,366.8 9,804.6 2,677,741.9
Aug 498,489.6 43,265.5 26,005.4 295,108.0 11,957.4 69,959.8 423,824.7 139,556.7 458,763.3 44,237.3 636,726.8 10,497.1 2,658,391.5
Sep 487,504.2 42,900.7 20,644.2 338,165.8 11,960.4 154,582.0 409,891.0 142,259.6 400,059.8 40,609.7 636,000.8 11,273.3 2,695,851.6
Oct 513,303.7 44,348.8 23,814.1 333,709.5 11,968.6 70,984.3 418,465.3 152,571.6 456,867.4 45,511.4 637,546.1 11,122.2 2,720,213.0
Nov 526,709.8 42,580.2 22,481.4 338,556.1 11,358.7 72,491.9 413,849.2 152,092.3 464,279.4 42,762.1 641,080.5 10,545.5 2,738,787.0
Dec 436,452.3 41,297.5 19,541.4 311,503.1 11,668.9 327,576.0 377,945.5 134,516.0 415,801.6 36,867.2 613,022.6 10,287.7 2,736,479.6
2017
Jan 448,344.7 41,732.8 22,069.3 264,734.2 12,019.3 270,117.2 350,757.1 144,447.3 394,945.0 40,975.0 591,245.7 11,489.3 2,592,877.1
Feb 436,206.2 40,112.3 24,467.5 269,358.3 12,146.8 272,314.8 361,416.8 143,990.4 373,445.1 40,250.7 568,686.3 11,227.9 2,553,623.0
Mar 425,496.8 54,688.4 25,533.4 275,500.1 12,241.8 290,985.3 349,722.5 159,101.0 359,672.5 37,864.1 572,233.3 13,047.7 2,576,086.9
Apr 426,696.6 43,836.6 18,145.2 340,025.3 12,219.1 271,824.0 360,945.8 134,101.0 350,475.1 42,208.4 571,000.5 12,492.9 2,583,970.5
May 428,874.0 43,427.0 16,689.0 322,695.4 12,252.6 269,976.3 360,929.9 117,479.9 354,102.7 41,337.5 569,798.9 11,923.7 2,549,487.0
Jun 431,677.5 45,018.0 16,989.2 311,641.4 14,435.6 266,917.5 343,590.2 126,542.8 417,469.8 37,849.5 595,749.5 12,001.6 2,619,882.5
Jul 459,128.0 52,500.1 11,717.0 255,319.0 14,541.0 255,591.2 311,364.4 131,420.5 422,799.8 39,630.7 609,112.5 14,464.3 2,577,588.5
Aug 457,861.9 52,622.6 11,736.0 262,602.7 17,438.9 256,802.3 313,868.5 138,714.9 420,653.6 41,089.3 617,686.4 15,194.2 2,606,271.3
Sep 457,157.2 48,477.1 12,117.9 340,506.4 21,660.1 265,082.3 331,929.6 124,822.8 393,491.3 41,117.0 619,867.0 16,061.2 2,672,289.8
Source:Reserve Bank of Zimbabwe,2017
TABLE 8.1: Sectoral Analysis of Commerical Banks' Loans and Advances
US$ Thousands
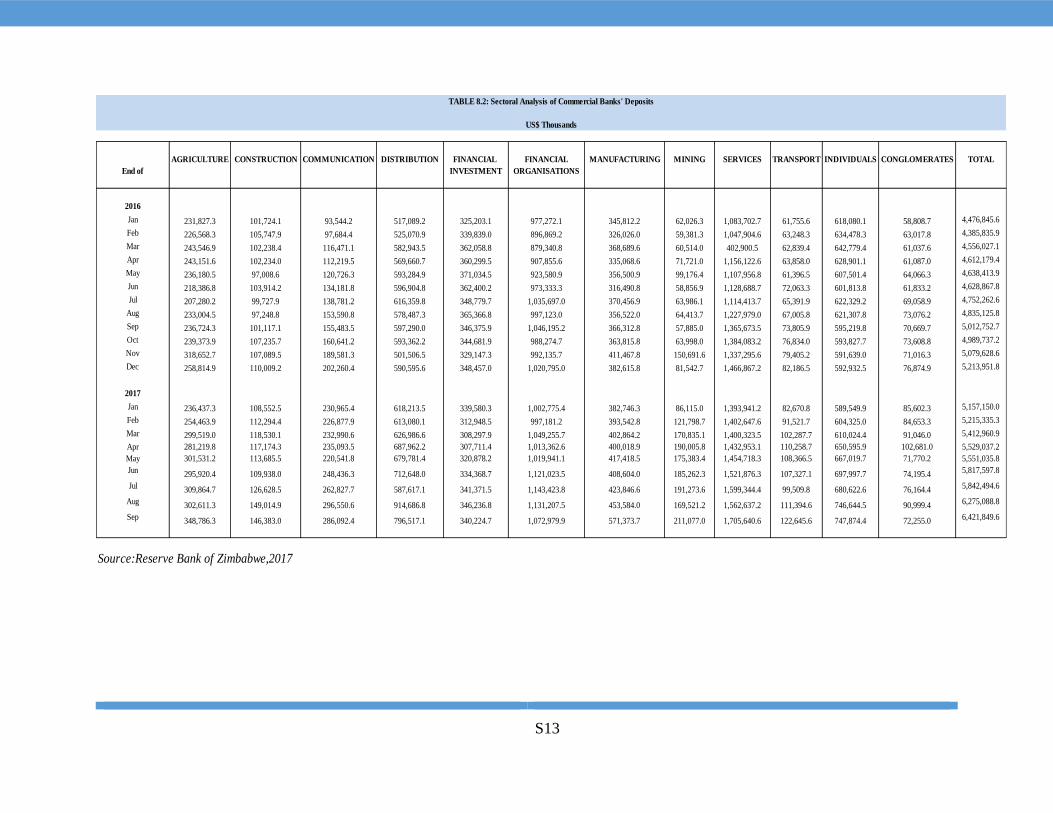
S13
AGRICULTURE CONSTRUCTION COMMUNICATION DISTRIBUTION FINANCIAL FINANCIAL MANUFACTURING MINING SERVICES TRANSPORT INDIVIDUALS CONGLOMERATES TOTAL
End of INVESTMENT ORGANISATIONS
2016
Jan 231,827.3 101,724.1 93,544.2 517,089.2 325,203.1 977,272.1 345,812.2 62,026.3 1,083,702.7 61,755.6 618,080.1 58,808.7 4,476,845.6
Feb 226,568.3 105,747.9 97,684.4 525,070.9 339,839.0 896,869.2 326,026.0 59,381.3 1,047,904.6 63,248.3 634,478.3 63,017.8 4,385,835.9
Mar 243,546.9 102,238.4 116,471.1 582,943.5 362,058.8 879,340.8 368,689.6 60,514.0 402,900.5 62,839.4 642,779.4 61,037.6 4,556,027.1
Apr 243,151.6 102,234.0 112,219.5 569,660.7 360,299.5 907,855.6 335,068.6 71,721.0 1,156,122.6 63,858.0 628,901.1 61,087.0 4,612,179.4
May 236,180.5 97,008.6 120,726.3 593,284.9 371,034.5 923,580.9 356,500.9 99,176.4 1,107,956.8 61,396.5 607,501.4 64,066.3 4,638,413.9
Jun 218,386.8 103,914.2 134,181.8 596,904.8 362,400.2 973,333.3 316,490.8 58,856.9 1,128,688.7 72,063.3 601,813.8 61,833.2 4,628,867.8
Jul 207,280.2 99,727.9 138,781.2 616,359.8 348,779.7 1,035,697.0 370,456.9 63,986.1 1,114,413.7 65,391.9 622,329.2 69,058.9 4,752,262.6
Aug 233,004.5 97,248.8 153,590.8 578,487.3 365,366.8 997,123.0 356,522.0 64,413.7 1,227,979.0 67,005.8 621,307.8 73,076.2 4,835,125.8
Sep 236,724.3 101,117.1 155,483.5 597,290.0 346,375.9 1,046,195.2 366,312.8 57,885.0 1,365,673.5 73,805.9 595,219.8 70,669.7 5,012,752.7
Oct 239,373.9 107,235.7 160,641.2 593,362.2 344,681.9 988,274.7 363,815.8 63,998.0 1,384,083.2 76,834.0 593,827.7 73,608.8 4,989,737.2
Nov 318,652.7 107,089.5 189,581.3 501,506.5 329,147.3 992,135.7 411,467.8 150,691.6 1,337,295.6 79,405.2 591,639.0 71,016.3 5,079,628.6
Dec 258,814.9 110,009.2 202,260.4 590,595.6 348,457.0 1,020,795.0 382,615.8 81,542.7 1,466,867.2 82,186.5 592,932.5 76,874.9 5,213,951.8
2017
Jan 236,437.3 108,552.5 230,965.4 618,213.5 339,580.3 1,002,775.4 382,746.3 86,115.0 1,393,941.2 82,670.8 589,549.9 85,602.3 5,157,150.0
Feb 254,463.9 112,294.4 226,877.9 613,080.1 312,948.5 997,181.2 393,542.8 121,798.7 1,402,647.6 91,521.7 604,325.0 84,653.3 5,215,335.3
Mar 299,519.0 118,530.1 232,990.6 626,986.6 308,297.9 1,049,255.7 402,864.2 170,835.1 1,400,323.5 102,287.7 610,024.4 91,046.0 5,412,960.9
Apr 281,219.8 117,174.3 235,093.5 687,962.2 307,711.4 1,013,362.6 400,018.9 190,005.8 1,432,953.1 110,258.7 650,595.9 102,681.0 5,529,037.2
May 301,531.2 113,685.5 220,541.8 679,781.4 320,878.2 1,019,941.1 417,418.5 175,383.4 1,454,718.3 108,366.5 667,019.7 71,770.2 5,551,035.8
Jun 295,920.4 109,938.0 248,436.3 712,648.0 334,368.7 1,121,023.5 408,604.0 185,262.3 1,521,876.3 107,327.1 697,997.7 74,195.4 5,817,597.8
Jul 309,864.7 126,628.5 262,827.7 587,617.1 341,371.5 1,143,423.8 423,846.6 191,273.6 1,599,344.4 99,509.8 680,622.6 76,164.4 5,842,494.6
Aug 302,611.3 149,014.9 296,550.6 914,686.8 346,236.8 1,131,207.5 453,584.0 169,521.2 1,562,637.2 111,394.6 746,644.5 90,999.4 6,275,088.8
Sep 348,786.3 146,383.0 286,092.4 796,517.1 340,224.7 1,072,979.9 571,373.7 211,077.0 1,705,640.6 122,645.6 747,874.4 72,255.0 6,421,849.6
Source:Reserve Bank of Zimbabwe,2017
TABLE 8.2: Sectoral Analysis of Commercial Banks' Deposits
US$ Thousands
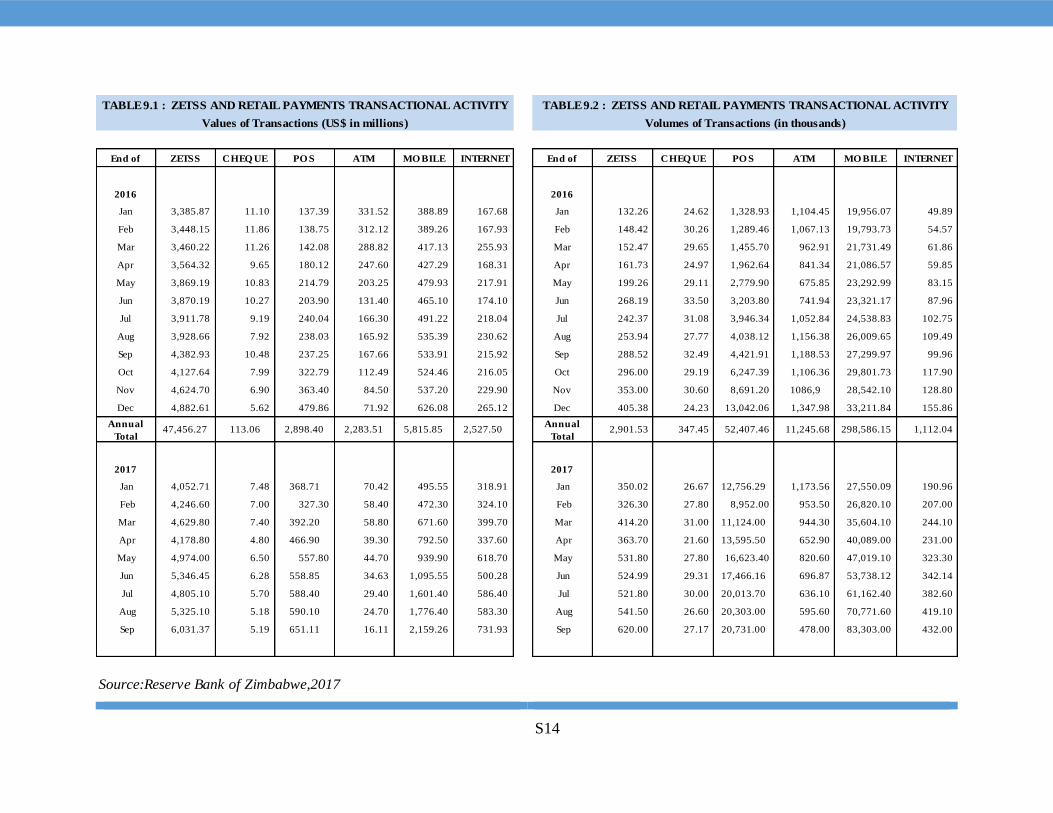
S14
End of ZETSS CHEQ UE PO S ATM MO BILE INTERNET End of ZETSS CHEQ UE PO S ATM MO BILE INTERNET
2016 2016
Jan 3,385.87 11.10 137.39 331.52 388.89 167.68 Jan 132.26 24.62 1,328.93 1,104.45 19,956.07 49.89
Feb 3,448.15 11.86 138.75 312.12 389.26 167.93 Feb 148.42 30.26 1,289.46 1,067.13 19,793.73 54.57
Mar 3,460.22 11.26 142.08 288.82 417.13 255.93 Mar 152.47 29.65 1,455.70 962.91 21,731.49 61.86
Apr 3,564.32 9.65 180.12 247.60 427.29 168.31 Apr 161.73 24.97 1,962.64 841.34 21,086.57 59.85
May 3,869.19 10.83 214.79 203.25 479.93 217.91 May 199.26 29.11 2,779.90 675.85 23,292.99 83.15
Jun 3,870.19 10.27 203.90 131.40 465.10 174.10 Jun 268.19 33.50 3,203.80 741.94 23,321.17 87.96
Jul 3,911.78 9.19 240.04 166.30 491.22 218.04 Jul 242.37 31.08 3,946.34 1,052.84 24,538.83 102.75
Aug 3,928.66 7.92 238.03 165.92 535.39 230.62 Aug 253.94 27.77 4,038.12 1,156.38 26,009.65 109.49
Sep 4,382.93 10.48 237.25 167.66 533.91 215.92 Sep 288.52 32.49 4,421.91 1,188.53 27,299.97 99.96
Oct 4,127.64 7.99 322.79 112.49 524.46 216.05 Oct 296.00 29.19 6,247.39 1,106.36 29,801.73 117.90
Nov 4,624.70 6.90 363.40 84.50 537.20 229.90 Nov 353.00 30.60 8,691.20 1086,9 28,542.10 128.80
Dec 4,882.61 5.62 479.86 71.92 626.08 265.12 Dec 405.38 24.23 13,042.06 1,347.98 33,211.84 155.86
Annual
Total47,456.27 113.06 2,898.40 2,283.51 5,815.85 2,527.50
Annual
Total 2,901.53 347.45 52,407.46 11,245.68 298,586.15 1,112.04
2017 2017
Jan 4,052.71 7.48 368.71 70.42 495.55 318.91 Jan 350.02 26.67 12,756.29 1,173.56 27,550.09 190.96
Feb 4,246.60 7.00 327.30 58.40 472.30 324.10 Feb 326.30 27.80 8,952.00 953.50 26,820.10 207.00
Mar 4,629.80 7.40 392.20 58.80 671.60 399.70 Mar 414.20 31.00 11,124.00 944.30 35,604.10 244.10
Apr 4,178.80 4.80 466.90 39.30 792.50 337.60 Apr 363.70 21.60 13,595.50 652.90 40,089.00 231.00
May 4,974.00 6.50 557.80 44.70 939.90 618.70 May 531.80 27.80 16,623.40 820.60 47,019.10 323.30
Jun 5,346.45 6.28 558.85 34.63 1,095.55 500.28 Jun 524.99 29.31 17,466.16 696.87 53,738.12 342.14
Jul 4,805.10 5.70 588.40 29.40 1,601.40 586.40 Jul 521.80 30.00 20,013.70 636.10 61,162.40 382.60
Aug 5,325.10 5.18 590.10 24.70 1,776.40 583.30 Aug 541.50 26.60 20,303.00 595.60 70,771.60 419.10
Sep 6,031.37 5.19 651.11 16.11 2,159.26 731.93 Sep 620.00 27.17 20,731.00 478.00 83,303.00 432.00
Source:Reserve Bank of Zimbabwe,2017
TABLE 9.1 : ZETSS AND RETAIL PAYMENTS TRANSACTIONAL ACTIVITY
Values of Transactions (US$ in millions)
TABLE 9.2 : ZETSS AND RETAIL PAYMENTS TRANSACTIONAL ACTIVITY
Volumes of Transactions (in thousands)
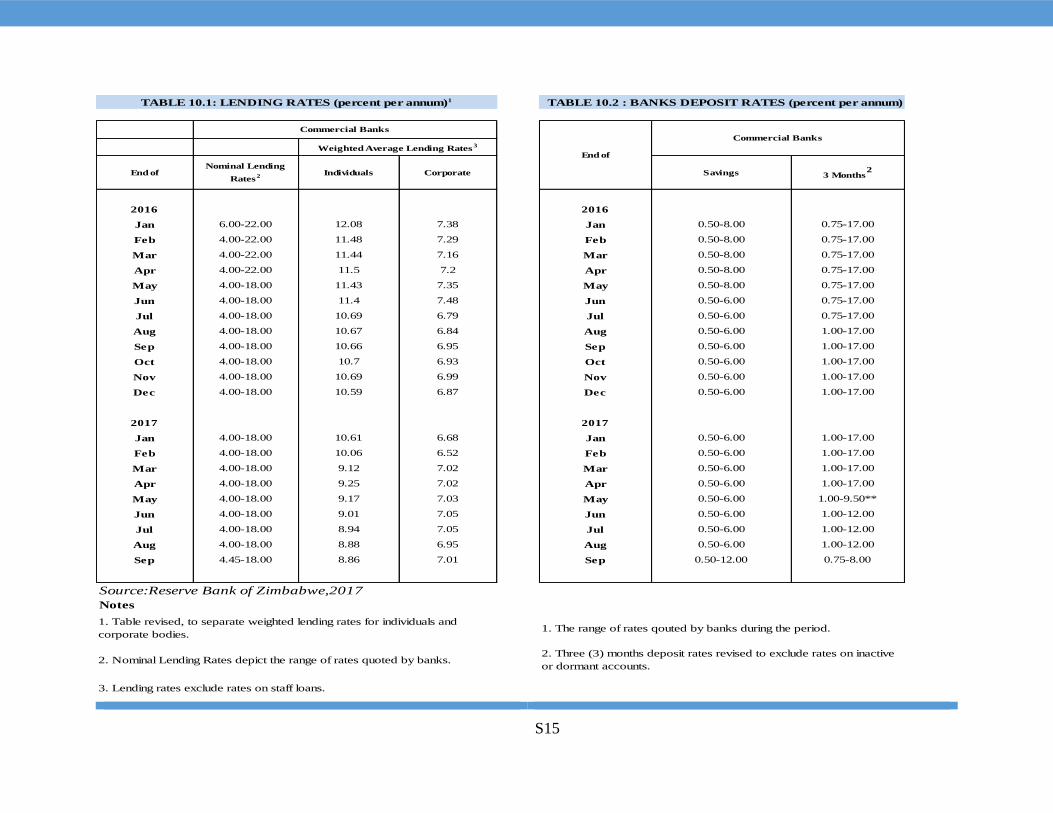
S15
End ofNominal Lending
Rates2 Individuals Corporate Savings 3 Months
2
2016 2016
Jan 6.00-22.00 12.08 7.38 Jan 0.50-8.00 0.75-17.00
Feb 4.00-22.00 11.48 7.29 Feb 0.50-8.00 0.75-17.00
Mar 4.00-22.00 11.44 7.16 Mar 0.50-8.00 0.75-17.00
Apr 4.00-22.00 11.5 7.2 Apr 0.50-8.00 0.75-17.00
May 4.00-18.00 11.43 7.35 May 0.50-8.00 0.75-17.00
Jun 4.00-18.00 11.4 7.48 Jun 0.50-6.00 0.75-17.00
Jul 4.00-18.00 10.69 6.79 Jul 0.50-6.00 0.75-17.00
Aug 4.00-18.00 10.67 6.84 Aug 0.50-6.00 1.00-17.00
Sep 4.00-18.00 10.66 6.95 Sep 0.50-6.00 1.00-17.00
Oct 4.00-18.00 10.7 6.93 Oct 0.50-6.00 1.00-17.00
Nov 4.00-18.00 10.69 6.99 Nov 0.50-6.00 1.00-17.00
Dec 4.00-18.00 10.59 6.87 Dec 0.50-6.00 1.00-17.00
2017 2017
Jan 4.00-18.00 10.61 6.68 Jan 0.50-6.00 1.00-17.00
Feb 4.00-18.00 10.06 6.52 Feb 0.50-6.00 1.00-17.00
Mar 4.00-18.00 9.12 7.02 Mar 0.50-6.00 1.00-17.00
Apr 4.00-18.00 9.25 7.02 Apr 0.50-6.00 1.00-17.00
May 4.00-18.00 9.17 7.03 May 0.50-6.00 1.00-9.50**
Jun 4.00-18.00 9.01 7.05 Jun 0.50-6.00 1.00-12.00
Jul 4.00-18.00 8.94 7.05 Jul 0.50-6.00 1.00-12.00
Aug 4.00-18.00 8.88 6.95 Aug 0.50-6.00 1.00-12.00
Sep 4.45-18.00 8.86 7.01 Sep 0.50-12.00 0.75-8.00
Source:Reserve Bank of Zimbabwe,2017
Notes
3. Lending rates exclude rates on staff loans.
TABLE 10.2 : BANKS DEPOSIT RATES (percent per annum)1
1. The range of rates qouted by banks during the period.
2. Three (3) months deposit rates revised to exclude rates on inactive
or dormant accounts.
TABLE 10.1: LENDING RATES (percent per annum)1
1. Table revised, to separate weighted lending rates for individuals and
corporate bodies.
2. Nominal Lending Rates depict the range of rates quoted by banks.
Weighted Average Lending Rates3
Commercial BanksCommercial Banks
End of
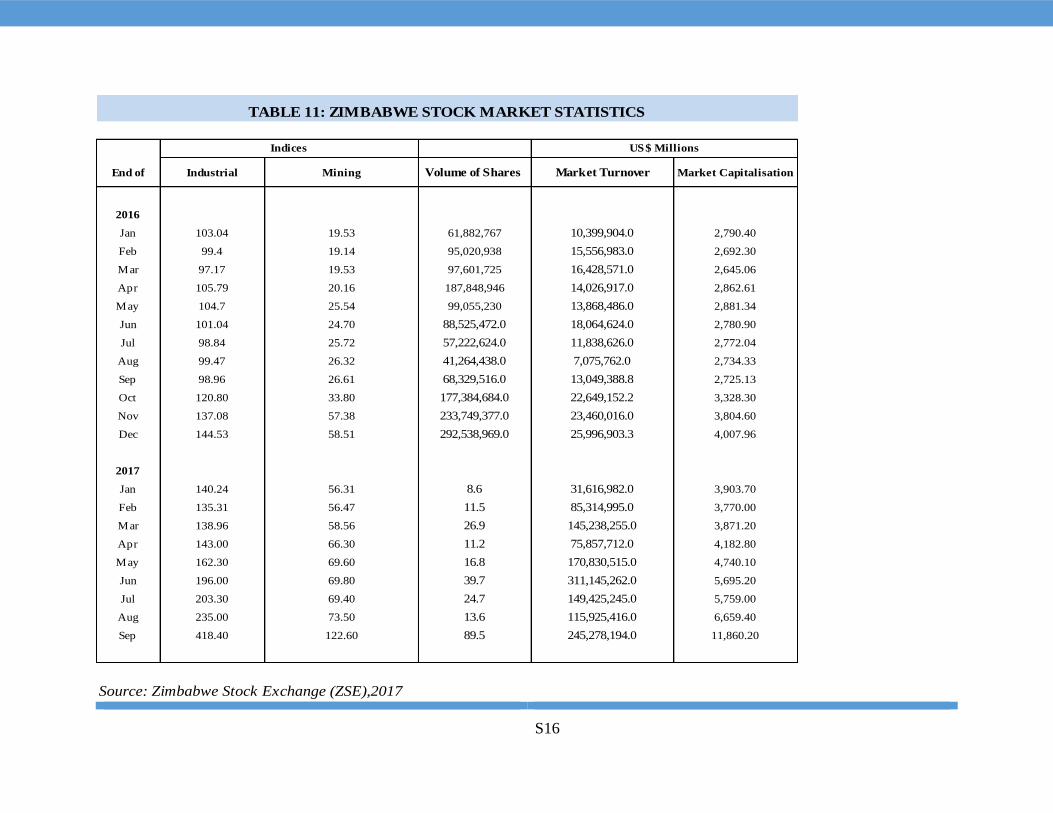
S16
End of Industrial Mining Volume of Shares Market Turnover Market Capitalisation
2016
Jan 103.04 19.53 61,882,767 10,399,904.0 2,790.40
Feb 99.4 19.14 95,020,938 15,556,983.0 2,692.30
Mar 97.17 19.53 97,601,725 16,428,571.0 2,645.06
Apr 105.79 20.16 187,848,946 14,026,917.0 2,862.61
May 104.7 25.54 99,055,230 13,868,486.0 2,881.34
Jun 101.04 24.70 88,525,472.0 18,064,624.0 2,780.90
Jul 98.84 25.72 57,222,624.0 11,838,626.0 2,772.04
Aug 99.47 26.32 41,264,438.0 7,075,762.0 2,734.33
Sep 98.96 26.61 68,329,516.0 13,049,388.8 2,725.13
Oct 120.80 33.80 177,384,684.0 22,649,152.2 3,328.30
Nov 137.08 57.38 233,749,377.0 23,460,016.0 3,804.60
Dec 144.53 58.51 292,538,969.0 25,996,903.3 4,007.96
2017
Jan 140.24 56.31 8.6 31,616,982.0 3,903.70
Feb 135.31 56.47 11.5 85,314,995.0 3,770.00
Mar 138.96 58.56 26.9 145,238,255.0 3,871.20
Apr 143.00 66.30 11.2 75,857,712.0 4,182.80
May 162.30 69.60 16.8 170,830,515.0 4,740.10
Jun 196.00 69.80 39.7 311,145,262.0 5,695.20
Jul 203.30 69.40 24.7 149,425,245.0 5,759.00
Aug 235.00 73.50 13.6 115,925,416.0 6,659.40
Sep 418.40 122.60 89.5 245,278,194.0 11,860.20
Source: Zimbabwe Stock Exchange (ZSE),2017
Indices US$ Millions
TABLE 11: ZIMBABWE STOCK MARKET STATISTICS
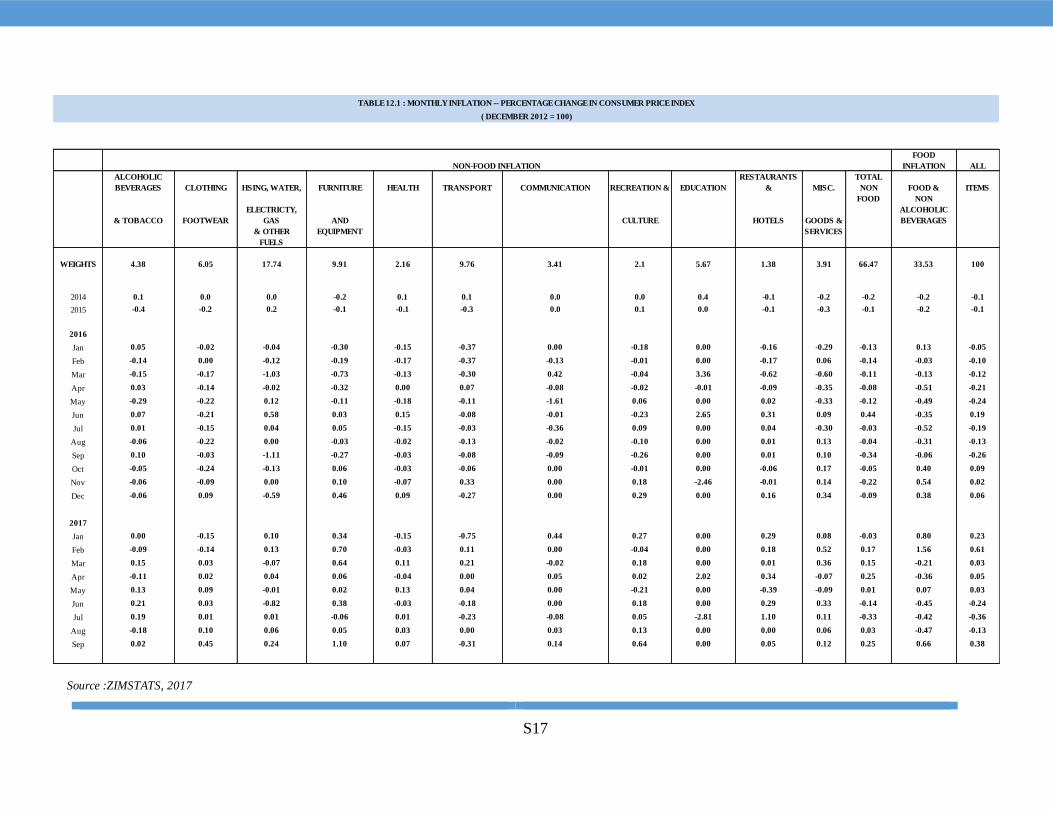
S17
FOOD
INFLATION ALL
ALCOHOLIC
BEVERAGES CLOTHING HSING, WATER, FURNITURE HEALTH TRANSPORT COMMUNICATION RECREATION & EDUCATION
RESTAURANTS
& MISC.
TOTAL
NON FOOD & ITEMS
& TOBACCO FOOTWEAR
ELECTRICTY,
GAS AND CULTURE HOTELS GOODS &
FOOD NON
ALCOHOLIC
BEVERAGES
& OTHER EQUIPMENT SERVICES
FUELS
WEIGHTS 4.38 6.05 17.74 9.91 2.16 9.76 3.41 2.1 5.67 1.38 3.91 66.47 33.53 100
2014 0.1 0.0 0.0 -0.2 0.1 0.1 0.0 0.0 0.4 -0.1 -0.2 -0.2 -0.2 -0.1
2015 -0.4 -0.2 0.2 -0.1 -0.1 -0.3 0.0 0.1 0.0 -0.1 -0.3 -0.1 -0.2 -0.1
2016
Jan 0.05 -0.02 -0.04 -0.30 -0.15 -0.37 0.00 -0.18 0.00 -0.16 -0.29 -0.13 0.13 -0.05
Feb -0.14 0.00 -0.12 -0.19 -0.17 -0.37 -0.13 -0.01 0.00 -0.17 0.06 -0.14 -0.03 -0.10
Mar -0.15 -0.17 -1.03 -0.73 -0.13 -0.30 0.42 -0.04 3.36 -0.62 -0.60 -0.11 -0.13 -0.12
Apr 0.03 -0.14 -0.02 -0.32 0.00 0.07 -0.08 -0.02 -0.01 -0.09 -0.35 -0.08 -0.51 -0.21
May -0.29 -0.22 0.12 -0.11 -0.18 -0.11 -1.61 0.06 0.00 0.02 -0.33 -0.12 -0.49 -0.24
Jun 0.07 -0.21 0.58 0.03 0.15 -0.08 -0.01 -0.23 2.65 0.31 0.09 0.44 -0.35 0.19
Jul 0.01 -0.15 0.04 0.05 -0.15 -0.03 -0.36 0.09 0.00 0.04 -0.30 -0.03 -0.52 -0.19
Aug -0.06 -0.22 0.00 -0.03 -0.02 -0.13 -0.02 -0.10 0.00 0.01 0.13 -0.04 -0.31 -0.13
Sep 0.10 -0.03 -1.11 -0.27 -0.03 -0.08 -0.09 -0.26 0.00 0.01 0.10 -0.34 -0.06 -0.26
Oct -0.05 -0.24 -0.13 0.06 -0.03 -0.06 0.00 -0.01 0.00 -0.06 0.17 -0.05 0.40 0.09
Nov -0.06 -0.09 0.00 0.10 -0.07 0.33 0.00 0.18 -2.46 -0.01 0.14 -0.22 0.54 0.02
Dec -0.06 0.09 -0.59 0.46 0.09 -0.27 0.00 0.29 0.00 0.16 0.34 -0.09 0.38 0.06
2017
Jan 0.00 -0.15 0.10 0.34 -0.15 -0.75 0.44 0.27 0.00 0.29 0.08 -0.03 0.80 0.23
Feb -0.09 -0.14 0.13 0.70 -0.03 0.11 0.00 -0.04 0.00 0.18 0.52 0.17 1.56 0.61
Mar 0.15 0.03 -0.07 0.64 0.11 0.21 -0.02 0.18 0.00 0.01 0.36 0.15 -0.21 0.03
Apr -0.11 0.02 0.04 0.06 -0.04 0.00 0.05 0.02 2.02 0.34 -0.07 0.25 -0.36 0.05
May 0.13 0.09 -0.01 0.02 0.13 0.04 0.00 -0.21 0.00 -0.39 -0.09 0.01 0.07 0.03
Jun 0.21 0.03 -0.82 0.38 -0.03 -0.18 0.00 0.18 0.00 0.29 0.33 -0.14 -0.45 -0.24
Jul 0.19 0.01 0.01 -0.06 0.01 -0.23 -0.08 0.05 -2.81 1.10 0.11 -0.33 -0.42 -0.36
Aug -0.18 0.10 0.06 0.05 0.03 0.00 0.03 0.13 0.00 0.00 0.06 0.03 -0.47 -0.13
Sep 0.02 0.45 0.24 1.10 0.07 -0.31 0.14 0.64 0.00 0.05 0.12 0.25 0.66 0.38
Source :ZIMSTATS, 2017
NON-FOOD INFLATION
TABLE 12.1 : MONTHLY INFLATION -- PERCENTAGE CHANGE IN CONSUMER PRICE INDEX
( DECEMBER 2012 = 100)
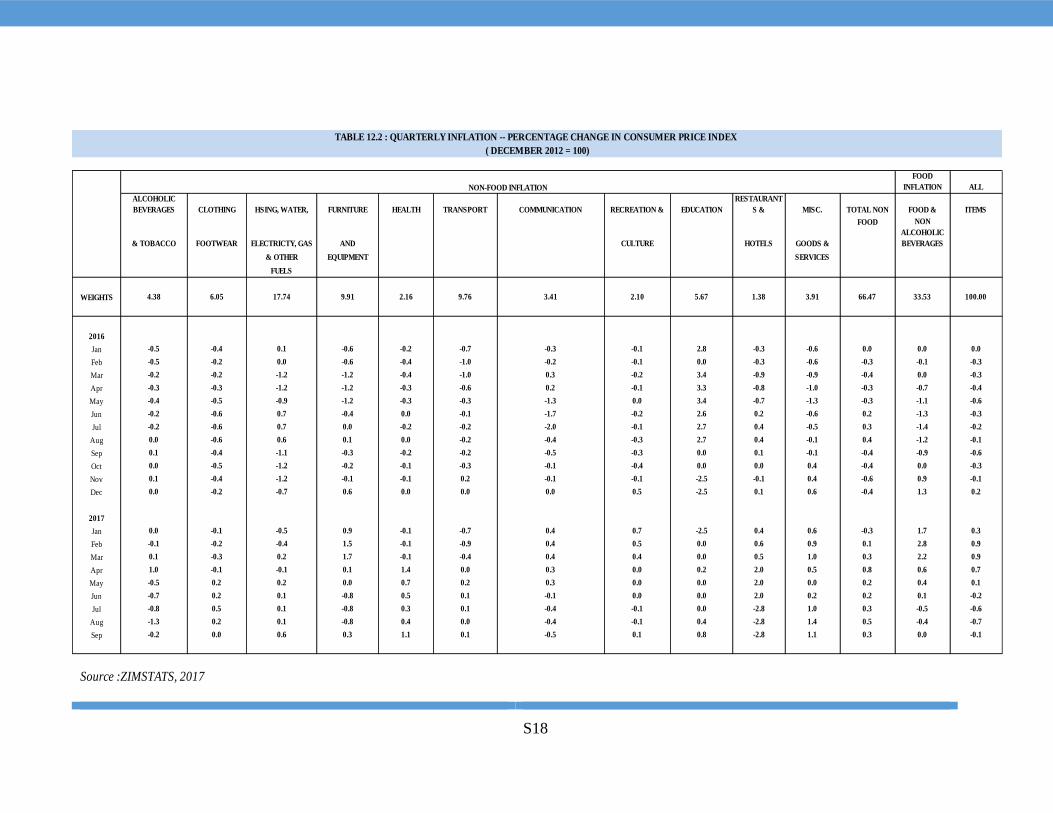
S18
FOOD
INFLATION ALL
ALCOHOLIC
BEVERAGES CLOTHING HSING, WATER, FURNITURE HEALTH TRANSPORT COMMUNICATION RECREATION & EDUCATION
RESTAURANT
S & MISC. TOTAL NON FOOD & ITEMS
& TOBACCO FOOTWEAR ELECTRICTY, GAS AND CULTURE HOTELS GOODS &
FOOD NON
ALCOHOLIC
BEVERAGES
& OTHER EQUIPMENT SERVICES
FUELS
WEIGHTS 4.38 6.05 17.74 9.91 2.16 9.76 3.41 2.10 5.67 1.38 3.91 66.47 33.53 100.00
2016
Jan -0.5 -0.4 0.1 -0.6 -0.2 -0.7 -0.3 -0.1 2.8 -0.3 -0.6 0.0 0.0 0.0
Feb -0.5 -0.2 0.0 -0.6 -0.4 -1.0 -0.2 -0.1 0.0 -0.3 -0.6 -0.3 -0.1 -0.3
Mar -0.2 -0.2 -1.2 -1.2 -0.4 -1.0 0.3 -0.2 3.4 -0.9 -0.9 -0.4 0.0 -0.3
Apr -0.3 -0.3 -1.2 -1.2 -0.3 -0.6 0.2 -0.1 3.3 -0.8 -1.0 -0.3 -0.7 -0.4
May -0.4 -0.5 -0.9 -1.2 -0.3 -0.3 -1.3 0.0 3.4 -0.7 -1.3 -0.3 -1.1 -0.6
Jun -0.2 -0.6 0.7 -0.4 0.0 -0.1 -1.7 -0.2 2.6 0.2 -0.6 0.2 -1.3 -0.3
Jul -0.2 -0.6 0.7 0.0 -0.2 -0.2 -2.0 -0.1 2.7 0.4 -0.5 0.3 -1.4 -0.2
Aug 0.0 -0.6 0.6 0.1 0.0 -0.2 -0.4 -0.3 2.7 0.4 -0.1 0.4 -1.2 -0.1
Sep 0.1 -0.4 -1.1 -0.3 -0.2 -0.2 -0.5 -0.3 0.0 0.1 -0.1 -0.4 -0.9 -0.6
Oct 0.0 -0.5 -1.2 -0.2 -0.1 -0.3 -0.1 -0.4 0.0 0.0 0.4 -0.4 0.0 -0.3
Nov 0.1 -0.4 -1.2 -0.1 -0.1 0.2 -0.1 -0.1 -2.5 -0.1 0.4 -0.6 0.9 -0.1
Dec 0.0 -0.2 -0.7 0.6 0.0 0.0 0.0 0.5 -2.5 0.1 0.6 -0.4 1.3 0.2
2017
Jan 0.0 -0.1 -0.5 0.9 -0.1 -0.7 0.4 0.7 -2.5 0.4 0.6 -0.3 1.7 0.3
Feb -0.1 -0.2 -0.4 1.5 -0.1 -0.9 0.4 0.5 0.0 0.6 0.9 0.1 2.8 0.9
Mar 0.1 -0.3 0.2 1.7 -0.1 -0.4 0.4 0.4 0.0 0.5 1.0 0.3 2.2 0.9
Apr 1.0 -0.1 -0.1 0.1 1.4 0.0 0.3 0.0 0.2 2.0 0.5 0.8 0.6 0.7
May -0.5 0.2 0.2 0.0 0.7 0.2 0.3 0.0 0.0 2.0 0.0 0.2 0.4 0.1
Jun -0.7 0.2 0.1 -0.8 0.5 0.1 -0.1 0.0 0.0 2.0 0.2 0.2 0.1 -0.2
Jul -0.8 0.5 0.1 -0.8 0.3 0.1 -0.4 -0.1 0.0 -2.8 1.0 0.3 -0.5 -0.6
Aug -1.3 0.2 0.1 -0.8 0.4 0.0 -0.4 -0.1 0.4 -2.8 1.4 0.5 -0.4 -0.7
Sep -0.2 0.0 0.6 0.3 1.1 0.1 -0.5 0.1 0.8 -2.8 1.1 0.3 0.0 -0.1
Source :ZIMSTATS, 2017
TABLE 12.2 : QUARTERLY INFLATION -- PERCENTAGE CHANGE IN CONSUMER PRICE INDEX
( DECEMBER 2012 = 100)
NON-FOOD INFLATION
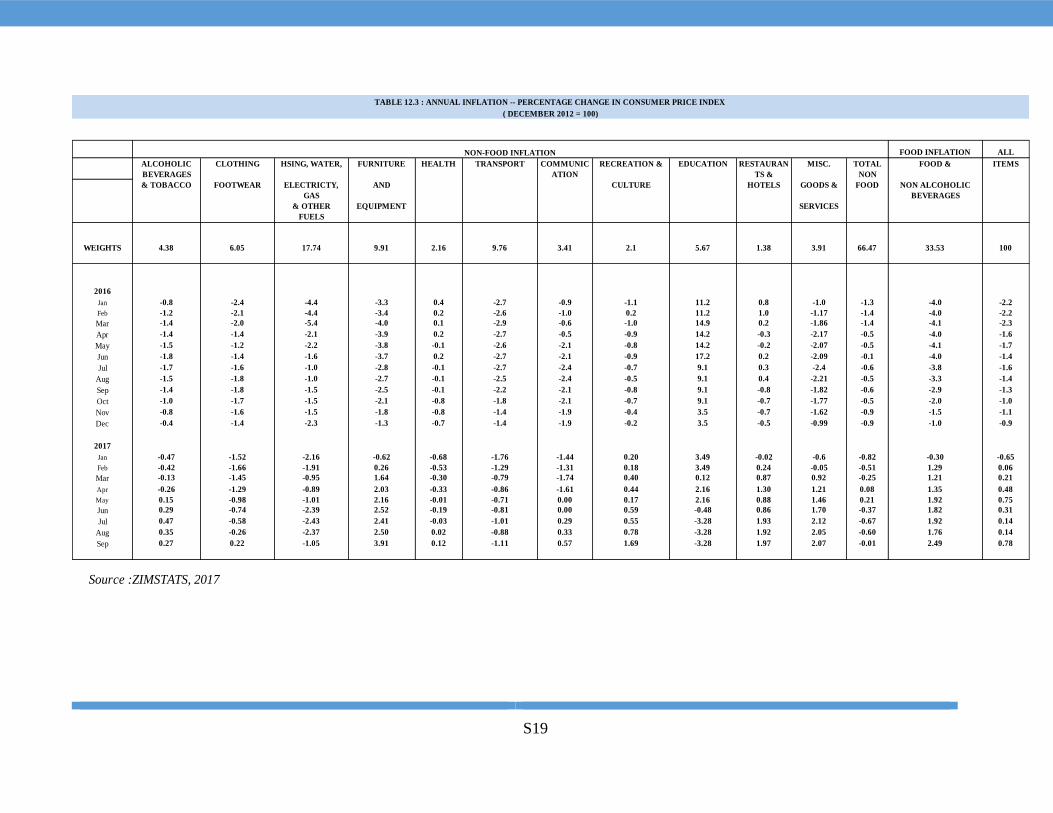
S19
FOOD INFLATION ALL
ALCOHOLIC
BEVERAGES
CLOTHING HSING, WATER, FURNITURE HEALTH TRANSPORT COMMUNIC
ATION
RECREATION & EDUCATION RESTAURAN
TS &
MISC. TOTAL
NON
FOOD & ITEMS
& TOBACCO FOOTWEAR ELECTRICTY,
GAS
AND CULTURE HOTELS GOODS & FOOD NON ALCOHOLIC
BEVERAGES
& OTHER EQUIPMENT SERVICES
FUELS
WEIGHTS 4.38 6.05 17.74 9.91 2.16 9.76 3.41 2.1 5.67 1.38 3.91 66.47 33.53 100
2016
Jan -0.8 -2.4 -4.4 -3.3 0.4 -2.7 -0.9 -1.1 11.2 0.8 -1.0 -1.3 -4.0 -2.2
Feb -1.2 -2.1 -4.4 -3.4 0.2 -2.6 -1.0 0.2 11.2 1.0 -1.17 -1.4 -4.0 -2.2
Mar -1.4 -2.0 -5.4 -4.0 0.1 -2.9 -0.6 -1.0 14.9 0.2 -1.86 -1.4 -4.1 -2.3
Apr -1.4 -1.4 -2.1 -3.9 0.2 -2.7 -0.5 -0.9 14.2 -0.3 -2.17 -0.5 -4.0 -1.6
May -1.5 -1.2 -2.2 -3.8 -0.1 -2.6 -2.1 -0.8 14.2 -0.2 -2.07 -0.5 -4.1 -1.7
Jun -1.8 -1.4 -1.6 -3.7 0.2 -2.7 -2.1 -0.9 17.2 0.2 -2.09 -0.1 -4.0 -1.4
Jul -1.7 -1.6 -1.0 -2.8 -0.1 -2.7 -2.4 -0.7 9.1 0.3 -2.4 -0.6 -3.8 -1.6
Aug -1.5 -1.8 -1.0 -2.7 -0.1 -2.5 -2.4 -0.5 9.1 0.4 -2.21 -0.5 -3.3 -1.4
Sep -1.4 -1.8 -1.5 -2.5 -0.1 -2.2 -2.1 -0.8 9.1 -0.8 -1.82 -0.6 -2.9 -1.3
Oct -1.0 -1.7 -1.5 -2.1 -0.8 -1.8 -2.1 -0.7 9.1 -0.7 -1.77 -0.5 -2.0 -1.0
Nov -0.8 -1.6 -1.5 -1.8 -0.8 -1.4 -1.9 -0.4 3.5 -0.7 -1.62 -0.9 -1.5 -1.1
Dec -0.4 -1.4 -2.3 -1.3 -0.7 -1.4 -1.9 -0.2 3.5 -0.5 -0.99 -0.9 -1.0 -0.9
2017
Jan -0.47 -1.52 -2.16 -0.62 -0.68 -1.76 -1.44 0.20 3.49 -0.02 -0.6 -0.82 -0.30 -0.65
Feb -0.42 -1.66 -1.91 0.26 -0.53 -1.29 -1.31 0.18 3.49 0.24 -0.05 -0.51 1.29 0.06
Mar -0.13 -1.45 -0.95 1.64 -0.30 -0.79 -1.74 0.40 0.12 0.87 0.92 -0.25 1.21 0.21
Apr -0.26 -1.29 -0.89 2.03 -0.33 -0.86 -1.61 0.44 2.16 1.30 1.21 0.08 1.35 0.48
May 0.15 -0.98 -1.01 2.16 -0.01 -0.71 0.00 0.17 2.16 0.88 1.46 0.21 1.92 0.75
Jun 0.29 -0.74 -2.39 2.52 -0.19 -0.81 0.00 0.59 -0.48 0.86 1.70 -0.37 1.82 0.31
Jul 0.47 -0.58 -2.43 2.41 -0.03 -1.01 0.29 0.55 -3.28 1.93 2.12 -0.67 1.92 0.14
Aug 0.35 -0.26 -2.37 2.50 0.02 -0.88 0.33 0.78 -3.28 1.92 2.05 -0.60 1.76 0.14
Sep 0.27 0.22 -1.05 3.91 0.12 -1.11 0.57 1.69 -3.28 1.97 2.07 -0.01 2.49 0.78
Source :ZIMSTATS, 2017
TABLE 12.3 : ANNUAL INFLATION -- PERCENTAGE CHANGE IN CONSUMER PRICE INDEX
( DECEMBER 2012 = 100)
NON-FOOD INFLATION

S20
End of Sep-16 Oct-16 Nov-16 Dec-16 Jan-17 Feb-17 Mar-17 Apr-17 May-17 Jun-17 Jul-17 Aug-17 Sep-17
Merchandise Imports (excl. energy) 226.9 218.8 236.7 180.5 207.4 190.8 213.6 225.3 298.7 259.7 198.6 182.3 202.8
- Consumption Goods 121.5 110.9 125.4 92.7 94.2 78.5 99.1 98.9 128.7 84.7 65.3 65.8 80.7
- Capital Goods 48.6 46.6 57.6 33.9 55.3 54.3 55.5 52.4 73.1 80.7 64.6 61.5 63.6
- Intermediate Goods 56.8 61.3 53.8 53.8 57.9 58.0 59.0 74.0 96.8 94.3 68.8 55.0 58.5
Energy (Fuel & Electricity) 56.7 64.3 90.9 65.1 63.8 58.4 51.4 52.2 75.0 77.8 55.7 72.5 61.6
Service Payments 76.5 74.9 81.2 99.8 74.7 66.6 81.9 69.4 78.2 58.4 58.3 63.6 63.0
- Technical, Professional & consult 37.8 33.1 36.7 40.8 29.0 17.2 36.5 24.8 36.5 20.7 26.1 21.8 17.7
- Software 3.0 3.4 3.4 2.6 4.6 3.9 4.9 4.4 6.3 5.6 2.8 2.1 2.1
- Other (tourism, edu, freight etc) 35.6 38.4 41.1 56.4 41.0 45.4 40.5 40.2 35.4 32.1 29.4 39.6 43.2
Income Payments (Profits, Dividends) 7.9 15.5 10.6 8.2 14.0 6.8 12.0 12.2 17.8 19.4 23.5 7.0 10.9
Capital Remittances (outward) 50.1 58.8 26.4 23.9 24.0 33.2 41.7 44.1 64.0 34.8 21.8 55.1 21.8
- External Loan Repayments 43.1 52.2 20.8 23.3 22.8 32.4 29.9 41.4 61.0 33.3 18.6 54.3 18.8
- Disinvestments 6.2 6.6 5.2 0.6 1.0 0.2 11.7 2.7 2.9 1.3 3.1 0.7 0.6
- Cross Border Investment 0.7 0.1 0.5 0.1 0.1 0.6 0.1 0.0 0.1 0.2 0.0 0.2 2.4
Other Payments 2.2 0.3 0.2 0.1 0.3 0.1 0.3 2.0 0.2 0.3 0.0 0.1 0.1
TOTAL 420.3 432.7 446.1 377.6 384.1 355.9 400.9 405.1 533.9 450.3 358.0 380.6 360.2
Source: Reserve Bank of Zimbabwe, 2017
Table 13.1: Monthly Cross Border Payments (US$ Millions)
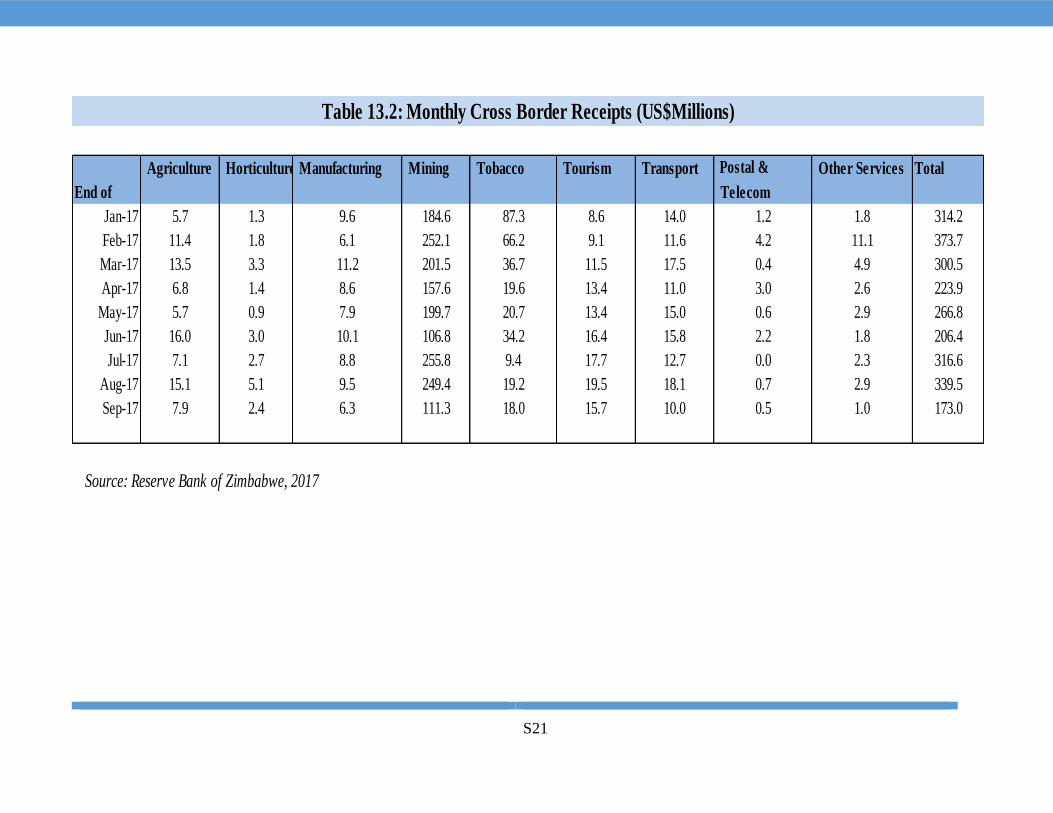
S21
Agriculture Horticulture Manufacturing Mining Tobacco Tourism Transport Postal & Other Services Total
End of Telecom
Jan-17 5.7 1.3 9.6 184.6 87.3 8.6 14.0 1.2 1.8 314.2
Feb-17 11.4 1.8 6.1 252.1 66.2 9.1 11.6 4.2 11.1 373.7
Mar-17 13.5 3.3 11.2 201.5 36.7 11.5 17.5 0.4 4.9 300.5
Apr-17 6.8 1.4 8.6 157.6 19.6 13.4 11.0 3.0 2.6 223.9
May-17 5.7 0.9 7.9 199.7 20.7 13.4 15.0 0.6 2.9 266.8
Jun-17 16.0 3.0 10.1 106.8 34.2 16.4 15.8 2.2 1.8 206.4
Jul-17 7.1 2.7 8.8 255.8 9.4 17.7 12.7 0.0 2.3 316.6
Aug-17 15.1 5.1 9.5 249.4 19.2 19.5 18.1 0.7 2.9 339.5
Sep-17 7.9 2.4 6.3 111.3 18.0 15.7 10.0 0.5 1.0 173.0
Source: Reserve Bank of Zimbabwe, 2017
Table 13.2: Monthly Cross Border Receipts (US$Millions)
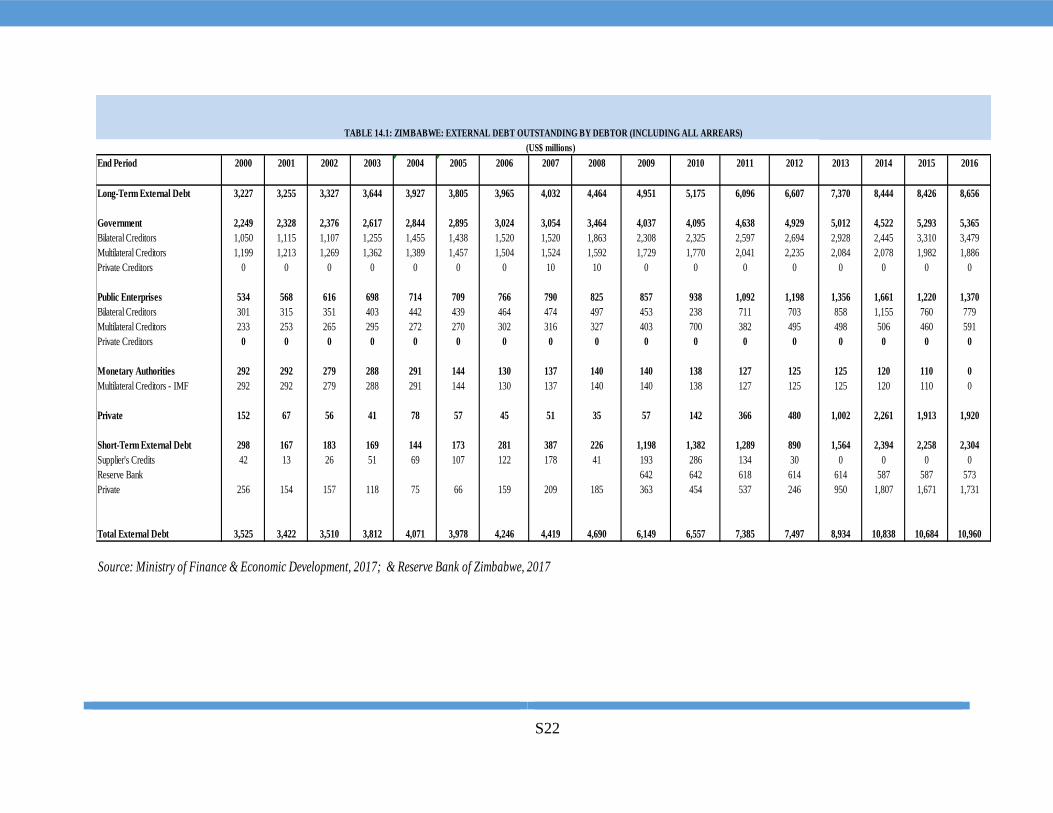
S22
(US$ millions)
End Period 2000 2001 2002 2003 2004 2005 2006 2007 2008 2009 2010 2011 2012 2013 2014 2015 2016
Long-Term External Debt 3,227 3,255 3,327 3,644 3,927 3,805 3,965 4,032 4,464 4,951 5,175 6,096 6,607 7,370 8,444 8,426 8,656
Government 2,249 2,328 2,376 2,617 2,844 2,895 3,024 3,054 3,464 4,037 4,095 4,638 4,929 5,012 4,522 5,293 5,365
Bilateral Creditors 1,050 1,115 1,107 1,255 1,455 1,438 1,520 1,520 1,863 2,308 2,325 2,597 2,694 2,928 2,445 3,310 3,479
Multilateral Creditors 1,199 1,213 1,269 1,362 1,389 1,457 1,504 1,524 1,592 1,729 1,770 2,041 2,235 2,084 2,078 1,982 1,886
Private Creditors 0 0 0 0 0 0 0 10 10 0 0 0 0 0 0 0 0
Public Enterprises 534 568 616 698 714 709 766 790 825 857 938 1,092 1,198 1,356 1,661 1,220 1,370
Bilateral Creditors 301 315 351 403 442 439 464 474 497 453 238 711 703 858 1,155 760 779
Multilateral Creditors 233 253 265 295 272 270 302 316 327 403 700 382 495 498 506 460 591
Private Creditors 0 0 0 0 0 0 0 0 0 0 0 0 0 0 0 0 0
Monetary Authorities 292 292 279 288 291 144 130 137 140 140 138 127 125 125 120 110 0
Multilateral Creditors - IMF 292 292 279 288 291 144 130 137 140 140 138 127 125 125 120 110 0
Private 152 67 56 41 78 57 45 51 35 57 142 366 480 1,002 2,261 1,913 1,920
Short-Term External Debt 298 167 183 169 144 173 281 387 226 1,198 1,382 1,289 890 1,564 2,394 2,258 2,304
Supplier's Credits 42 13 26 51 69 107 122 178 41 193 286 134 30 0 0 0 0
Reserve Bank 642 642 618 614 614 587 587 573
Private 256 154 157 118 75 66 159 209 185 363 454 537 246 950 1,807 1,671 1,731
Total External Debt 3,525 3,422 3,510 3,812 4,071 3,978 4,246 4,419 4,690 6,149 6,557 7,385 7,497 8,934 10,838 10,684 10,960
Source: Ministry of Finance & Economic Development, 2017; & Reserve Bank of Zimbabwe, 2017
TABLE 14.1: ZIMBABWE: EXTERNAL DEBT OUTSTANDING BY DEBTOR (INCLUDING ALL ARREARS)
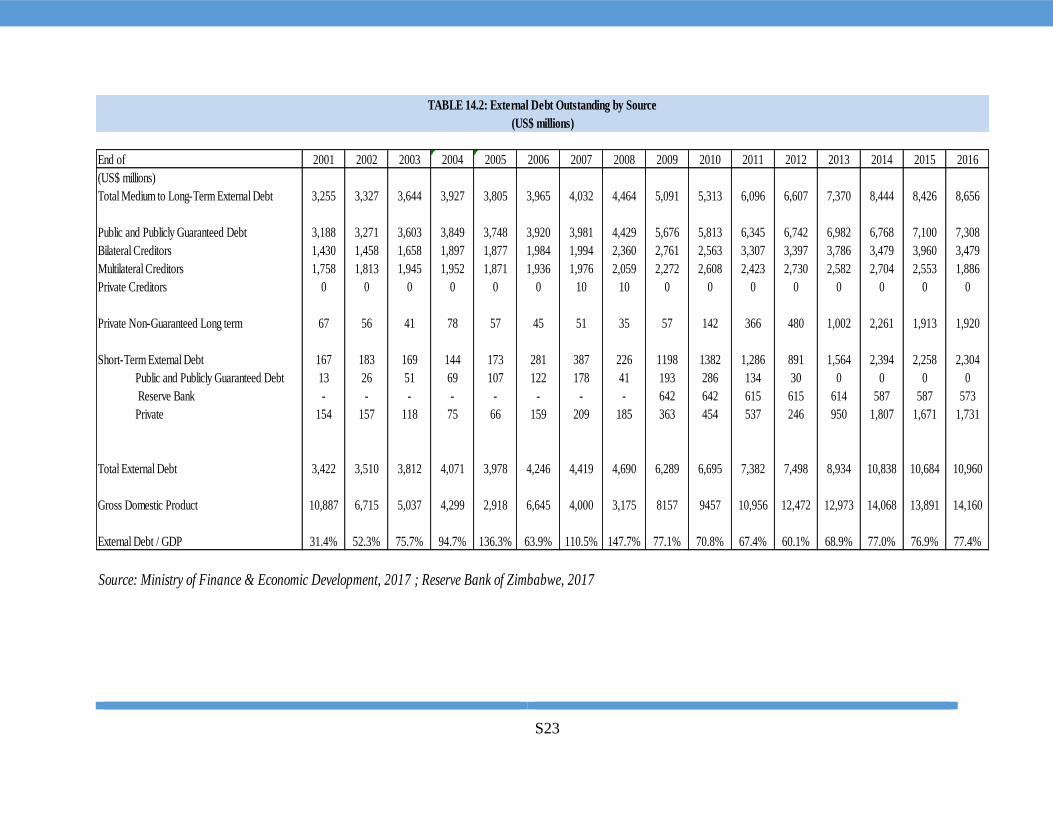
S23
End of 2001 2002 2003 2004 2005 2006 2007 2008 2009 2010 2011 2012 2013 2014 2015 2016
(US$ millions)
Total Medium to Long-Term External Debt 3,255 3,327 3,644 3,927 3,805 3,965 4,032 4,464 5,091 5,313 6,096 6,607 7,370 8,444 8,426 8,656
Public and Publicly Guaranteed Debt 3,188 3,271 3,603 3,849 3,748 3,920 3,981 4,429 5,676 5,813 6,345 6,742 6,982 6,768 7,100 7,308
Bilateral Creditors 1,430 1,458 1,658 1,897 1,877 1,984 1,994 2,360 2,761 2,563 3,307 3,397 3,786 3,479 3,960 3,479
Multilateral Creditors 1,758 1,813 1,945 1,952 1,871 1,936 1,976 2,059 2,272 2,608 2,423 2,730 2,582 2,704 2,553 1,886
Private Creditors 0 0 0 0 0 0 10 10 0 0 0 0 0 0 0 0
Private Non-Guaranteed Long term 67 56 41 78 57 45 51 35 57 142 366 480 1,002 2,261 1,913 1,920
Short-Term External Debt 167 183 169 144 173 281 387 226 1198 1382 1,286 891 1,564 2,394 2,258 2,304
Public and Publicly Guaranteed Debt 13 26 51 69 107 122 178 41 193 286 134 30 0 0 0 0
Reserve Bank - - - - - - - - 642 642 615 615 614 587 587 573
Private 154 157 118 75 66 159 209 185 363 454 537 246 950 1,807 1,671 1,731
Total External Debt 3,422 3,510 3,812 4,071 3,978 4,246 4,419 4,690 6,289 6,695 7,382 7,498 8,934 10,838 10,684 10,960
Gross Domestic Product 10,887 6,715 5,037 4,299 2,918 6,645 4,000 3,175 8157 9457 10,956 12,472 12,973 14,068 13,891 14,160
External Debt / GDP 31.4% 52.3% 75.7% 94.7% 136.3% 63.9% 110.5% 147.7% 77.1% 70.8% 67.4% 60.1% 68.9% 77.0% 76.9% 77.4%
Source: Ministry of Finance & Economic Development, 2017 ; Reserve Bank of Zimbabwe, 2017
TABLE 14.2: External Debt Outstanding by Source
(US$ millions)
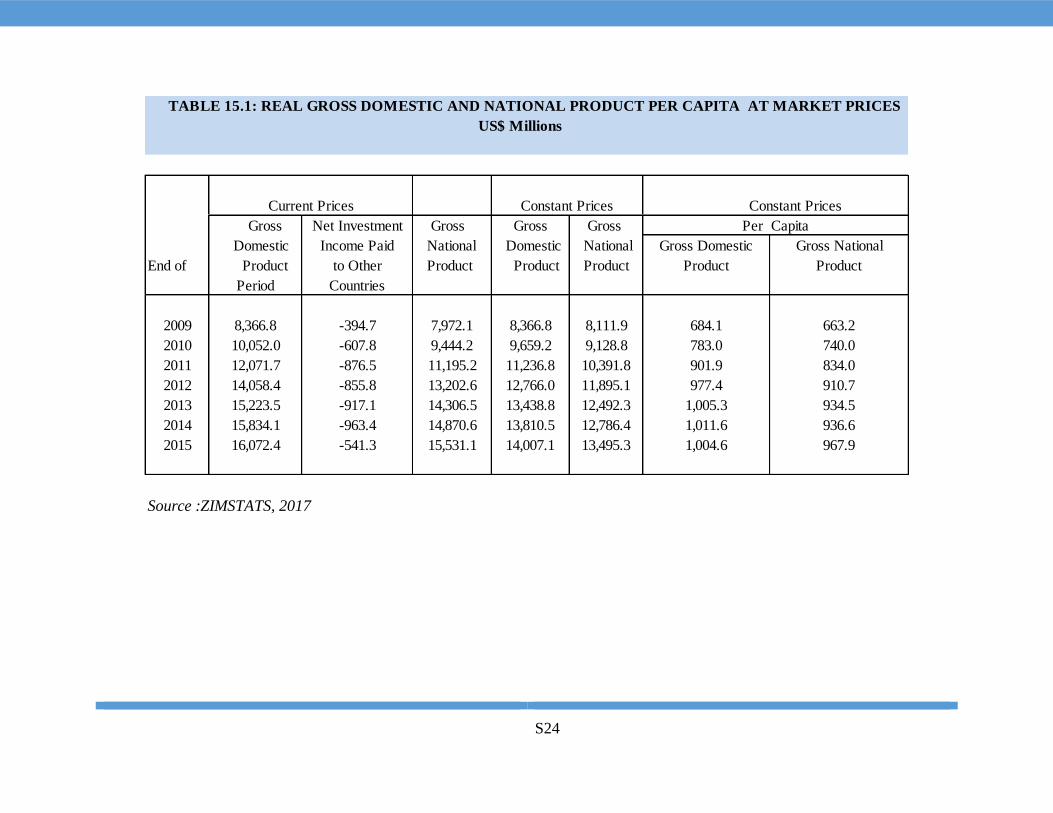
S24
US$ Millions
Gross Net Investment Gross Gross Gross
Domestic Income Paid National Domestic National Gross Domestic Gross National
End of Product to Other Product Product Product Product Product
Period Countries
2009 8,366.8 -394.7 7,972.1 8,366.8 8,111.9 684.1 663.2
2010 10,052.0 -607.8 9,444.2 9,659.2 9,128.8 783.0 740.0
2011 12,071.7 -876.5 11,195.2 11,236.8 10,391.8 901.9 834.0
2012 14,058.4 -855.8 13,202.6 12,766.0 11,895.1 977.4 910.7
2013 15,223.5 -917.1 14,306.5 13,438.8 12,492.3 1,005.3 934.5
2014 15,834.1 -963.4 14,870.6 13,810.5 12,786.4 1,011.6 936.6
2015 16,072.4 -541.3 15,531.1 14,007.1 13,495.3 1,004.6 967.9
Source :ZIMSTATS, 2017
Current Prices Constant Prices Constant Prices
Per Capita
TABLE 15.1: REAL GROSS DOMESTIC AND NATIONAL PRODUCT PER CAPITA AT MARKET PRICES
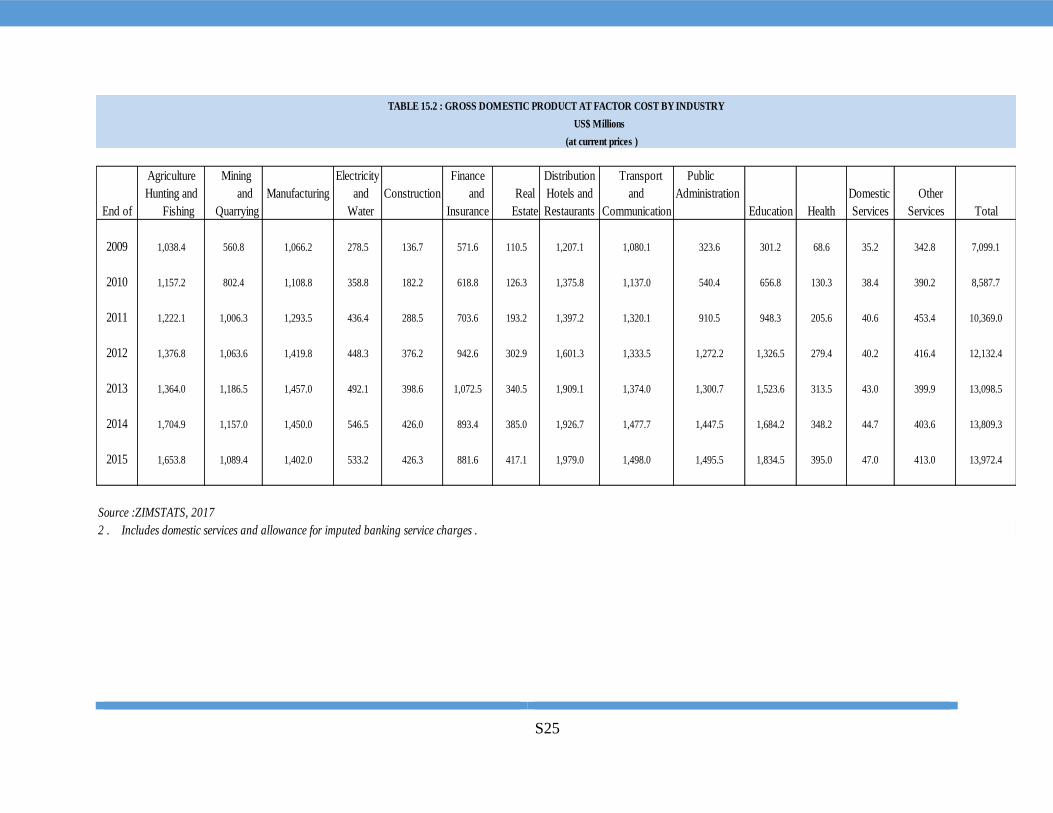
S25
Agriculture Mining Electricity Finance Distribution Transport Public
Hunting and and Manufacturing and Construction and Real Hotels and and Administration Domestic Other
End of Fishing Quarrying Water Insurance Estate Restaurants Communication Education Health Services Services Total
2009 1,038.4 560.8 1,066.2 278.5 136.7 571.6 110.5 1,207.1 1,080.1 323.6 301.2 68.6 35.2 342.8 7,099.1
2010 1,157.2 802.4 1,108.8 358.8 182.2 618.8 126.3 1,375.8 1,137.0 540.4 656.8 130.3 38.4 390.2 8,587.7
2011 1,222.1 1,006.3 1,293.5 436.4 288.5 703.6 193.2 1,397.2 1,320.1 910.5 948.3 205.6 40.6 453.4 10,369.0
2012 1,376.8 1,063.6 1,419.8 448.3 376.2 942.6 302.9 1,601.3 1,333.5 1,272.2 1,326.5 279.4 40.2 416.4 12,132.4
2013 1,364.0 1,186.5 1,457.0 492.1 398.6 1,072.5 340.5 1,909.1 1,374.0 1,300.7 1,523.6 313.5 43.0 399.9 13,098.5
2014 1,704.9 1,157.0 1,450.0 546.5 426.0 893.4 385.0 1,926.7 1,477.7 1,447.5 1,684.2 348.2 44.7 403.6 13,809.3
2015 1,653.8 1,089.4 1,402.0 533.2 426.3 881.6 417.1 1,979.0 1,498.0 1,495.5 1,834.5 395.0 47.0 413.0 13,972.4
Source :ZIMSTATS, 2017
2 . Includes domestic services and allowance for imputed banking service charges .
TABLE 15.2 : GROSS DOMESTIC PRODUCT AT FACTOR COST BY INDUSTRY
US$ Millions
(at current prices )
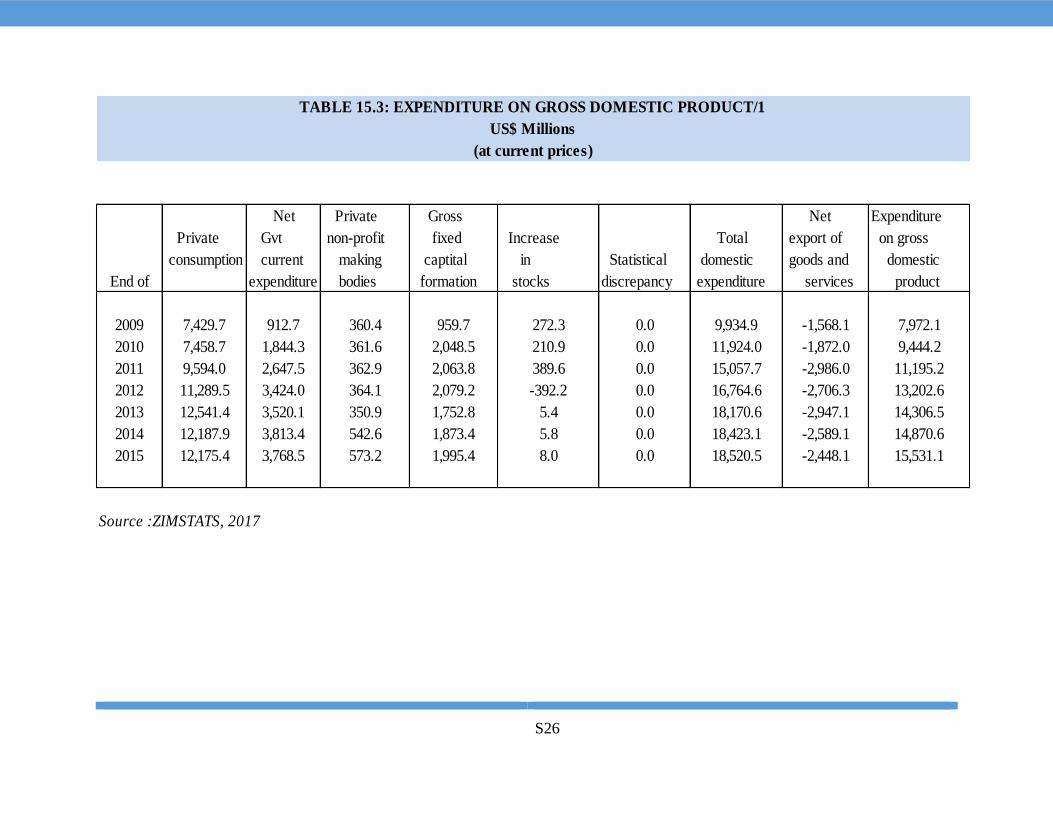
S26
Net Private Gross Net Expenditure
Private Gvt non-profit fixed Increase Total export of on gross
consumption current making captital in Statistical domestic goods and domestic
End of expenditure bodies formation stocks discrepancy expenditure services product
2009 7,429.7 912.7 360.4 959.7 272.3 0.0 9,934.9 -1,568.1 7,972.1
2010 7,458.7 1,844.3 361.6 2,048.5 210.9 0.0 11,924.0 -1,872.0 9,444.2
2011 9,594.0 2,647.5 362.9 2,063.8 389.6 0.0 15,057.7 -2,986.0 11,195.2
2012 11,289.5 3,424.0 364.1 2,079.2 -392.2 0.0 16,764.6 -2,706.3 13,202.6
2013 12,541.4 3,520.1 350.9 1,752.8 5.4 0.0 18,170.6 -2,947.1 14,306.5
2014 12,187.9 3,813.4 542.6 1,873.4 5.8 0.0 18,423.1 -2,589.1 14,870.6
2015 12,175.4 3,768.5 573.2 1,995.4 8.0 0.0 18,520.5 -2,448.1 15,531.1
Source :ZIMSTATS, 2017
(at current prices)
US$ Millions
TABLE 15.3: EXPENDITURE ON GROSS DOMESTIC PRODUCT/1
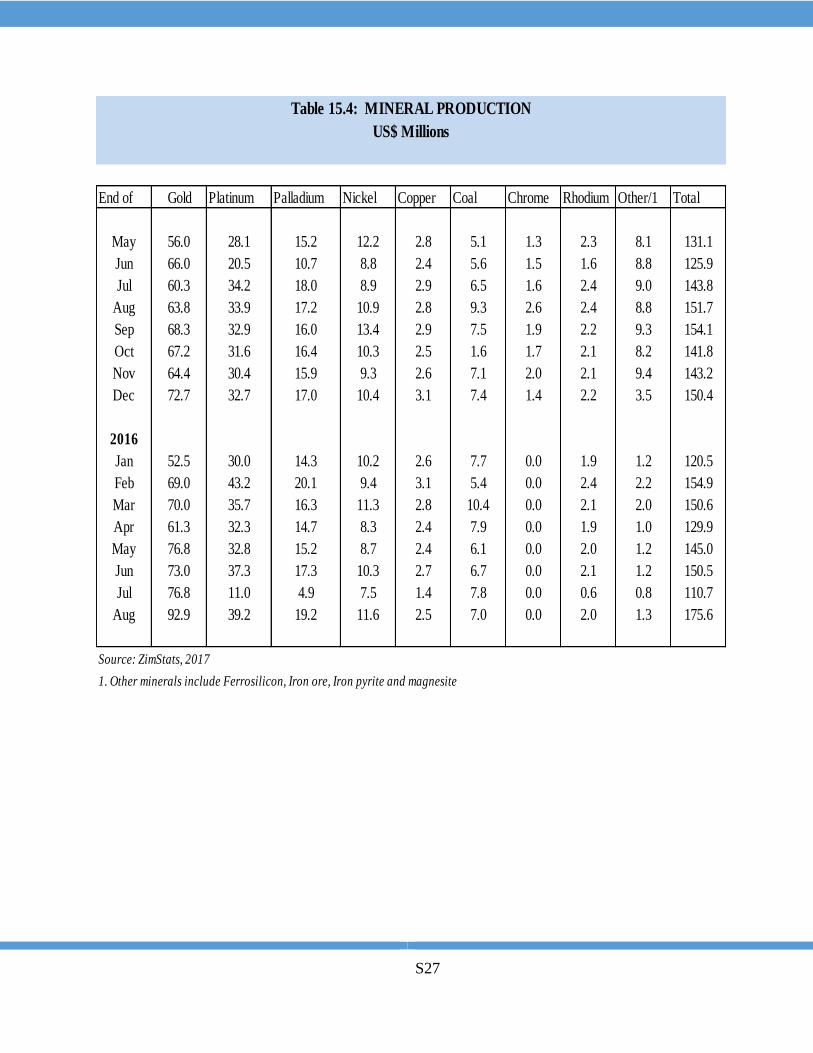
S27
End of Gold Platinum Palladium Nickel Copper Coal Chrome Rhodium Other/1 Total
May 56.0 28.1 15.2 12.2 2.8 5.1 1.3 2.3 8.1 131.1
Jun 66.0 20.5 10.7 8.8 2.4 5.6 1.5 1.6 8.8 125.9
Jul 60.3 34.2 18.0 8.9 2.9 6.5 1.6 2.4 9.0 143.8
Aug 63.8 33.9 17.2 10.9 2.8 9.3 2.6 2.4 8.8 151.7
Sep 68.3 32.9 16.0 13.4 2.9 7.5 1.9 2.2 9.3 154.1
Oct 67.2 31.6 16.4 10.3 2.5 1.6 1.7 2.1 8.2 141.8
Nov 64.4 30.4 15.9 9.3 2.6 7.1 2.0 2.1 9.4 143.2
Dec 72.7 32.7 17.0 10.4 3.1 7.4 1.4 2.2 3.5 150.4
2016
Jan 52.5 30.0 14.3 10.2 2.6 7.7 0.0 1.9 1.2 120.5
Feb 69.0 43.2 20.1 9.4 3.1 5.4 0.0 2.4 2.2 154.9
Mar 70.0 35.7 16.3 11.3 2.8 10.4 0.0 2.1 2.0 150.6
Apr 61.3 32.3 14.7 8.3 2.4 7.9 0.0 1.9 1.0 129.9
May 76.8 32.8 15.2 8.7 2.4 6.1 0.0 2.0 1.2 145.0
Jun 73.0 37.3 17.3 10.3 2.7 6.7 0.0 2.1 1.2 150.5
Jul 76.8 11.0 4.9 7.5 1.4 7.8 0.0 0.6 0.8 110.7
Aug 92.9 39.2 19.2 11.6 2.5 7.0 0.0 2.0 1.3 175.6
Source: ZimStats, 2017
1. Other minerals include Ferrosilicon, Iron ore, Iron pyrite and magnesite
Table 15.4: MINERAL PRODUCTION
US$ Millions
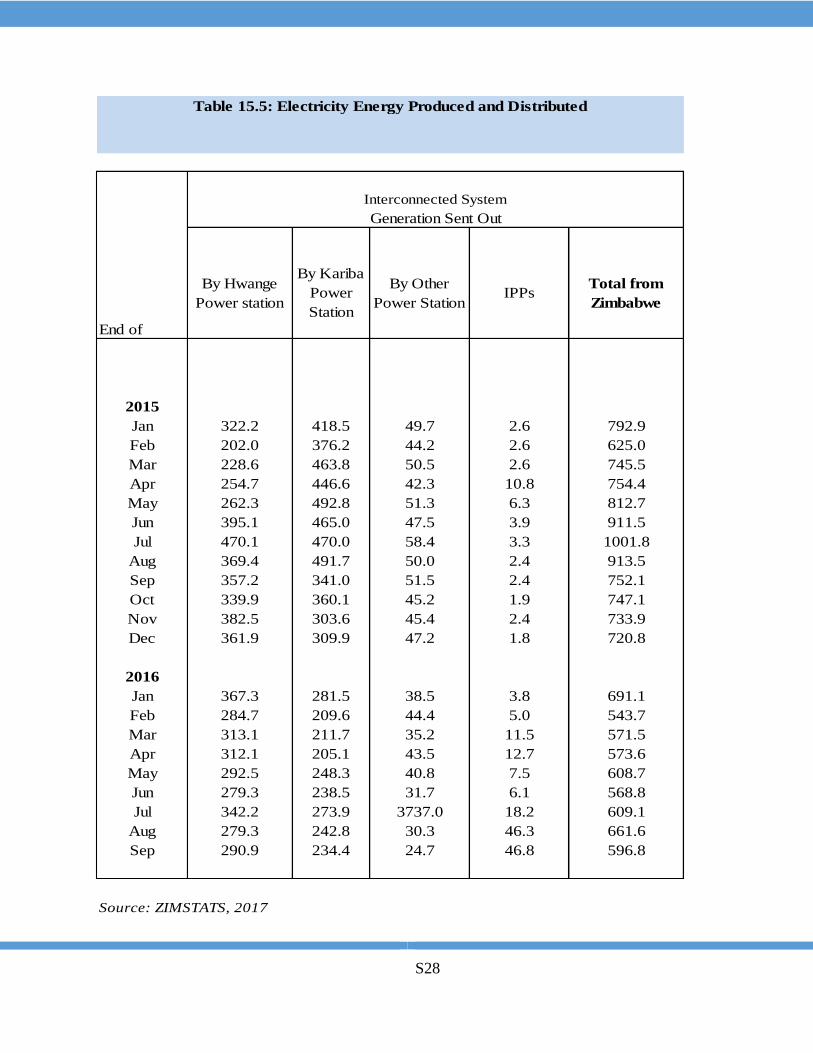
S28
End of
By Hwange
Power station
By Kariba
Power
Station
By Other
Power StationIPPs
Total from
Zimbabwe
2015
Jan 322.2 418.5 49.7 2.6 792.9
Feb 202.0 376.2 44.2 2.6 625.0
Mar 228.6 463.8 50.5 2.6 745.5
Apr 254.7 446.6 42.3 10.8 754.4
May 262.3 492.8 51.3 6.3 812.7
Jun 395.1 465.0 47.5 3.9 911.5
Jul 470.1 470.0 58.4 3.3 1001.8
Aug 369.4 491.7 50.0 2.4 913.5
Sep 357.2 341.0 51.5 2.4 752.1
Oct 339.9 360.1 45.2 1.9 747.1
Nov 382.5 303.6 45.4 2.4 733.9
Dec 361.9 309.9 47.2 1.8 720.8
2016
Jan 367.3 281.5 38.5 3.8 691.1
Feb 284.7 209.6 44.4 5.0 543.7
Mar 313.1 211.7 35.2 11.5 571.5
Apr 312.1 205.1 43.5 12.7 573.6
May 292.5 248.3 40.8 7.5 608.7
Jun 279.3 238.5 31.7 6.1 568.8
Jul 342.2 273.9 3737.0 18.2 609.1
Aug 279.3 242.8 30.3 46.3 661.6
Sep 290.9 234.4 24.7 46.8 596.8
Source: ZIMSTATS, 2017
Table 15.5: Electricity Energy Produced and Distributed
Interconnected System
Generation Sent Out
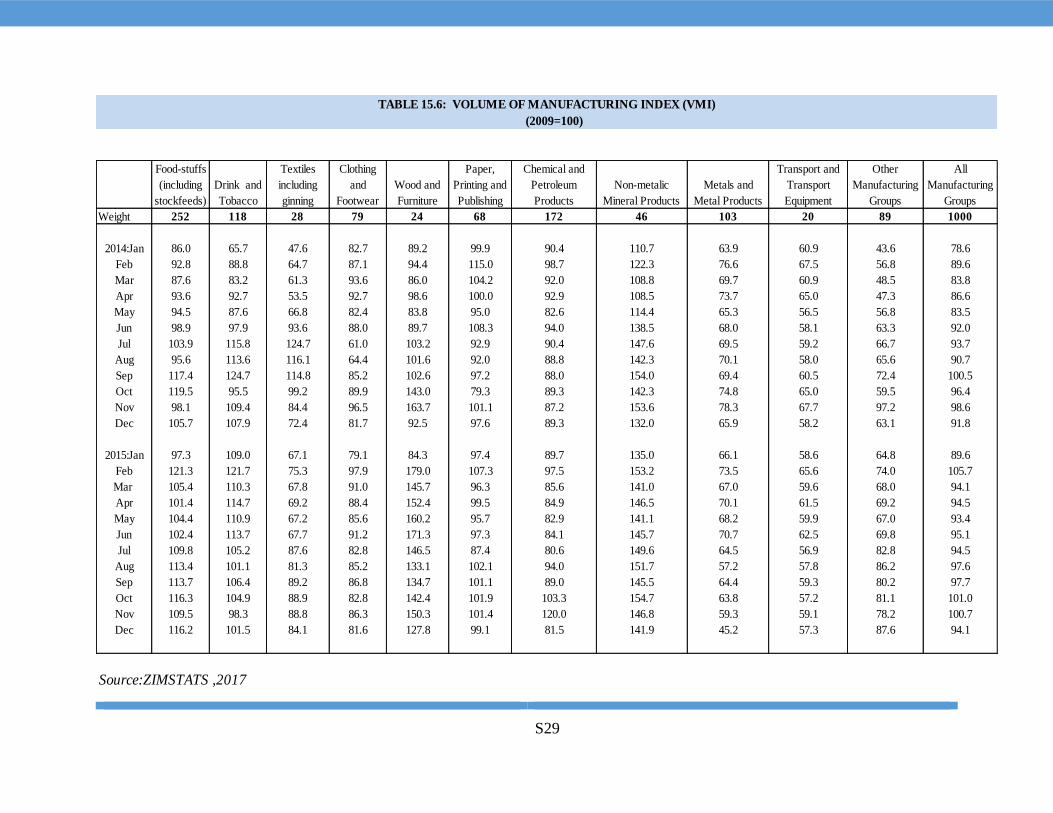
S29
(2009=100)
Food-stuffs
(including
stockfeeds)
Drink and
Tobacco
Textiles
including
ginning
Clothing
and
Footwear
Wood and
Furniture
Paper,
Printing and
Publishing
Chemical and
Petroleum
Products
Non-metalic
Mineral Products
Metals and
Metal Products
Transport and
Transport
Equipment
Other
Manufacturing
Groups
All
Manufacturing
Groups
Weight 252 118 28 79 24 68 172 46 103 20 89 1000
2014:Jan 86.0 65.7 47.6 82.7 89.2 99.9 90.4 110.7 63.9 60.9 43.6 78.6
Feb 92.8 88.8 64.7 87.1 94.4 115.0 98.7 122.3 76.6 67.5 56.8 89.6
Mar 87.6 83.2 61.3 93.6 86.0 104.2 92.0 108.8 69.7 60.9 48.5 83.8
Apr 93.6 92.7 53.5 92.7 98.6 100.0 92.9 108.5 73.7 65.0 47.3 86.6
May 94.5 87.6 66.8 82.4 83.8 95.0 82.6 114.4 65.3 56.5 56.8 83.5
Jun 98.9 97.9 93.6 88.0 89.7 108.3 94.0 138.5 68.0 58.1 63.3 92.0
Jul 103.9 115.8 124.7 61.0 103.2 92.9 90.4 147.6 69.5 59.2 66.7 93.7
Aug 95.6 113.6 116.1 64.4 101.6 92.0 88.8 142.3 70.1 58.0 65.6 90.7
Sep 117.4 124.7 114.8 85.2 102.6 97.2 88.0 154.0 69.4 60.5 72.4 100.5
Oct 119.5 95.5 99.2 89.9 143.0 79.3 89.3 142.3 74.8 65.0 59.5 96.4
Nov 98.1 109.4 84.4 96.5 163.7 101.1 87.2 153.6 78.3 67.7 97.2 98.6
Dec 105.7 107.9 72.4 81.7 92.5 97.6 89.3 132.0 65.9 58.2 63.1 91.8
2015:Jan 97.3 109.0 67.1 79.1 84.3 97.4 89.7 135.0 66.1 58.6 64.8 89.6
Feb 121.3 121.7 75.3 97.9 179.0 107.3 97.5 153.2 73.5 65.6 74.0 105.7
Mar 105.4 110.3 67.8 91.0 145.7 96.3 85.6 141.0 67.0 59.6 68.0 94.1
Apr 101.4 114.7 69.2 88.4 152.4 99.5 84.9 146.5 70.1 61.5 69.2 94.5
May 104.4 110.9 67.2 85.6 160.2 95.7 82.9 141.1 68.2 59.9 67.0 93.4
Jun 102.4 113.7 67.7 91.2 171.3 97.3 84.1 145.7 70.7 62.5 69.8 95.1
Jul 109.8 105.2 87.6 82.8 146.5 87.4 80.6 149.6 64.5 56.9 82.8 94.5
Aug 113.4 101.1 81.3 85.2 133.1 102.1 94.0 151.7 57.2 57.8 86.2 97.6
Sep 113.7 106.4 89.2 86.8 134.7 101.1 89.0 145.5 64.4 59.3 80.2 97.7
Oct 116.3 104.9 88.9 82.8 142.4 101.9 103.3 154.7 63.8 57.2 81.1 101.0
Nov 109.5 98.3 88.8 86.3 150.3 101.4 120.0 146.8 59.3 59.1 78.2 100.7
Dec 116.2 101.5 84.1 81.6 127.8 99.1 81.5 141.9 45.2 57.3 87.6 94.1
Source:ZIMSTATS ,2017
TABLE 15.6: VOLUME OF MANUFACTURING INDEX (VMI)